Salida, CO Map & Demographics
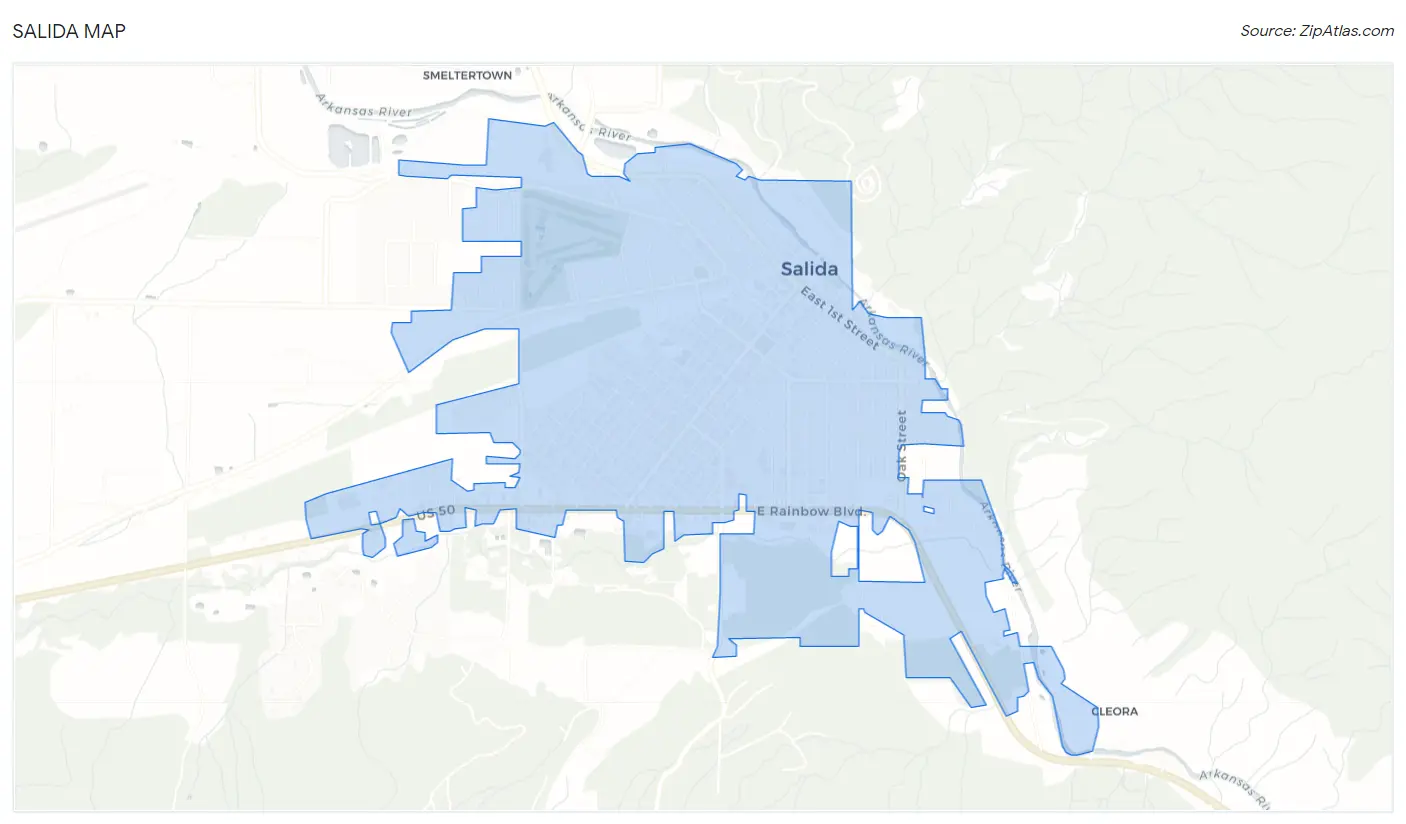
Salida Map
Salida Overview
$38,081
PER CAPITA INCOME
$67,625
AVG FAMILY INCOME
$63,775
AVG HOUSEHOLD INCOME
13.7%
WAGE / INCOME GAP [ % ]
86.3¢/ $1
WAGE / INCOME GAP [ $ ]
0.47
INEQUALITY / GINI INDEX
5,697
TOTAL POPULATION
2,623
MALE POPULATION
3,074
FEMALE POPULATION
85.33
MALES / 100 FEMALES
117.19
FEMALES / 100 MALES
44.3
MEDIAN AGE
2.5
AVG FAMILY SIZE
2.0
AVG HOUSEHOLD SIZE
2,931
LABOR FORCE [ PEOPLE ]
61.3%
PERCENT IN LABOR FORCE
3.5%
UNEMPLOYMENT RATE
Salida Zip Codes
Salida Area Codes
Income in Salida
Income Overview in Salida
Per Capita Income in Salida is $38,081, while median incomes of families and households are $67,625 and $63,775 respectively.
| Characteristic | Number | Measure |
| Per Capita Income | 5,697 | $38,081 |
| Median Family Income | 1,609 | $67,625 |
| Mean Family Income | 1,609 | $97,762 |
| Median Household Income | 2,770 | $63,775 |
| Mean Household Income | 2,770 | $84,018 |
| Income Deficit | 1,609 | $0 |
| Wage / Income Gap (%) | 5,697 | 13.67% |
| Wage / Income Gap ($) | 5,697 | 86.33¢ per $1 |
| Gini / Inequality Index | 5,697 | 0.47 |
Earnings by Sex in Salida
Average Earnings in Salida are $36,895, $40,888 for men and $35,299 for women, a difference of 13.7%.
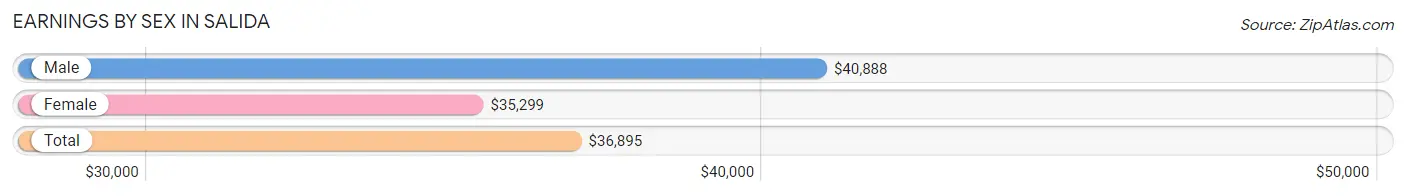
| Sex | Number | Average Earnings |
| Male | 1,382 (45.0%) | $40,888 |
| Female | 1,692 (55.0%) | $35,299 |
| Total | 3,074 (100.0%) | $36,895 |
Earnings by Sex by Income Bracket in Salida
The most common earnings brackets in Salida are $55,000 to $64,999 for men (203 | 14.7%) and $7,500 to $9,999 for women (312 | 18.4%).
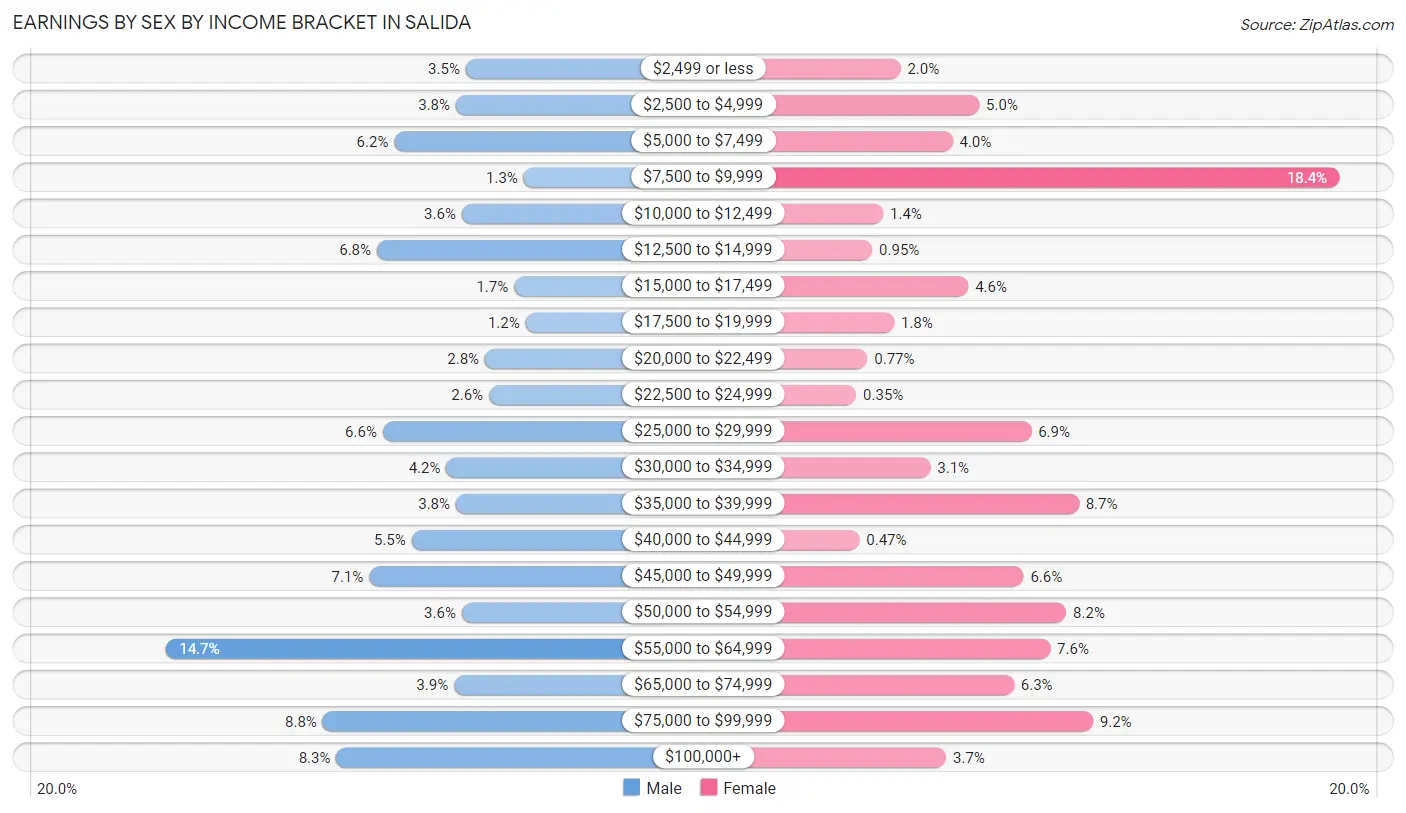
| Income | Male | Female |
| $2,499 or less | 48 (3.5%) | 34 (2.0%) |
| $2,500 to $4,999 | 53 (3.8%) | 84 (5.0%) |
| $5,000 to $7,499 | 85 (6.1%) | 67 (4.0%) |
| $7,500 to $9,999 | 18 (1.3%) | 312 (18.4%) |
| $10,000 to $12,499 | 50 (3.6%) | 23 (1.4%) |
| $12,500 to $14,999 | 94 (6.8%) | 16 (0.9%) |
| $15,000 to $17,499 | 23 (1.7%) | 77 (4.5%) |
| $17,500 to $19,999 | 17 (1.2%) | 30 (1.8%) |
| $20,000 to $22,499 | 38 (2.8%) | 13 (0.8%) |
| $22,500 to $24,999 | 36 (2.6%) | 6 (0.4%) |
| $25,000 to $29,999 | 91 (6.6%) | 117 (6.9%) |
| $30,000 to $34,999 | 58 (4.2%) | 53 (3.1%) |
| $35,000 to $39,999 | 53 (3.8%) | 147 (8.7%) |
| $40,000 to $44,999 | 76 (5.5%) | 8 (0.5%) |
| $45,000 to $49,999 | 98 (7.1%) | 112 (6.6%) |
| $50,000 to $54,999 | 50 (3.6%) | 139 (8.2%) |
| $55,000 to $64,999 | 203 (14.7%) | 129 (7.6%) |
| $65,000 to $74,999 | 54 (3.9%) | 106 (6.3%) |
| $75,000 to $99,999 | 122 (8.8%) | 156 (9.2%) |
| $100,000+ | 115 (8.3%) | 63 (3.7%) |
| Total | 1,382 (100.0%) | 1,692 (100.0%) |
Earnings by Sex by Educational Attainment in Salida
Average earnings in Salida are $47,988 for men and $33,511 for women, a difference of 30.2%. Men with an educational attainment of graduate degree enjoy the highest average annual earnings of $55,556, while those with college or associate's degree education earn the least with $42,292. Women with an educational attainment of bachelor's degree earn the most with the average annual earnings of $56,250, while those with high school diploma education have the smallest earnings of $34,338.
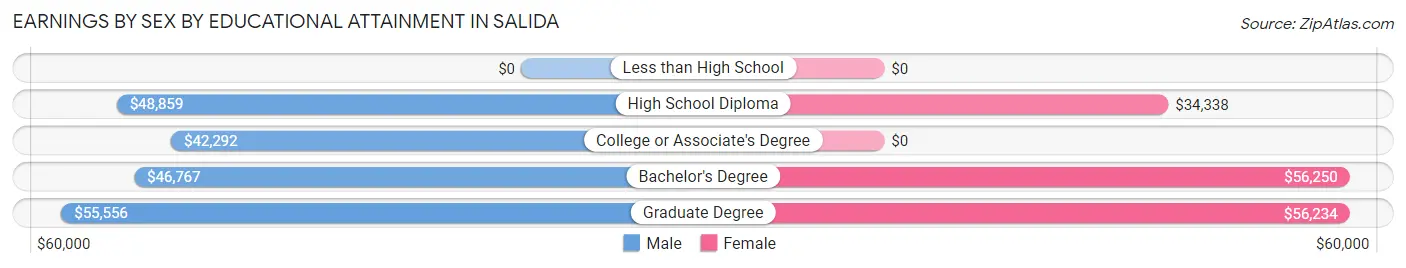
| Educational Attainment | Male Income | Female Income |
| Less than High School | - | - |
| High School Diploma | $48,859 | $34,338 |
| College or Associate's Degree | $42,292 | $0 |
| Bachelor's Degree | $46,767 | $56,250 |
| Graduate Degree | $55,556 | $56,234 |
| Total | $47,988 | $33,511 |
Family Income in Salida
Family Income Brackets in Salida
According to the Salida family income data, there are 343 families falling into the $100,000 to $149,999 income range, which is the most common income bracket and makes up 21.3% of all families. Conversely, the less than $10,000 income bracket is the least frequent group with only 31 families (1.9%) belonging to this category.
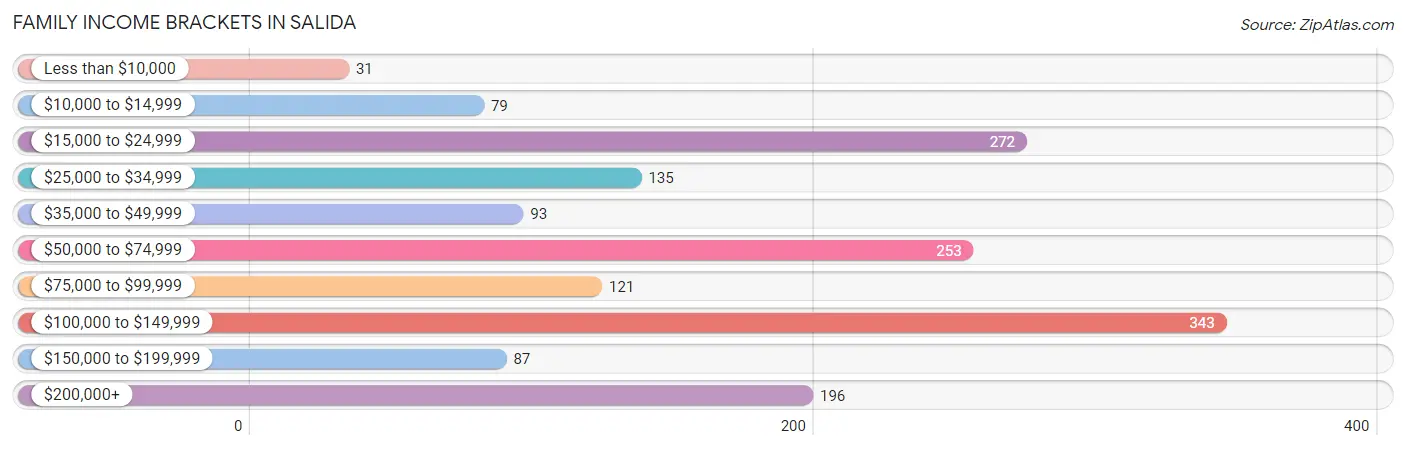
| Income Bracket | # Families | % Families |
| Less than $10,000 | 31 | 1.9% |
| $10,000 to $14,999 | 79 | 4.9% |
| $15,000 to $24,999 | 272 | 16.9% |
| $25,000 to $34,999 | 135 | 8.4% |
| $35,000 to $49,999 | 93 | 5.8% |
| $50,000 to $74,999 | 253 | 15.7% |
| $75,000 to $99,999 | 121 | 7.5% |
| $100,000 to $149,999 | 343 | 21.3% |
| $150,000 to $199,999 | 87 | 5.4% |
| $200,000+ | 196 | 12.2% |
Family Income by Famaliy Size in Salida
4-person families (220 | 13.7%) account for the highest median family income in Salida with $99,545 per family, while 2-person families (763 | 47.4%) have the highest median income of $44,792 per family member.
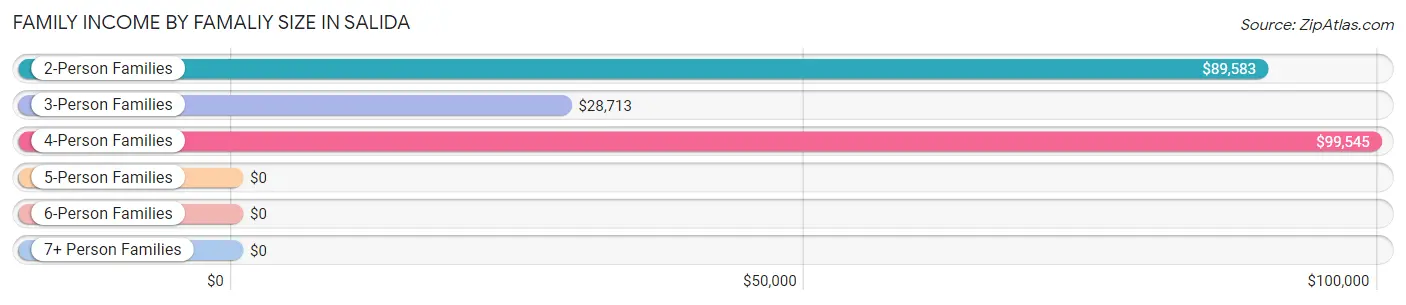
| Income Bracket | # Families | Median Income |
| 2-Person Families | 763 (47.4%) | $89,583 |
| 3-Person Families | 565 (35.1%) | $28,713 |
| 4-Person Families | 220 (13.7%) | $99,545 |
| 5-Person Families | 61 (3.8%) | $0 |
| 6-Person Families | 0 (0.0%) | $0 |
| 7+ Person Families | 0 (0.0%) | $0 |
| Total | 1,609 (100.0%) | $67,625 |
Family Income by Number of Earners in Salida
The median family income in Salida is $67,625, with families comprising 3+ earners (145) having the highest median family income of $220,625, while families with 1 earner (425) have the lowest median family income of $41,729, accounting for 9.0% and 26.4% of families, respectively.
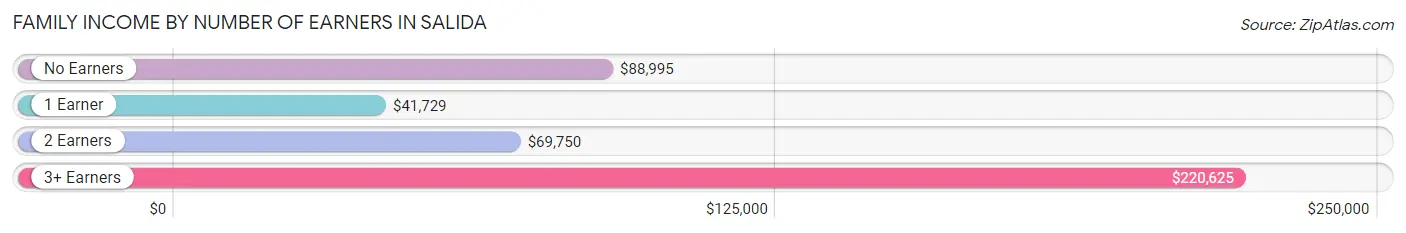
| Number of Earners | # Families | Median Income |
| No Earners | 233 (14.5%) | $88,995 |
| 1 Earner | 425 (26.4%) | $41,729 |
| 2 Earners | 806 (50.1%) | $69,750 |
| 3+ Earners | 145 (9.0%) | $220,625 |
| Total | 1,609 (100.0%) | $67,625 |
Household Income in Salida
Household Income Brackets in Salida
With 604 households falling in the category, the $50,000 to $74,999 income range is the most frequent in Salida, accounting for 21.8% of all households. In contrast, only 136 households (4.9%) fall into the $10,000 to $14,999 income bracket, making it the least populous group.
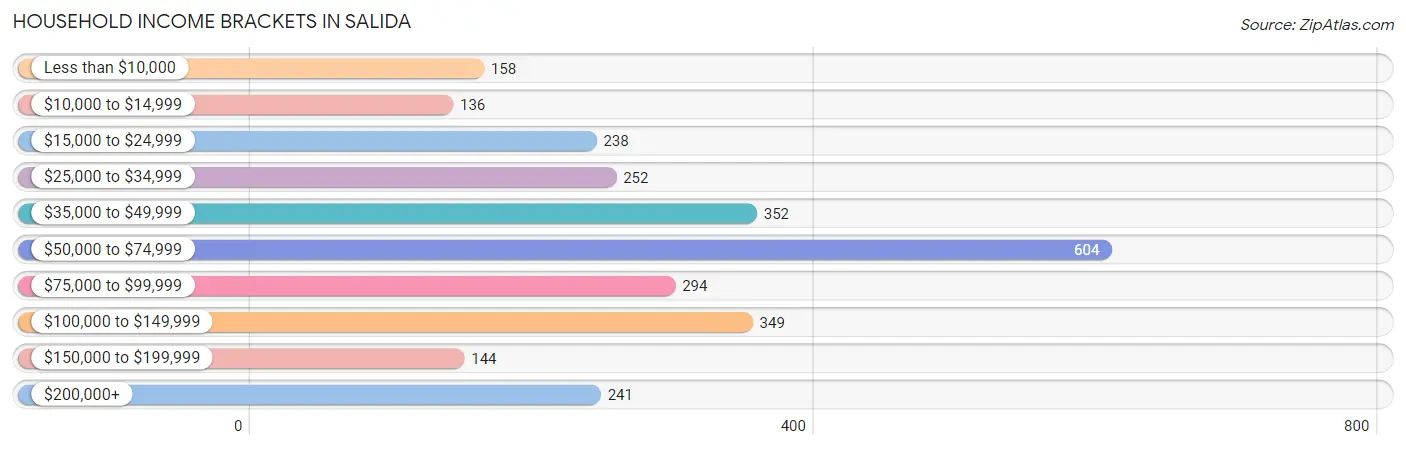
| Income Bracket | # Households | % Households |
| Less than $10,000 | 158 | 5.7% |
| $10,000 to $14,999 | 136 | 4.9% |
| $15,000 to $24,999 | 238 | 8.6% |
| $25,000 to $34,999 | 252 | 9.1% |
| $35,000 to $49,999 | 352 | 12.7% |
| $50,000 to $74,999 | 604 | 21.8% |
| $75,000 to $99,999 | 294 | 10.6% |
| $100,000 to $149,999 | 349 | 12.6% |
| $150,000 to $199,999 | 144 | 5.2% |
| $200,000+ | 241 | 8.7% |
Household Income by Householder Age in Salida
The median household income in Salida is $63,775, with the highest median household income of $69,144 found in the 25 to 44 years age bracket for the primary householder. A total of 870 households (31.4%) fall into this category. Meanwhile, the 15 to 24 years age bracket for the primary householder has the lowest median household income of $36,485, with 101 households (3.6%) in this group.
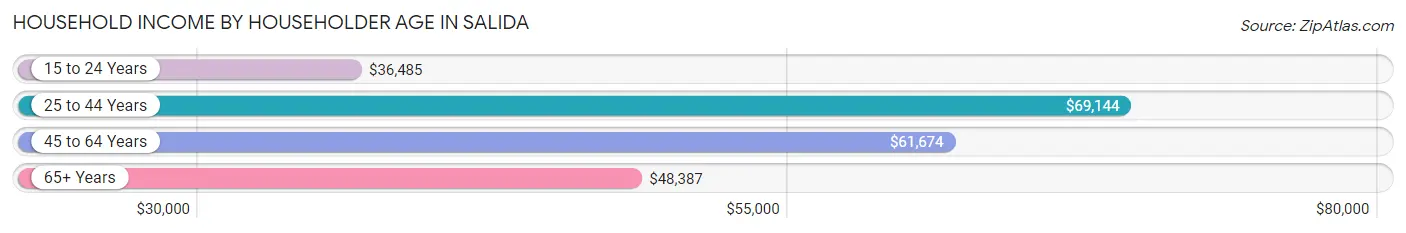
| Income Bracket | # Households | Median Income |
| 15 to 24 Years | 101 (3.6%) | $36,485 |
| 25 to 44 Years | 870 (31.4%) | $69,144 |
| 45 to 64 Years | 839 (30.3%) | $61,674 |
| 65+ Years | 960 (34.7%) | $48,387 |
| Total | 2,770 (100.0%) | $63,775 |
Poverty in Salida
Income Below Poverty by Sex and Age in Salida
With 18.8% poverty level for males and 19.5% for females among the residents of Salida, under 5 year old males and under 5 year old females are the most vulnerable to poverty, with 137 males (49.8%) and 62 females (76.5%) in their respective age groups living below the poverty level.
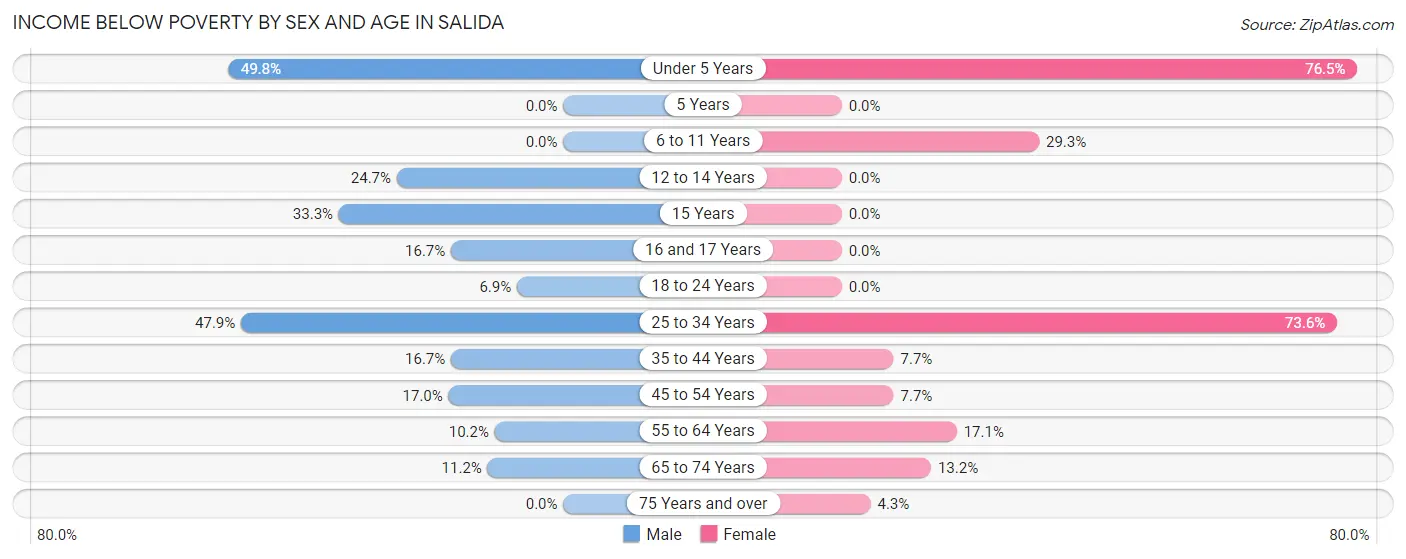
| Age Bracket | Male | Female |
| Under 5 Years | 137 (49.8%) | 62 (76.5%) |
| 5 Years | 0 (0.0%) | 0 (0.0%) |
| 6 to 11 Years | 0 (0.0%) | 29 (29.3%) |
| 12 to 14 Years | 22 (24.7%) | 0 (0.0%) |
| 15 Years | 8 (33.3%) | 0 (0.0%) |
| 16 and 17 Years | 16 (16.7%) | 0 (0.0%) |
| 18 to 24 Years | 11 (6.9%) | 0 (0.0%) |
| 25 to 34 Years | 89 (47.8%) | 292 (73.6%) |
| 35 to 44 Years | 57 (16.7%) | 42 (7.7%) |
| 45 to 54 Years | 68 (17.0%) | 23 (7.7%) |
| 55 to 64 Years | 23 (10.2%) | 78 (17.1%) |
| 65 to 74 Years | 38 (11.2%) | 49 (13.2%) |
| 75 Years and over | 0 (0.0%) | 18 (4.3%) |
| Total | 469 (18.8%) | 593 (19.5%) |
Income Above Poverty by Sex and Age in Salida
According to the poverty statistics in Salida, males aged 5 years and females aged 12 to 14 years are the age groups that are most secure financially, with 100.0% of males and 100.0% of females in these age groups living above the poverty line.
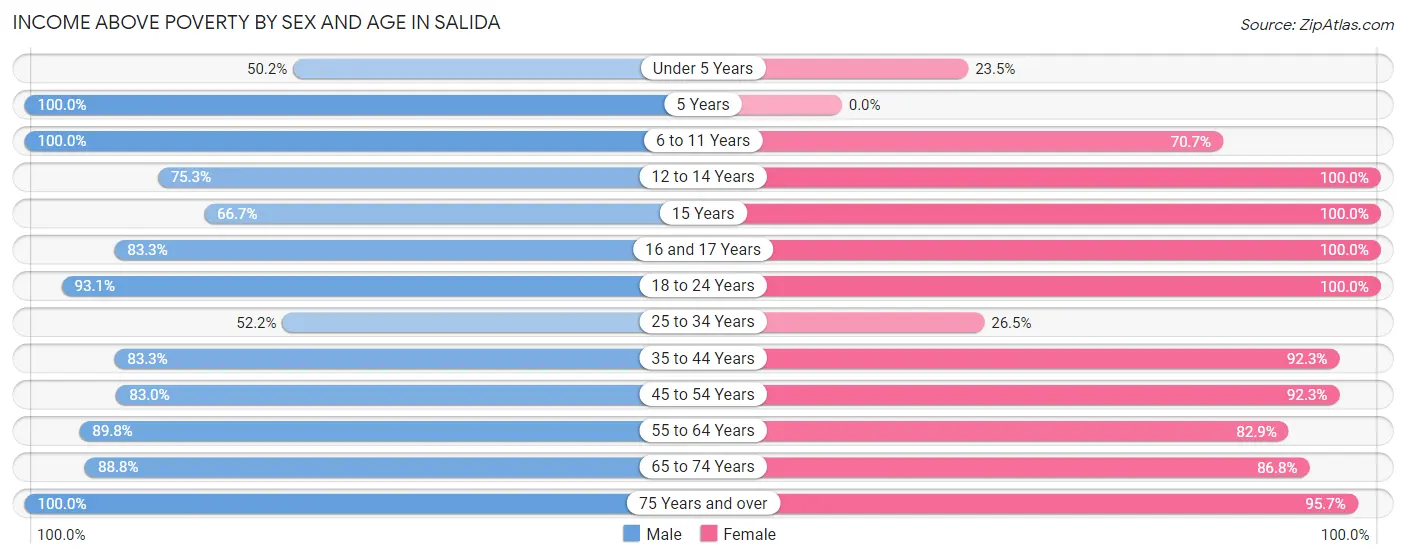
| Age Bracket | Male | Female |
| Under 5 Years | 138 (50.2%) | 19 (23.5%) |
| 5 Years | 29 (100.0%) | 0 (0.0%) |
| 6 to 11 Years | 156 (100.0%) | 70 (70.7%) |
| 12 to 14 Years | 67 (75.3%) | 141 (100.0%) |
| 15 Years | 16 (66.7%) | 21 (100.0%) |
| 16 and 17 Years | 80 (83.3%) | 65 (100.0%) |
| 18 to 24 Years | 149 (93.1%) | 143 (100.0%) |
| 25 to 34 Years | 97 (52.1%) | 105 (26.5%) |
| 35 to 44 Years | 285 (83.3%) | 504 (92.3%) |
| 45 to 54 Years | 331 (83.0%) | 276 (92.3%) |
| 55 to 64 Years | 203 (89.8%) | 379 (82.9%) |
| 65 to 74 Years | 300 (88.8%) | 321 (86.8%) |
| 75 Years and over | 180 (100.0%) | 404 (95.7%) |
| Total | 2,031 (81.2%) | 2,448 (80.5%) |
Income Below Poverty Among Married-Couple Families in Salida
The poverty statistics for married-couple families in Salida show that 5.7% or 62 of the total 1,084 families live below the poverty line. Families with 1 or 2 children have the highest poverty rate of 14.1%, comprising of 48 families. On the other hand, families with no children have the lowest poverty rate of 1.3%, which includes 9 families.
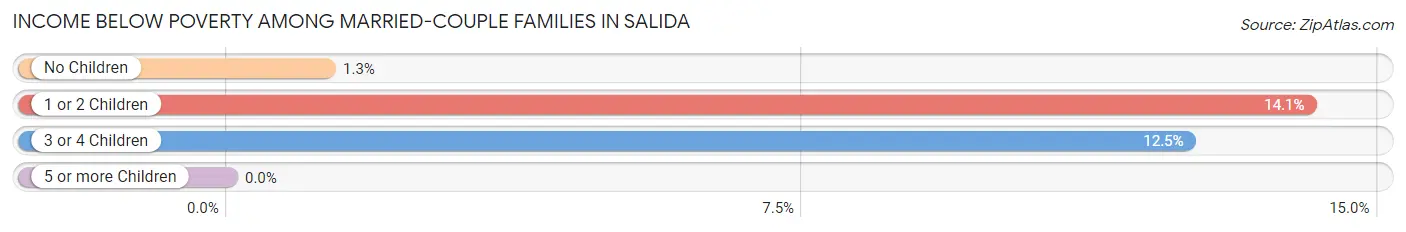
| Children | Above Poverty | Below Poverty |
| No Children | 694 (98.7%) | 9 (1.3%) |
| 1 or 2 Children | 293 (85.9%) | 48 (14.1%) |
| 3 or 4 Children | 35 (87.5%) | 5 (12.5%) |
| 5 or more Children | 0 (0.0%) | 0 (0.0%) |
| Total | 1,022 (94.3%) | 62 (5.7%) |
Income Below Poverty Among Single-Parent Households in Salida
According to the poverty data in Salida, 32.4% or 45 single-father households and 67.4% or 260 single-mother households are living below the poverty line. Among single-father households, those with 1 or 2 children have the highest poverty rate, with 45 households (35.7%) experiencing poverty. Likewise, among single-mother households, those with 1 or 2 children have the highest poverty rate, with 260 households (78.3%) falling below the poverty line.
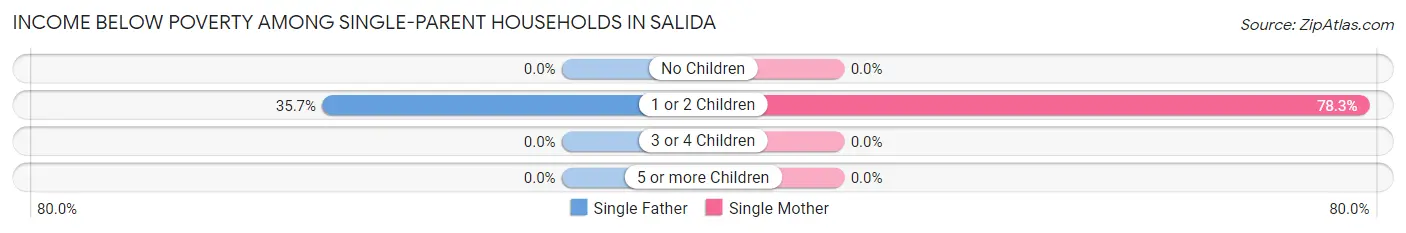
| Children | Single Father | Single Mother |
| No Children | 0 (0.0%) | 0 (0.0%) |
| 1 or 2 Children | 45 (35.7%) | 260 (78.3%) |
| 3 or 4 Children | 0 (0.0%) | 0 (0.0%) |
| 5 or more Children | 0 (0.0%) | 0 (0.0%) |
| Total | 45 (32.4%) | 260 (67.4%) |
Income Below Poverty Among Married-Couple vs Single-Parent Households in Salida
The poverty data for Salida shows that 62 of the married-couple family households (5.7%) and 305 of the single-parent households (58.1%) are living below the poverty level. Within the married-couple family households, those with 1 or 2 children have the highest poverty rate, with 48 households (14.1%) falling below the poverty line. Among the single-parent households, those with 1 or 2 children have the highest poverty rate, with 305 household (66.6%) living below poverty.
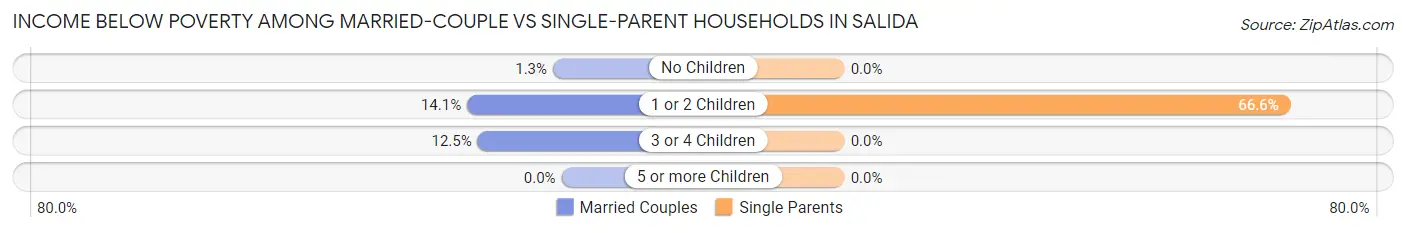
| Children | Married-Couple Families | Single-Parent Households |
| No Children | 9 (1.3%) | 0 (0.0%) |
| 1 or 2 Children | 48 (14.1%) | 305 (66.6%) |
| 3 or 4 Children | 5 (12.5%) | 0 (0.0%) |
| 5 or more Children | 0 (0.0%) | 0 (0.0%) |
| Total | 62 (5.7%) | 305 (58.1%) |
Race in Salida
The most populous races in Salida are White / Caucasian (4,915 | 86.3%), Hispanic or Latino (834 | 14.6%), and Two or more Races (506 | 8.9%).
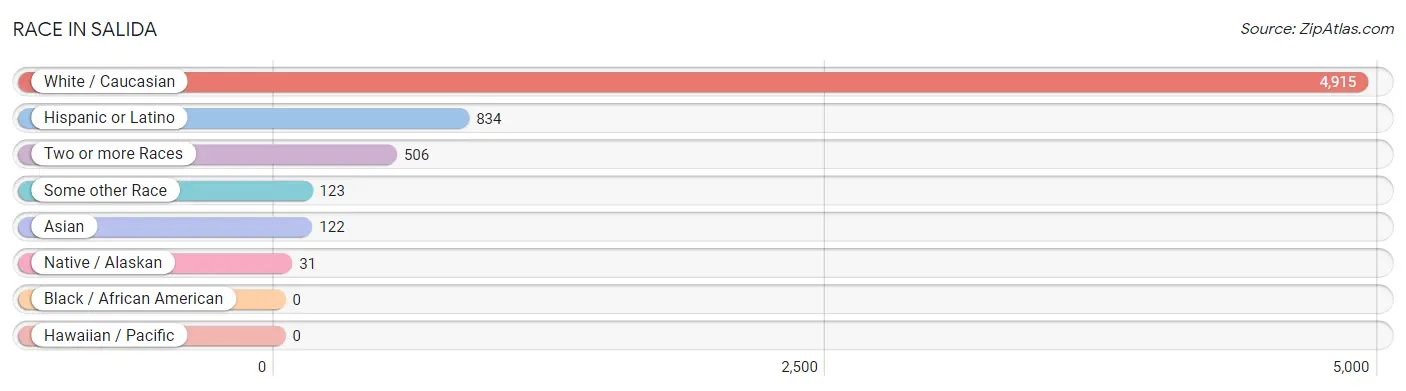
| Race | # Population | % Population |
| Asian | 122 | 2.1% |
| Black / African American | 0 | 0.0% |
| Hawaiian / Pacific | 0 | 0.0% |
| Hispanic or Latino | 834 | 14.6% |
| Native / Alaskan | 31 | 0.5% |
| White / Caucasian | 4,915 | 86.3% |
| Two or more Races | 506 | 8.9% |
| Some other Race | 123 | 2.2% |
| Total | 5,697 | 100.0% |
Ancestry in Salida
The most populous ancestries reported in Salida are German (1,002 | 17.6%), English (944 | 16.6%), Mexican (683 | 12.0%), Irish (628 | 11.0%), and Italian (594 | 10.4%), together accounting for 67.6% of all Salida residents.
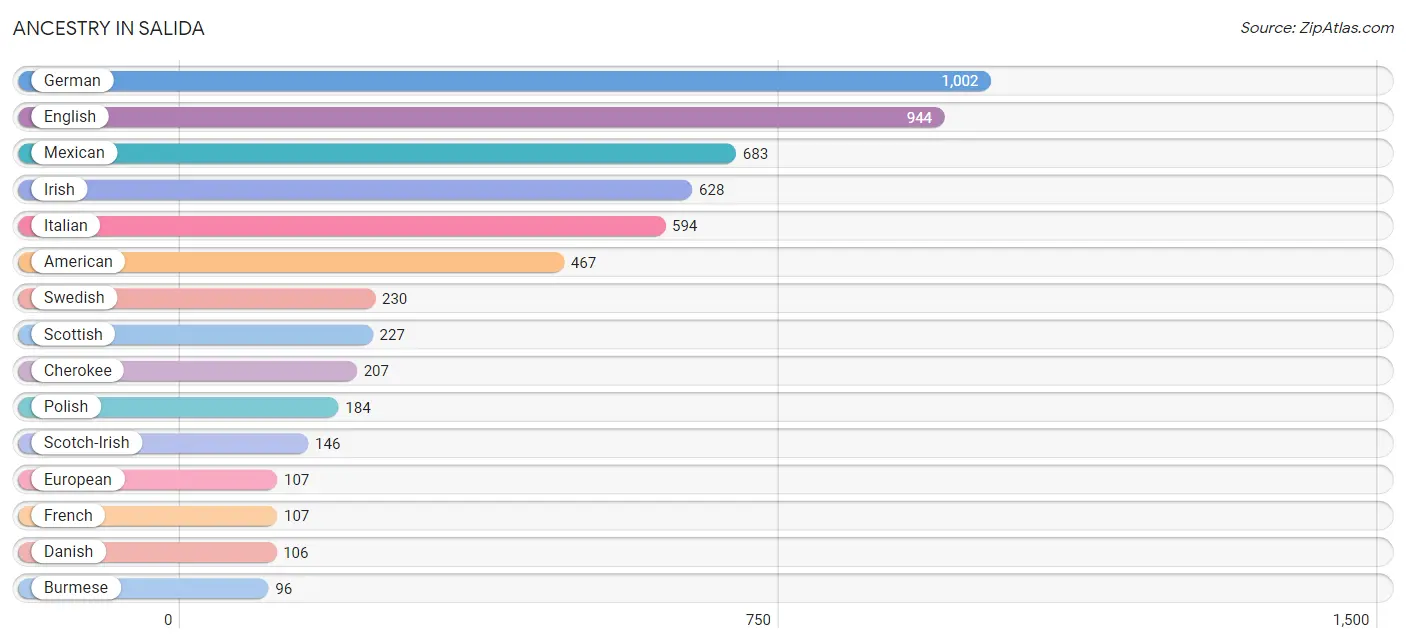
| Ancestry | # Population | % Population |
| American | 467 | 8.2% |
| Arab | 30 | 0.5% |
| British | 22 | 0.4% |
| Burmese | 96 | 1.7% |
| Canadian | 14 | 0.3% |
| Cherokee | 207 | 3.6% |
| Chickasaw | 32 | 0.6% |
| Creek | 87 | 1.5% |
| Croatian | 9 | 0.2% |
| Cuban | 64 | 1.1% |
| Danish | 106 | 1.9% |
| Dutch | 41 | 0.7% |
| Eastern European | 10 | 0.2% |
| English | 944 | 16.6% |
| European | 107 | 1.9% |
| Finnish | 10 | 0.2% |
| French | 107 | 1.9% |
| French American Indian | 8 | 0.1% |
| French Canadian | 7 | 0.1% |
| German | 1,002 | 17.6% |
| Greek | 9 | 0.2% |
| Hungarian | 21 | 0.4% |
| Indian (Asian) | 67 | 1.2% |
| Irish | 628 | 11.0% |
| Italian | 594 | 10.4% |
| Lebanese | 30 | 0.5% |
| Lithuanian | 10 | 0.2% |
| Mexican | 683 | 12.0% |
| Native Hawaiian | 45 | 0.8% |
| Navajo | 31 | 0.5% |
| Northern European | 44 | 0.8% |
| Norwegian | 95 | 1.7% |
| Polish | 184 | 3.2% |
| Romanian | 16 | 0.3% |
| Russian | 60 | 1.1% |
| Scandinavian | 28 | 0.5% |
| Scotch-Irish | 146 | 2.6% |
| Scottish | 227 | 4.0% |
| Serbian | 11 | 0.2% |
| Slovak | 24 | 0.4% |
| Spaniard | 50 | 0.9% |
| Spanish | 7 | 0.1% |
| Sri Lankan | 14 | 0.3% |
| Swedish | 230 | 4.0% |
| Thai | 1 | 0.0% |
| Ukrainian | 42 | 0.7% |
| Welsh | 12 | 0.2% |
| Yugoslavian | 12 | 0.2% | View All 48 Rows |
Immigrants in Salida
The most numerous immigrant groups reported in Salida came from Asia (100 | 1.8%), Eastern Asia (94 | 1.7%), Korea (77 | 1.3%), Europe (66 | 1.2%), and Italy (32 | 0.6%), together accounting for 6.5% of all Salida residents.
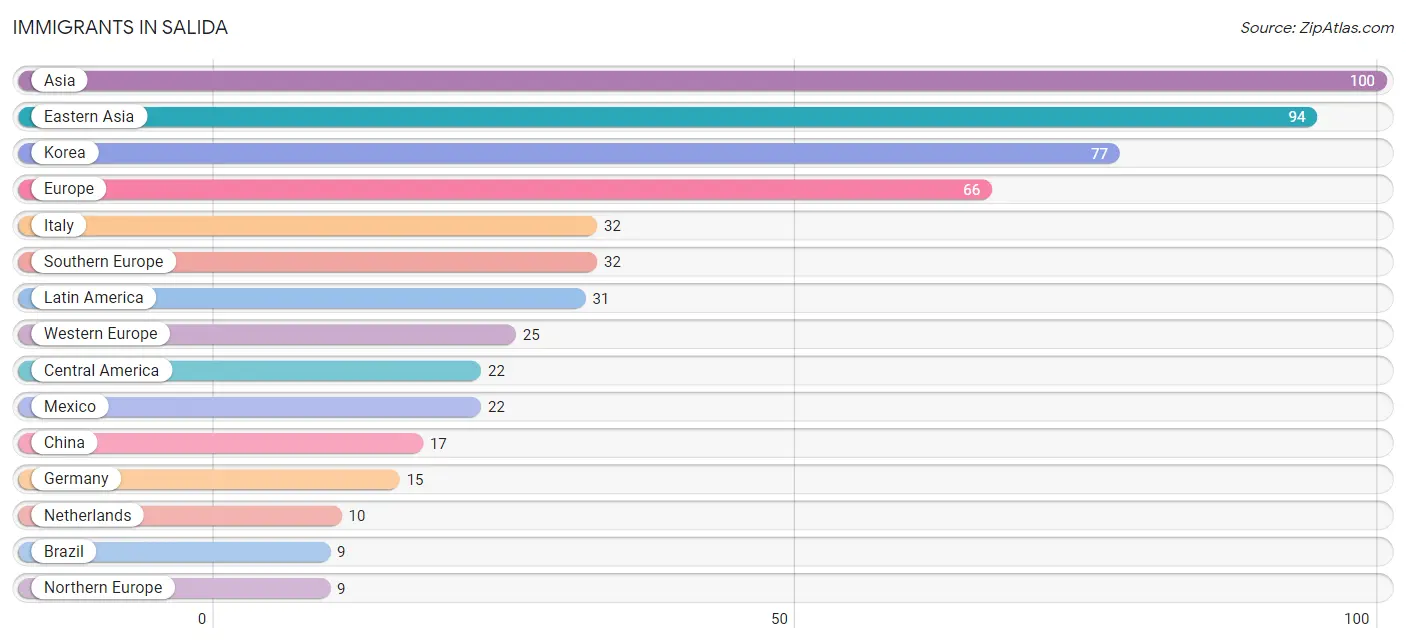
| Immigration Origin | # Population | % Population |
| Asia | 100 | 1.8% |
| Brazil | 9 | 0.2% |
| Central America | 22 | 0.4% |
| China | 17 | 0.3% |
| Eastern Asia | 94 | 1.7% |
| Europe | 66 | 1.2% |
| Germany | 15 | 0.3% |
| Italy | 32 | 0.6% |
| Korea | 77 | 1.3% |
| Latin America | 31 | 0.5% |
| Mexico | 22 | 0.4% |
| Netherlands | 10 | 0.2% |
| Northern Europe | 9 | 0.2% |
| South America | 9 | 0.2% |
| South Eastern Asia | 6 | 0.1% |
| Southern Europe | 32 | 0.6% |
| Sweden | 9 | 0.2% |
| Vietnam | 6 | 0.1% |
| Western Europe | 25 | 0.4% | View All 19 Rows |
Sex and Age in Salida
Sex and Age in Salida
The most populous age groups in Salida are Under 5 Years (275 | 10.5%) for men and 40 to 44 Years (287 | 9.3%) for women.
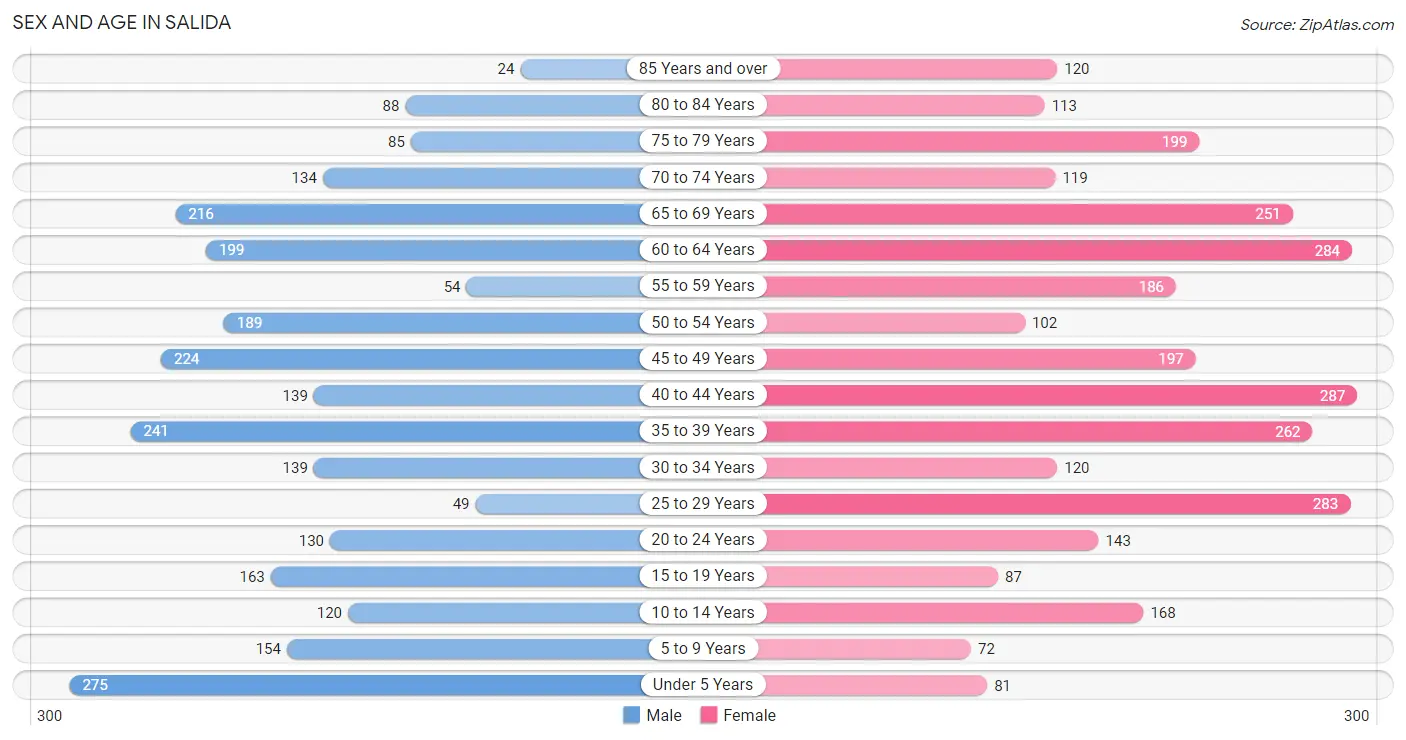
| Age Bracket | Male | Female |
| Under 5 Years | 275 (10.5%) | 81 (2.6%) |
| 5 to 9 Years | 154 (5.9%) | 72 (2.3%) |
| 10 to 14 Years | 120 (4.6%) | 168 (5.5%) |
| 15 to 19 Years | 163 (6.2%) | 87 (2.8%) |
| 20 to 24 Years | 130 (5.0%) | 143 (4.6%) |
| 25 to 29 Years | 49 (1.9%) | 283 (9.2%) |
| 30 to 34 Years | 139 (5.3%) | 120 (3.9%) |
| 35 to 39 Years | 241 (9.2%) | 262 (8.5%) |
| 40 to 44 Years | 139 (5.3%) | 287 (9.3%) |
| 45 to 49 Years | 224 (8.5%) | 197 (6.4%) |
| 50 to 54 Years | 189 (7.2%) | 102 (3.3%) |
| 55 to 59 Years | 54 (2.1%) | 186 (6.0%) |
| 60 to 64 Years | 199 (7.6%) | 284 (9.2%) |
| 65 to 69 Years | 216 (8.2%) | 251 (8.2%) |
| 70 to 74 Years | 134 (5.1%) | 119 (3.9%) |
| 75 to 79 Years | 85 (3.2%) | 199 (6.5%) |
| 80 to 84 Years | 88 (3.4%) | 113 (3.7%) |
| 85 Years and over | 24 (0.9%) | 120 (3.9%) |
| Total | 2,623 (100.0%) | 3,074 (100.0%) |
Families and Households in Salida
Median Family Size in Salida
The median family size in Salida is 2.52 persons per family, with married-couple families (1,084 | 67.4%) accounting for the largest median family size of 2.66 persons per family. On the other hand, single female/mother families (386 | 24.0%) represent the smallest median family size with 2.16 persons per family.
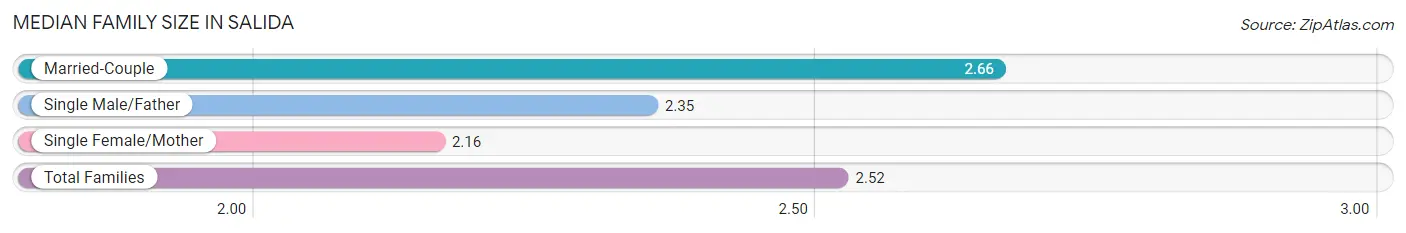
| Family Type | # Families | Family Size |
| Married-Couple | 1,084 (67.4%) | 2.66 |
| Single Male/Father | 139 (8.6%) | 2.35 |
| Single Female/Mother | 386 (24.0%) | 2.16 |
| Total Families | 1,609 (100.0%) | 2.52 |
Median Household Size in Salida
The median household size in Salida is 1.99 persons per household, with single male/father households (139 | 5.0%) accounting for the largest median household size of 2.73 persons per household. non-family households (1,161 | 41.9%) represent the smallest median household size with 1.20 persons per household.
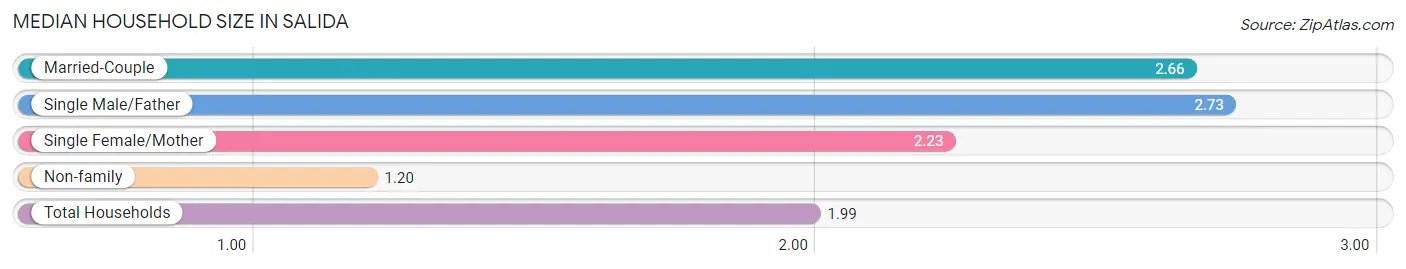
| Household Type | # Households | Household Size |
| Married-Couple | 1,084 (39.1%) | 2.66 |
| Single Male/Father | 139 (5.0%) | 2.73 |
| Single Female/Mother | 386 (13.9%) | 2.23 |
| Non-family | 1,161 (41.9%) | 1.20 |
| Total Households | 2,770 (100.0%) | 1.99 |
Household Size by Marriage Status in Salida
Out of a total of 2,770 households in Salida, 1,609 (58.1%) are family households, while 1,161 (41.9%) are nonfamily households. The most numerous type of family households are 2-person households, comprising 749, and the most common type of nonfamily households are 1-person households, comprising 945.
| Household Size | Family Households | Nonfamily Households |
| 1-Person Households | - | 945 (34.1%) |
| 2-Person Households | 749 (27.0%) | 204 (7.4%) |
| 3-Person Households | 325 (11.7%) | 0 (0.0%) |
| 4-Person Households | 474 (17.1%) | 12 (0.4%) |
| 5-Person Households | 61 (2.2%) | 0 (0.0%) |
| 6-Person Households | 0 (0.0%) | 0 (0.0%) |
| 7+ Person Households | 0 (0.0%) | 0 (0.0%) |
| Total | 1,609 (58.1%) | 1,161 (41.9%) |
Female Fertility in Salida
Fertility by Age in Salida
Average fertility rate in Salida is 19.0 births per 1,000 women. Women in the age bracket of 20 to 34 years have the highest fertility rate with 22.0 births per 1,000 women. Women in the age bracket of 35 to 50 years acount for 57.1% of all women with births.
| Age Bracket | Women with Births | Births / 1,000 Women |
| 15 to 19 years | 0 (0.0%) | 0.0 |
| 20 to 34 years | 12 (42.9%) | 22.0 |
| 35 to 50 years | 16 (57.1%) | 20.0 |
| Total | 28 (100.0%) | 19.0 |
Fertility by Age by Marriage Status in Salida
42.9% of women with births (28) in Salida are married. The highest percentage of unmarried women with births falls into 35 to 50 years age bracket with 100.0% of them unmarried at the time of birth, while the lowest percentage of unmarried women with births belong to 20 to 34 years age bracket with 0.0% of them unmarried.
| Age Bracket | Married | Unmarried |
| 15 to 19 years | 0 (0.0%) | 0 (0.0%) |
| 20 to 34 years | 12 (100.0%) | 0 (0.0%) |
| 35 to 50 years | 0 (0.0%) | 16 (100.0%) |
| Total | 12 (42.9%) | 16 (57.1%) |
Fertility by Education in Salida
| Educational Attainment | Women with Births | Births / 1,000 Women |
| Less than High School | 0 (0.0%) | 0.0 |
| High School Diploma | 16 (57.1%) | 46.0 |
| College or Associate's Degree | 0 (0.0%) | 0.0 |
| Bachelor's Degree | 12 (42.9%) | 50.0 |
| Graduate Degree | 0 (0.0%) | 0.0 |
| Total | 28 (100.0%) | 19.0 |
Fertility by Education by Marriage Status in Salida
57.1% of women with births in Salida are unmarried. Women with the educational attainment of bachelor's degree are most likely to be married with 100.0% of them married at childbirth, while women with the educational attainment of high school diploma are least likely to be married with 100.0% of them unmarried at childbirth.
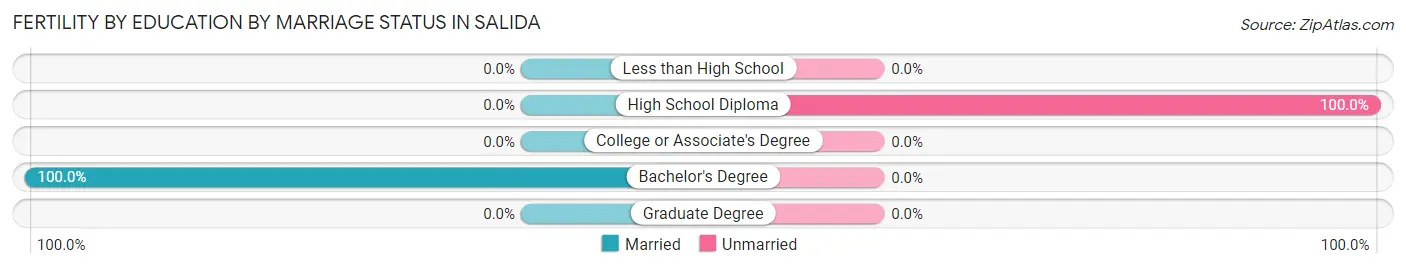
| Educational Attainment | Married | Unmarried |
| Less than High School | 0 (0.0%) | 0 (0.0%) |
| High School Diploma | 0 (0.0%) | 16 (100.0%) |
| College or Associate's Degree | 0 (0.0%) | 0 (0.0%) |
| Bachelor's Degree | 12 (100.0%) | 0 (0.0%) |
| Graduate Degree | 0 (0.0%) | 0 (0.0%) |
| Total | 12 (42.9%) | 16 (57.1%) |
Employment Characteristics in Salida
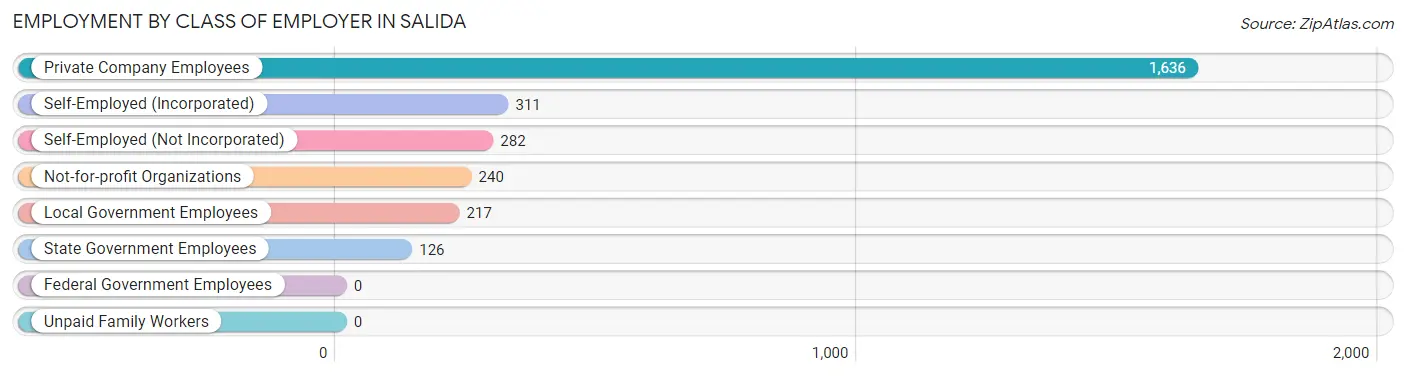
Employment by Class of Employer in Salida
Among the 2,812 employed individuals in Salida, private company employees (1,636 | 58.2%), self-employed (incorporated) (311 | 11.1%), and self-employed (not incorporated) (282 | 10.0%) make up the most common classes of employment.
| Employer Class | # Employees | % Employees |
| Private Company Employees | 1,636 | 58.2% |
| Self-Employed (Incorporated) | 311 | 11.1% |
| Self-Employed (Not Incorporated) | 282 | 10.0% |
| Not-for-profit Organizations | 240 | 8.5% |
| Local Government Employees | 217 | 7.7% |
| State Government Employees | 126 | 4.5% |
| Federal Government Employees | 0 | 0.0% |
| Unpaid Family Workers | 0 | 0.0% |
| Total | 2,812 | 100.0% |
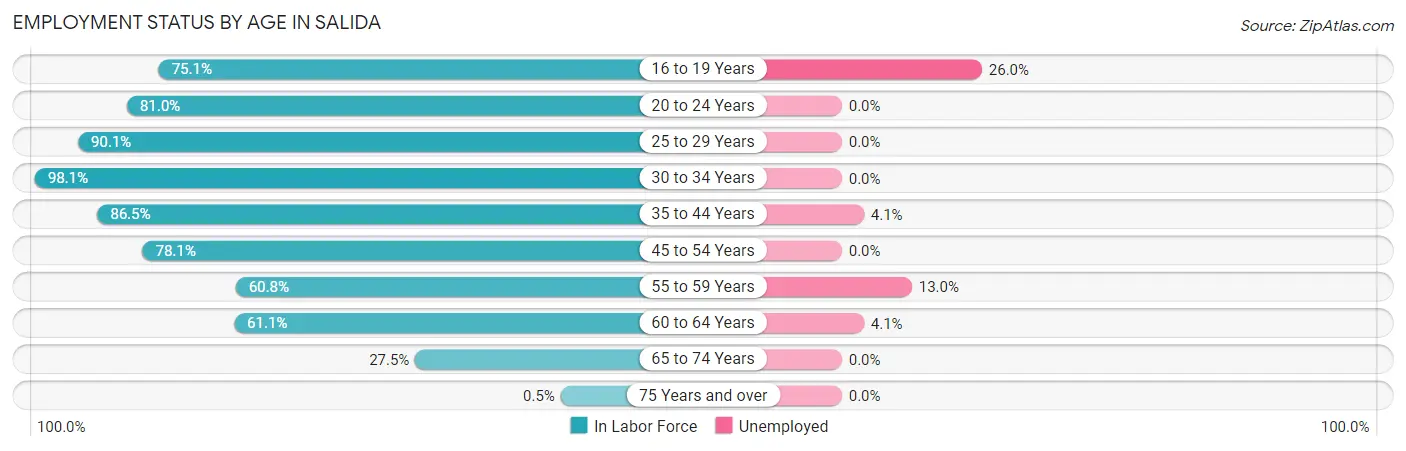
Employment Status by Age in Salida
According to the labor force statistics for Salida, out of the total population over 16 years of age (4,782), 61.3% or 2,931 individuals are in the labor force, with 3.5% or 103 of them unemployed. The age group with the highest labor force participation rate is 30 to 34 years, with 98.1% or 254 individuals in the labor force. Within the labor force, the 16 to 19 years age range has the highest percentage of unemployed individuals, with 26.0% or 40 of them being unemployed.
| Age Bracket | In Labor Force | Unemployed |
| 16 to 19 Years | 154 (75.1%) | 40 (26.0%) |
| 20 to 24 Years | 221 (81.0%) | 0 (0.0%) |
| 25 to 29 Years | 299 (90.1%) | 0 (0.0%) |
| 30 to 34 Years | 254 (98.1%) | 0 (0.0%) |
| 35 to 44 Years | 804 (86.5%) | 33 (4.1%) |
| 45 to 54 Years | 556 (78.1%) | 0 (0.0%) |
| 55 to 59 Years | 146 (60.8%) | 19 (13.0%) |
| 60 to 64 Years | 295 (61.1%) | 12 (4.1%) |
| 65 to 74 Years | 198 (27.5%) | 0 (0.0%) |
| 75 Years and over | 3 (0.5%) | 0 (0.0%) |
| Total | 2,931 (61.3%) | 103 (3.5%) |
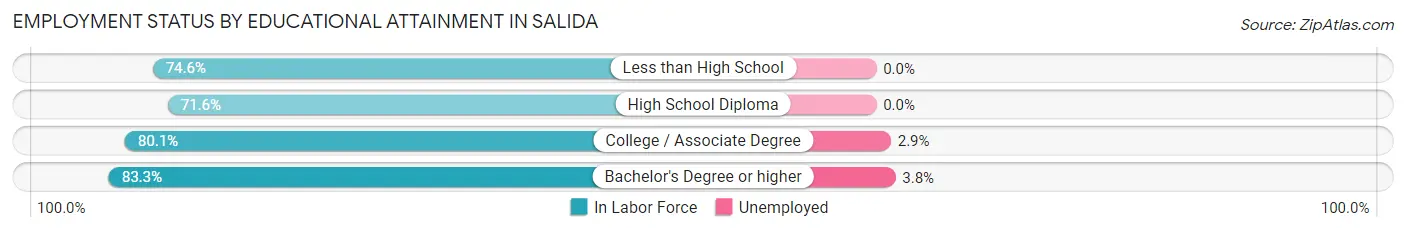
Employment Status by Educational Attainment in Salida
According to labor force statistics for Salida, 79.7% of individuals (2,355) out of the total population between 25 and 64 years of age (2,955) are in the labor force, with 2.7% or 64 of them being unemployed. The group with the highest labor force participation rate are those with the educational attainment of bachelor's degree or higher, with 83.3% or 1,172 individuals in the labor force. Within the labor force, individuals with bachelor's degree or higher education have the highest percentage of unemployment, with 3.8% or 45 of them being unemployed.
| Educational Attainment | In Labor Force | Unemployed |
| Less than High School | 85 (74.6%) | 0 (0.0%) |
| High School Diploma | 434 (71.6%) | 0 (0.0%) |
| College / Associate Degree | 663 (80.1%) | 24 (2.9%) |
| Bachelor's Degree or higher | 1,172 (83.3%) | 53 (3.8%) |
| Total | 2,355 (79.7%) | 80 (2.7%) |
Employment Occupations by Sex in Salida
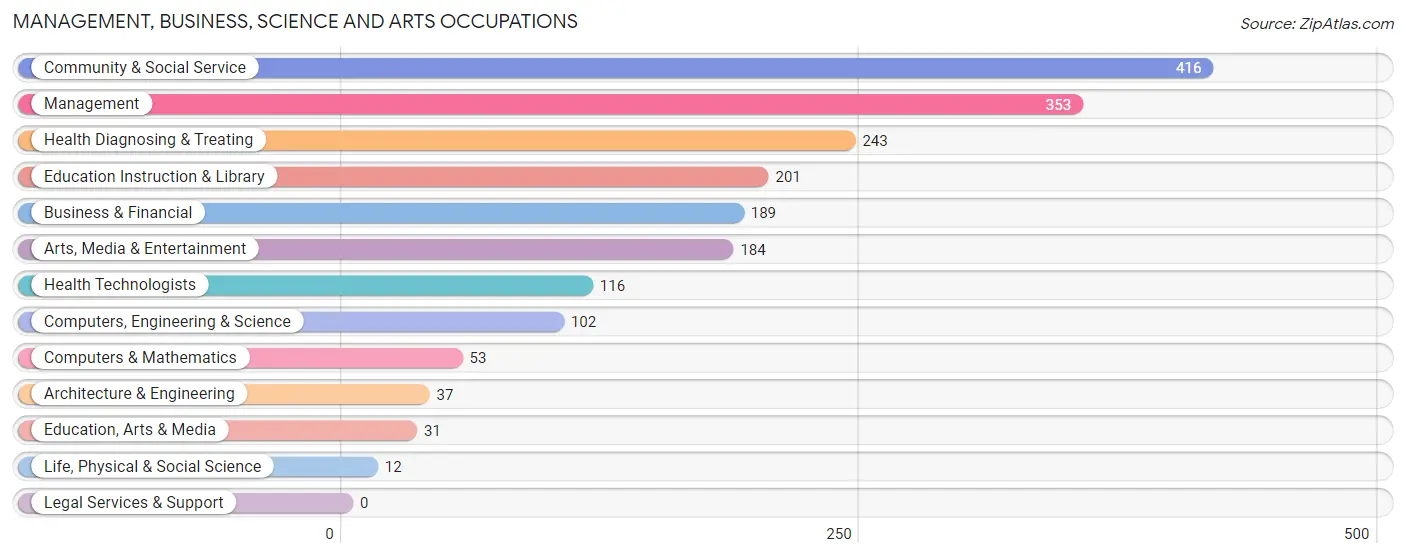
Management, Business, Science and Arts Occupations
The most common Management, Business, Science and Arts occupations in Salida are Community & Social Service (416 | 14.7%), Management (353 | 12.5%), Health Diagnosing & Treating (243 | 8.6%), Education Instruction & Library (201 | 7.1%), and Business & Financial (189 | 6.7%).
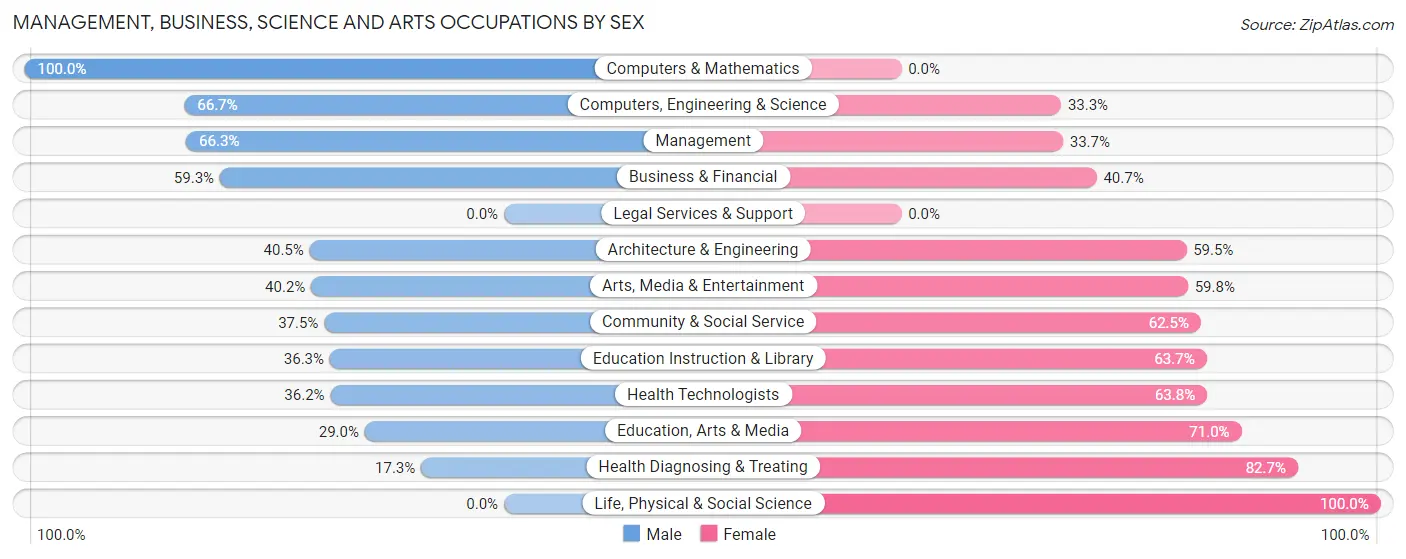
Management, Business, Science and Arts Occupations by Sex
Within the Management, Business, Science and Arts occupations in Salida, the most male-oriented occupations are Computers & Mathematics (100.0%), Computers, Engineering & Science (66.7%), and Management (66.3%), while the most female-oriented occupations are Life, Physical & Social Science (100.0%), Health Diagnosing & Treating (82.7%), and Education, Arts & Media (71.0%).
| Occupation | Male | Female |
| Management | 234 (66.3%) | 119 (33.7%) |
| Business & Financial | 112 (59.3%) | 77 (40.7%) |
| Computers, Engineering & Science | 68 (66.7%) | 34 (33.3%) |
| Computers & Mathematics | 53 (100.0%) | 0 (0.0%) |
| Architecture & Engineering | 15 (40.5%) | 22 (59.5%) |
| Life, Physical & Social Science | 0 (0.0%) | 12 (100.0%) |
| Community & Social Service | 156 (37.5%) | 260 (62.5%) |
| Education, Arts & Media | 9 (29.0%) | 22 (71.0%) |
| Legal Services & Support | 0 (0.0%) | 0 (0.0%) |
| Education Instruction & Library | 73 (36.3%) | 128 (63.7%) |
| Arts, Media & Entertainment | 74 (40.2%) | 110 (59.8%) |
| Health Diagnosing & Treating | 42 (17.3%) | 201 (82.7%) |
| Health Technologists | 42 (36.2%) | 74 (63.8%) |
| Total (Category) | 612 (47.0%) | 691 (53.0%) |
| Total (Overall) | 1,290 (45.7%) | 1,536 (54.3%) |
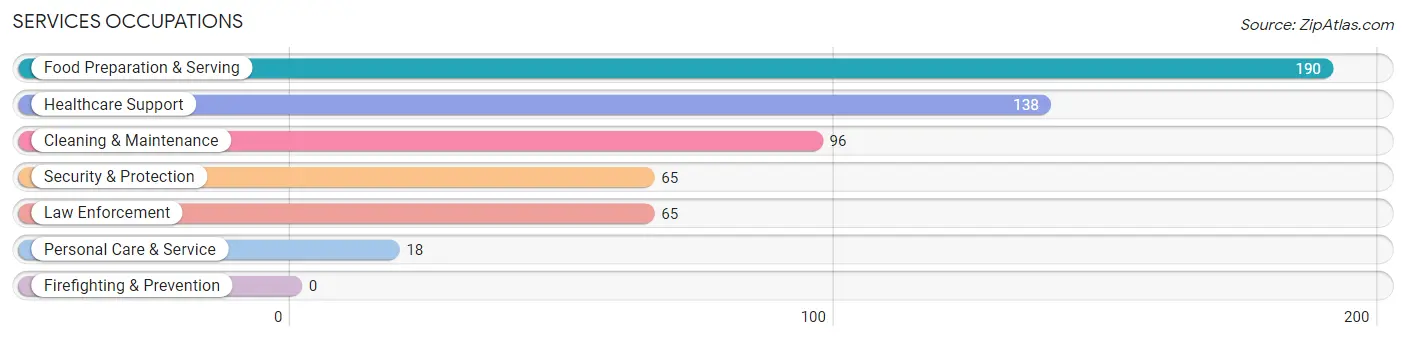
Services Occupations
The most common Services occupations in Salida are Food Preparation & Serving (190 | 6.7%), Healthcare Support (138 | 4.9%), Cleaning & Maintenance (96 | 3.4%), Security & Protection (65 | 2.3%), and Law Enforcement (65 | 2.3%).
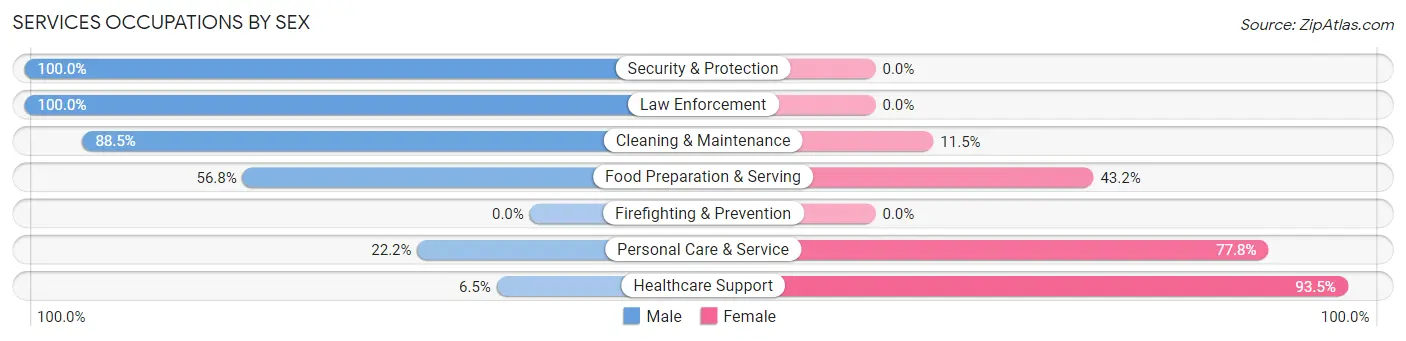
Services Occupations by Sex
Within the Services occupations in Salida, the most male-oriented occupations are Security & Protection (100.0%), Law Enforcement (100.0%), and Cleaning & Maintenance (88.5%), while the most female-oriented occupations are Healthcare Support (93.5%), Personal Care & Service (77.8%), and Food Preparation & Serving (43.2%).
| Occupation | Male | Female |
| Healthcare Support | 9 (6.5%) | 129 (93.5%) |
| Security & Protection | 65 (100.0%) | 0 (0.0%) |
| Firefighting & Prevention | 0 (0.0%) | 0 (0.0%) |
| Law Enforcement | 65 (100.0%) | 0 (0.0%) |
| Food Preparation & Serving | 108 (56.8%) | 82 (43.2%) |
| Cleaning & Maintenance | 85 (88.5%) | 11 (11.5%) |
| Personal Care & Service | 4 (22.2%) | 14 (77.8%) |
| Total (Category) | 271 (53.4%) | 236 (46.6%) |
| Total (Overall) | 1,290 (45.7%) | 1,536 (54.3%) |
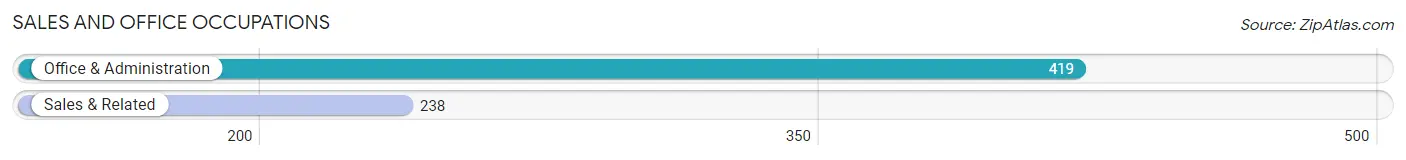
Sales and Office Occupations
The most common Sales and Office occupations in Salida are Office & Administration (419 | 14.8%), and Sales & Related (238 | 8.4%).
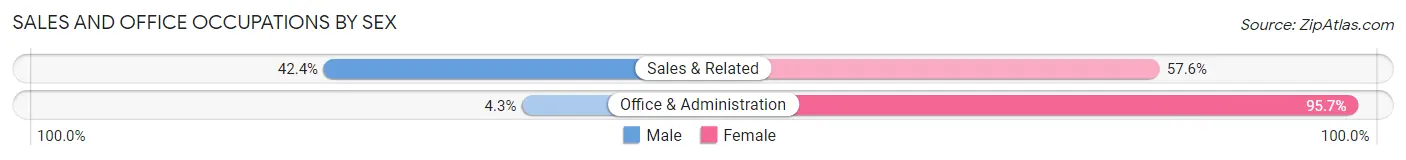
Sales and Office Occupations by Sex
| Occupation | Male | Female |
| Sales & Related | 101 (42.4%) | 137 (57.6%) |
| Office & Administration | 18 (4.3%) | 401 (95.7%) |
| Total (Category) | 119 (18.1%) | 538 (81.9%) |
| Total (Overall) | 1,290 (45.7%) | 1,536 (54.3%) |
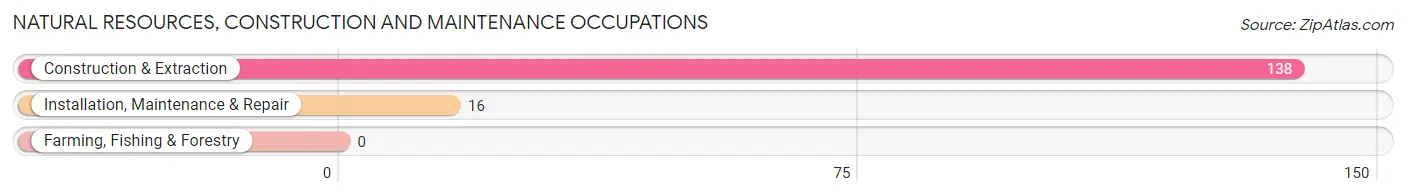
Natural Resources, Construction and Maintenance Occupations
The most common Natural Resources, Construction and Maintenance occupations in Salida are Construction & Extraction (138 | 4.9%), and Installation, Maintenance & Repair (16 | 0.6%).
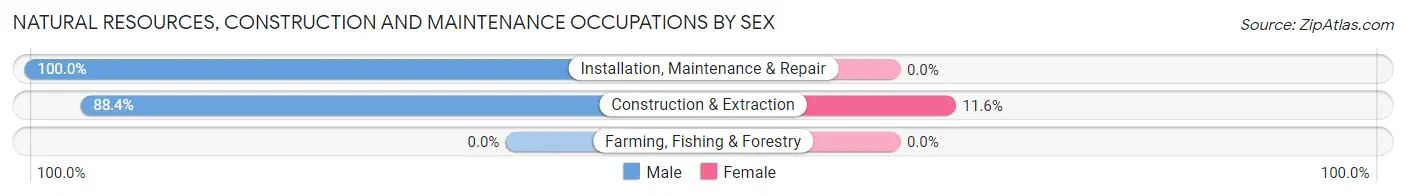
Natural Resources, Construction and Maintenance Occupations by Sex
| Occupation | Male | Female |
| Farming, Fishing & Forestry | 0 (0.0%) | 0 (0.0%) |
| Construction & Extraction | 122 (88.4%) | 16 (11.6%) |
| Installation, Maintenance & Repair | 16 (100.0%) | 0 (0.0%) |
| Total (Category) | 138 (89.6%) | 16 (10.4%) |
| Total (Overall) | 1,290 (45.7%) | 1,536 (54.3%) |
Production, Transportation and Moving Occupations
The most common Production, Transportation and Moving occupations in Salida are Transportation (98 | 3.5%), Production (63 | 2.2%), and Material Moving (44 | 1.6%).
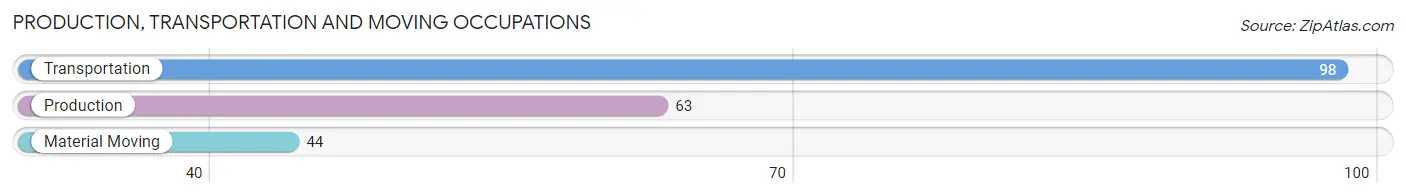
Production, Transportation and Moving Occupations by Sex
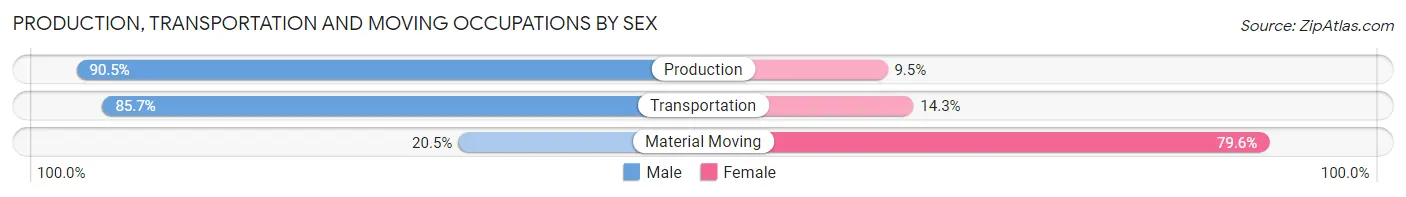
| Occupation | Male | Female |
| Production | 57 (90.5%) | 6 (9.5%) |
| Transportation | 84 (85.7%) | 14 (14.3%) |
| Material Moving | 9 (20.4%) | 35 (79.5%) |
| Total (Category) | 150 (73.2%) | 55 (26.8%) |
| Total (Overall) | 1,290 (45.7%) | 1,536 (54.3%) |
Employment Industries by Sex in Salida
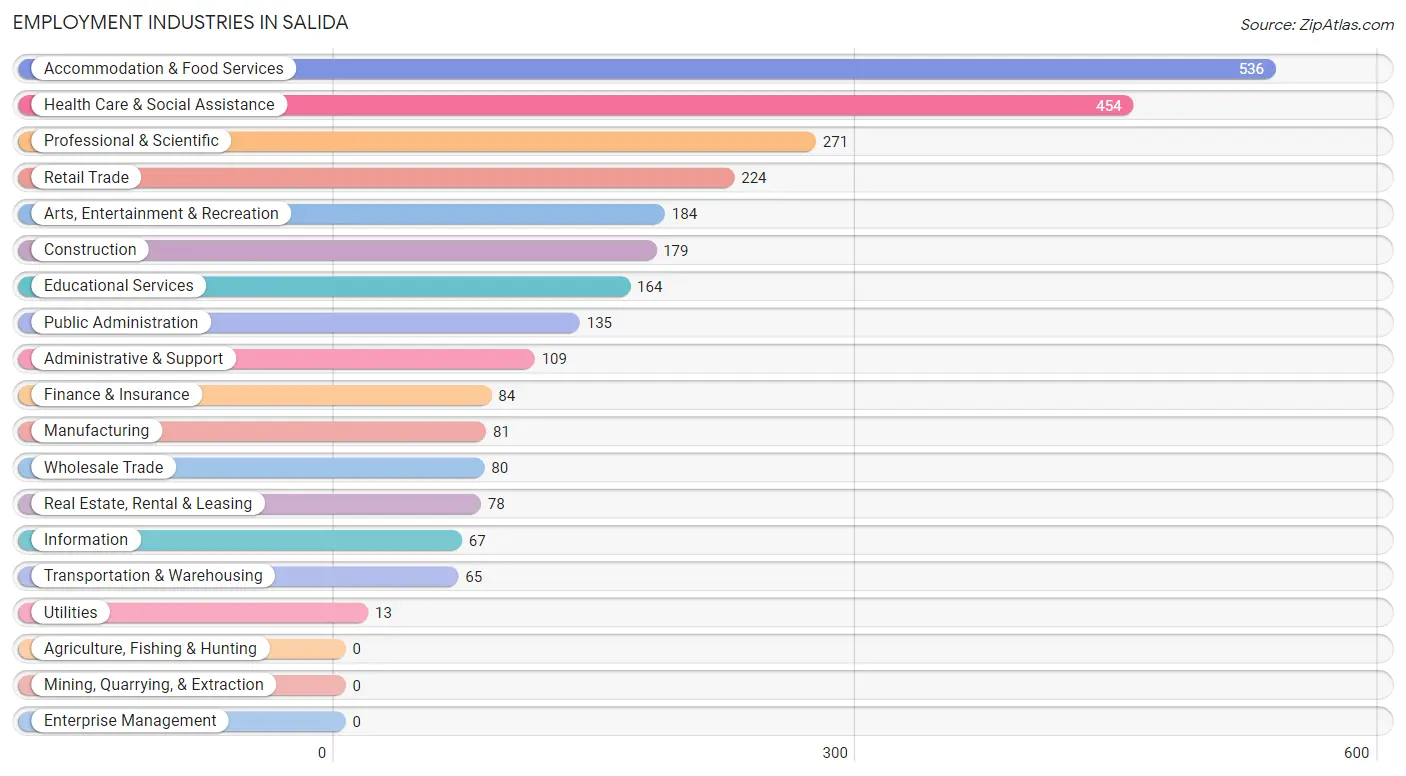
Employment Industries in Salida
The major employment industries in Salida include Accommodation & Food Services (536 | 19.0%), Health Care & Social Assistance (454 | 16.1%), Professional & Scientific (271 | 9.6%), Retail Trade (224 | 7.9%), and Arts, Entertainment & Recreation (184 | 6.5%).
Employment Industries by Sex in Salida
The Salida industries that see more men than women are Manufacturing (92.6%), Transportation & Warehousing (87.7%), and Administrative & Support (81.7%), whereas the industries that tend to have a higher number of women are Utilities (100.0%), Health Care & Social Assistance (93.4%), and Wholesale Trade (73.8%).
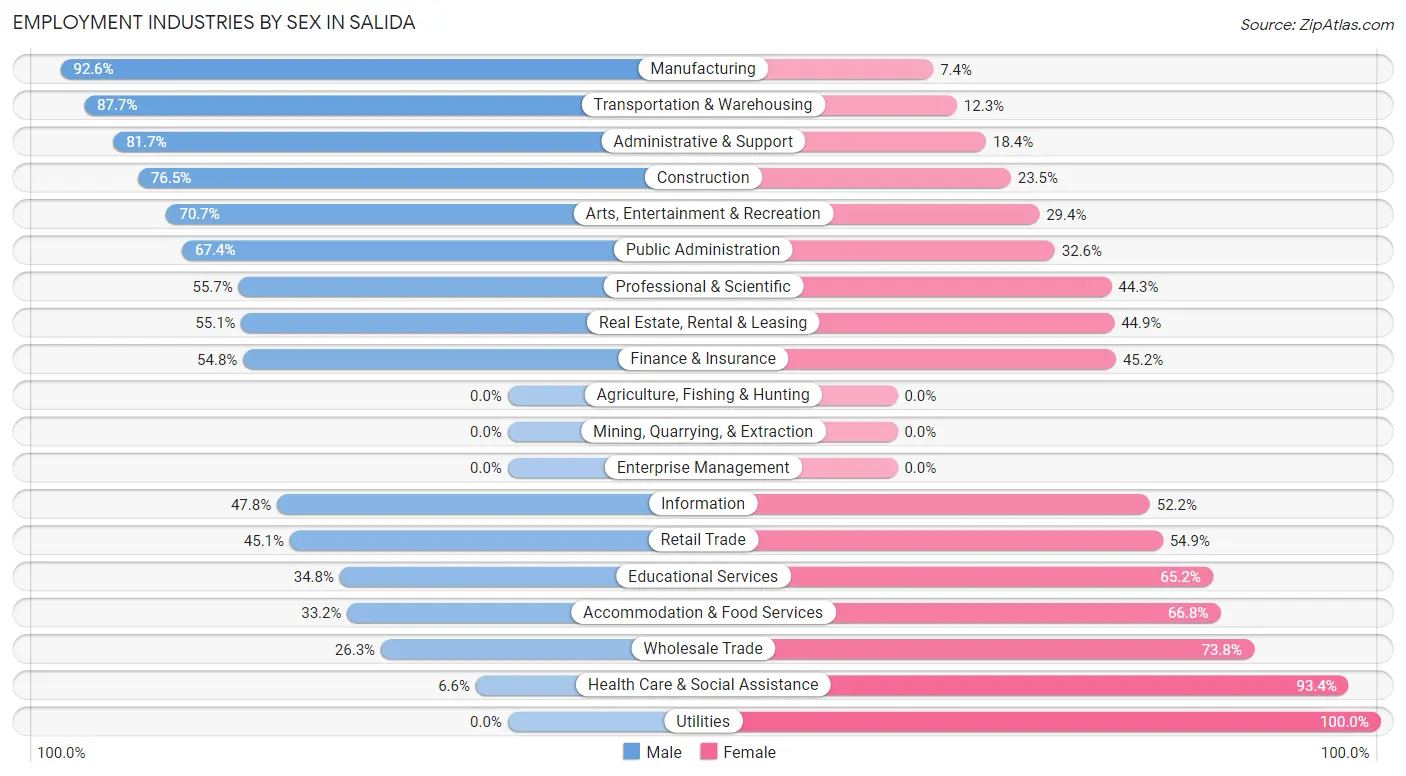
| Industry | Male | Female |
| Agriculture, Fishing & Hunting | 0 (0.0%) | 0 (0.0%) |
| Mining, Quarrying, & Extraction | 0 (0.0%) | 0 (0.0%) |
| Construction | 137 (76.5%) | 42 (23.5%) |
| Manufacturing | 75 (92.6%) | 6 (7.4%) |
| Wholesale Trade | 21 (26.3%) | 59 (73.8%) |
| Retail Trade | 101 (45.1%) | 123 (54.9%) |
| Transportation & Warehousing | 57 (87.7%) | 8 (12.3%) |
| Utilities | 0 (0.0%) | 13 (100.0%) |
| Information | 32 (47.8%) | 35 (52.2%) |
| Finance & Insurance | 46 (54.8%) | 38 (45.2%) |
| Real Estate, Rental & Leasing | 43 (55.1%) | 35 (44.9%) |
| Professional & Scientific | 151 (55.7%) | 120 (44.3%) |
| Enterprise Management | 0 (0.0%) | 0 (0.0%) |
| Administrative & Support | 89 (81.7%) | 20 (18.3%) |
| Educational Services | 57 (34.8%) | 107 (65.2%) |
| Health Care & Social Assistance | 30 (6.6%) | 424 (93.4%) |
| Arts, Entertainment & Recreation | 130 (70.7%) | 54 (29.3%) |
| Accommodation & Food Services | 178 (33.2%) | 358 (66.8%) |
| Public Administration | 91 (67.4%) | 44 (32.6%) |
| Total | 1,290 (45.7%) | 1,536 (54.3%) |
Education in Salida
School Enrollment in Salida
The most common levels of schooling among the 960 students in Salida are high school (246 | 25.6%), middle school (217 | 22.6%), and elementary school (213 | 22.2%).
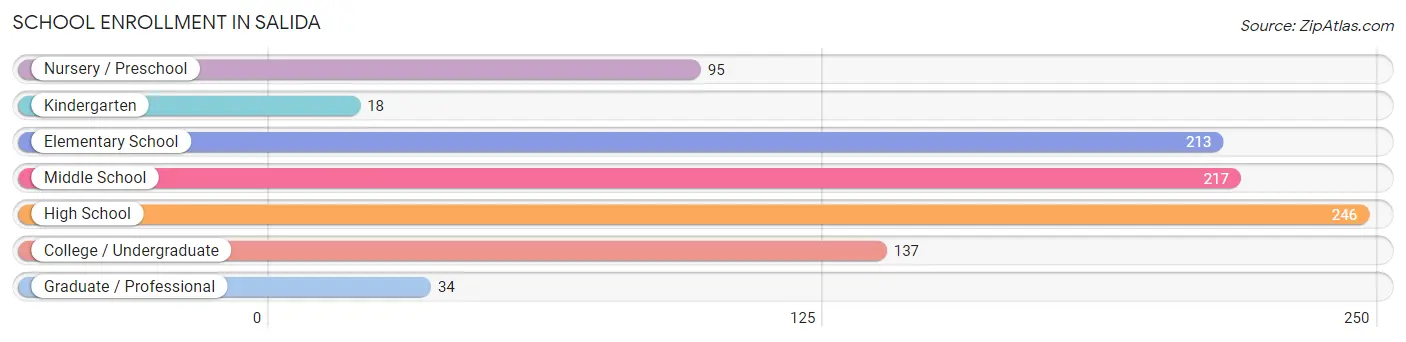
| School Level | # Students | % Students |
| Nursery / Preschool | 95 | 9.9% |
| Kindergarten | 18 | 1.9% |
| Elementary School | 213 | 22.2% |
| Middle School | 217 | 22.6% |
| High School | 246 | 25.6% |
| College / Undergraduate | 137 | 14.3% |
| Graduate / Professional | 34 | 3.5% |
| Total | 960 | 100.0% |
School Enrollment by Age by Funding Source in Salida
Out of a total of 960 students who are enrolled in schools in Salida, 95 (9.9%) attend a private institution, while the remaining 865 (90.1%) are enrolled in public schools. The age group of 25 to 34 year olds has the highest likelihood of being enrolled in private schools, with 12 (100.0% in the age bracket) enrolled. Conversely, the age group of 5 to 9 year old has the lowest likelihood of being enrolled in a private school, with 226 (100.0% in the age bracket) attending a public institution.
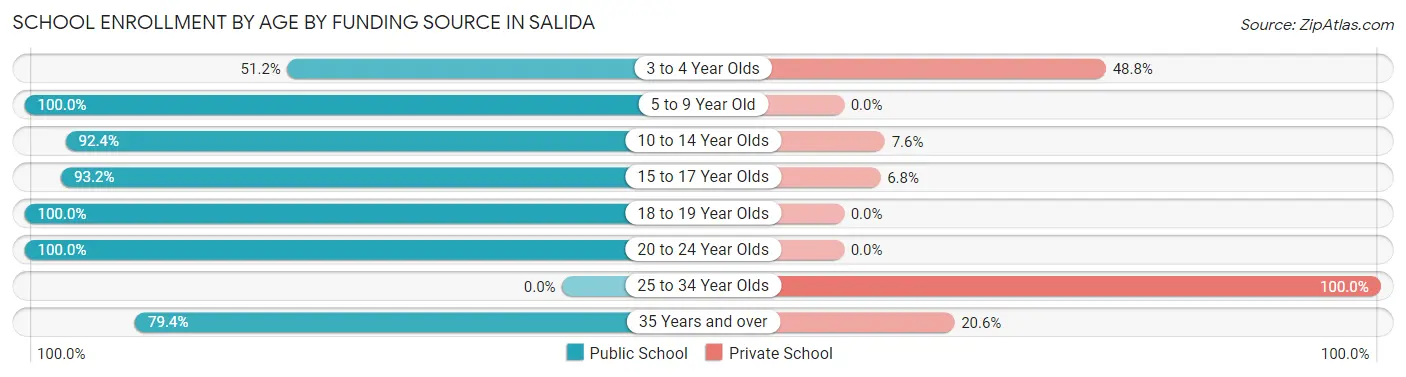
| Age Bracket | Public School | Private School |
| 3 to 4 Year Olds | 43 (51.2%) | 41 (48.8%) |
| 5 to 9 Year Old | 226 (100.0%) | 0 (0.0%) |
| 10 to 14 Year Olds | 266 (92.4%) | 22 (7.6%) |
| 15 to 17 Year Olds | 178 (93.2%) | 13 (6.8%) |
| 18 to 19 Year Olds | 11 (100.0%) | 0 (0.0%) |
| 20 to 24 Year Olds | 114 (100.0%) | 0 (0.0%) |
| 25 to 34 Year Olds | 0 (0.0%) | 12 (100.0%) |
| 35 Years and over | 27 (79.4%) | 7 (20.6%) |
| Total | 865 (90.1%) | 95 (9.9%) |
Educational Attainment by Field of Study in Salida
Business (352 | 16.4%), education (242 | 11.3%), literature & languages (231 | 10.8%), visual & performing arts (222 | 10.3%), and communications (194 | 9.0%) are the most common fields of study among 2,145 individuals in Salida who have obtained a bachelor's degree or higher.
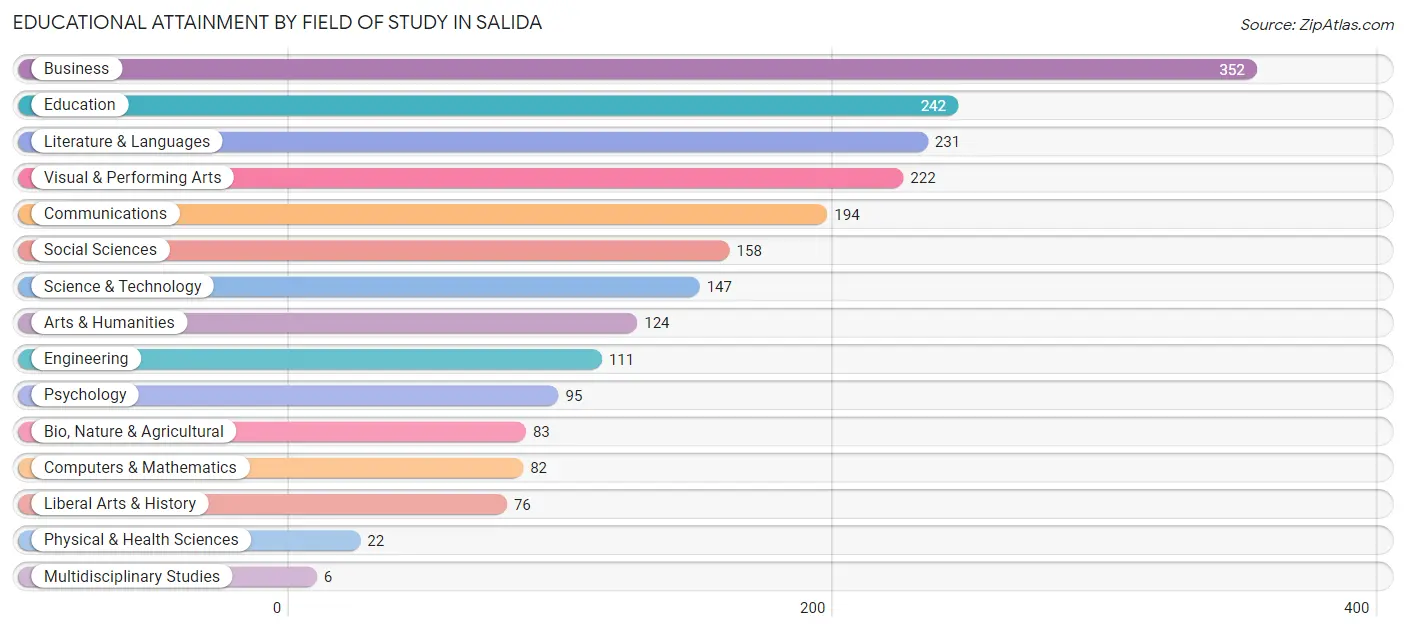
| Field of Study | # Graduates | % Graduates |
| Computers & Mathematics | 82 | 3.8% |
| Bio, Nature & Agricultural | 83 | 3.9% |
| Physical & Health Sciences | 22 | 1.0% |
| Psychology | 95 | 4.4% |
| Social Sciences | 158 | 7.4% |
| Engineering | 111 | 5.2% |
| Multidisciplinary Studies | 6 | 0.3% |
| Science & Technology | 147 | 6.9% |
| Business | 352 | 16.4% |
| Education | 242 | 11.3% |
| Literature & Languages | 231 | 10.8% |
| Liberal Arts & History | 76 | 3.5% |
| Visual & Performing Arts | 222 | 10.3% |
| Communications | 194 | 9.0% |
| Arts & Humanities | 124 | 5.8% |
| Total | 2,145 | 100.0% |
Transportation & Commute in Salida
Vehicle Availability by Sex in Salida
The most prevalent vehicle ownership categories in Salida are males with 2 vehicles (613, accounting for 47.5%) and females with 2 vehicles (608, making up 40.4%).
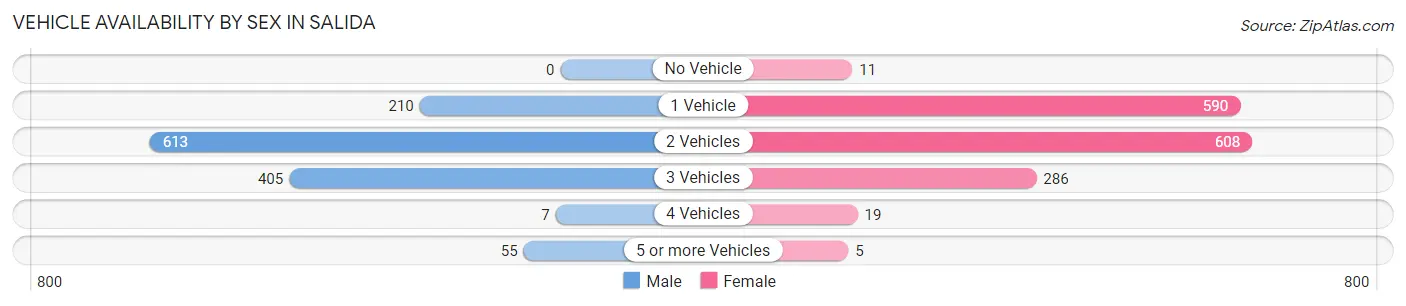
| Vehicles Available | Male | Female |
| No Vehicle | 0 (0.0%) | 11 (0.7%) |
| 1 Vehicle | 210 (16.3%) | 590 (38.8%) |
| 2 Vehicles | 613 (47.5%) | 608 (40.0%) |
| 3 Vehicles | 405 (31.4%) | 286 (18.8%) |
| 4 Vehicles | 7 (0.5%) | 19 (1.3%) |
| 5 or more Vehicles | 55 (4.3%) | 5 (0.3%) |
| Total | 1,290 (100.0%) | 1,519 (100.0%) |
Commute Time in Salida
The most frequently occuring commute durations in Salida are 5 to 9 minutes (800 commuters, 35.5%), less than 5 minutes (526 commuters, 23.3%), and 10 to 14 minutes (274 commuters, 12.1%).
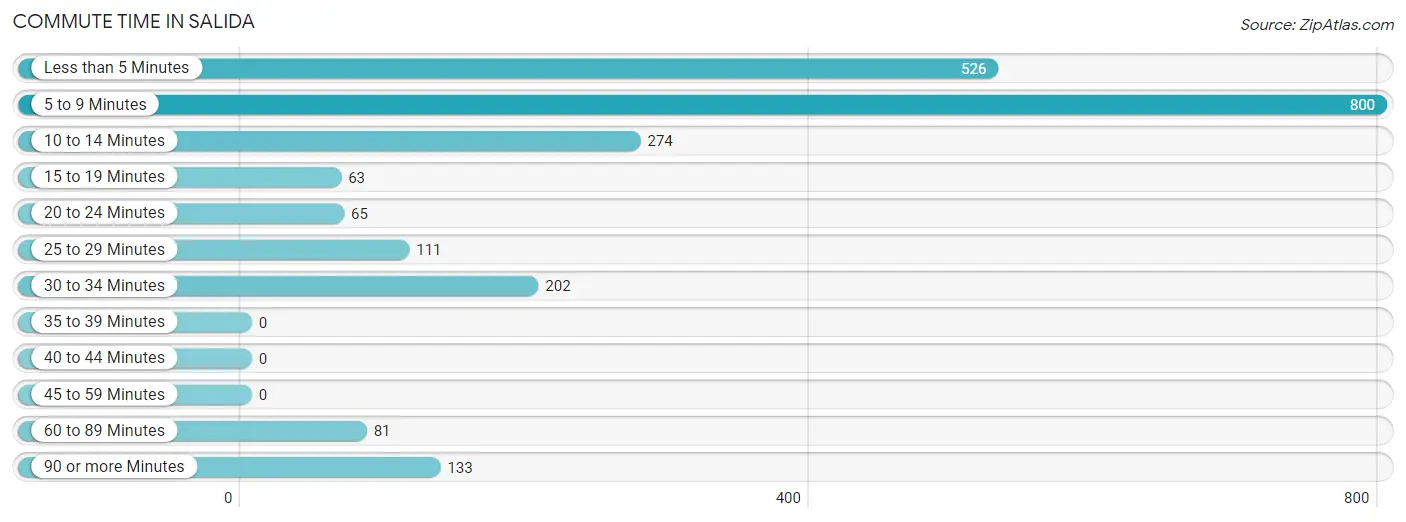
| Commute Time | # Commuters | % Commuters |
| Less than 5 Minutes | 526 | 23.3% |
| 5 to 9 Minutes | 800 | 35.5% |
| 10 to 14 Minutes | 274 | 12.1% |
| 15 to 19 Minutes | 63 | 2.8% |
| 20 to 24 Minutes | 65 | 2.9% |
| 25 to 29 Minutes | 111 | 4.9% |
| 30 to 34 Minutes | 202 | 9.0% |
| 35 to 39 Minutes | 0 | 0.0% |
| 40 to 44 Minutes | 0 | 0.0% |
| 45 to 59 Minutes | 0 | 0.0% |
| 60 to 89 Minutes | 81 | 3.6% |
| 90 or more Minutes | 133 | 5.9% |
Commute Time by Sex in Salida
The most common commute times in Salida are 5 to 9 minutes (383 commuters, 35.1%) for males and 5 to 9 minutes (417 commuters, 35.8%) for females.
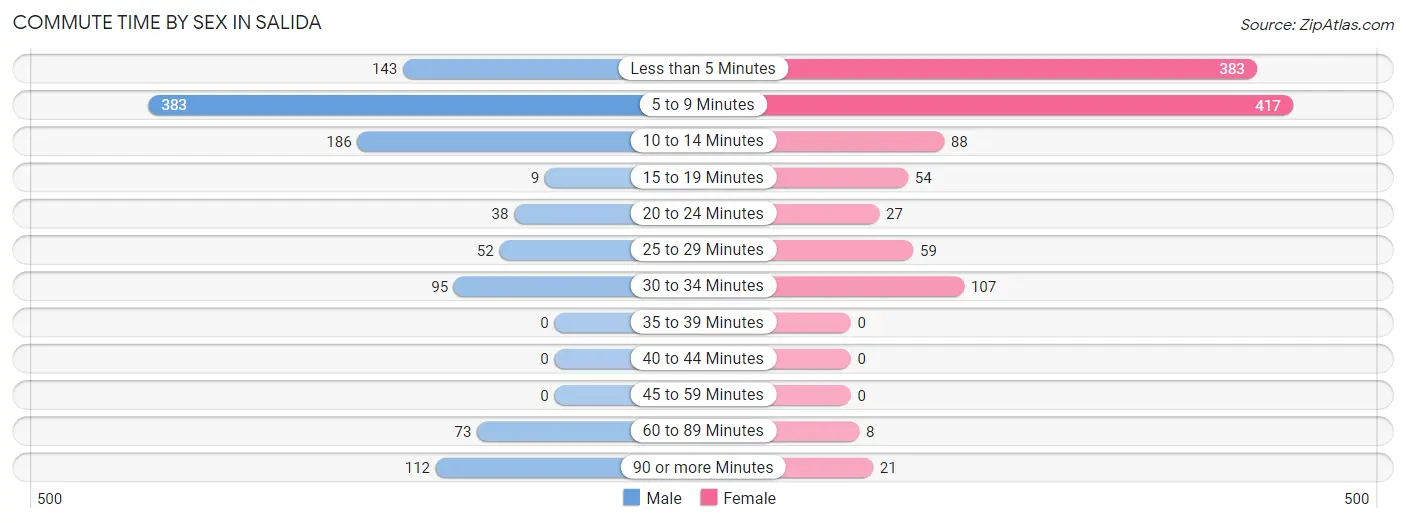
| Commute Time | Male | Female |
| Less than 5 Minutes | 143 (13.1%) | 383 (32.9%) |
| 5 to 9 Minutes | 383 (35.1%) | 417 (35.8%) |
| 10 to 14 Minutes | 186 (17.1%) | 88 (7.6%) |
| 15 to 19 Minutes | 9 (0.8%) | 54 (4.6%) |
| 20 to 24 Minutes | 38 (3.5%) | 27 (2.3%) |
| 25 to 29 Minutes | 52 (4.8%) | 59 (5.1%) |
| 30 to 34 Minutes | 95 (8.7%) | 107 (9.2%) |
| 35 to 39 Minutes | 0 (0.0%) | 0 (0.0%) |
| 40 to 44 Minutes | 0 (0.0%) | 0 (0.0%) |
| 45 to 59 Minutes | 0 (0.0%) | 0 (0.0%) |
| 60 to 89 Minutes | 73 (6.7%) | 8 (0.7%) |
| 90 or more Minutes | 112 (10.3%) | 21 (1.8%) |
Time of Departure to Work by Sex in Salida
The most frequent times of departure to work in Salida are 6:30 AM to 6:59 AM (226, 20.7%) for males and 9:00 AM to 9:59 AM (255, 21.9%) for females.
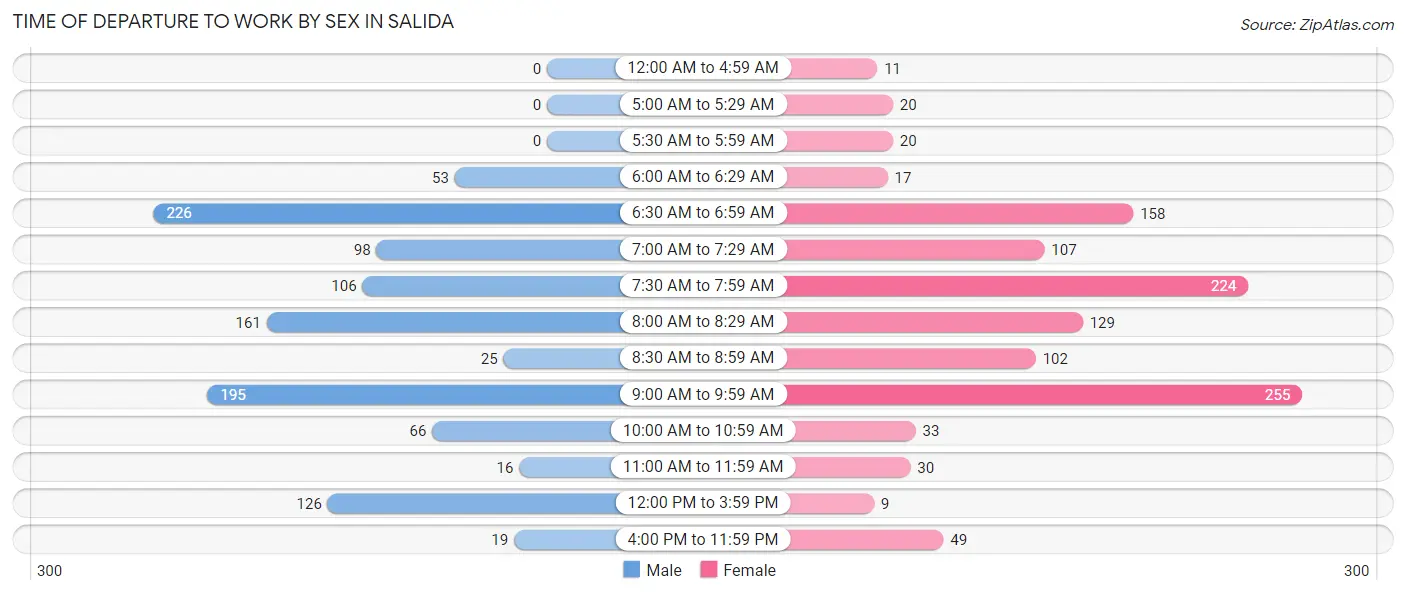
| Time of Departure | Male | Female |
| 12:00 AM to 4:59 AM | 0 (0.0%) | 11 (0.9%) |
| 5:00 AM to 5:29 AM | 0 (0.0%) | 20 (1.7%) |
| 5:30 AM to 5:59 AM | 0 (0.0%) | 20 (1.7%) |
| 6:00 AM to 6:29 AM | 53 (4.9%) | 17 (1.5%) |
| 6:30 AM to 6:59 AM | 226 (20.7%) | 158 (13.6%) |
| 7:00 AM to 7:29 AM | 98 (9.0%) | 107 (9.2%) |
| 7:30 AM to 7:59 AM | 106 (9.7%) | 224 (19.2%) |
| 8:00 AM to 8:29 AM | 161 (14.8%) | 129 (11.1%) |
| 8:30 AM to 8:59 AM | 25 (2.3%) | 102 (8.8%) |
| 9:00 AM to 9:59 AM | 195 (17.9%) | 255 (21.9%) |
| 10:00 AM to 10:59 AM | 66 (6.0%) | 33 (2.8%) |
| 11:00 AM to 11:59 AM | 16 (1.5%) | 30 (2.6%) |
| 12:00 PM to 3:59 PM | 126 (11.6%) | 9 (0.8%) |
| 4:00 PM to 11:59 PM | 19 (1.7%) | 49 (4.2%) |
| Total | 1,091 (100.0%) | 1,164 (100.0%) |
Housing Occupancy in Salida
Occupancy by Ownership in Salida
Of the total 2,770 dwellings in Salida, owner-occupied units account for 1,722 (62.2%), while renter-occupied units make up 1,048 (37.8%).
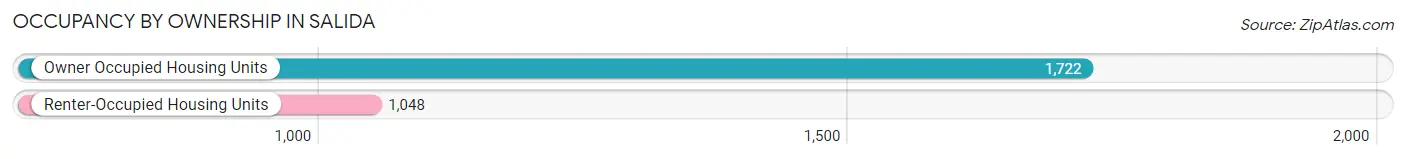
| Occupancy | # Housing Units | % Housing Units |
| Owner Occupied Housing Units | 1,722 | 62.2% |
| Renter-Occupied Housing Units | 1,048 | 37.8% |
| Total Occupied Housing Units | 2,770 | 100.0% |
Occupancy by Household Size in Salida
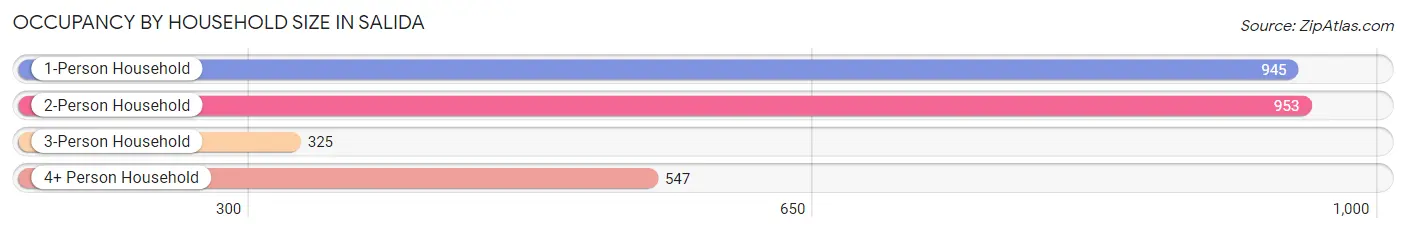
| Household Size | # Housing Units | % Housing Units |
| 1-Person Household | 945 | 34.1% |
| 2-Person Household | 953 | 34.4% |
| 3-Person Household | 325 | 11.7% |
| 4+ Person Household | 547 | 19.8% |
| Total Housing Units | 2,770 | 100.0% |
Occupancy by Ownership by Household Size in Salida
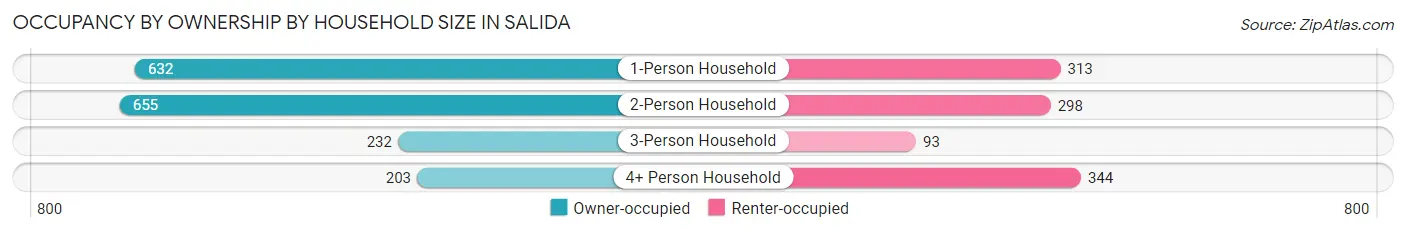
| Household Size | Owner-occupied | Renter-occupied |
| 1-Person Household | 632 (66.9%) | 313 (33.1%) |
| 2-Person Household | 655 (68.7%) | 298 (31.3%) |
| 3-Person Household | 232 (71.4%) | 93 (28.6%) |
| 4+ Person Household | 203 (37.1%) | 344 (62.9%) |
| Total Housing Units | 1,722 (62.2%) | 1,048 (37.8%) |
Occupancy by Educational Attainment in Salida
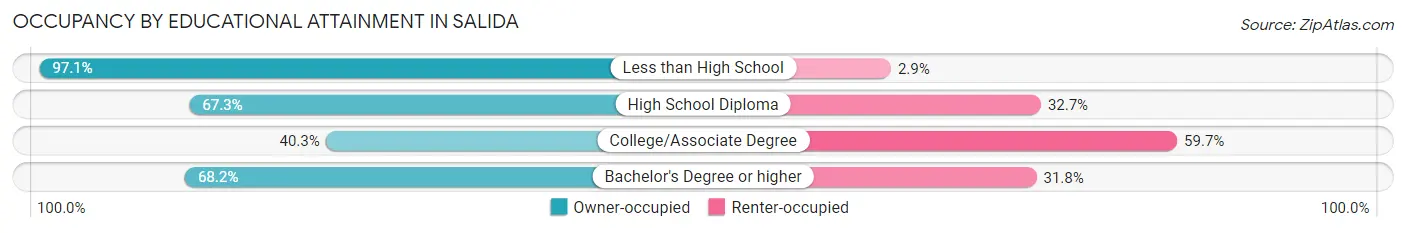
| Household Size | Owner-occupied | Renter-occupied |
| Less than High School | 199 (97.1%) | 6 (2.9%) |
| High School Diploma | 340 (67.3%) | 165 (32.7%) |
| College/Associate Degree | 321 (40.3%) | 475 (59.7%) |
| Bachelor's Degree or higher | 862 (68.2%) | 402 (31.8%) |
Occupancy by Age of Householder in Salida
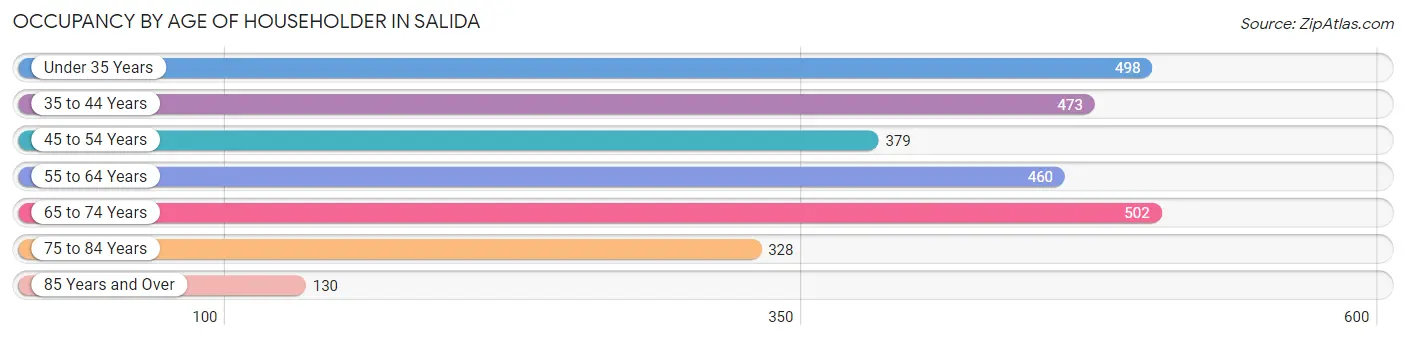
| Age Bracket | # Households | % Households |
| Under 35 Years | 498 | 18.0% |
| 35 to 44 Years | 473 | 17.1% |
| 45 to 54 Years | 379 | 13.7% |
| 55 to 64 Years | 460 | 16.6% |
| 65 to 74 Years | 502 | 18.1% |
| 75 to 84 Years | 328 | 11.8% |
| 85 Years and Over | 130 | 4.7% |
| Total | 2,770 | 100.0% |
Housing Finances in Salida
Median Income by Occupancy in Salida

| Occupancy Type | # Households | Median Income |
| Owner-Occupied | 1,722 (62.2%) | $66,905 |
| Renter-Occupied | 1,048 (37.8%) | $60,929 |
| Average | 2,770 (100.0%) | $63,775 |
Occupancy by Householder Income Bracket in Salida
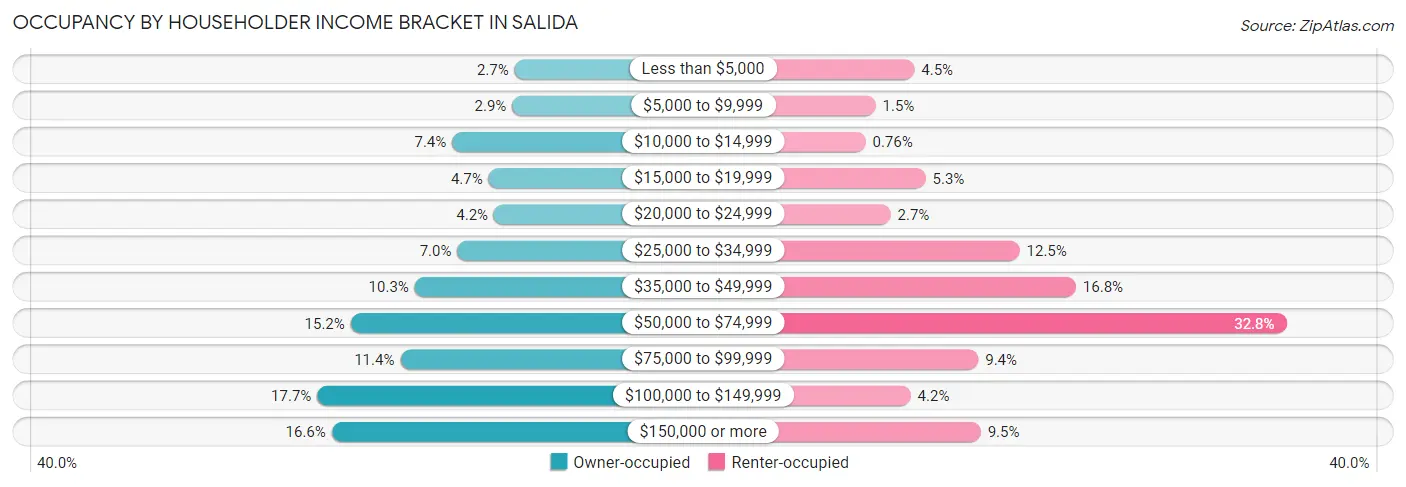
| Income Bracket | Owner-occupied | Renter-occupied |
| Less than $5,000 | 46 (2.7%) | 47 (4.5%) |
| $5,000 to $9,999 | 49 (2.9%) | 16 (1.5%) |
| $10,000 to $14,999 | 128 (7.4%) | 8 (0.8%) |
| $15,000 to $19,999 | 80 (4.6%) | 56 (5.3%) |
| $20,000 to $24,999 | 73 (4.2%) | 28 (2.7%) |
| $25,000 to $34,999 | 121 (7.0%) | 131 (12.5%) |
| $35,000 to $49,999 | 177 (10.3%) | 176 (16.8%) |
| $50,000 to $74,999 | 261 (15.2%) | 344 (32.8%) |
| $75,000 to $99,999 | 196 (11.4%) | 98 (9.3%) |
| $100,000 to $149,999 | 305 (17.7%) | 44 (4.2%) |
| $150,000 or more | 286 (16.6%) | 100 (9.5%) |
| Total | 1,722 (100.0%) | 1,048 (100.0%) |
Monthly Housing Cost Tiers in Salida
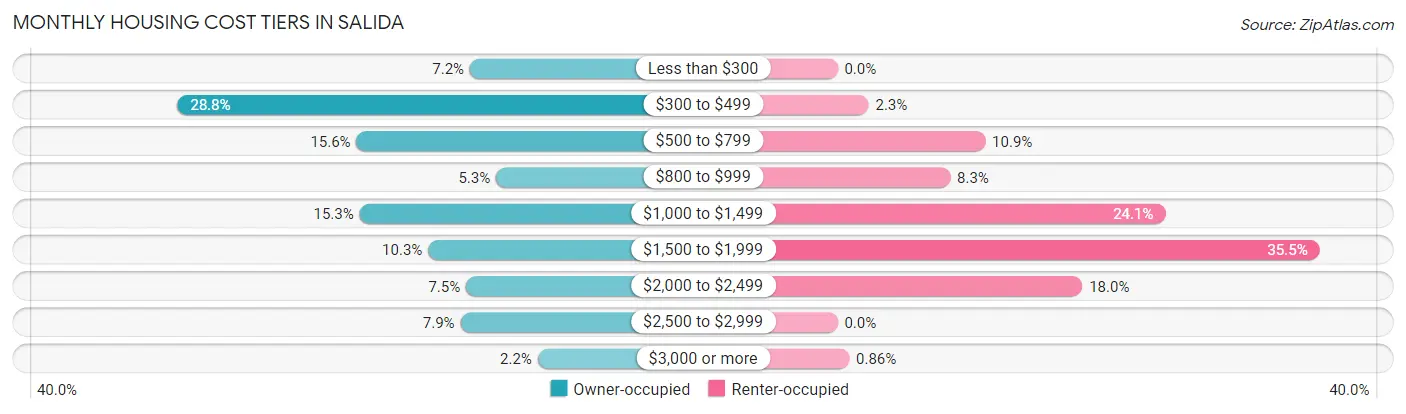
| Monthly Cost | Owner-occupied | Renter-occupied |
| Less than $300 | 124 (7.2%) | 0 (0.0%) |
| $300 to $499 | 495 (28.7%) | 24 (2.3%) |
| $500 to $799 | 268 (15.6%) | 114 (10.9%) |
| $800 to $999 | 91 (5.3%) | 87 (8.3%) |
| $1,000 to $1,499 | 264 (15.3%) | 253 (24.1%) |
| $1,500 to $1,999 | 177 (10.3%) | 372 (35.5%) |
| $2,000 to $2,499 | 129 (7.5%) | 189 (18.0%) |
| $2,500 to $2,999 | 136 (7.9%) | 0 (0.0%) |
| $3,000 or more | 38 (2.2%) | 9 (0.9%) |
| Total | 1,722 (100.0%) | 1,048 (100.0%) |
Physical Housing Characteristics in Salida
Housing Structures in Salida
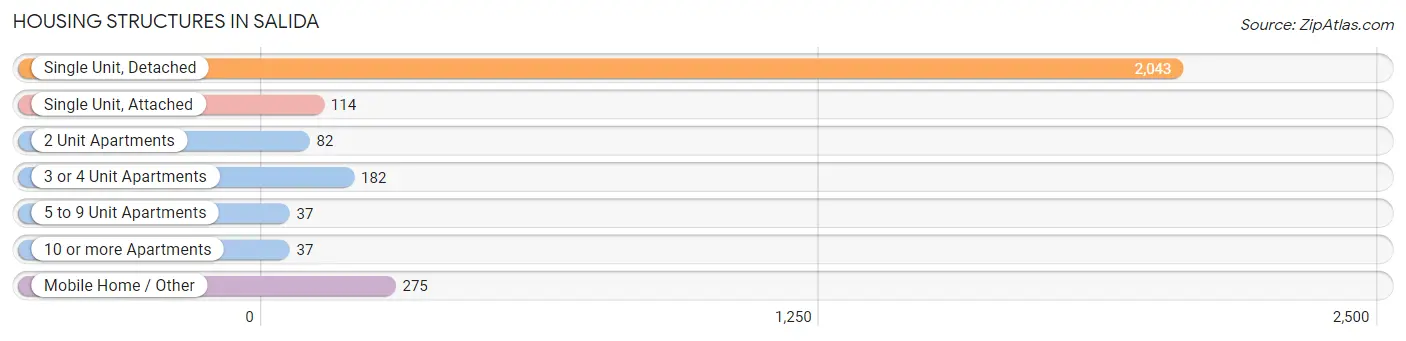
| Structure Type | # Housing Units | % Housing Units |
| Single Unit, Detached | 2,043 | 73.8% |
| Single Unit, Attached | 114 | 4.1% |
| 2 Unit Apartments | 82 | 3.0% |
| 3 or 4 Unit Apartments | 182 | 6.6% |
| 5 to 9 Unit Apartments | 37 | 1.3% |
| 10 or more Apartments | 37 | 1.3% |
| Mobile Home / Other | 275 | 9.9% |
| Total | 2,770 | 100.0% |
Housing Structures by Occupancy in Salida
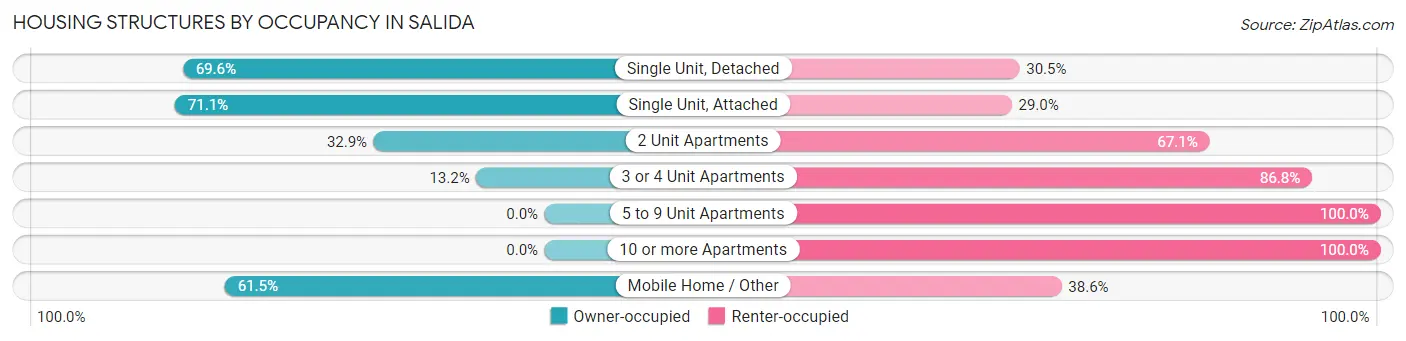
| Structure Type | Owner-occupied | Renter-occupied |
| Single Unit, Detached | 1,421 (69.6%) | 622 (30.4%) |
| Single Unit, Attached | 81 (71.1%) | 33 (28.9%) |
| 2 Unit Apartments | 27 (32.9%) | 55 (67.1%) |
| 3 or 4 Unit Apartments | 24 (13.2%) | 158 (86.8%) |
| 5 to 9 Unit Apartments | 0 (0.0%) | 37 (100.0%) |
| 10 or more Apartments | 0 (0.0%) | 37 (100.0%) |
| Mobile Home / Other | 169 (61.5%) | 106 (38.6%) |
| Total | 1,722 (62.2%) | 1,048 (37.8%) |
Housing Structures by Number of Rooms in Salida
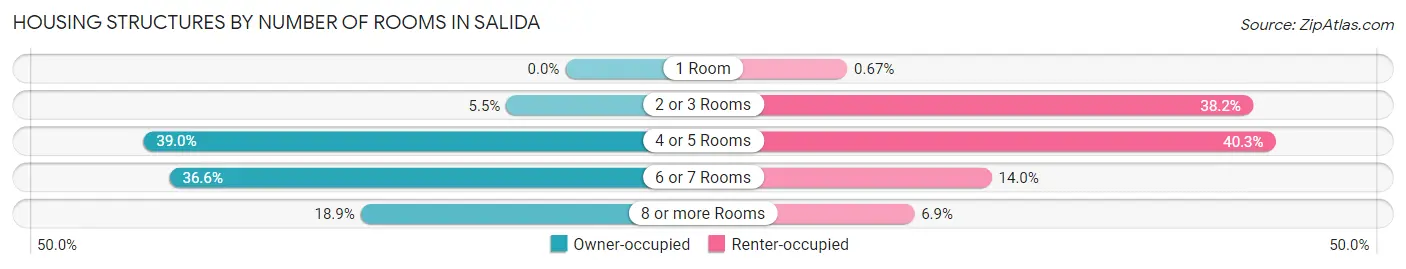
| Number of Rooms | Owner-occupied | Renter-occupied |
| 1 Room | 0 (0.0%) | 7 (0.7%) |
| 2 or 3 Rooms | 94 (5.5%) | 400 (38.2%) |
| 4 or 5 Rooms | 672 (39.0%) | 422 (40.3%) |
| 6 or 7 Rooms | 630 (36.6%) | 147 (14.0%) |
| 8 or more Rooms | 326 (18.9%) | 72 (6.9%) |
| Total | 1,722 (100.0%) | 1,048 (100.0%) |
Housing Structure by Heating Type in Salida
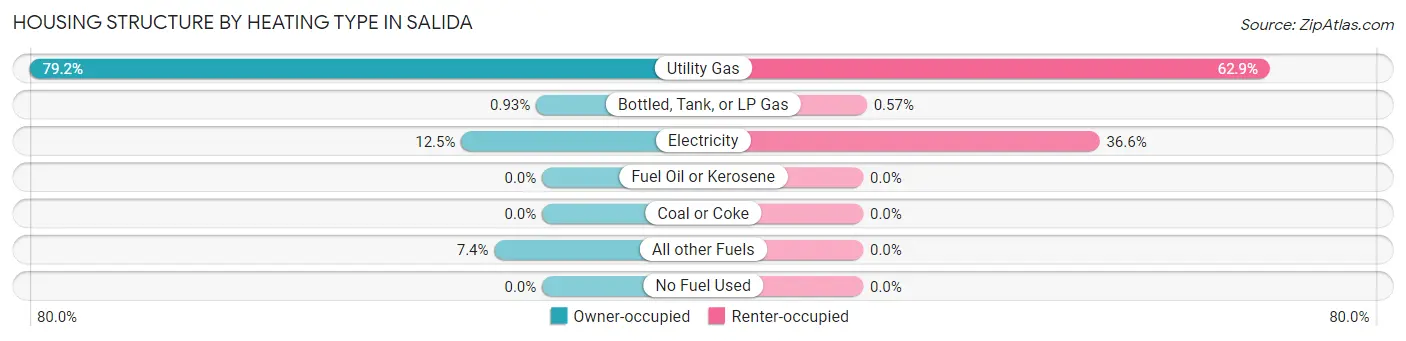
| Heating Type | Owner-occupied | Renter-occupied |
| Utility Gas | 1,364 (79.2%) | 659 (62.9%) |
| Bottled, Tank, or LP Gas | 16 (0.9%) | 6 (0.6%) |
| Electricity | 215 (12.5%) | 383 (36.5%) |
| Fuel Oil or Kerosene | 0 (0.0%) | 0 (0.0%) |
| Coal or Coke | 0 (0.0%) | 0 (0.0%) |
| All other Fuels | 127 (7.4%) | 0 (0.0%) |
| No Fuel Used | 0 (0.0%) | 0 (0.0%) |
| Total | 1,722 (100.0%) | 1,048 (100.0%) |
Household Vehicle Usage in Salida
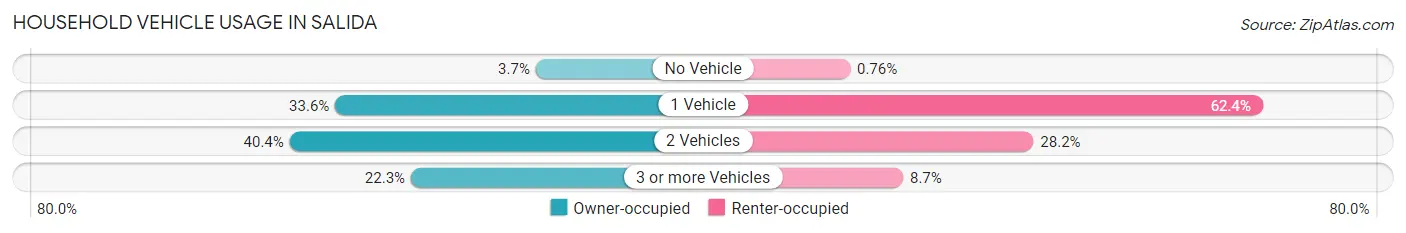
| Vehicles per Household | Owner-occupied | Renter-occupied |
| No Vehicle | 63 (3.7%) | 8 (0.8%) |
| 1 Vehicle | 579 (33.6%) | 654 (62.4%) |
| 2 Vehicles | 696 (40.4%) | 295 (28.1%) |
| 3 or more Vehicles | 384 (22.3%) | 91 (8.7%) |
| Total | 1,722 (100.0%) | 1,048 (100.0%) |
Real Estate & Mortgages in Salida
Real Estate and Mortgage Overview in Salida
| Characteristic | Without Mortgage | With Mortgage |
| Housing Units | 768 | 954 |
| Median Property Value | $434,300 | $474,900 |
| Median Household Income | $45,426 | $161 |
| Monthly Housing Costs | $432 | $38 |
| Real Estate Taxes | $1,336 | $29 |
Property Value by Mortgage Status in Salida
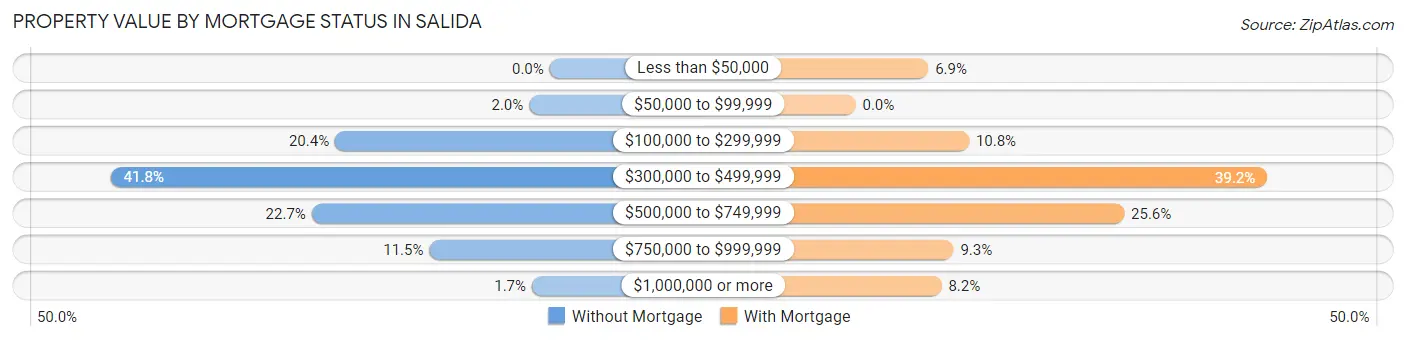
| Property Value | Without Mortgage | With Mortgage |
| Less than $50,000 | 0 (0.0%) | 66 (6.9%) |
| $50,000 to $99,999 | 15 (1.9%) | 0 (0.0%) |
| $100,000 to $299,999 | 157 (20.4%) | 103 (10.8%) |
| $300,000 to $499,999 | 321 (41.8%) | 374 (39.2%) |
| $500,000 to $749,999 | 174 (22.7%) | 244 (25.6%) |
| $750,000 to $999,999 | 88 (11.5%) | 89 (9.3%) |
| $1,000,000 or more | 13 (1.7%) | 78 (8.2%) |
| Total | 768 (100.0%) | 954 (100.0%) |
Household Income by Mortgage Status in Salida
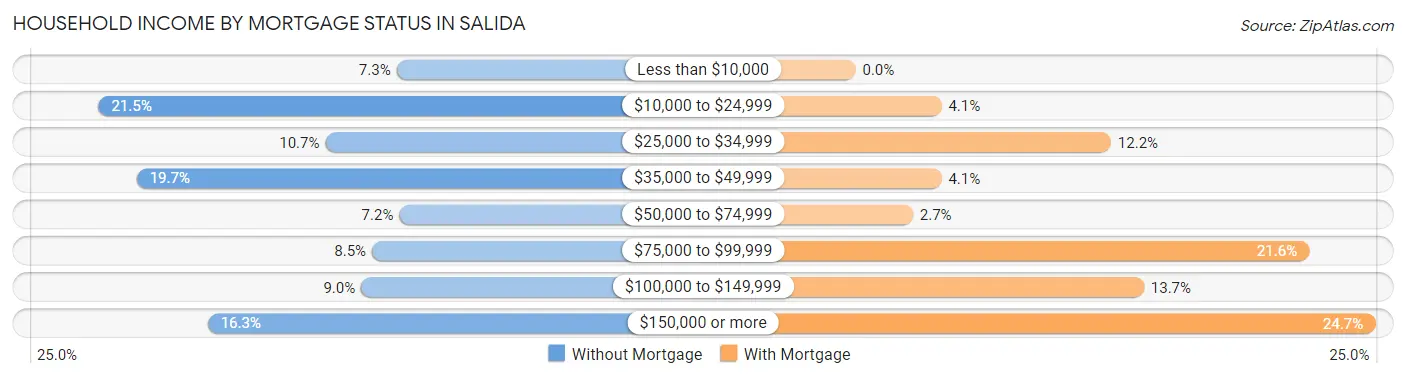
| Household Income | Without Mortgage | With Mortgage |
| Less than $10,000 | 56 (7.3%) | 0 (0.0%) |
| $10,000 to $24,999 | 165 (21.5%) | 39 (4.1%) |
| $25,000 to $34,999 | 82 (10.7%) | 116 (12.2%) |
| $35,000 to $49,999 | 151 (19.7%) | 39 (4.1%) |
| $50,000 to $74,999 | 55 (7.2%) | 26 (2.7%) |
| $75,000 to $99,999 | 65 (8.5%) | 206 (21.6%) |
| $100,000 to $149,999 | 69 (9.0%) | 131 (13.7%) |
| $150,000 or more | 125 (16.3%) | 236 (24.7%) |
| Total | 768 (100.0%) | 954 (100.0%) |
Property Value to Household Income Ratio in Salida
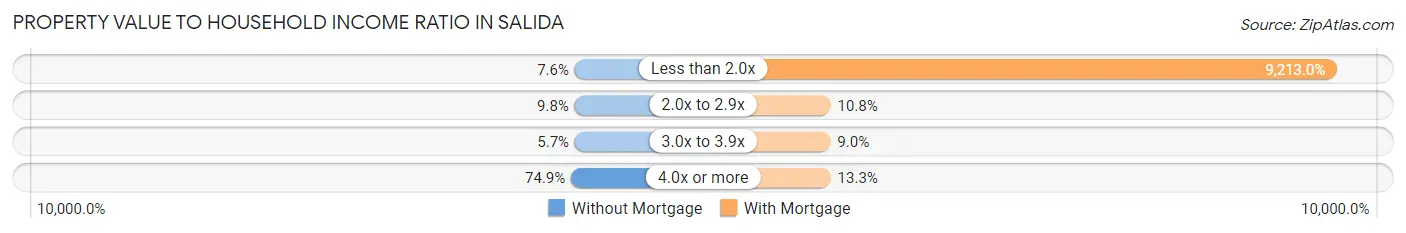
| Value-to-Income Ratio | Without Mortgage | With Mortgage |
| Less than 2.0x | 58 (7.5%) | 87,892 (9,213.0%) |
| 2.0x to 2.9x | 75 (9.8%) | 103 (10.8%) |
| 3.0x to 3.9x | 44 (5.7%) | 86 (9.0%) |
| 4.0x or more | 575 (74.9%) | 127 (13.3%) |
| Total | 768 (100.0%) | 954 (100.0%) |
Real Estate Taxes by Mortgage Status in Salida
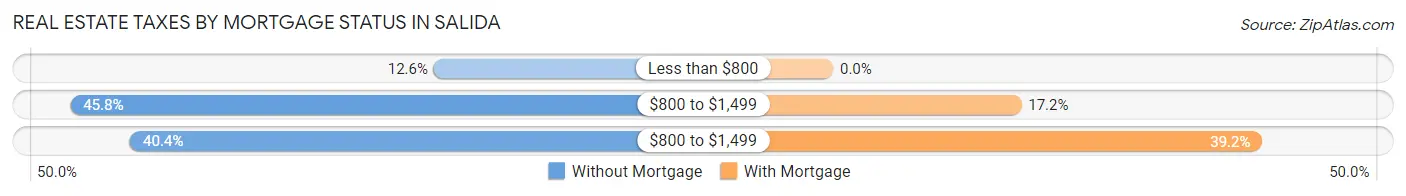
| Property Taxes | Without Mortgage | With Mortgage |
| Less than $800 | 97 (12.6%) | 0 (0.0%) |
| $800 to $1,499 | 352 (45.8%) | 164 (17.2%) |
| $800 to $1,499 | 310 (40.4%) | 374 (39.2%) |
| Total | 768 (100.0%) | 954 (100.0%) |
Health & Disability in Salida
Health Insurance Coverage by Age in Salida
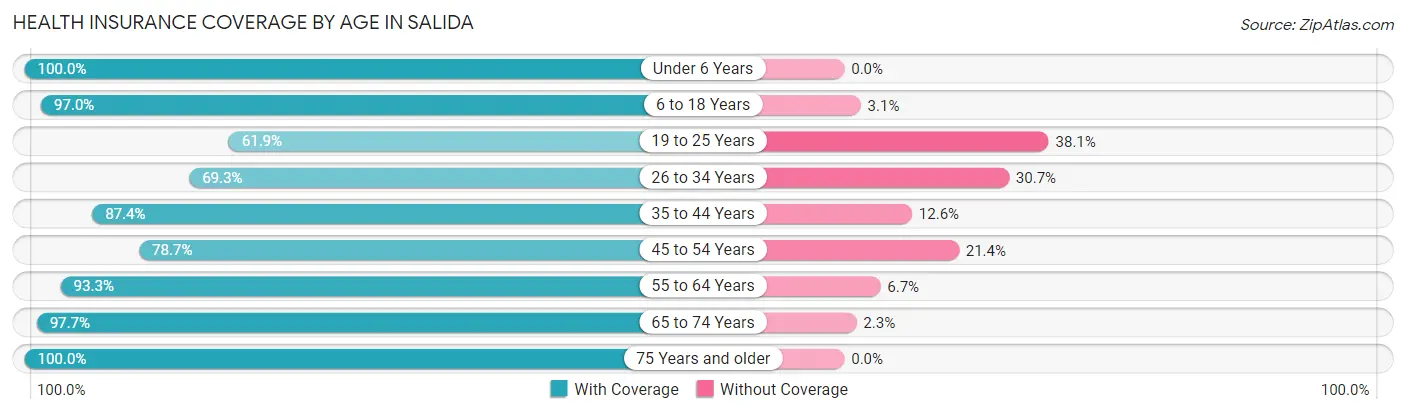
| Age Bracket | With Coverage | Without Coverage |
| Under 6 Years | 385 (100.0%) | 0 (0.0%) |
| 6 to 18 Years | 699 (97.0%) | 22 (3.0%) |
| 19 to 25 Years | 169 (61.9%) | 104 (38.1%) |
| 26 to 34 Years | 404 (69.3%) | 179 (30.7%) |
| 35 to 44 Years | 776 (87.4%) | 112 (12.6%) |
| 45 to 54 Years | 549 (78.6%) | 149 (21.3%) |
| 55 to 64 Years | 637 (93.3%) | 46 (6.7%) |
| 65 to 74 Years | 692 (97.7%) | 16 (2.3%) |
| 75 Years and older | 602 (100.0%) | 0 (0.0%) |
| Total | 4,913 (88.7%) | 628 (11.3%) |
Health Insurance Coverage by Citizenship Status in Salida
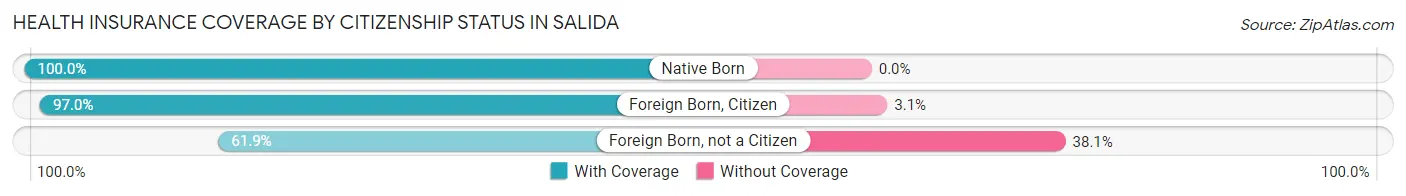
| Citizenship Status | With Coverage | Without Coverage |
| Native Born | 385 (100.0%) | 0 (0.0%) |
| Foreign Born, Citizen | 699 (97.0%) | 22 (3.0%) |
| Foreign Born, not a Citizen | 169 (61.9%) | 104 (38.1%) |
Health Insurance Coverage by Household Income in Salida
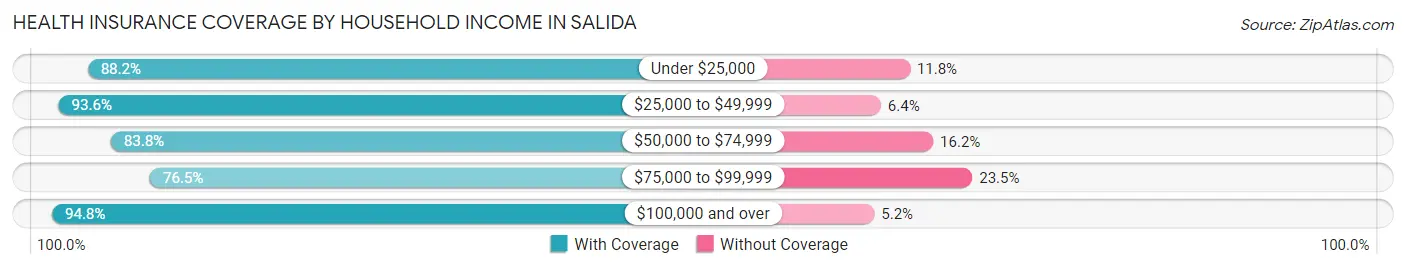
| Household Income | With Coverage | Without Coverage |
| Under $25,000 | 708 (88.2%) | 95 (11.8%) |
| $25,000 to $49,999 | 850 (93.6%) | 58 (6.4%) |
| $50,000 to $74,999 | 1,057 (83.8%) | 204 (16.2%) |
| $75,000 to $99,999 | 582 (76.5%) | 179 (23.5%) |
| $100,000 and over | 1,691 (94.8%) | 92 (5.2%) |
Public vs Private Health Insurance Coverage by Age in Salida
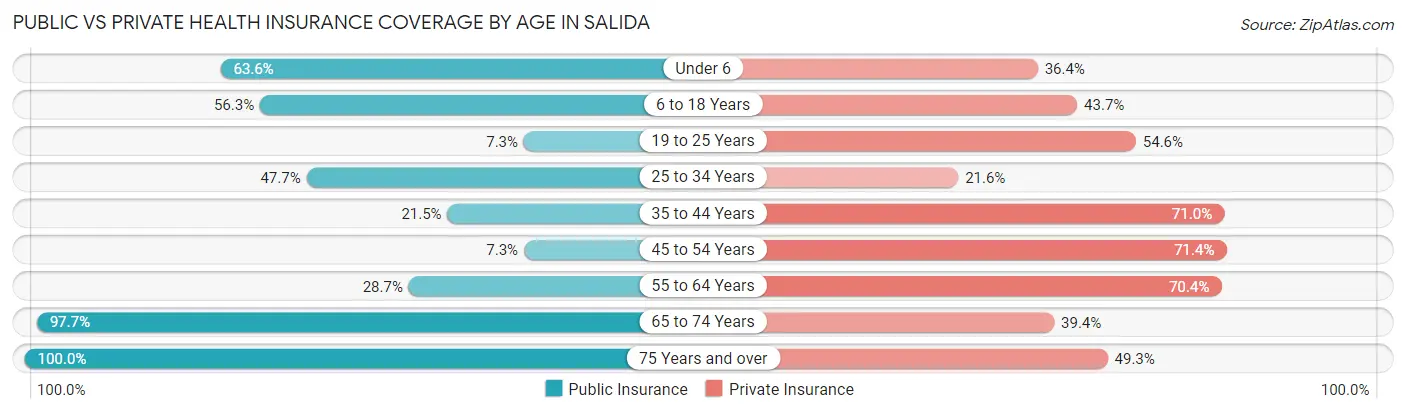
| Age Bracket | Public Insurance | Private Insurance |
| Under 6 | 245 (63.6%) | 140 (36.4%) |
| 6 to 18 Years | 406 (56.3%) | 315 (43.7%) |
| 19 to 25 Years | 20 (7.3%) | 149 (54.6%) |
| 25 to 34 Years | 278 (47.7%) | 126 (21.6%) |
| 35 to 44 Years | 191 (21.5%) | 630 (71.0%) |
| 45 to 54 Years | 51 (7.3%) | 498 (71.4%) |
| 55 to 64 Years | 196 (28.7%) | 481 (70.4%) |
| 65 to 74 Years | 692 (97.7%) | 279 (39.4%) |
| 75 Years and over | 602 (100.0%) | 297 (49.3%) |
| Total | 2,681 (48.4%) | 2,915 (52.6%) |
Disability Status by Sex by Age in Salida
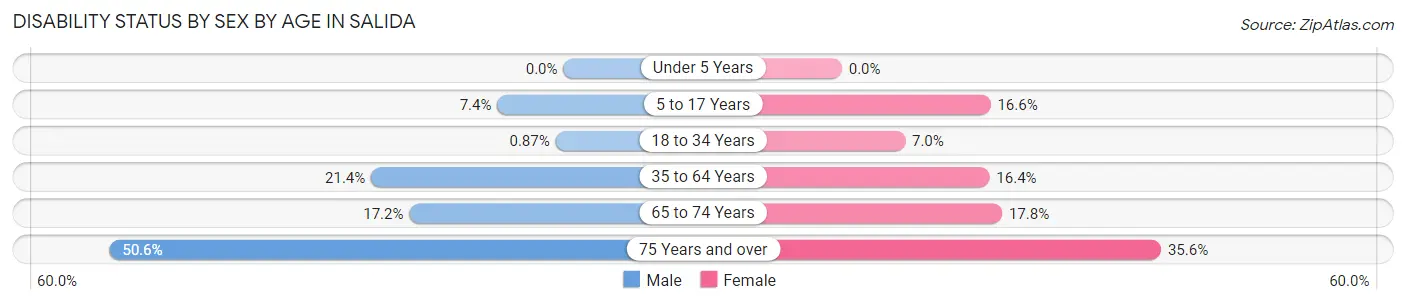
| Age Bracket | Male | Female |
| Under 5 Years | 0 (0.0%) | 0 (0.0%) |
| 5 to 17 Years | 29 (7.4%) | 54 (16.6%) |
| 18 to 34 Years | 3 (0.9%) | 38 (7.0%) |
| 35 to 64 Years | 207 (21.4%) | 214 (16.4%) |
| 65 to 74 Years | 58 (17.2%) | 66 (17.8%) |
| 75 Years and over | 91 (50.6%) | 150 (35.5%) |
Disability Class by Sex by Age in Salida
Disability Class: Hearing Difficulty
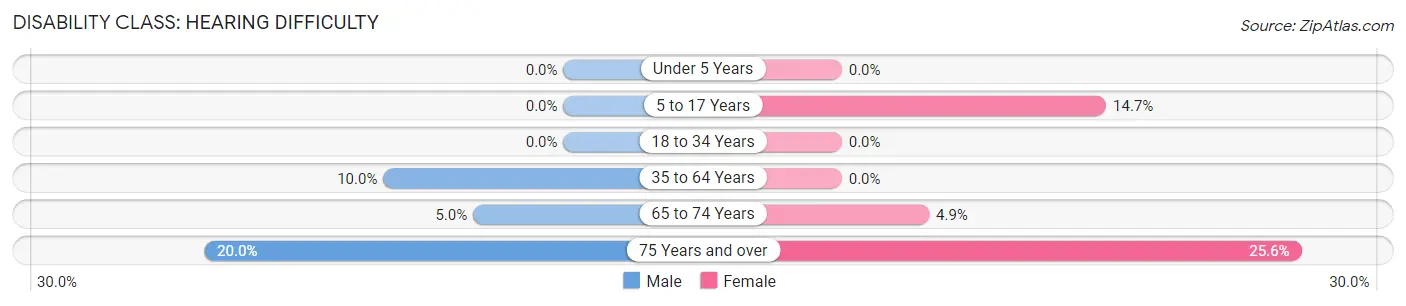
| Age Bracket | Male | Female |
| Under 5 Years | 0 (0.0%) | 0 (0.0%) |
| 5 to 17 Years | 0 (0.0%) | 48 (14.7%) |
| 18 to 34 Years | 0 (0.0%) | 0 (0.0%) |
| 35 to 64 Years | 97 (10.0%) | 0 (0.0%) |
| 65 to 74 Years | 17 (5.0%) | 18 (4.9%) |
| 75 Years and over | 36 (20.0%) | 108 (25.6%) |
Disability Class: Vision Difficulty
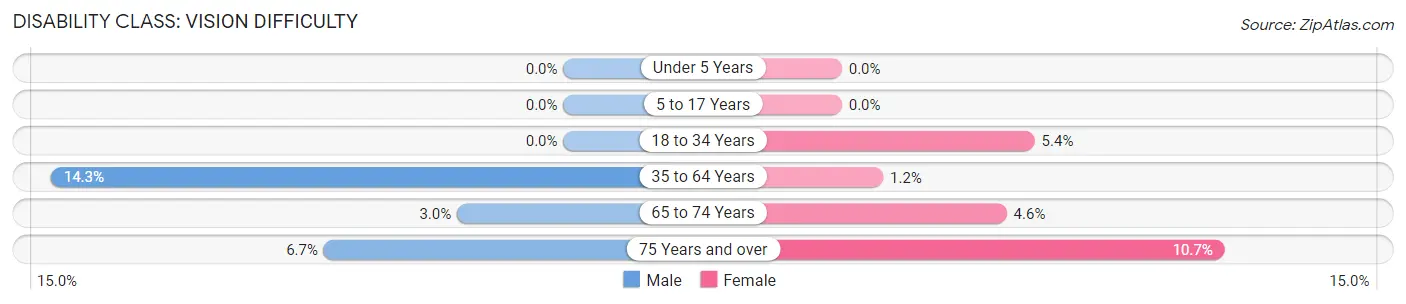
| Age Bracket | Male | Female |
| Under 5 Years | 0 (0.0%) | 0 (0.0%) |
| 5 to 17 Years | 0 (0.0%) | 0 (0.0%) |
| 18 to 34 Years | 0 (0.0%) | 29 (5.4%) |
| 35 to 64 Years | 138 (14.3%) | 15 (1.1%) |
| 65 to 74 Years | 10 (3.0%) | 17 (4.6%) |
| 75 Years and over | 12 (6.7%) | 45 (10.7%) |
Disability Class: Cognitive Difficulty
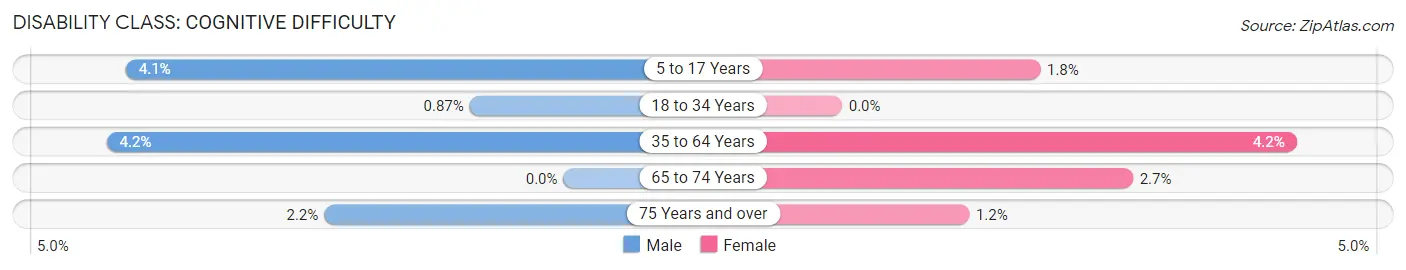
| Age Bracket | Male | Female |
| 5 to 17 Years | 16 (4.1%) | 6 (1.8%) |
| 18 to 34 Years | 3 (0.9%) | 0 (0.0%) |
| 35 to 64 Years | 41 (4.2%) | 55 (4.2%) |
| 65 to 74 Years | 0 (0.0%) | 10 (2.7%) |
| 75 Years and over | 4 (2.2%) | 5 (1.2%) |
Disability Class: Ambulatory Difficulty
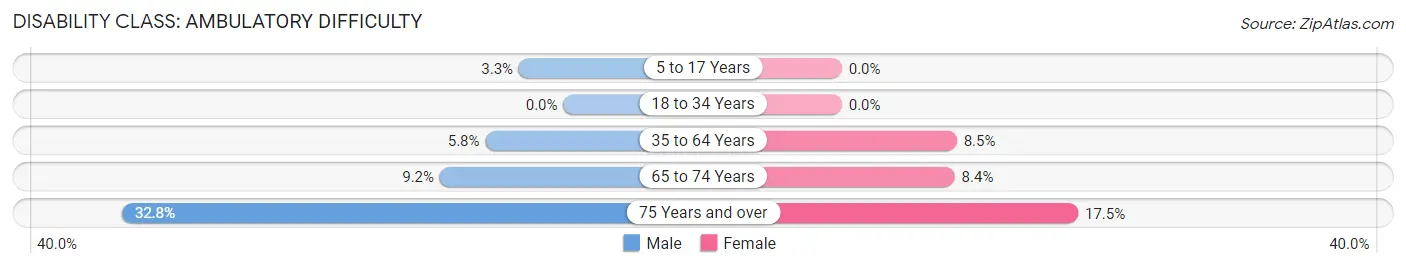
| Age Bracket | Male | Female |
| 5 to 17 Years | 13 (3.3%) | 0 (0.0%) |
| 18 to 34 Years | 0 (0.0%) | 0 (0.0%) |
| 35 to 64 Years | 56 (5.8%) | 111 (8.5%) |
| 65 to 74 Years | 31 (9.2%) | 31 (8.4%) |
| 75 Years and over | 59 (32.8%) | 74 (17.5%) |
Disability Class: Self-Care Difficulty
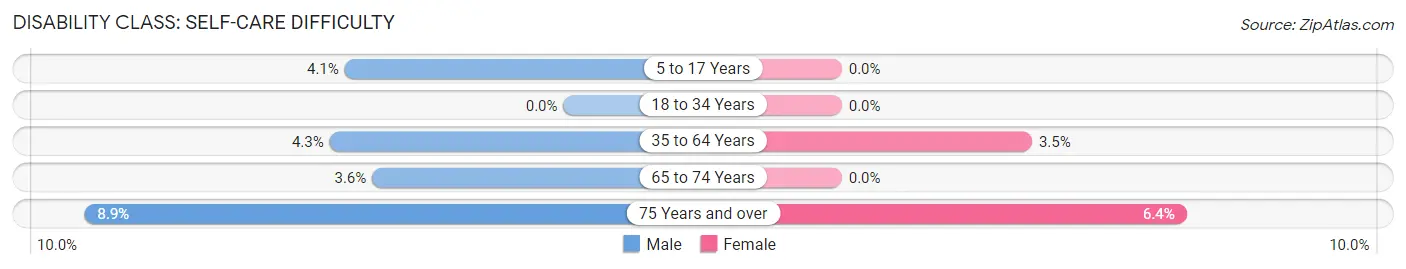
| Age Bracket | Male | Female |
| 5 to 17 Years | 16 (4.1%) | 0 (0.0%) |
| 18 to 34 Years | 0 (0.0%) | 0 (0.0%) |
| 35 to 64 Years | 42 (4.3%) | 46 (3.5%) |
| 65 to 74 Years | 12 (3.5%) | 0 (0.0%) |
| 75 Years and over | 16 (8.9%) | 27 (6.4%) |
Technology Access in Salida
Computing Device Access in Salida
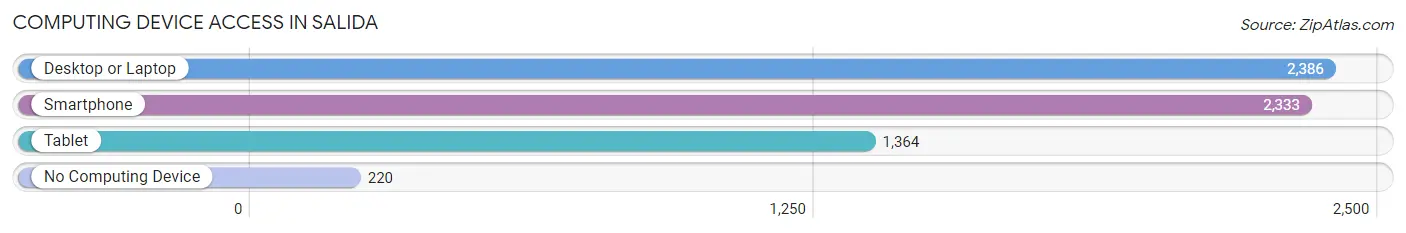
| Device Type | # Households | % Households |
| Desktop or Laptop | 2,386 | 86.1% |
| Smartphone | 2,333 | 84.2% |
| Tablet | 1,364 | 49.2% |
| No Computing Device | 220 | 7.9% |
| Total | 2,770 | 100.0% |
Internet Access in Salida
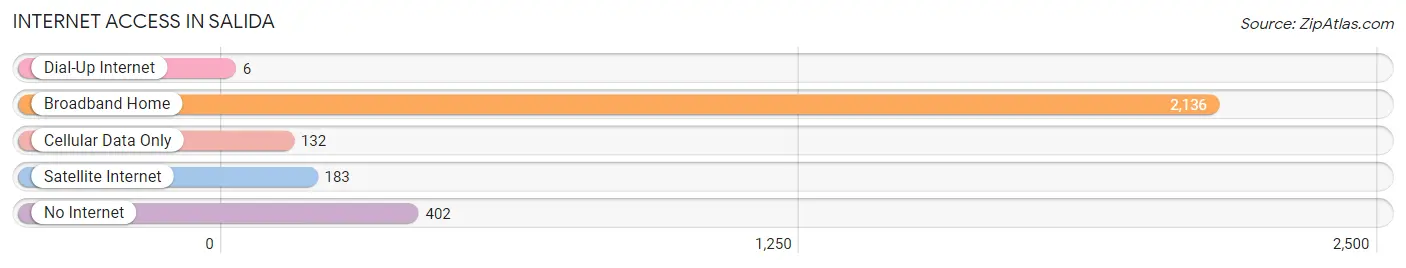
| Internet Type | # Households | % Households |
| Dial-Up Internet | 6 | 0.2% |
| Broadband Home | 2,136 | 77.1% |
| Cellular Data Only | 132 | 4.8% |
| Satellite Internet | 183 | 6.6% |
| No Internet | 402 | 14.5% |
| Total | 2,770 | 100.0% |
Salida Summary
Salida, Colorado is a small town located in the heart of the Rocky Mountains in Chaffee County. It is situated at an elevation of 7,000 feet and is surrounded by the majestic Collegiate Peaks. Salida is known for its stunning mountain views, outdoor recreation opportunities, and vibrant arts and culture scene.
History
Salida was founded in 1880 by the Denver and Rio Grande Railroad. The town was named after the Spanish word for “exit”, as it was the last stop on the railroad line before heading into the mountains. Salida quickly became a popular destination for tourists and adventurers, and the town grew rapidly. In 1881, the first post office was established and the town was officially incorporated in 1887.
In the early 1900s, Salida was a bustling hub of activity. The town was home to several businesses, including a brewery, a flour mill, and a sawmill. The railroad was the main source of employment, and the town was a popular stop for travelers.
In the 1950s, Salida began to experience a decline in population as the railroad industry began to decline. However, the town was revitalized in the 1970s when it became a popular destination for outdoor recreation. The town has since become a popular destination for tourists and outdoor enthusiasts.
Geography
Salida is located in the heart of the Rocky Mountains in Chaffee County. The town is situated at an elevation of 7,000 feet and is surrounded by the majestic Collegiate Peaks. The Arkansas River runs through the town, providing a beautiful backdrop for outdoor activities.
The town is located in a semi-arid climate, with hot summers and cold winters. The average annual temperature is around 50 degrees Fahrenheit. The town receives an average of 16 inches of precipitation per year, with most of it falling in the form of snow.
Economy
The economy of Salida is largely based on tourism and outdoor recreation. The town is home to several ski resorts, including Monarch Mountain and Ski Cooper. The town is also a popular destination for hikers, campers, and other outdoor enthusiasts.
The town is also home to several businesses, including restaurants, retail stores, and art galleries. The town is also home to several manufacturing companies, including a brewery and a sawmill.
Demographics
As of the 2020 census, the population of Salida was 5,845. The town has a median age of 44.7 years, with a gender ratio of 51.3% female and 48.7% male. The median household income is $50,945, and the median home value is $323,400.
The town is predominantly white, with a population that is 94.3% white, 1.3% Hispanic or Latino, 1.2% Native American, 0.7% Asian, and 0.5% African American. The town is also home to a small population of Native Americans, including the Ute and Arapaho tribes.
Conclusion
Salida, Colorado is a small town located in the heart of the Rocky Mountains in Chaffee County. It is known for its stunning mountain views, outdoor recreation opportunities, and vibrant arts and culture scene. The town has a diverse economy based on tourism and outdoor recreation, and a population that is predominantly white. Salida is a popular destination for tourists and outdoor enthusiasts, and is a great place to live and visit.
Common Questions
What is Per Capita Income in Salida?
Per Capita income in Salida is $38,081.
What is the Median Family Income in Salida?
Median Family Income in Salida is $67,625.
What is the Median Household income in Salida?
Median Household Income in Salida is $63,775.
What is Income or Wage Gap in Salida?
Income or Wage Gap in Salida is 13.7%.
Women in Salida earn 86.3 cents for every dollar earned by a man.
What is Inequality or Gini Index in Salida?
Inequality or Gini Index in Salida is 0.47.
What is the Total Population of Salida?
Total Population of Salida is 5,697.
What is the Total Male Population of Salida?
Total Male Population of Salida is 2,623.
What is the Total Female Population of Salida?
Total Female Population of Salida is 3,074.
What is the Ratio of Males per 100 Females in Salida?
There are 85.33 Males per 100 Females in Salida.
What is the Ratio of Females per 100 Males in Salida?
There are 117.19 Females per 100 Males in Salida.
What is the Median Population Age in Salida?
Median Population Age in Salida is 44.3 Years.
What is the Average Family Size in Salida
Average Family Size in Salida is 2.5 People.
What is the Average Household Size in Salida
Average Household Size in Salida is 2.0 People.
How Large is the Labor Force in Salida?
There are 2,931 People in the Labor Forcein in Salida.
What is the Percentage of People in the Labor Force in Salida?
61.3% of People are in the Labor Force in Salida.
What is the Unemployment Rate in Salida?
Unemployment Rate in Salida is 3.5%.