Saguache, CO Map & Demographics
Saguache Map
Saguache Overview
$24,423
PER CAPITA INCOME
$53,393
AVG FAMILY INCOME
$35,795
AVG HOUSEHOLD INCOME
0.31
INEQUALITY / GINI INDEX
535
TOTAL POPULATION
334
MALE POPULATION
201
FEMALE POPULATION
166.17
MALES / 100 FEMALES
60.18
FEMALES / 100 MALES
45.7
MEDIAN AGE
2.9
AVG FAMILY SIZE
1.9
AVG HOUSEHOLD SIZE
232
LABOR FORCE [ PEOPLE ]
51.6%
PERCENT IN LABOR FORCE
14.2%
UNEMPLOYMENT RATE
Saguache Zip Codes
Saguache Area Codes
Income in Saguache
Income Overview in Saguache
Per Capita Income in Saguache is $24,423, while median incomes of families and households are $53,393 and $35,795 respectively.
| Characteristic | Number | Measure |
| Per Capita Income | 535 | $24,423 |
| Median Family Income | 107 | $53,393 |
| Mean Family Income | 107 | $54,534 |
| Median Household Income | 268 | $35,795 |
| Mean Household Income | 268 | $45,639 |
| Income Deficit | 107 | $0 |
| Wage / Income Gap (%) | 535 | 0.00% |
| Wage / Income Gap ($) | 535 | 100.00¢ per $1 |
| Gini / Inequality Index | 535 | 0.31 |
Earnings by Sex in Saguache
| Sex | Number | Average Earnings |
| Male | 132 (59.2%) | $0 |
| Female | 91 (40.8%) | $0 |
| Total | 223 (100.0%) | $0 |
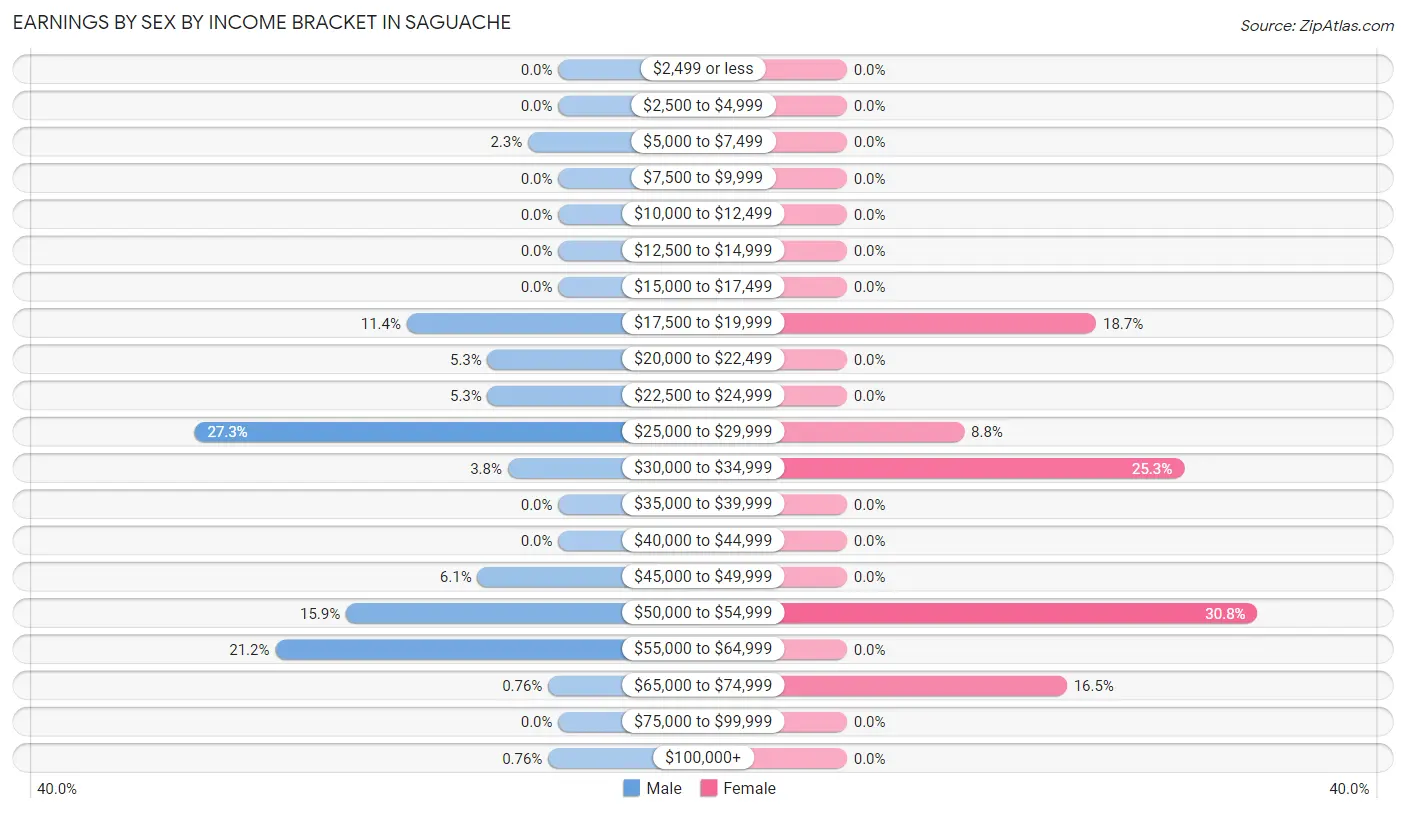
Earnings by Sex by Income Bracket in Saguache
The most common earnings brackets in Saguache are $25,000 to $29,999 for men (36 | 27.3%) and $50,000 to $54,999 for women (28 | 30.8%).
| Income | Male | Female |
| $2,499 or less | 0 (0.0%) | 0 (0.0%) |
| $2,500 to $4,999 | 0 (0.0%) | 0 (0.0%) |
| $5,000 to $7,499 | 3 (2.3%) | 0 (0.0%) |
| $7,500 to $9,999 | 0 (0.0%) | 0 (0.0%) |
| $10,000 to $12,499 | 0 (0.0%) | 0 (0.0%) |
| $12,500 to $14,999 | 0 (0.0%) | 0 (0.0%) |
| $15,000 to $17,499 | 0 (0.0%) | 0 (0.0%) |
| $17,500 to $19,999 | 15 (11.4%) | 17 (18.7%) |
| $20,000 to $22,499 | 7 (5.3%) | 0 (0.0%) |
| $22,500 to $24,999 | 7 (5.3%) | 0 (0.0%) |
| $25,000 to $29,999 | 36 (27.3%) | 8 (8.8%) |
| $30,000 to $34,999 | 5 (3.8%) | 23 (25.3%) |
| $35,000 to $39,999 | 0 (0.0%) | 0 (0.0%) |
| $40,000 to $44,999 | 0 (0.0%) | 0 (0.0%) |
| $45,000 to $49,999 | 8 (6.1%) | 0 (0.0%) |
| $50,000 to $54,999 | 21 (15.9%) | 28 (30.8%) |
| $55,000 to $64,999 | 28 (21.2%) | 0 (0.0%) |
| $65,000 to $74,999 | 1 (0.8%) | 15 (16.5%) |
| $75,000 to $99,999 | 0 (0.0%) | 0 (0.0%) |
| $100,000+ | 1 (0.8%) | 0 (0.0%) |
| Total | 132 (100.0%) | 91 (100.0%) |
Earnings by Sex by Educational Attainment in Saguache
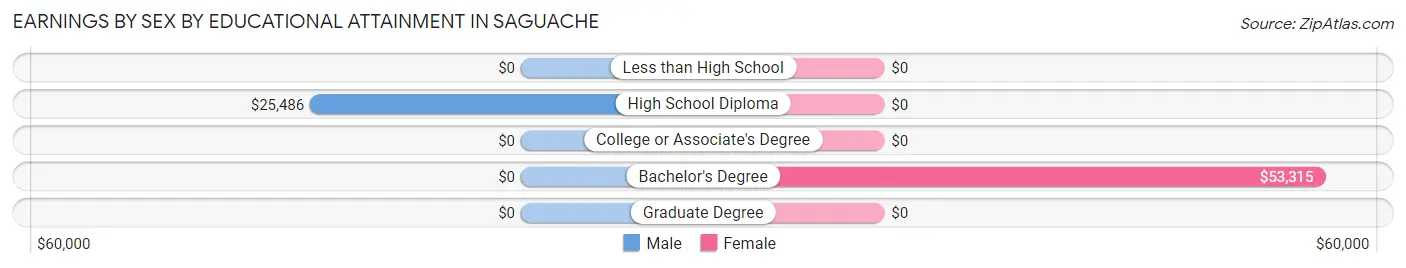
| Educational Attainment | Male Income | Female Income |
| Less than High School | - | - |
| High School Diploma | $25,486 | $0 |
| College or Associate's Degree | - | - |
| Bachelor's Degree | - | - |
| Graduate Degree | - | - |
| Total | - | - |
Family Income in Saguache
Family Income Brackets in Saguache
According to the Saguache family income data, there are 35 families falling into the $50,000 to $74,999 income range, which is the most common income bracket and makes up 32.7% of all families.
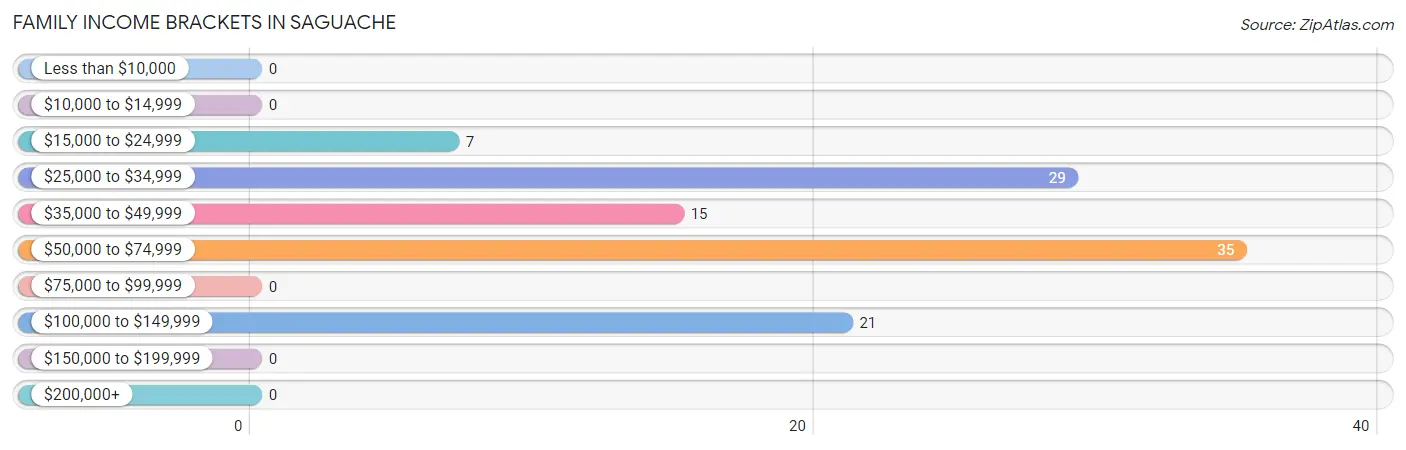
| Income Bracket | # Families | % Families |
| Less than $10,000 | 0 | 0.0% |
| $10,000 to $14,999 | 0 | 0.0% |
| $15,000 to $24,999 | 7 | 6.5% |
| $25,000 to $34,999 | 29 | 27.1% |
| $35,000 to $49,999 | 15 | 14.0% |
| $50,000 to $74,999 | 35 | 32.7% |
| $75,000 to $99,999 | 0 | 0.0% |
| $100,000 to $149,999 | 21 | 19.6% |
| $150,000 to $199,999 | 0 | 0.0% |
| $200,000+ | 0 | 0.0% |
Family Income by Famaliy Size in Saguache
| Income Bracket | # Families | Median Income |
| 2-Person Families | 64 (59.8%) | $0 |
| 3-Person Families | 7 (6.5%) | $0 |
| 4-Person Families | 36 (33.6%) | $0 |
| 5-Person Families | 0 (0.0%) | $0 |
| 6-Person Families | 0 (0.0%) | $0 |
| 7+ Person Families | 0 (0.0%) | $0 |
| Total | 107 (100.0%) | $53,393 |
Family Income by Number of Earners in Saguache
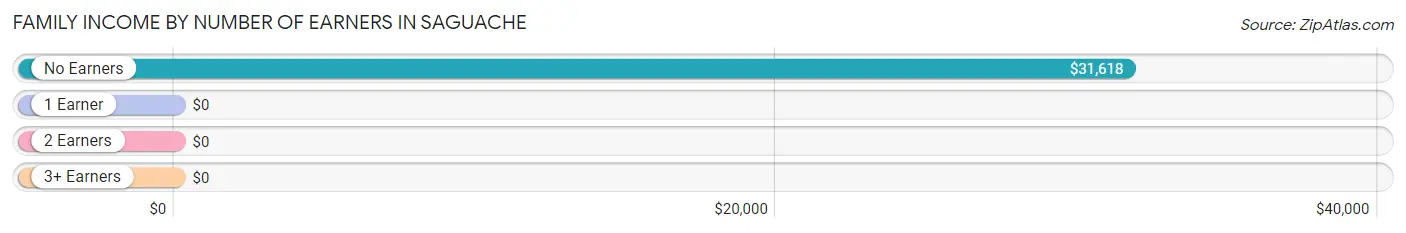
| Number of Earners | # Families | Median Income |
| No Earners | 36 (33.6%) | $31,618 |
| 1 Earner | 22 (20.6%) | $0 |
| 2 Earners | 49 (45.8%) | $0 |
| 3+ Earners | 0 (0.0%) | $0 |
| Total | 107 (100.0%) | $53,393 |
Household Income in Saguache
Household Income Brackets in Saguache
With 87 households falling in the category, the $50,000 to $74,999 income range is the most frequent in Saguache, accounting for 32.5% of all households.
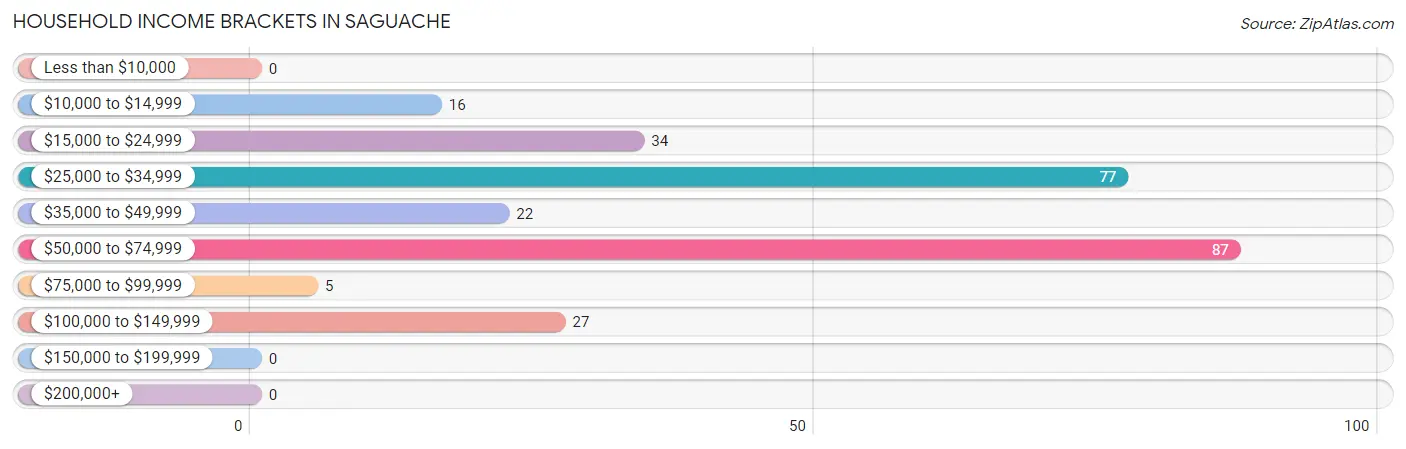
| Income Bracket | # Households | % Households |
| Less than $10,000 | 0 | 0.0% |
| $10,000 to $14,999 | 16 | 6.0% |
| $15,000 to $24,999 | 34 | 12.7% |
| $25,000 to $34,999 | 77 | 28.7% |
| $35,000 to $49,999 | 22 | 8.2% |
| $50,000 to $74,999 | 87 | 32.5% |
| $75,000 to $99,999 | 5 | 1.9% |
| $100,000 to $149,999 | 27 | 10.1% |
| $150,000 to $199,999 | 0 | 0.0% |
| $200,000+ | 0 | 0.0% |
Household Income by Householder Age in Saguache
The median household income in Saguache is $35,795, with the highest median household income of $51,739 found in the 45 to 64 years age bracket for the primary householder. A total of 140 households (52.2%) fall into this category. Meanwhile, the 15 to 24 years age bracket for the primary householder has the lowest median household income of $0, with 5 households (1.9%) in this group.
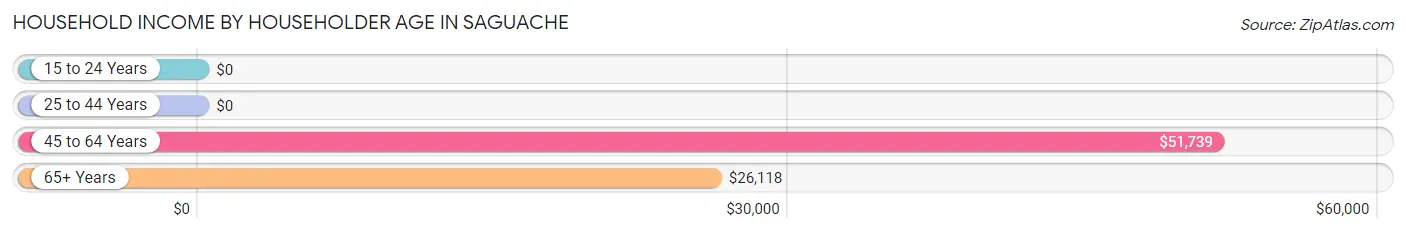
| Income Bracket | # Households | Median Income |
| 15 to 24 Years | 5 (1.9%) | $0 |
| 25 to 44 Years | 50 (18.7%) | $0 |
| 45 to 64 Years | 140 (52.2%) | $51,739 |
| 65+ Years | 73 (27.2%) | $26,118 |
| Total | 268 (100.0%) | $35,795 |
Poverty in Saguache
Income Below Poverty by Sex and Age in Saguache
With 4.0% poverty level for males and 5.0% for females among the residents of Saguache, 75 year old and over males and 65 to 74 year old females are the most vulnerable to poverty, with 9 males (50.0%) and 10 females (43.5%) in their respective age groups living below the poverty level.
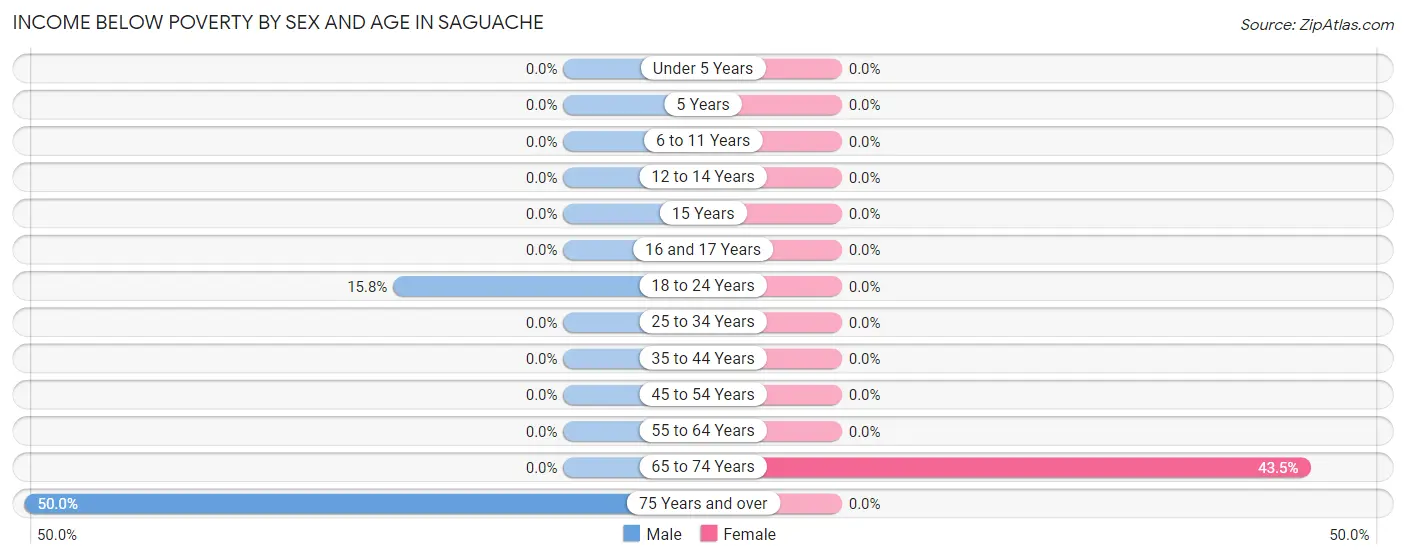
| Age Bracket | Male | Female |
| Under 5 Years | 0 (0.0%) | 0 (0.0%) |
| 5 Years | 0 (0.0%) | 0 (0.0%) |
| 6 to 11 Years | 0 (0.0%) | 0 (0.0%) |
| 12 to 14 Years | 0 (0.0%) | 0 (0.0%) |
| 15 Years | 0 (0.0%) | 0 (0.0%) |
| 16 and 17 Years | 0 (0.0%) | 0 (0.0%) |
| 18 to 24 Years | 3 (15.8%) | 0 (0.0%) |
| 25 to 34 Years | 0 (0.0%) | 0 (0.0%) |
| 35 to 44 Years | 0 (0.0%) | 0 (0.0%) |
| 45 to 54 Years | 0 (0.0%) | 0 (0.0%) |
| 55 to 64 Years | 0 (0.0%) | 0 (0.0%) |
| 65 to 74 Years | 0 (0.0%) | 10 (43.5%) |
| 75 Years and over | 9 (50.0%) | 0 (0.0%) |
| Total | 12 (4.0%) | 10 (5.0%) |
Income Above Poverty by Sex and Age in Saguache
According to the poverty statistics in Saguache, males aged 6 to 11 years and females aged under 5 years are the age groups that are most secure financially, with 100.0% of males and 100.0% of females in these age groups living above the poverty line.
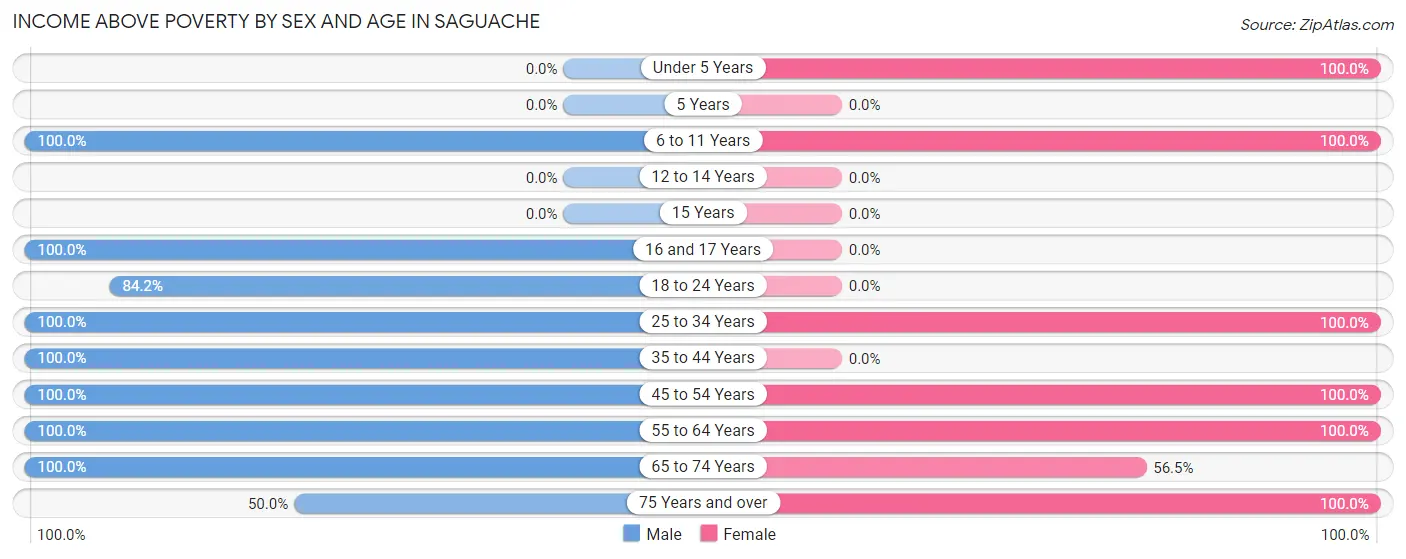
| Age Bracket | Male | Female |
| Under 5 Years | 0 (0.0%) | 13 (100.0%) |
| 5 Years | 0 (0.0%) | 0 (0.0%) |
| 6 to 11 Years | 47 (100.0%) | 25 (100.0%) |
| 12 to 14 Years | 0 (0.0%) | 0 (0.0%) |
| 15 Years | 0 (0.0%) | 0 (0.0%) |
| 16 and 17 Years | 17 (100.0%) | 0 (0.0%) |
| 18 to 24 Years | 16 (84.2%) | 0 (0.0%) |
| 25 to 34 Years | 36 (100.0%) | 47 (100.0%) |
| 35 to 44 Years | 28 (100.0%) | 0 (0.0%) |
| 45 to 54 Years | 37 (100.0%) | 28 (100.0%) |
| 55 to 64 Years | 80 (100.0%) | 32 (100.0%) |
| 65 to 74 Years | 19 (100.0%) | 13 (56.5%) |
| 75 Years and over | 9 (50.0%) | 31 (100.0%) |
| Total | 289 (96.0%) | 189 (95.0%) |
Income Below Poverty Among Married-Couple Families in Saguache
The poverty statistics for married-couple families in Saguache show that 8.9% or 7 of the total 79 families live below the poverty line. Families with no children have the highest poverty rate of 19.4%, comprising of 7 families. On the other hand, families with 1 or 2 children have the lowest poverty rate of 0.0%, which includes 0 families.
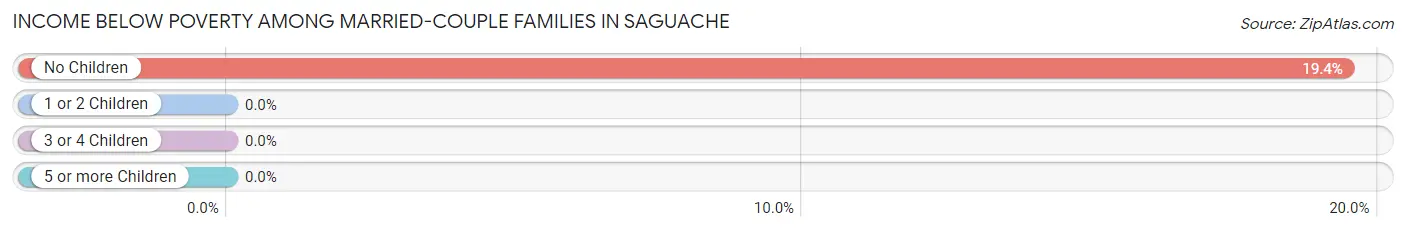
| Children | Above Poverty | Below Poverty |
| No Children | 29 (80.6%) | 7 (19.4%) |
| 1 or 2 Children | 43 (100.0%) | 0 (0.0%) |
| 3 or 4 Children | 0 (0.0%) | 0 (0.0%) |
| 5 or more Children | 0 (0.0%) | 0 (0.0%) |
| Total | 72 (91.1%) | 7 (8.9%) |
Income Below Poverty Among Single-Parent Households in Saguache
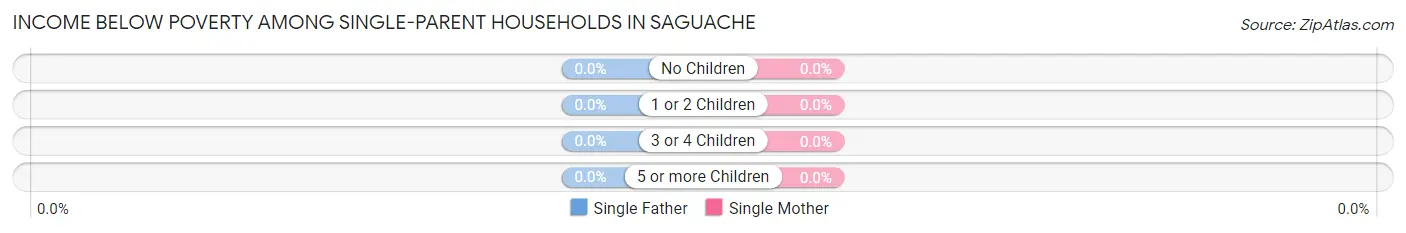
| Children | Single Father | Single Mother |
| No Children | 0 (0.0%) | 0 (0.0%) |
| 1 or 2 Children | 0 (0.0%) | 0 (0.0%) |
| 3 or 4 Children | 0 (0.0%) | 0 (0.0%) |
| 5 or more Children | 0 (0.0%) | 0 (0.0%) |
| Total | 0 (0.0%) | 0 (0.0%) |
Income Below Poverty Among Married-Couple vs Single-Parent Households in Saguache
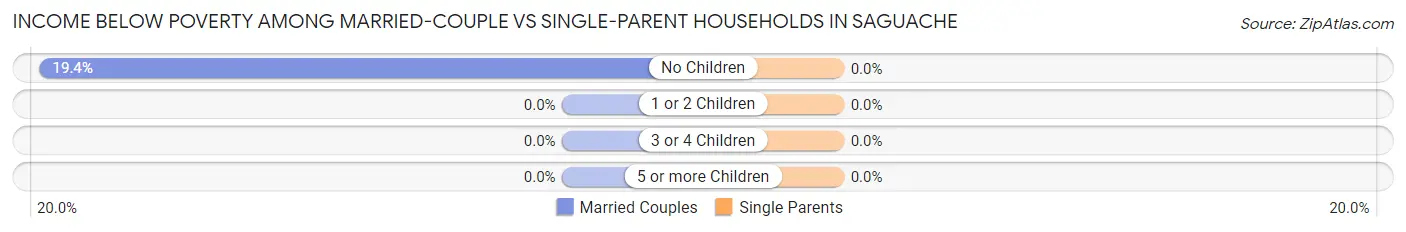
| Children | Married-Couple Families | Single-Parent Households |
| No Children | 7 (19.4%) | 0 (0.0%) |
| 1 or 2 Children | 0 (0.0%) | 0 (0.0%) |
| 3 or 4 Children | 0 (0.0%) | 0 (0.0%) |
| 5 or more Children | 0 (0.0%) | 0 (0.0%) |
| Total | 7 (8.9%) | 0 (0.0%) |
Race in Saguache
The most populous races in Saguache are White / Caucasian (446 | 83.4%), Hispanic or Latino (206 | 38.5%), and Some other Race (86 | 16.1%).
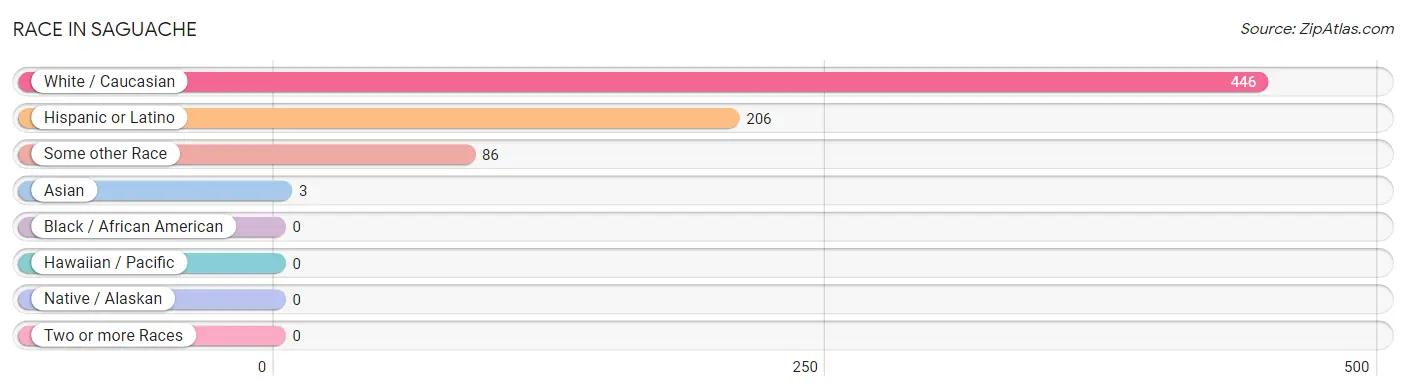
| Race | # Population | % Population |
| Asian | 3 | 0.6% |
| Black / African American | 0 | 0.0% |
| Hawaiian / Pacific | 0 | 0.0% |
| Hispanic or Latino | 206 | 38.5% |
| Native / Alaskan | 0 | 0.0% |
| White / Caucasian | 446 | 83.4% |
| Two or more Races | 0 | 0.0% |
| Some other Race | 86 | 16.1% |
| Total | 535 | 100.0% |
Ancestry in Saguache
The most populous ancestries reported in Saguache are German (96 | 17.9%), Mexican (71 | 13.3%), Irish (56 | 10.5%), Spanish (37 | 6.9%), and English (32 | 6.0%), together accounting for 54.6% of all Saguache residents.
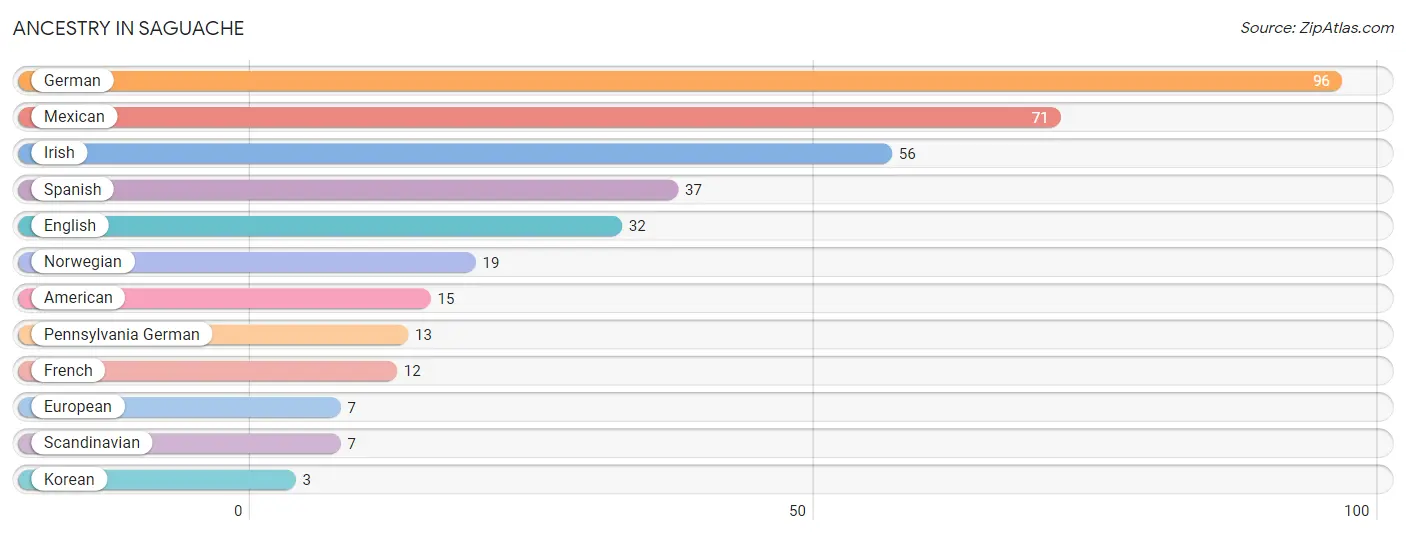
| Ancestry | # Population | % Population |
| American | 15 | 2.8% |
| English | 32 | 6.0% |
| European | 7 | 1.3% |
| French | 12 | 2.2% |
| German | 96 | 17.9% |
| Irish | 56 | 10.5% |
| Korean | 3 | 0.6% |
| Mexican | 71 | 13.3% |
| Norwegian | 19 | 3.5% |
| Pennsylvania German | 13 | 2.4% |
| Scandinavian | 7 | 1.3% |
| Spanish | 37 | 6.9% | View All 12 Rows |
Immigrants in Saguache

| Immigration Origin | # Population | % Population | View All 0 Rows |
Sex and Age in Saguache
Sex and Age in Saguache
The most populous age groups in Saguache are 60 to 64 Years (49 | 14.7%) for men and 55 to 59 Years (32 | 15.9%) for women.
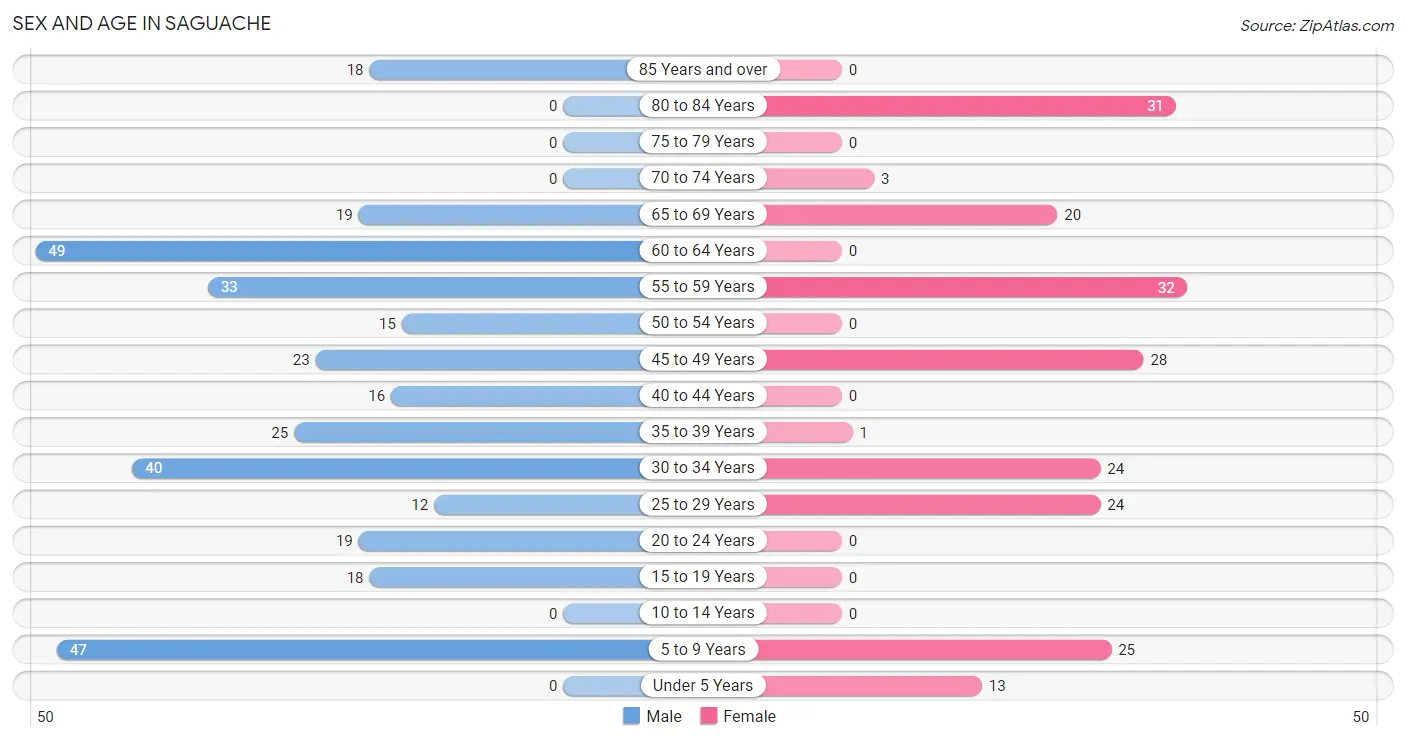
| Age Bracket | Male | Female |
| Under 5 Years | 0 (0.0%) | 13 (6.5%) |
| 5 to 9 Years | 47 (14.1%) | 25 (12.4%) |
| 10 to 14 Years | 0 (0.0%) | 0 (0.0%) |
| 15 to 19 Years | 18 (5.4%) | 0 (0.0%) |
| 20 to 24 Years | 19 (5.7%) | 0 (0.0%) |
| 25 to 29 Years | 12 (3.6%) | 24 (11.9%) |
| 30 to 34 Years | 40 (12.0%) | 24 (11.9%) |
| 35 to 39 Years | 25 (7.5%) | 1 (0.5%) |
| 40 to 44 Years | 16 (4.8%) | 0 (0.0%) |
| 45 to 49 Years | 23 (6.9%) | 28 (13.9%) |
| 50 to 54 Years | 15 (4.5%) | 0 (0.0%) |
| 55 to 59 Years | 33 (9.9%) | 32 (15.9%) |
| 60 to 64 Years | 49 (14.7%) | 0 (0.0%) |
| 65 to 69 Years | 19 (5.7%) | 20 (10.0%) |
| 70 to 74 Years | 0 (0.0%) | 3 (1.5%) |
| 75 to 79 Years | 0 (0.0%) | 0 (0.0%) |
| 80 to 84 Years | 0 (0.0%) | 31 (15.4%) |
| 85 Years and over | 18 (5.4%) | 0 (0.0%) |
| Total | 334 (100.0%) | 201 (100.0%) |
Families and Households in Saguache
Median Family Size in Saguache
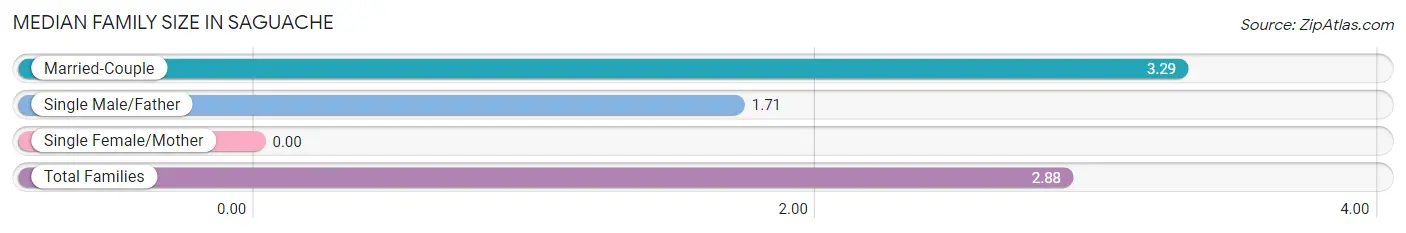
| Family Type | # Families | Family Size |
| Married-Couple | 79 (73.8%) | 3.29 |
| Single Male/Father | 28 (26.2%) | 1.71 |
| Single Female/Mother | 0 (0.0%) | - |
| Total Families | 107 (100.0%) | 2.88 |
Median Household Size in Saguache
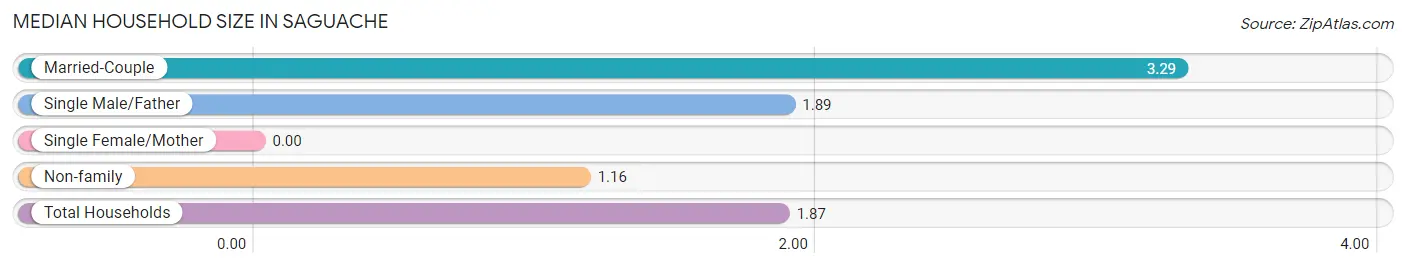
| Household Type | # Households | Household Size |
| Married-Couple | 79 (29.5%) | 3.29 |
| Single Male/Father | 28 (10.4%) | 1.89 |
| Single Female/Mother | 0 (0.0%) | - |
| Non-family | 161 (60.1%) | 1.16 |
| Total Households | 268 (100.0%) | 1.87 |
Household Size by Marriage Status in Saguache
Out of a total of 268 households in Saguache, 107 (39.9%) are family households, while 161 (60.1%) are nonfamily households. The most numerous type of family households are 2-person households, comprising 58, and the most common type of nonfamily households are 1-person households, comprising 133.
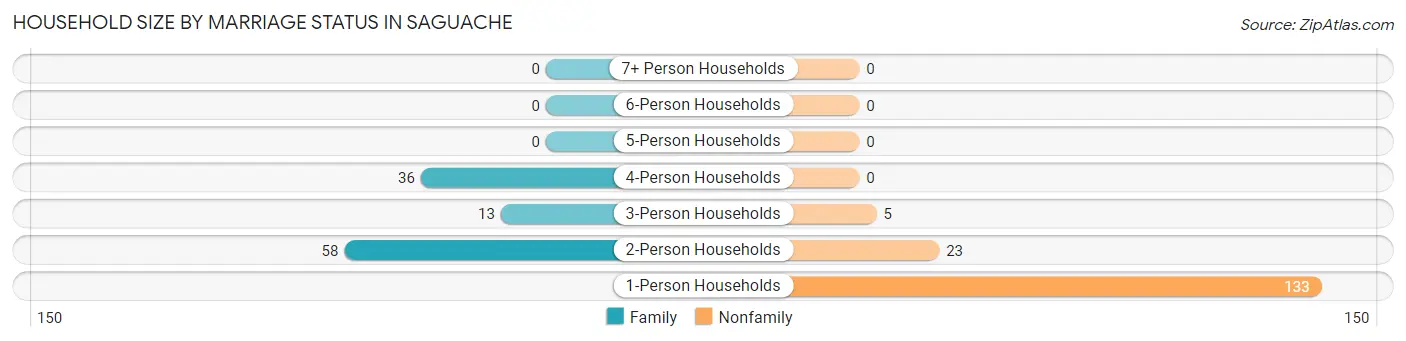
| Household Size | Family Households | Nonfamily Households |
| 1-Person Households | - | 133 (49.6%) |
| 2-Person Households | 58 (21.6%) | 23 (8.6%) |
| 3-Person Households | 13 (4.9%) | 5 (1.9%) |
| 4-Person Households | 36 (13.4%) | 0 (0.0%) |
| 5-Person Households | 0 (0.0%) | 0 (0.0%) |
| 6-Person Households | 0 (0.0%) | 0 (0.0%) |
| 7+ Person Households | 0 (0.0%) | 0 (0.0%) |
| Total | 107 (39.9%) | 161 (60.1%) |
Female Fertility in Saguache
Fertility by Age in Saguache
| Age Bracket | Women with Births | Births / 1,000 Women |
| 15 to 19 years | 0 (0.0%) | 0.0 |
| 20 to 34 years | 0 (0.0%) | 0.0 |
| 35 to 50 years | 0 (0.0%) | 0.0 |
| Total | 0 (0.0%) | 0.0 |
Fertility by Age by Marriage Status in Saguache
| Age Bracket | Married | Unmarried |
| 15 to 19 years | 0 (0.0%) | 0 (0.0%) |
| 20 to 34 years | 0 (0.0%) | 0 (0.0%) |
| 35 to 50 years | 0 (0.0%) | 0 (0.0%) |
| Total | 0 (0.0%) | 0 (0.0%) |
Fertility by Education in Saguache
| Educational Attainment | Women with Births | Births / 1,000 Women |
| Less than High School | 0 (0.0%) | 0.0 |
| High School Diploma | 0 (0.0%) | 0.0 |
| College or Associate's Degree | 0 (0.0%) | 0.0 |
| Bachelor's Degree | 0 (0.0%) | 0.0 |
| Graduate Degree | 0 (0.0%) | 0.0 |
| Total | 0 (0.0%) | 0.0 |
Fertility by Education by Marriage Status in Saguache
| Educational Attainment | Married | Unmarried |
| Less than High School | 0 (0.0%) | 0 (0.0%) |
| High School Diploma | 0 (0.0%) | 0 (0.0%) |
| College or Associate's Degree | 0 (0.0%) | 0 (0.0%) |
| Bachelor's Degree | 0 (0.0%) | 0 (0.0%) |
| Graduate Degree | 0 (0.0%) | 0 (0.0%) |
| Total | 0 (0.0%) | 0 (0.0%) |
Employment Characteristics in Saguache
Employment by Class of Employer in Saguache
Among the 199 employed individuals in Saguache, local government employees (51 | 25.6%), self-employed (not incorporated) (47 | 23.6%), and private company employees (36 | 18.1%) make up the most common classes of employment.
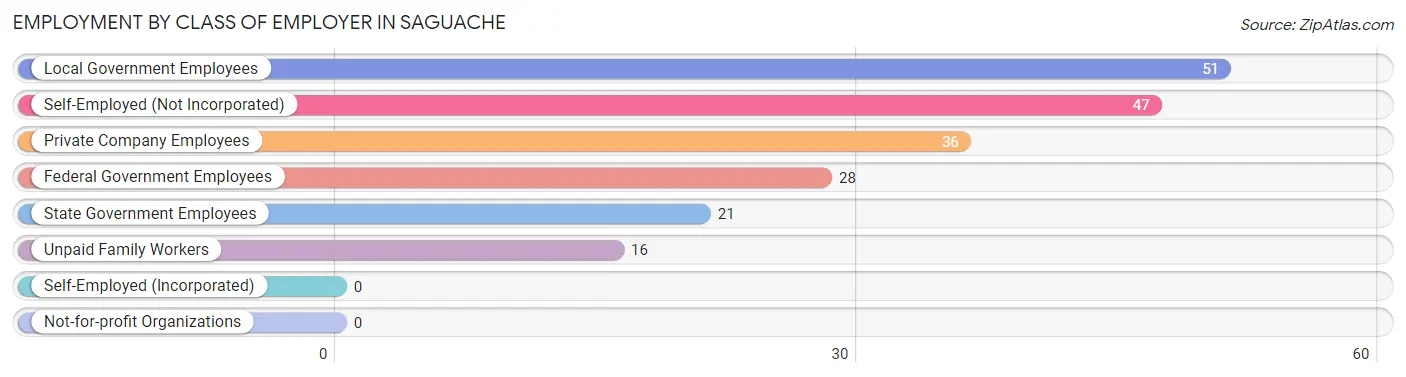
| Employer Class | # Employees | % Employees |
| Private Company Employees | 36 | 18.1% |
| Self-Employed (Incorporated) | 0 | 0.0% |
| Self-Employed (Not Incorporated) | 47 | 23.6% |
| Not-for-profit Organizations | 0 | 0.0% |
| Local Government Employees | 51 | 25.6% |
| State Government Employees | 21 | 10.5% |
| Federal Government Employees | 28 | 14.1% |
| Unpaid Family Workers | 16 | 8.0% |
| Total | 199 | 100.0% |
Employment Status by Age in Saguache
According to the labor force statistics for Saguache, out of the total population over 16 years of age (450), 51.6% or 232 individuals are in the labor force, with 14.2% or 33 of them unemployed. The age group with the highest labor force participation rate is 30 to 34 years, with 92.2% or 59 individuals in the labor force. Within the labor force, the 20 to 24 years age range has the highest percentage of unemployed individuals, with 50.0% or 8 of them being unemployed.
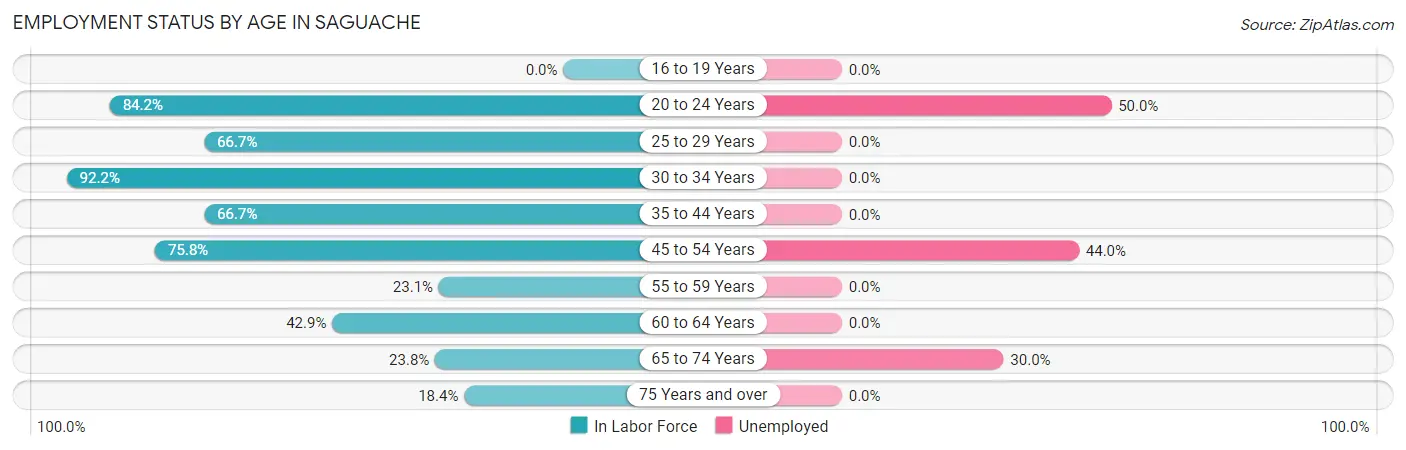
| Age Bracket | In Labor Force | Unemployed |
| 16 to 19 Years | 0 (0.0%) | 0 (0.0%) |
| 20 to 24 Years | 16 (84.2%) | 8 (50.0%) |
| 25 to 29 Years | 24 (66.7%) | 0 (0.0%) |
| 30 to 34 Years | 59 (92.2%) | 0 (0.0%) |
| 35 to 44 Years | 28 (66.7%) | 0 (0.0%) |
| 45 to 54 Years | 50 (75.8%) | 22 (44.0%) |
| 55 to 59 Years | 15 (23.1%) | 0 (0.0%) |
| 60 to 64 Years | 21 (42.9%) | 0 (0.0%) |
| 65 to 74 Years | 10 (23.8%) | 3 (30.0%) |
| 75 Years and over | 9 (18.4%) | 0 (0.0%) |
| Total | 232 (51.6%) | 33 (14.2%) |
Employment Status by Educational Attainment in Saguache
According to labor force statistics for Saguache, 61.2% of individuals (197) out of the total population between 25 and 64 years of age (322) are in the labor force, with 11.2% or 22 of them being unemployed. The group with the highest labor force participation rate are those with the educational attainment of bachelor's degree or higher, with 89.7% or 61 individuals in the labor force. Within the labor force, individuals with college / associate degree education have the highest percentage of unemployment, with 32.8% or 22 of them being unemployed.
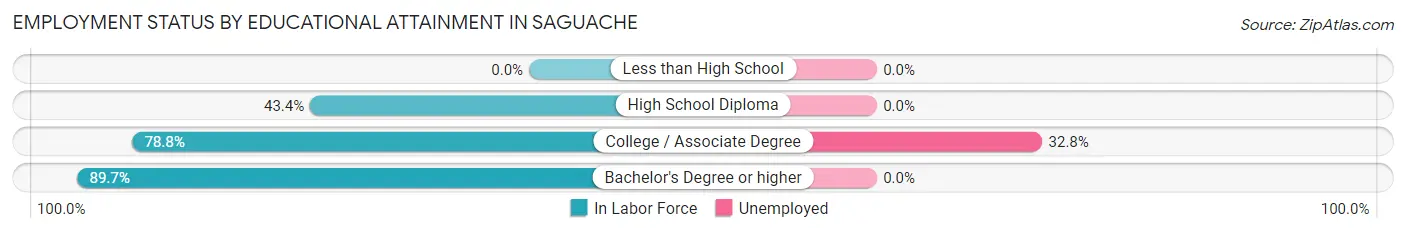
| Educational Attainment | In Labor Force | Unemployed |
| Less than High School | 0 (0.0%) | 0 (0.0%) |
| High School Diploma | 69 (43.4%) | 0 (0.0%) |
| College / Associate Degree | 67 (78.8%) | 28 (32.8%) |
| Bachelor's Degree or higher | 61 (89.7%) | 0 (0.0%) |
| Total | 197 (61.2%) | 36 (11.2%) |
Employment Occupations by Sex in Saguache
Management, Business, Science and Arts Occupations
The most common Management, Business, Science and Arts occupations in Saguache are Management (47 | 23.6%), Computers, Engineering & Science (23 | 11.6%), and Life, Physical & Social Science (23 | 11.6%).
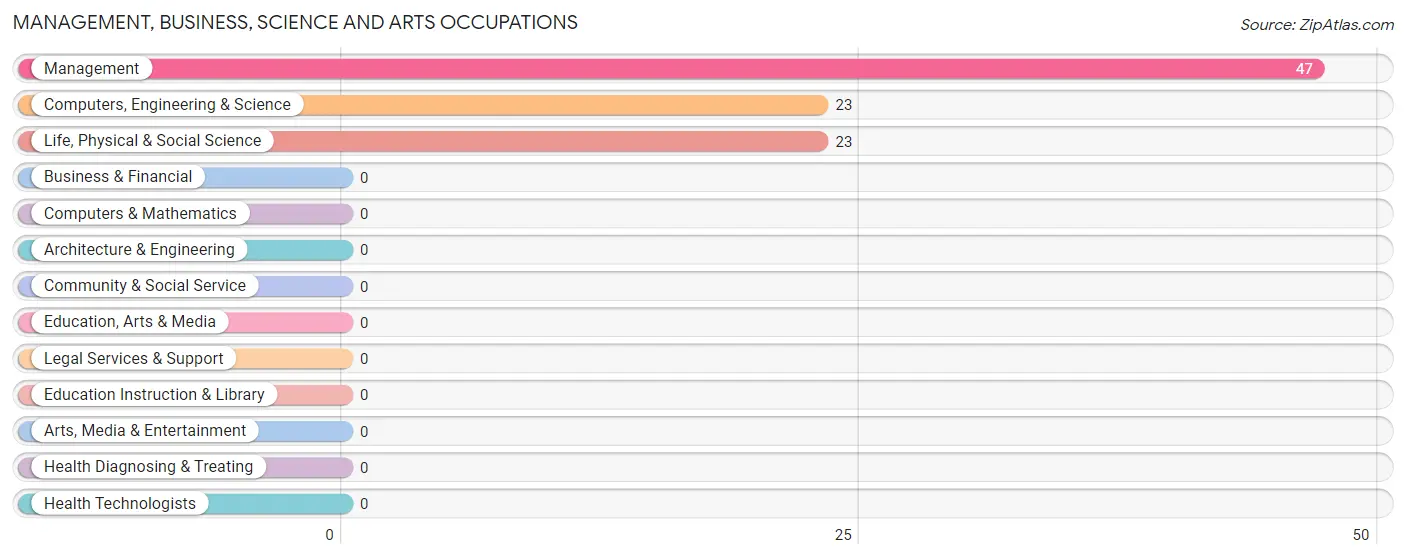
Management, Business, Science and Arts Occupations by Sex
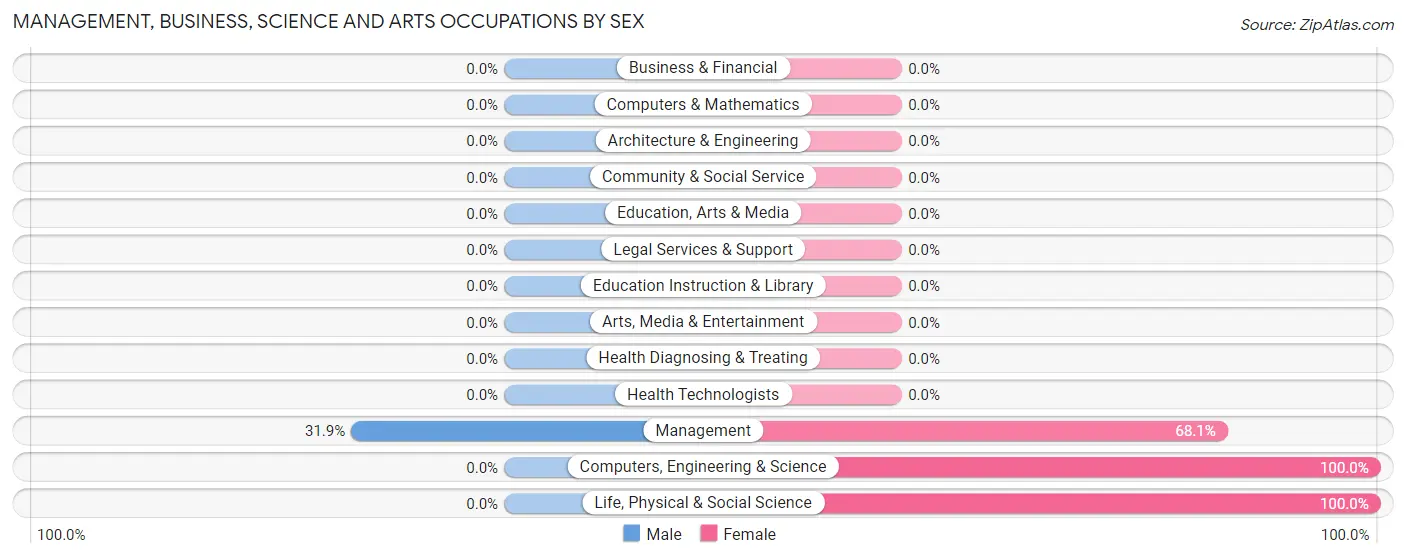
| Occupation | Male | Female |
| Management | 15 (31.9%) | 32 (68.1%) |
| Business & Financial | 0 (0.0%) | 0 (0.0%) |
| Computers, Engineering & Science | 0 (0.0%) | 23 (100.0%) |
| Computers & Mathematics | 0 (0.0%) | 0 (0.0%) |
| Architecture & Engineering | 0 (0.0%) | 0 (0.0%) |
| Life, Physical & Social Science | 0 (0.0%) | 23 (100.0%) |
| Community & Social Service | 0 (0.0%) | 0 (0.0%) |
| Education, Arts & Media | 0 (0.0%) | 0 (0.0%) |
| Legal Services & Support | 0 (0.0%) | 0 (0.0%) |
| Education Instruction & Library | 0 (0.0%) | 0 (0.0%) |
| Arts, Media & Entertainment | 0 (0.0%) | 0 (0.0%) |
| Health Diagnosing & Treating | 0 (0.0%) | 0 (0.0%) |
| Health Technologists | 0 (0.0%) | 0 (0.0%) |
| Total (Category) | 15 (21.4%) | 55 (78.6%) |
| Total (Overall) | 102 (51.3%) | 97 (48.7%) |
Services Occupations
The most common Services occupations in Saguache are , and Personal Care & Service (7 | 3.5%).
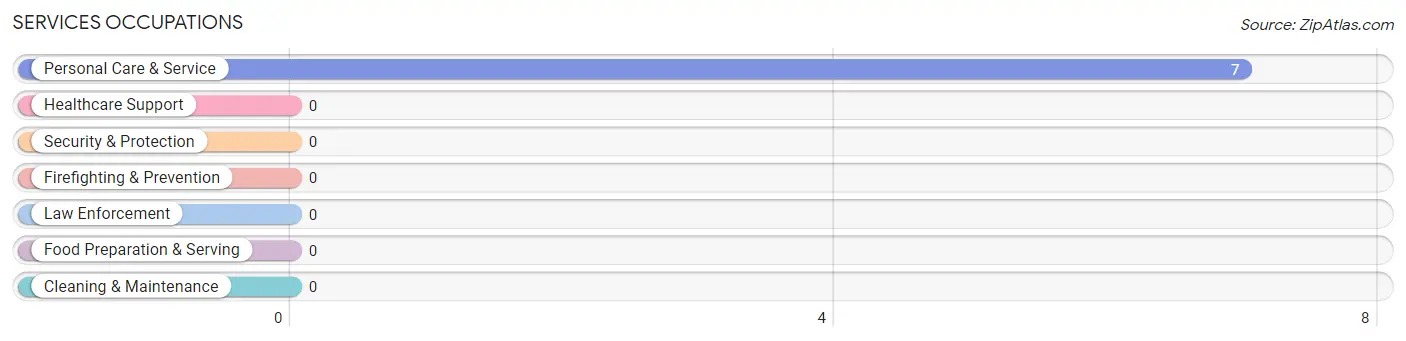
Services Occupations by Sex
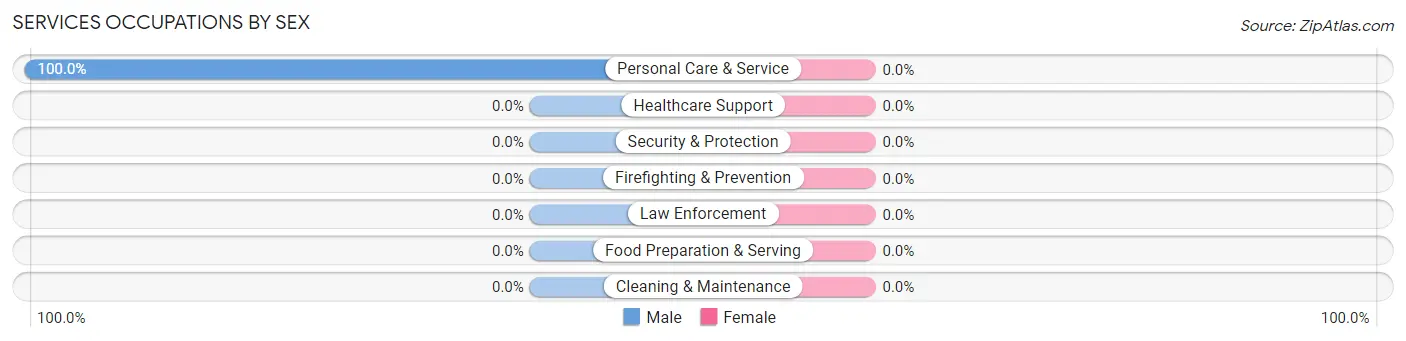
| Occupation | Male | Female |
| Healthcare Support | 0 (0.0%) | 0 (0.0%) |
| Security & Protection | 0 (0.0%) | 0 (0.0%) |
| Firefighting & Prevention | 0 (0.0%) | 0 (0.0%) |
| Law Enforcement | 0 (0.0%) | 0 (0.0%) |
| Food Preparation & Serving | 0 (0.0%) | 0 (0.0%) |
| Cleaning & Maintenance | 0 (0.0%) | 0 (0.0%) |
| Personal Care & Service | 7 (100.0%) | 0 (0.0%) |
| Total (Category) | 7 (100.0%) | 0 (0.0%) |
| Total (Overall) | 102 (51.3%) | 97 (48.7%) |
Sales and Office Occupations
The most common Sales and Office occupations in Saguache are , and Office & Administration (35 | 17.6%).
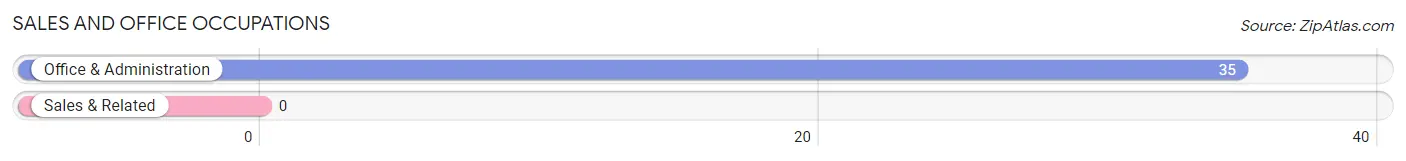
Sales and Office Occupations by Sex
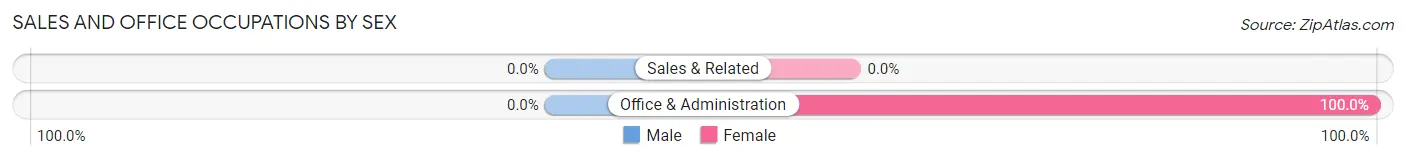
| Occupation | Male | Female |
| Sales & Related | 0 (0.0%) | 0 (0.0%) |
| Office & Administration | 0 (0.0%) | 35 (100.0%) |
| Total (Category) | 0 (0.0%) | 35 (100.0%) |
| Total (Overall) | 102 (51.3%) | 97 (48.7%) |
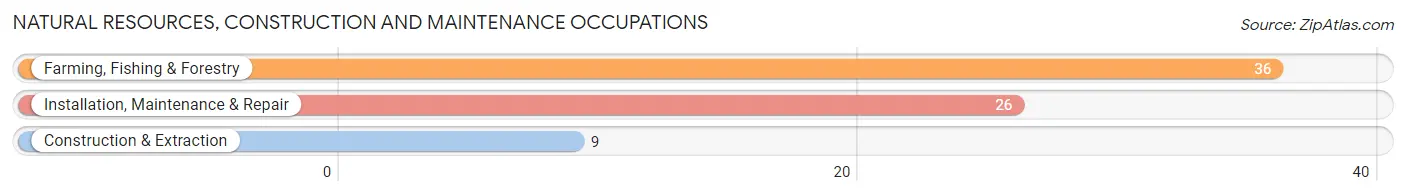
Natural Resources, Construction and Maintenance Occupations
The most common Natural Resources, Construction and Maintenance occupations in Saguache are Farming, Fishing & Forestry (36 | 18.1%), Installation, Maintenance & Repair (26 | 13.1%), and Construction & Extraction (9 | 4.5%).
Natural Resources, Construction and Maintenance Occupations by Sex
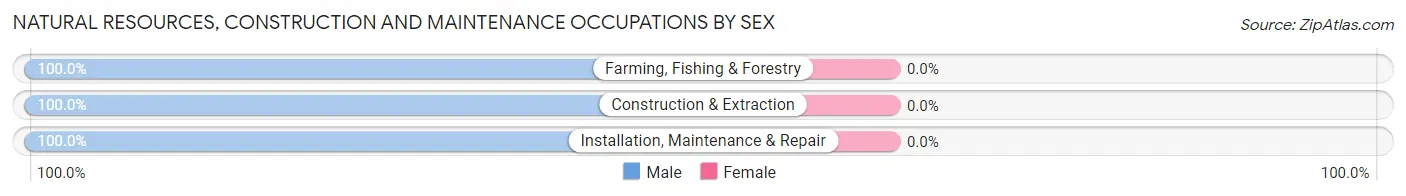
| Occupation | Male | Female |
| Farming, Fishing & Forestry | 36 (100.0%) | 0 (0.0%) |
| Construction & Extraction | 9 (100.0%) | 0 (0.0%) |
| Installation, Maintenance & Repair | 26 (100.0%) | 0 (0.0%) |
| Total (Category) | 71 (100.0%) | 0 (0.0%) |
| Total (Overall) | 102 (51.3%) | 97 (48.7%) |
Production, Transportation and Moving Occupations
The most common Production, Transportation and Moving occupations in Saguache are , and Transportation (16 | 8.0%).
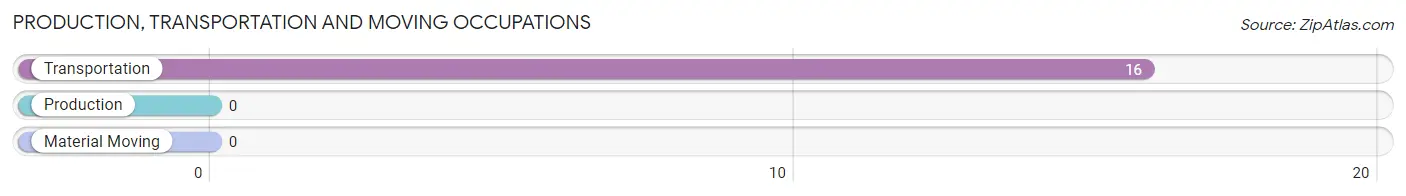
Production, Transportation and Moving Occupations by Sex
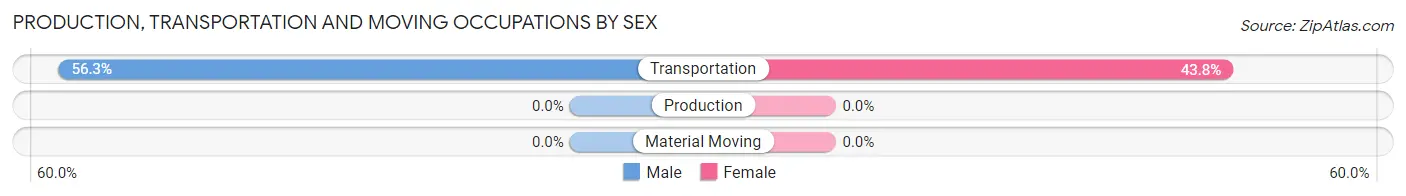
| Occupation | Male | Female |
| Production | 0 (0.0%) | 0 (0.0%) |
| Transportation | 9 (56.2%) | 7 (43.8%) |
| Material Moving | 0 (0.0%) | 0 (0.0%) |
| Total (Category) | 9 (56.2%) | 7 (43.8%) |
| Total (Overall) | 102 (51.3%) | 97 (48.7%) |
Employment Industries by Sex in Saguache
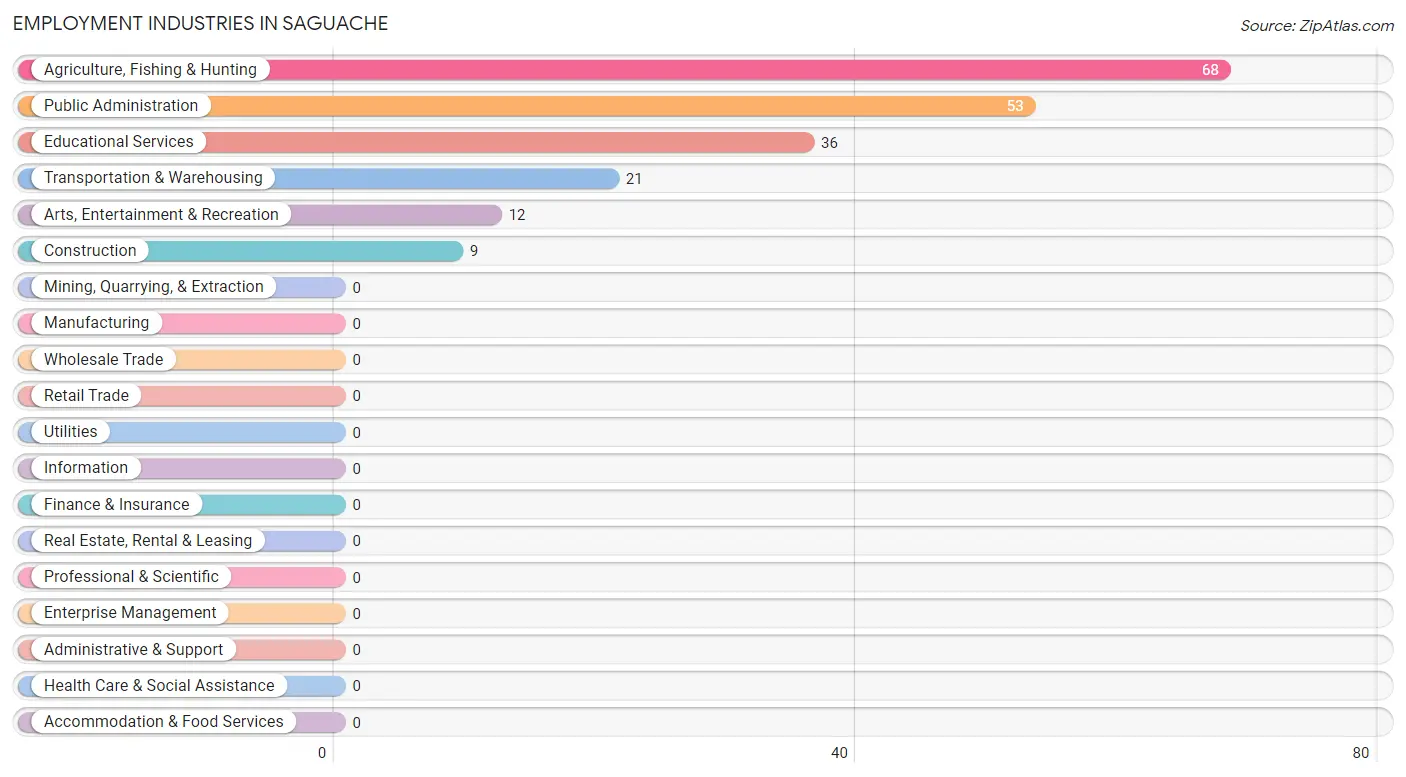
Employment Industries in Saguache
The major employment industries in Saguache include Agriculture, Fishing & Hunting (68 | 34.2%), Public Administration (53 | 26.6%), Educational Services (36 | 18.1%), Transportation & Warehousing (21 | 10.5%), and Arts, Entertainment & Recreation (12 | 6.0%).
Employment Industries by Sex in Saguache
The Saguache industries that see more men than women are Construction (100.0%), Arts, Entertainment & Recreation (100.0%), and Agriculture, Fishing & Hunting (75.0%), whereas the industries that tend to have a higher number of women are Public Administration (100.0%), Transportation & Warehousing (57.1%), and Educational Services (41.7%).
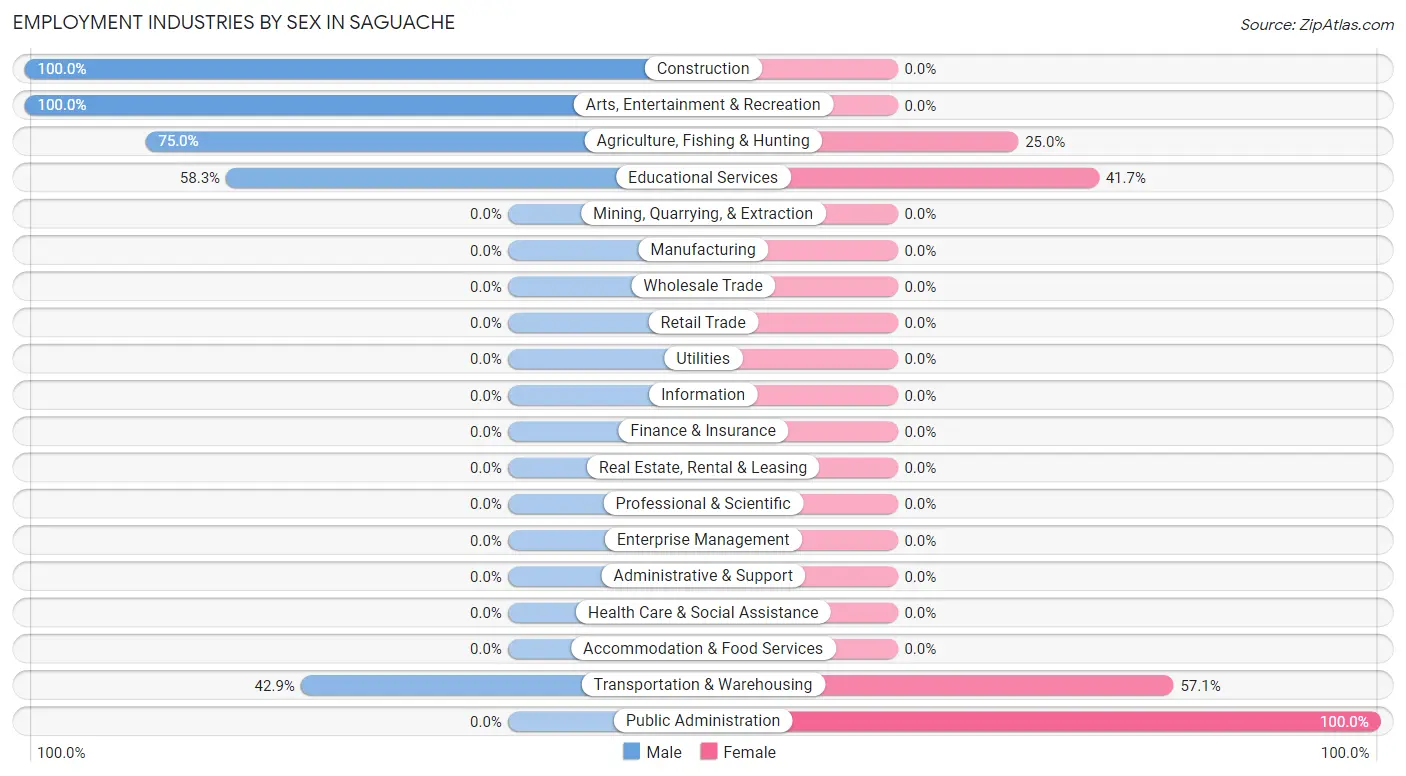
| Industry | Male | Female |
| Agriculture, Fishing & Hunting | 51 (75.0%) | 17 (25.0%) |
| Mining, Quarrying, & Extraction | 0 (0.0%) | 0 (0.0%) |
| Construction | 9 (100.0%) | 0 (0.0%) |
| Manufacturing | 0 (0.0%) | 0 (0.0%) |
| Wholesale Trade | 0 (0.0%) | 0 (0.0%) |
| Retail Trade | 0 (0.0%) | 0 (0.0%) |
| Transportation & Warehousing | 9 (42.9%) | 12 (57.1%) |
| Utilities | 0 (0.0%) | 0 (0.0%) |
| Information | 0 (0.0%) | 0 (0.0%) |
| Finance & Insurance | 0 (0.0%) | 0 (0.0%) |
| Real Estate, Rental & Leasing | 0 (0.0%) | 0 (0.0%) |
| Professional & Scientific | 0 (0.0%) | 0 (0.0%) |
| Enterprise Management | 0 (0.0%) | 0 (0.0%) |
| Administrative & Support | 0 (0.0%) | 0 (0.0%) |
| Educational Services | 21 (58.3%) | 15 (41.7%) |
| Health Care & Social Assistance | 0 (0.0%) | 0 (0.0%) |
| Arts, Entertainment & Recreation | 12 (100.0%) | 0 (0.0%) |
| Accommodation & Food Services | 0 (0.0%) | 0 (0.0%) |
| Public Administration | 0 (0.0%) | 53 (100.0%) |
| Total | 102 (51.3%) | 97 (48.7%) |
Education in Saguache
School Enrollment in Saguache
The most common levels of schooling among the 92 students in Saguache are kindergarten (47 | 51.1%), elementary school (25 | 27.2%), and high school (17 | 18.5%).
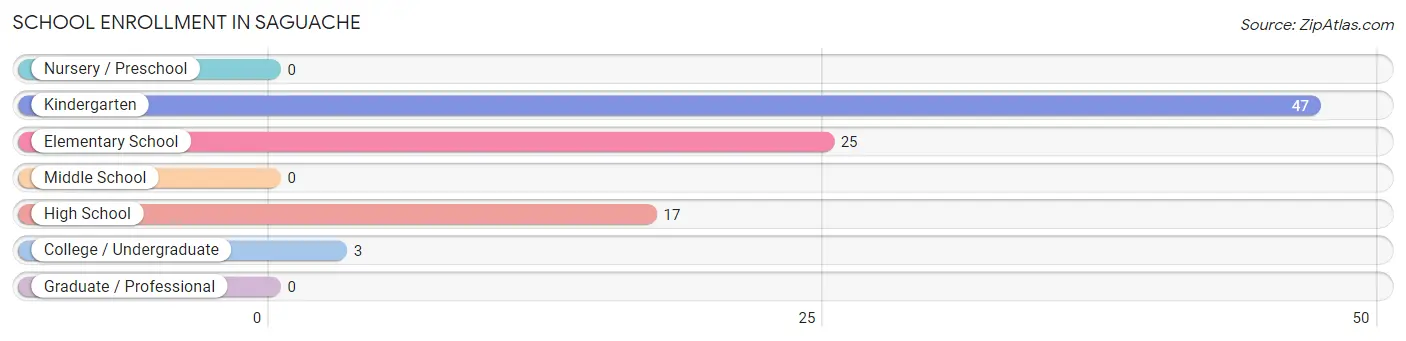
| School Level | # Students | % Students |
| Nursery / Preschool | 0 | 0.0% |
| Kindergarten | 47 | 51.1% |
| Elementary School | 25 | 27.2% |
| Middle School | 0 | 0.0% |
| High School | 17 | 18.5% |
| College / Undergraduate | 3 | 3.3% |
| Graduate / Professional | 0 | 0.0% |
| Total | 92 | 100.0% |
School Enrollment by Age by Funding Source in Saguache
Out of a total of 92 students who are enrolled in schools in Saguache, 3 (3.3%) attend a private institution, while the remaining 89 (96.7%) are enrolled in public schools. The age group of 20 to 24 year olds has the highest likelihood of being enrolled in private schools, with 3 (100.0% in the age bracket) enrolled. Conversely, the age group of 5 to 9 year old has the lowest likelihood of being enrolled in a private school, with 72 (100.0% in the age bracket) attending a public institution.
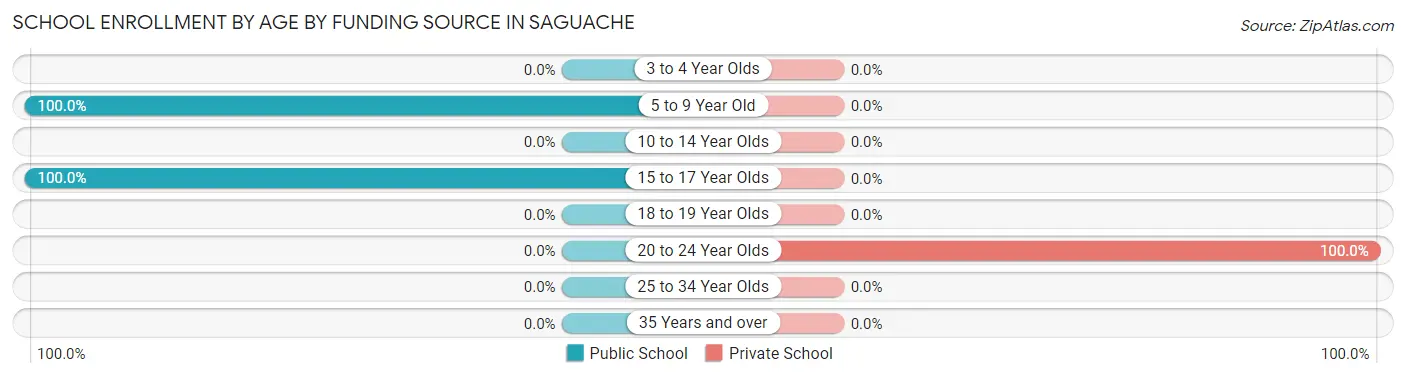
| Age Bracket | Public School | Private School |
| 3 to 4 Year Olds | 0 (0.0%) | 0 (0.0%) |
| 5 to 9 Year Old | 72 (100.0%) | 0 (0.0%) |
| 10 to 14 Year Olds | 0 (0.0%) | 0 (0.0%) |
| 15 to 17 Year Olds | 17 (100.0%) | 0 (0.0%) |
| 18 to 19 Year Olds | 0 (0.0%) | 0 (0.0%) |
| 20 to 24 Year Olds | 0 (0.0%) | 3 (100.0%) |
| 25 to 34 Year Olds | 0 (0.0%) | 0 (0.0%) |
| 35 Years and over | 0 (0.0%) | 0 (0.0%) |
| Total | 89 (96.7%) | 3 (3.3%) |
Educational Attainment by Field of Study in Saguache
Education (48 | 67.6%), and arts & humanities (23 | 32.4%) are the most common fields of study among 71 individuals in Saguache who have obtained a bachelor's degree or higher.
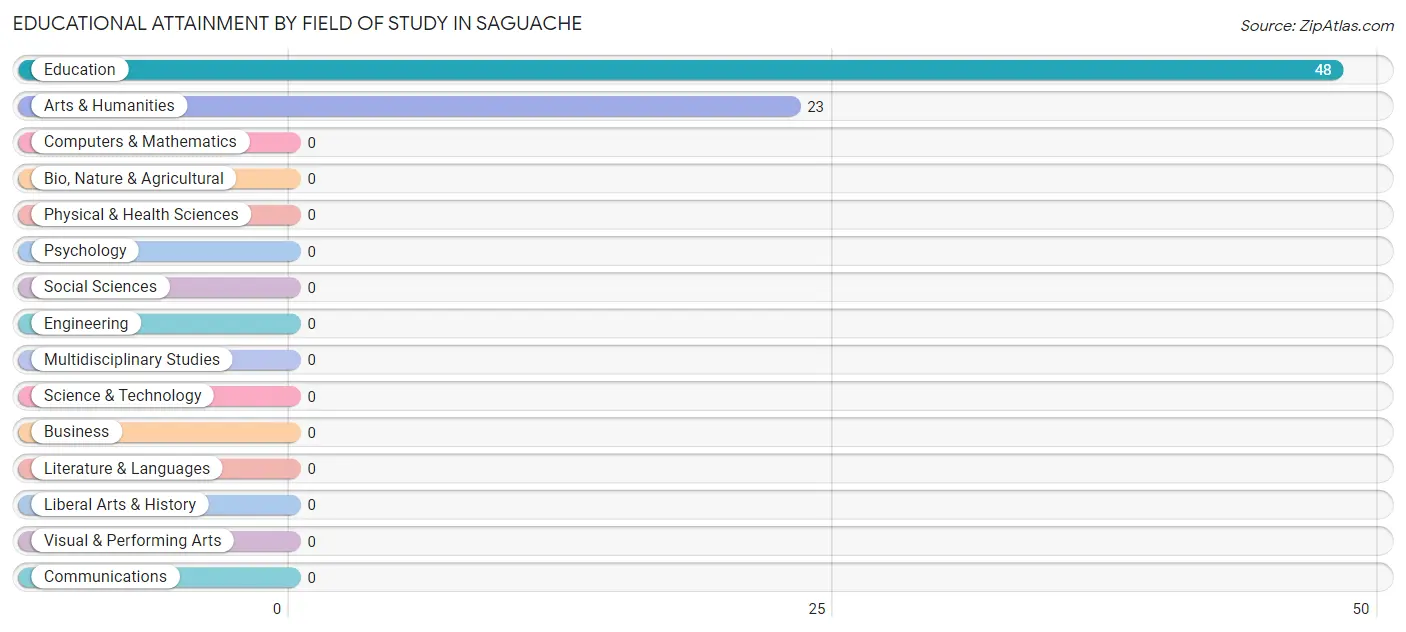
| Field of Study | # Graduates | % Graduates |
| Computers & Mathematics | 0 | 0.0% |
| Bio, Nature & Agricultural | 0 | 0.0% |
| Physical & Health Sciences | 0 | 0.0% |
| Psychology | 0 | 0.0% |
| Social Sciences | 0 | 0.0% |
| Engineering | 0 | 0.0% |
| Multidisciplinary Studies | 0 | 0.0% |
| Science & Technology | 0 | 0.0% |
| Business | 0 | 0.0% |
| Education | 48 | 67.6% |
| Literature & Languages | 0 | 0.0% |
| Liberal Arts & History | 0 | 0.0% |
| Visual & Performing Arts | 0 | 0.0% |
| Communications | 0 | 0.0% |
| Arts & Humanities | 23 | 32.4% |
| Total | 71 | 100.0% |
Transportation & Commute in Saguache
Vehicle Availability by Sex in Saguache
The most prevalent vehicle ownership categories in Saguache are males with 2 vehicles (66, accounting for 64.7%) and females with 2 vehicles (92, making up 68.0%).
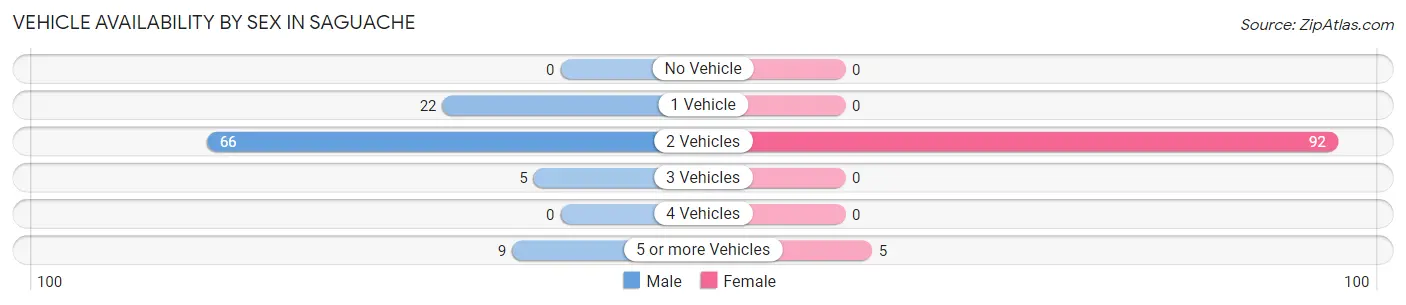
| Vehicles Available | Male | Female |
| No Vehicle | 0 (0.0%) | 0 (0.0%) |
| 1 Vehicle | 22 (21.6%) | 0 (0.0%) |
| 2 Vehicles | 66 (64.7%) | 92 (94.9%) |
| 3 Vehicles | 5 (4.9%) | 0 (0.0%) |
| 4 Vehicles | 0 (0.0%) | 0 (0.0%) |
| 5 or more Vehicles | 9 (8.8%) | 5 (5.1%) |
| Total | 102 (100.0%) | 97 (100.0%) |
Commute Time in Saguache
The most frequently occuring commute durations in Saguache are 30 to 34 minutes (48 commuters, 28.9%), 10 to 14 minutes (43 commuters, 25.9%), and 5 to 9 minutes (23 commuters, 13.9%).
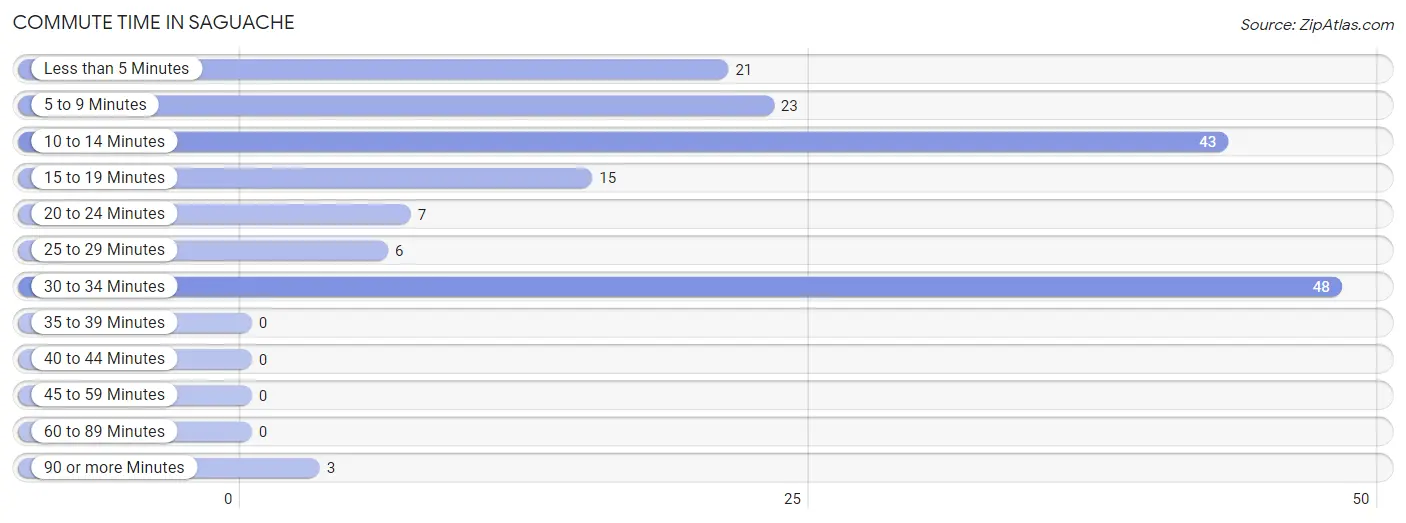
| Commute Time | # Commuters | % Commuters |
| Less than 5 Minutes | 21 | 12.7% |
| 5 to 9 Minutes | 23 | 13.9% |
| 10 to 14 Minutes | 43 | 25.9% |
| 15 to 19 Minutes | 15 | 9.0% |
| 20 to 24 Minutes | 7 | 4.2% |
| 25 to 29 Minutes | 6 | 3.6% |
| 30 to 34 Minutes | 48 | 28.9% |
| 35 to 39 Minutes | 0 | 0.0% |
| 40 to 44 Minutes | 0 | 0.0% |
| 45 to 59 Minutes | 0 | 0.0% |
| 60 to 89 Minutes | 0 | 0.0% |
| 90 or more Minutes | 3 | 1.8% |
Commute Time by Sex in Saguache
The most common commute times in Saguache are 10 to 14 minutes (36 commuters, 38.7%) for males and 30 to 34 minutes (28 commuters, 38.4%) for females.
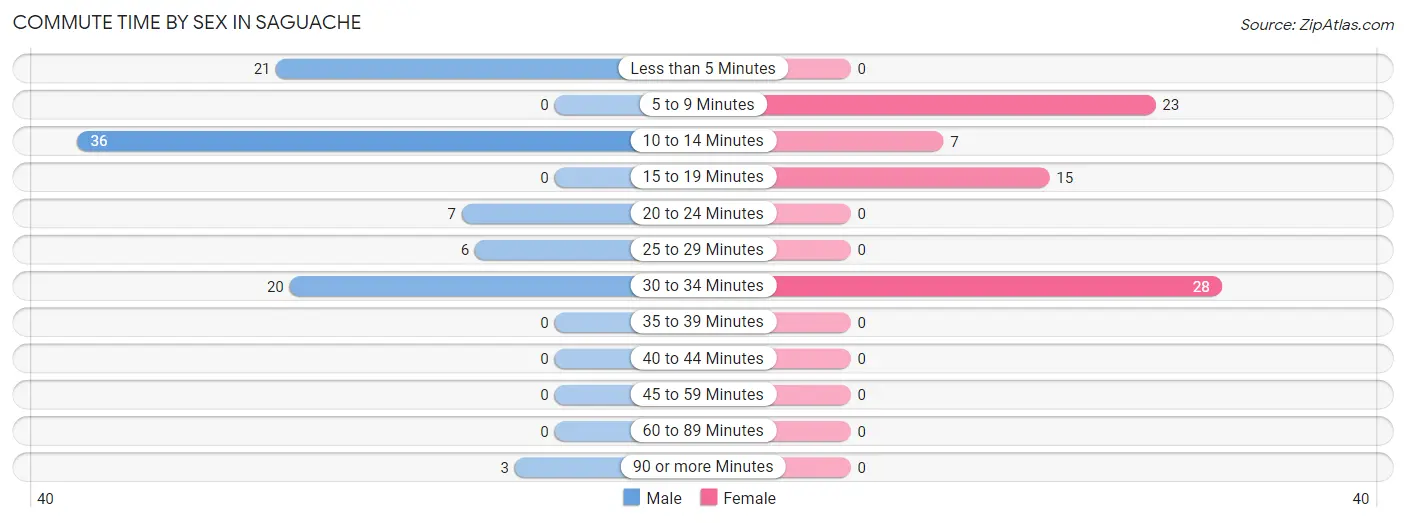
| Commute Time | Male | Female |
| Less than 5 Minutes | 21 (22.6%) | 0 (0.0%) |
| 5 to 9 Minutes | 0 (0.0%) | 23 (31.5%) |
| 10 to 14 Minutes | 36 (38.7%) | 7 (9.6%) |
| 15 to 19 Minutes | 0 (0.0%) | 15 (20.5%) |
| 20 to 24 Minutes | 7 (7.5%) | 0 (0.0%) |
| 25 to 29 Minutes | 6 (6.5%) | 0 (0.0%) |
| 30 to 34 Minutes | 20 (21.5%) | 28 (38.4%) |
| 35 to 39 Minutes | 0 (0.0%) | 0 (0.0%) |
| 40 to 44 Minutes | 0 (0.0%) | 0 (0.0%) |
| 45 to 59 Minutes | 0 (0.0%) | 0 (0.0%) |
| 60 to 89 Minutes | 0 (0.0%) | 0 (0.0%) |
| 90 or more Minutes | 3 (3.2%) | 0 (0.0%) |
Time of Departure to Work by Sex in Saguache
The most frequent times of departure to work in Saguache are 7:30 AM to 7:59 AM (36, 38.7%) for males and 7:30 AM to 7:59 AM (53, 72.6%) for females.
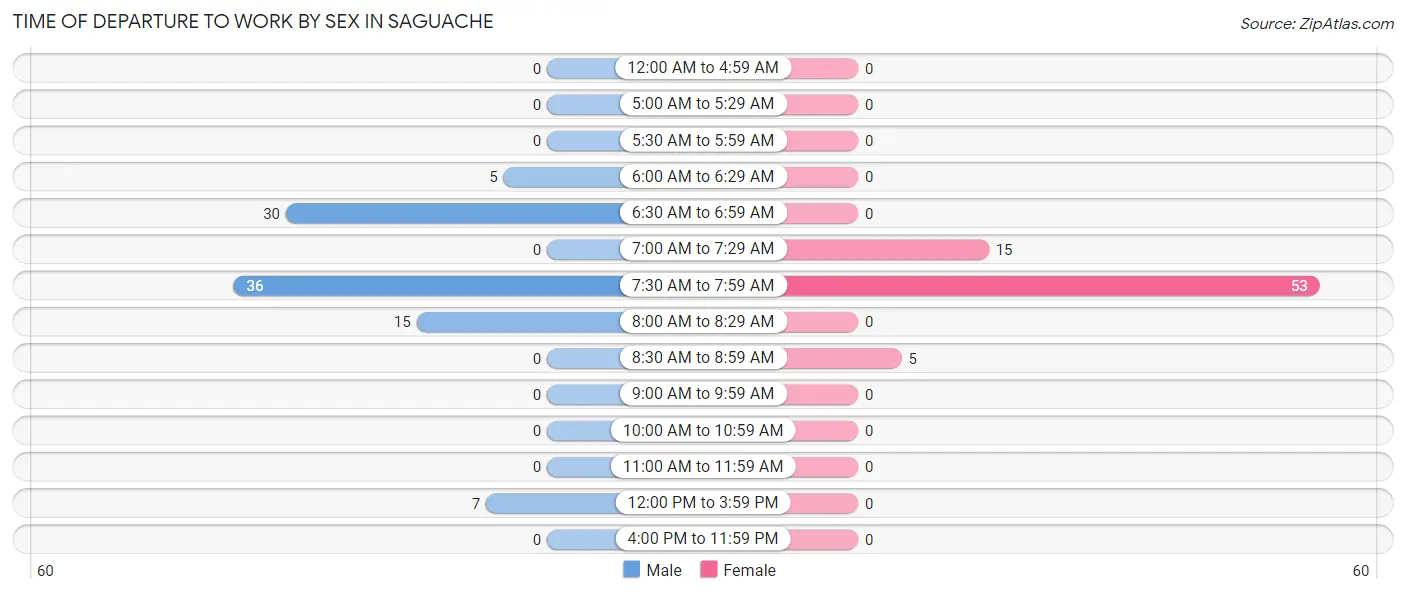
| Time of Departure | Male | Female |
| 12:00 AM to 4:59 AM | 0 (0.0%) | 0 (0.0%) |
| 5:00 AM to 5:29 AM | 0 (0.0%) | 0 (0.0%) |
| 5:30 AM to 5:59 AM | 0 (0.0%) | 0 (0.0%) |
| 6:00 AM to 6:29 AM | 5 (5.4%) | 0 (0.0%) |
| 6:30 AM to 6:59 AM | 30 (32.3%) | 0 (0.0%) |
| 7:00 AM to 7:29 AM | 0 (0.0%) | 15 (20.5%) |
| 7:30 AM to 7:59 AM | 36 (38.7%) | 53 (72.6%) |
| 8:00 AM to 8:29 AM | 15 (16.1%) | 0 (0.0%) |
| 8:30 AM to 8:59 AM | 0 (0.0%) | 5 (6.9%) |
| 9:00 AM to 9:59 AM | 0 (0.0%) | 0 (0.0%) |
| 10:00 AM to 10:59 AM | 0 (0.0%) | 0 (0.0%) |
| 11:00 AM to 11:59 AM | 0 (0.0%) | 0 (0.0%) |
| 12:00 PM to 3:59 PM | 7 (7.5%) | 0 (0.0%) |
| 4:00 PM to 11:59 PM | 0 (0.0%) | 0 (0.0%) |
| Total | 93 (100.0%) | 73 (100.0%) |
Housing Occupancy in Saguache
Occupancy by Ownership in Saguache
Of the total 268 dwellings in Saguache, owner-occupied units account for 199 (74.3%), while renter-occupied units make up 69 (25.8%).
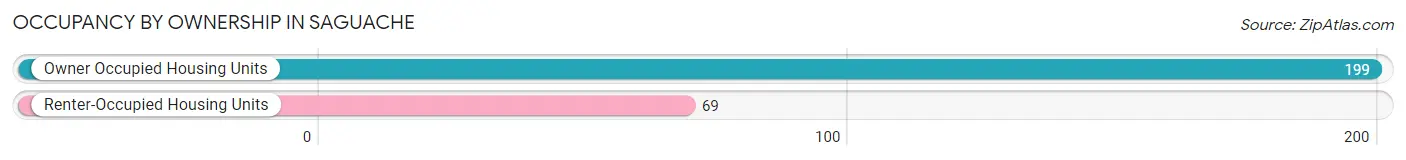
| Occupancy | # Housing Units | % Housing Units |
| Owner Occupied Housing Units | 199 | 74.3% |
| Renter-Occupied Housing Units | 69 | 25.8% |
| Total Occupied Housing Units | 268 | 100.0% |
Occupancy by Household Size in Saguache
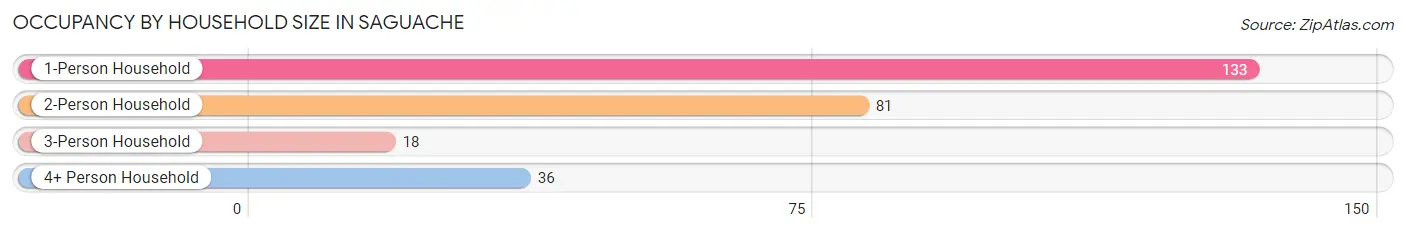
| Household Size | # Housing Units | % Housing Units |
| 1-Person Household | 133 | 49.6% |
| 2-Person Household | 81 | 30.2% |
| 3-Person Household | 18 | 6.7% |
| 4+ Person Household | 36 | 13.4% |
| Total Housing Units | 268 | 100.0% |
Occupancy by Ownership by Household Size in Saguache
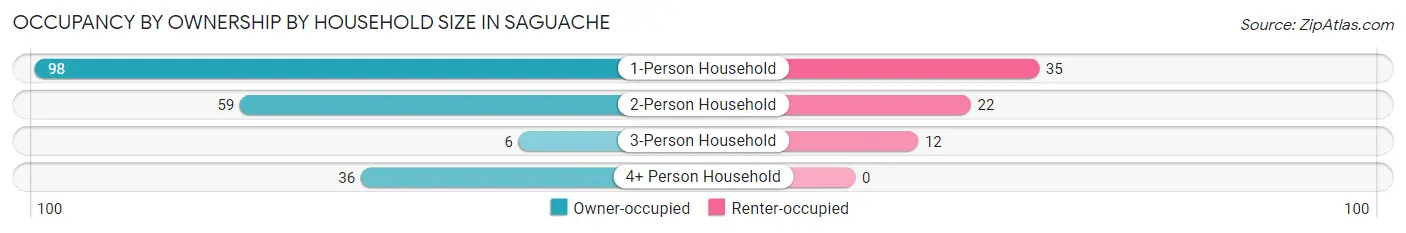
| Household Size | Owner-occupied | Renter-occupied |
| 1-Person Household | 98 (73.7%) | 35 (26.3%) |
| 2-Person Household | 59 (72.8%) | 22 (27.2%) |
| 3-Person Household | 6 (33.3%) | 12 (66.7%) |
| 4+ Person Household | 36 (100.0%) | 0 (0.0%) |
| Total Housing Units | 199 (74.3%) | 69 (25.8%) |
Occupancy by Educational Attainment in Saguache
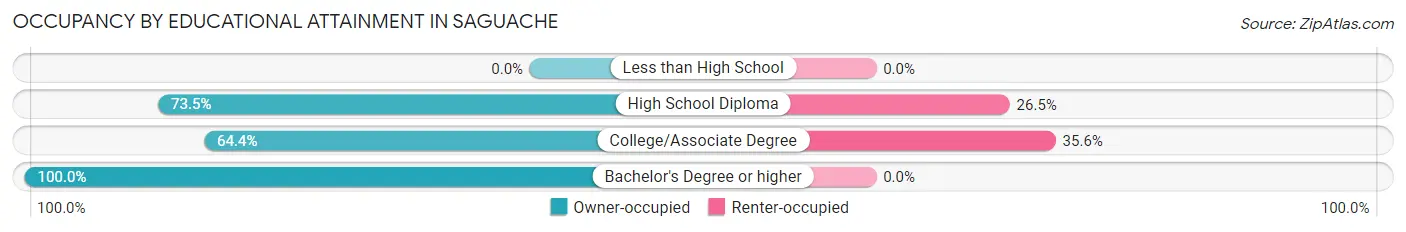
| Household Size | Owner-occupied | Renter-occupied |
| Less than High School | 0 (0.0%) | 0 (0.0%) |
| High School Diploma | 75 (73.5%) | 27 (26.5%) |
| College/Associate Degree | 76 (64.4%) | 42 (35.6%) |
| Bachelor's Degree or higher | 48 (100.0%) | 0 (0.0%) |
Occupancy by Age of Householder in Saguache
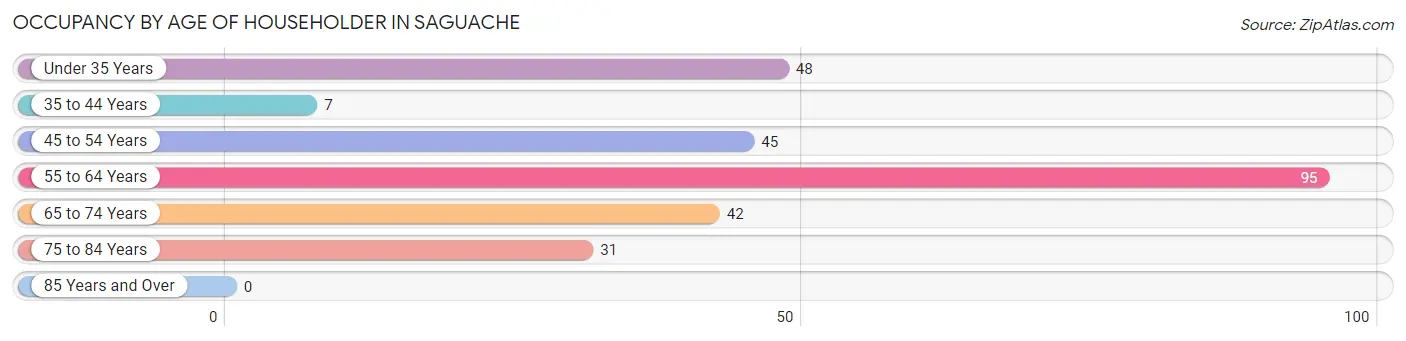
| Age Bracket | # Households | % Households |
| Under 35 Years | 48 | 17.9% |
| 35 to 44 Years | 7 | 2.6% |
| 45 to 54 Years | 45 | 16.8% |
| 55 to 64 Years | 95 | 35.4% |
| 65 to 74 Years | 42 | 15.7% |
| 75 to 84 Years | 31 | 11.6% |
| 85 Years and Over | 0 | 0.0% |
| Total | 268 | 100.0% |
Housing Finances in Saguache
Median Income by Occupancy in Saguache
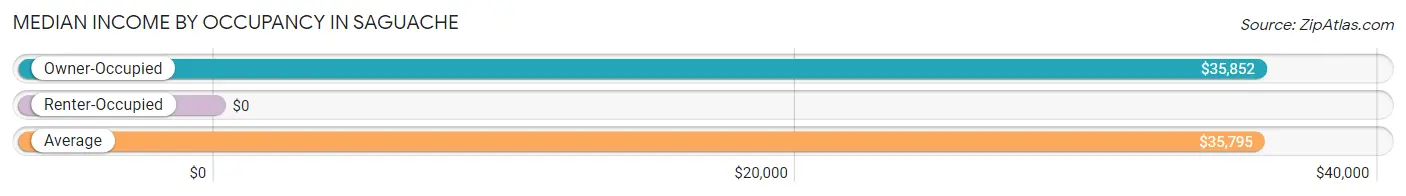
| Occupancy Type | # Households | Median Income |
| Owner-Occupied | 199 (74.3%) | $35,852 |
| Renter-Occupied | 69 (25.8%) | $0 |
| Average | 268 (100.0%) | $35,795 |
Occupancy by Householder Income Bracket in Saguache
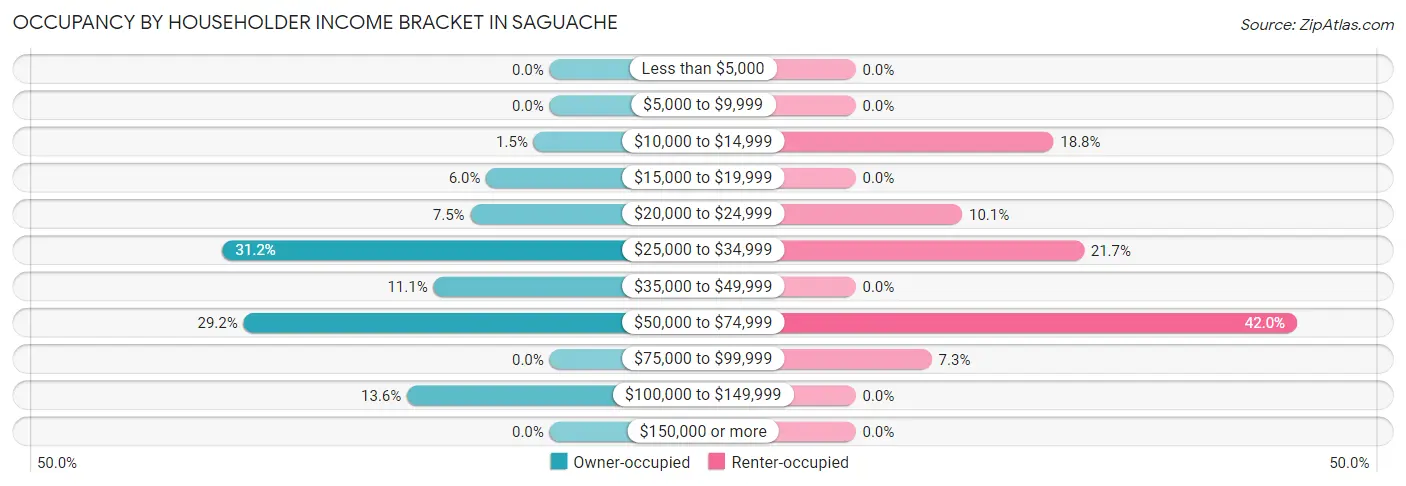
| Income Bracket | Owner-occupied | Renter-occupied |
| Less than $5,000 | 0 (0.0%) | 0 (0.0%) |
| $5,000 to $9,999 | 0 (0.0%) | 0 (0.0%) |
| $10,000 to $14,999 | 3 (1.5%) | 13 (18.8%) |
| $15,000 to $19,999 | 12 (6.0%) | 0 (0.0%) |
| $20,000 to $24,999 | 15 (7.5%) | 7 (10.1%) |
| $25,000 to $34,999 | 62 (31.2%) | 15 (21.7%) |
| $35,000 to $49,999 | 22 (11.1%) | 0 (0.0%) |
| $50,000 to $74,999 | 58 (29.1%) | 29 (42.0%) |
| $75,000 to $99,999 | 0 (0.0%) | 5 (7.2%) |
| $100,000 to $149,999 | 27 (13.6%) | 0 (0.0%) |
| $150,000 or more | 0 (0.0%) | 0 (0.0%) |
| Total | 199 (100.0%) | 69 (100.0%) |
Monthly Housing Cost Tiers in Saguache
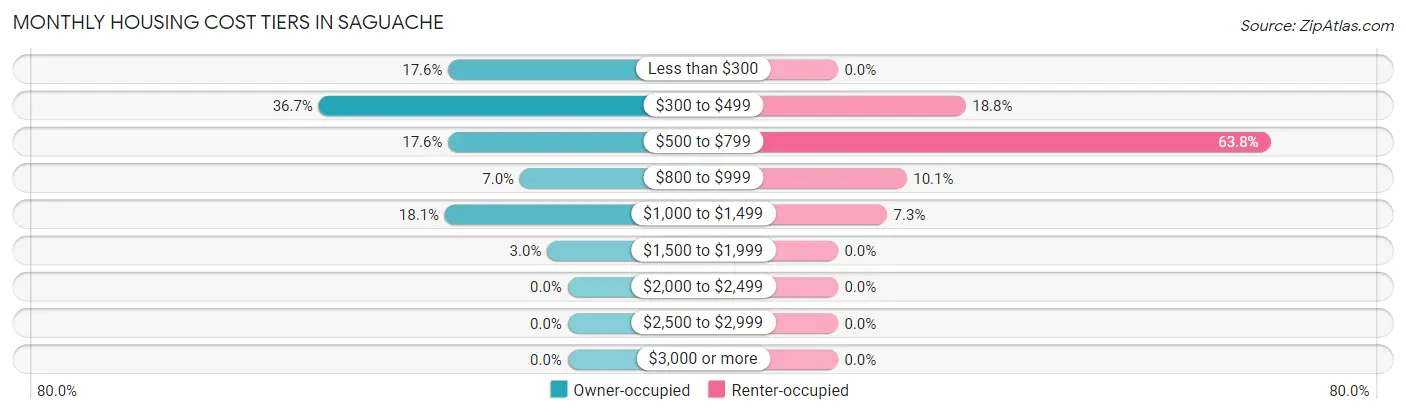
| Monthly Cost | Owner-occupied | Renter-occupied |
| Less than $300 | 35 (17.6%) | 0 (0.0%) |
| $300 to $499 | 73 (36.7%) | 13 (18.8%) |
| $500 to $799 | 35 (17.6%) | 44 (63.8%) |
| $800 to $999 | 14 (7.0%) | 7 (10.1%) |
| $1,000 to $1,499 | 36 (18.1%) | 5 (7.2%) |
| $1,500 to $1,999 | 6 (3.0%) | 0 (0.0%) |
| $2,000 to $2,499 | 0 (0.0%) | 0 (0.0%) |
| $2,500 to $2,999 | 0 (0.0%) | 0 (0.0%) |
| $3,000 or more | 0 (0.0%) | 0 (0.0%) |
| Total | 199 (100.0%) | 69 (100.0%) |
Physical Housing Characteristics in Saguache
Housing Structures in Saguache
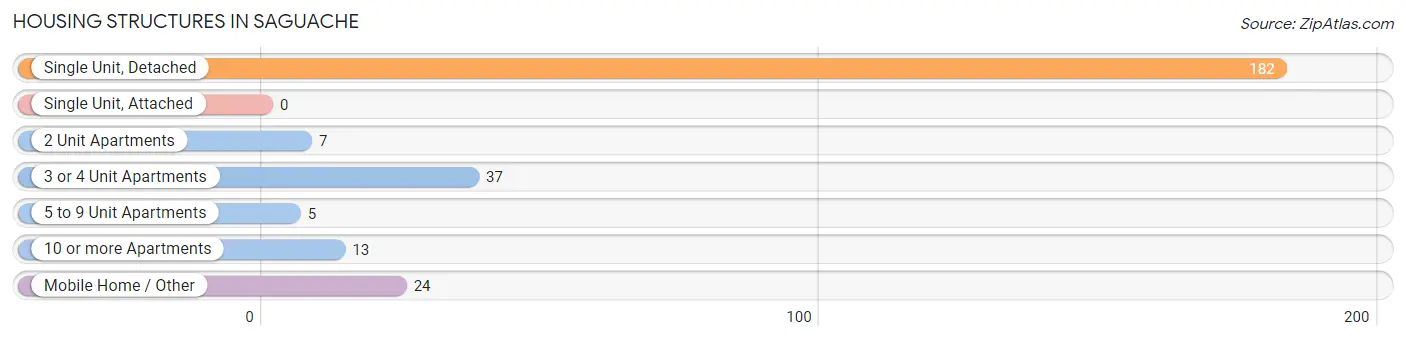
| Structure Type | # Housing Units | % Housing Units |
| Single Unit, Detached | 182 | 67.9% |
| Single Unit, Attached | 0 | 0.0% |
| 2 Unit Apartments | 7 | 2.6% |
| 3 or 4 Unit Apartments | 37 | 13.8% |
| 5 to 9 Unit Apartments | 5 | 1.9% |
| 10 or more Apartments | 13 | 4.9% |
| Mobile Home / Other | 24 | 9.0% |
| Total | 268 | 100.0% |
Housing Structures by Occupancy in Saguache
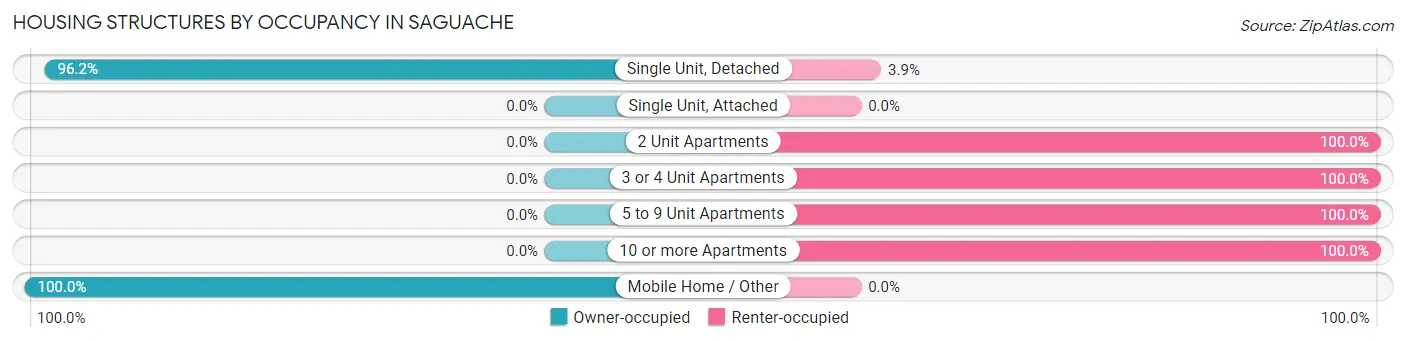
| Structure Type | Owner-occupied | Renter-occupied |
| Single Unit, Detached | 175 (96.2%) | 7 (3.8%) |
| Single Unit, Attached | 0 (0.0%) | 0 (0.0%) |
| 2 Unit Apartments | 0 (0.0%) | 7 (100.0%) |
| 3 or 4 Unit Apartments | 0 (0.0%) | 37 (100.0%) |
| 5 to 9 Unit Apartments | 0 (0.0%) | 5 (100.0%) |
| 10 or more Apartments | 0 (0.0%) | 13 (100.0%) |
| Mobile Home / Other | 24 (100.0%) | 0 (0.0%) |
| Total | 199 (74.3%) | 69 (25.8%) |
Housing Structures by Number of Rooms in Saguache
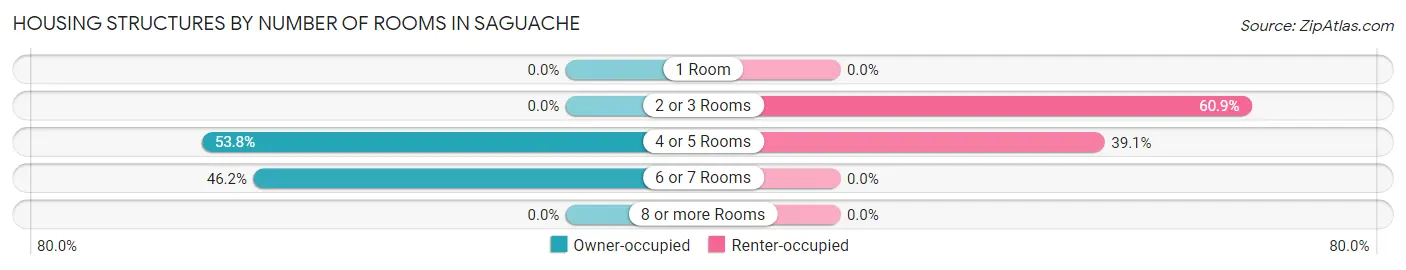
| Number of Rooms | Owner-occupied | Renter-occupied |
| 1 Room | 0 (0.0%) | 0 (0.0%) |
| 2 or 3 Rooms | 0 (0.0%) | 42 (60.9%) |
| 4 or 5 Rooms | 107 (53.8%) | 27 (39.1%) |
| 6 or 7 Rooms | 92 (46.2%) | 0 (0.0%) |
| 8 or more Rooms | 0 (0.0%) | 0 (0.0%) |
| Total | 199 (100.0%) | 69 (100.0%) |
Housing Structure by Heating Type in Saguache
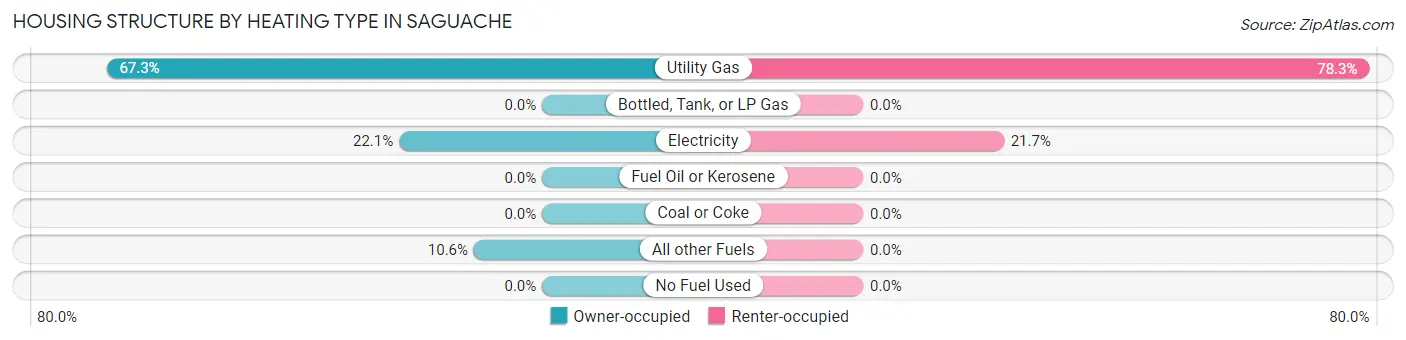
| Heating Type | Owner-occupied | Renter-occupied |
| Utility Gas | 134 (67.3%) | 54 (78.3%) |
| Bottled, Tank, or LP Gas | 0 (0.0%) | 0 (0.0%) |
| Electricity | 44 (22.1%) | 15 (21.7%) |
| Fuel Oil or Kerosene | 0 (0.0%) | 0 (0.0%) |
| Coal or Coke | 0 (0.0%) | 0 (0.0%) |
| All other Fuels | 21 (10.5%) | 0 (0.0%) |
| No Fuel Used | 0 (0.0%) | 0 (0.0%) |
| Total | 199 (100.0%) | 69 (100.0%) |
Household Vehicle Usage in Saguache
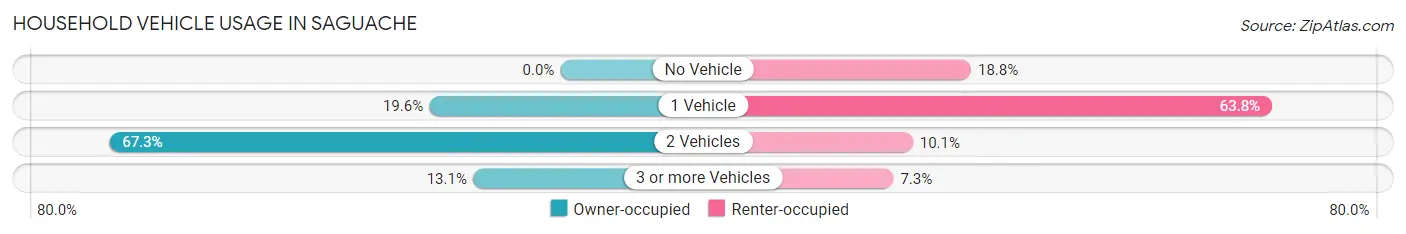
| Vehicles per Household | Owner-occupied | Renter-occupied |
| No Vehicle | 0 (0.0%) | 13 (18.8%) |
| 1 Vehicle | 39 (19.6%) | 44 (63.8%) |
| 2 Vehicles | 134 (67.3%) | 7 (10.1%) |
| 3 or more Vehicles | 26 (13.1%) | 5 (7.2%) |
| Total | 199 (100.0%) | 69 (100.0%) |
Real Estate & Mortgages in Saguache
Real Estate and Mortgage Overview in Saguache
| Characteristic | Without Mortgage | With Mortgage |
| Housing Units | 128 | 71 |
| Median Property Value | $125,600 | $160,800 |
| Median Household Income | $32,206 | $0 |
| Monthly Housing Costs | $408 | $0 |
| Real Estate Taxes | $656 | $0 |
Property Value by Mortgage Status in Saguache
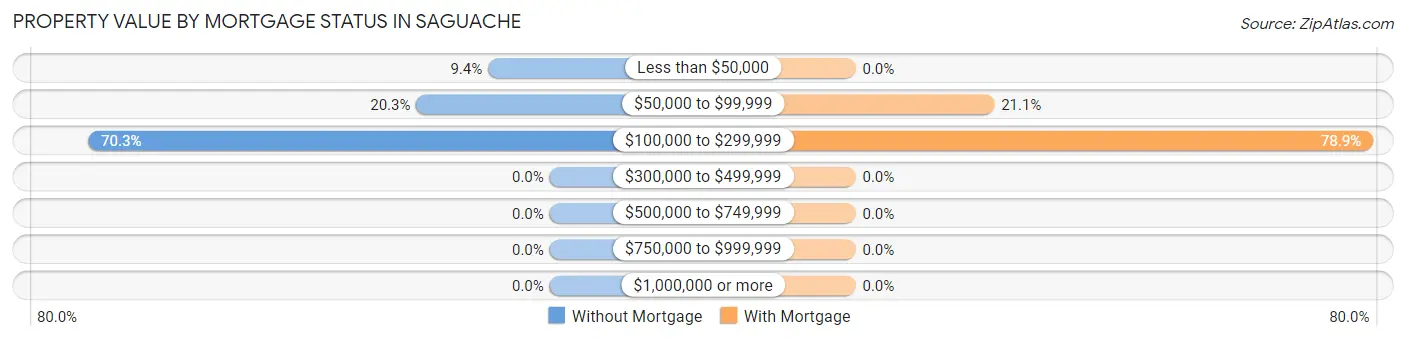
| Property Value | Without Mortgage | With Mortgage |
| Less than $50,000 | 12 (9.4%) | 0 (0.0%) |
| $50,000 to $99,999 | 26 (20.3%) | 15 (21.1%) |
| $100,000 to $299,999 | 90 (70.3%) | 56 (78.9%) |
| $300,000 to $499,999 | 0 (0.0%) | 0 (0.0%) |
| $500,000 to $749,999 | 0 (0.0%) | 0 (0.0%) |
| $750,000 to $999,999 | 0 (0.0%) | 0 (0.0%) |
| $1,000,000 or more | 0 (0.0%) | 0 (0.0%) |
| Total | 128 (100.0%) | 71 (100.0%) |
Household Income by Mortgage Status in Saguache
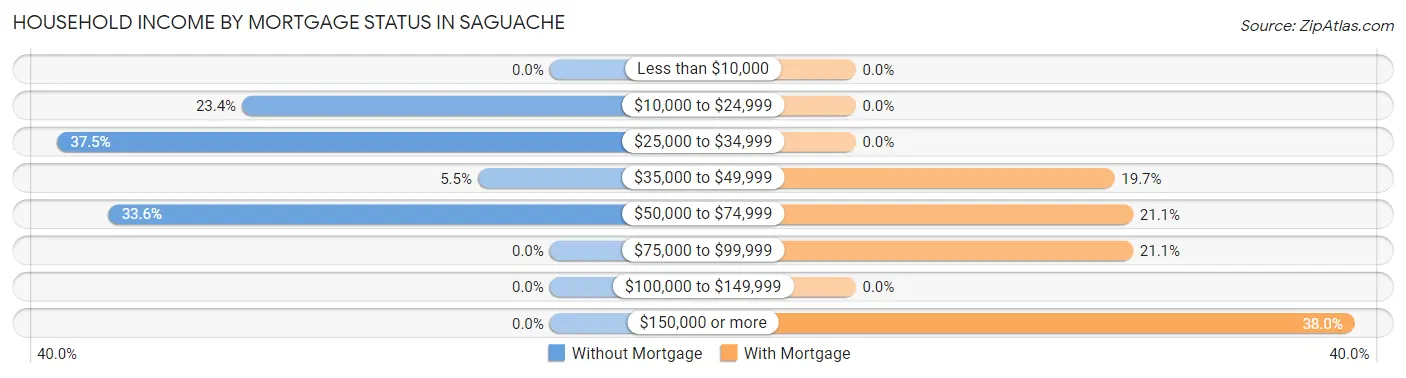
| Household Income | Without Mortgage | With Mortgage |
| Less than $10,000 | 0 (0.0%) | 0 (0.0%) |
| $10,000 to $24,999 | 30 (23.4%) | 0 (0.0%) |
| $25,000 to $34,999 | 48 (37.5%) | 0 (0.0%) |
| $35,000 to $49,999 | 7 (5.5%) | 14 (19.7%) |
| $50,000 to $74,999 | 43 (33.6%) | 15 (21.1%) |
| $75,000 to $99,999 | 0 (0.0%) | 15 (21.1%) |
| $100,000 to $149,999 | 0 (0.0%) | 0 (0.0%) |
| $150,000 or more | 0 (0.0%) | 27 (38.0%) |
| Total | 128 (100.0%) | 71 (100.0%) |
Property Value to Household Income Ratio in Saguache
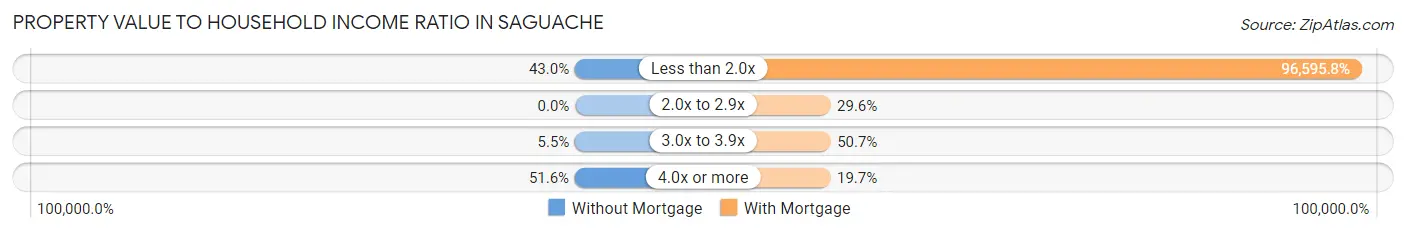
| Value-to-Income Ratio | Without Mortgage | With Mortgage |
| Less than 2.0x | 55 (43.0%) | 68,583 (96,595.8%) |
| 2.0x to 2.9x | 0 (0.0%) | 21 (29.6%) |
| 3.0x to 3.9x | 7 (5.5%) | 36 (50.7%) |
| 4.0x or more | 66 (51.6%) | 14 (19.7%) |
| Total | 128 (100.0%) | 71 (100.0%) |
Real Estate Taxes by Mortgage Status in Saguache
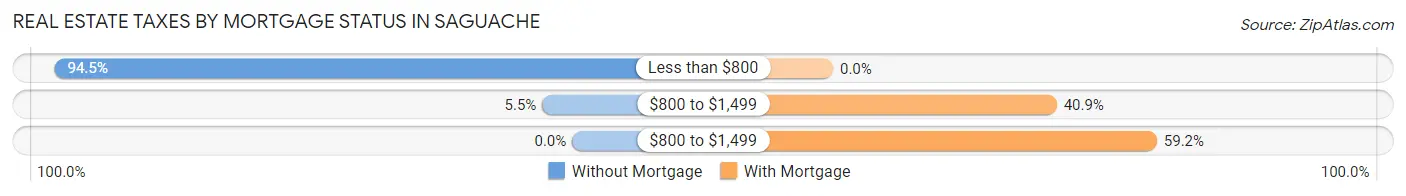
| Property Taxes | Without Mortgage | With Mortgage |
| Less than $800 | 121 (94.5%) | 0 (0.0%) |
| $800 to $1,499 | 7 (5.5%) | 29 (40.8%) |
| $800 to $1,499 | 0 (0.0%) | 42 (59.2%) |
| Total | 128 (100.0%) | 71 (100.0%) |
Health & Disability in Saguache
Health Insurance Coverage by Age in Saguache
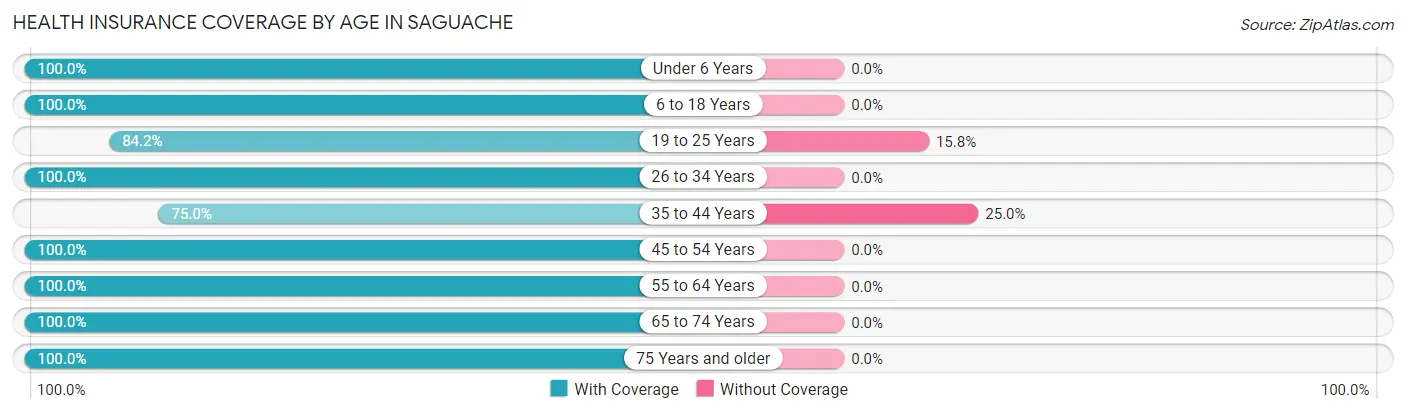
| Age Bracket | With Coverage | Without Coverage |
| Under 6 Years | 13 (100.0%) | 0 (0.0%) |
| 6 to 18 Years | 89 (100.0%) | 0 (0.0%) |
| 19 to 25 Years | 16 (84.2%) | 3 (15.8%) |
| 26 to 34 Years | 83 (100.0%) | 0 (0.0%) |
| 35 to 44 Years | 21 (75.0%) | 7 (25.0%) |
| 45 to 54 Years | 65 (100.0%) | 0 (0.0%) |
| 55 to 64 Years | 112 (100.0%) | 0 (0.0%) |
| 65 to 74 Years | 42 (100.0%) | 0 (0.0%) |
| 75 Years and older | 49 (100.0%) | 0 (0.0%) |
| Total | 490 (98.0%) | 10 (2.0%) |
Health Insurance Coverage by Citizenship Status in Saguache
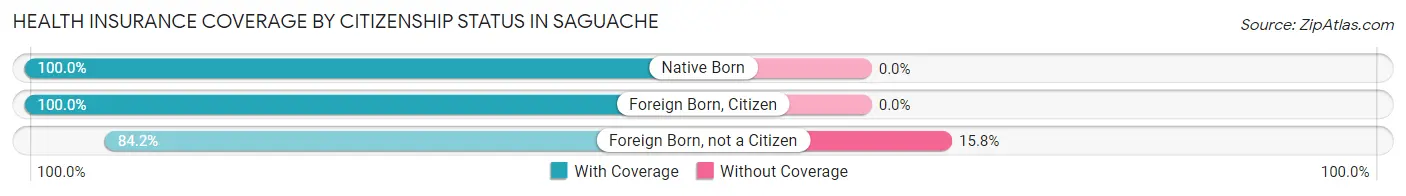
| Citizenship Status | With Coverage | Without Coverage |
| Native Born | 13 (100.0%) | 0 (0.0%) |
| Foreign Born, Citizen | 89 (100.0%) | 0 (0.0%) |
| Foreign Born, not a Citizen | 16 (84.2%) | 3 (15.8%) |
Health Insurance Coverage by Household Income in Saguache
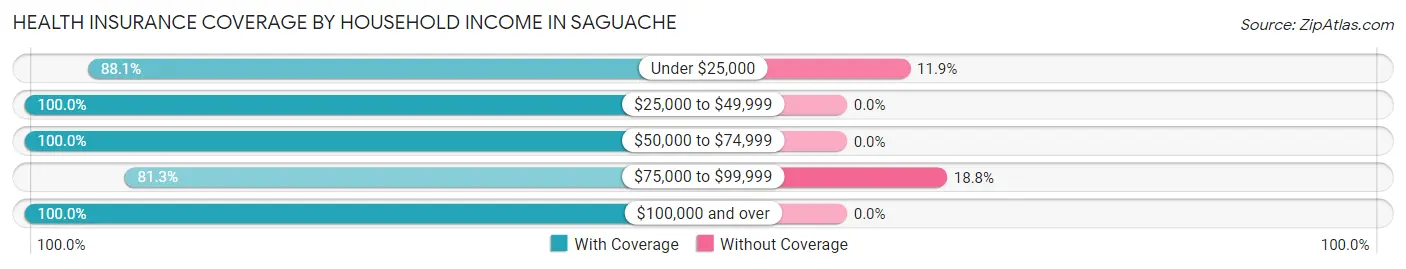
| Household Income | With Coverage | Without Coverage |
| Under $25,000 | 52 (88.1%) | 7 (11.9%) |
| $25,000 to $49,999 | 174 (100.0%) | 0 (0.0%) |
| $50,000 to $74,999 | 143 (100.0%) | 0 (0.0%) |
| $75,000 to $99,999 | 13 (81.2%) | 3 (18.8%) |
| $100,000 and over | 108 (100.0%) | 0 (0.0%) |
Public vs Private Health Insurance Coverage by Age in Saguache
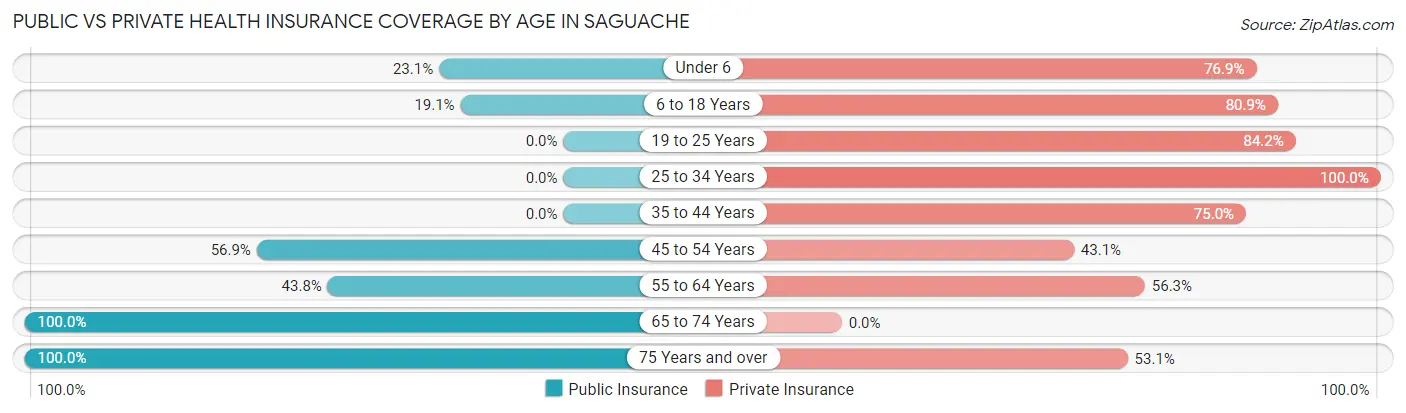
| Age Bracket | Public Insurance | Private Insurance |
| Under 6 | 3 (23.1%) | 10 (76.9%) |
| 6 to 18 Years | 17 (19.1%) | 72 (80.9%) |
| 19 to 25 Years | 0 (0.0%) | 16 (84.2%) |
| 25 to 34 Years | 0 (0.0%) | 83 (100.0%) |
| 35 to 44 Years | 0 (0.0%) | 21 (75.0%) |
| 45 to 54 Years | 37 (56.9%) | 28 (43.1%) |
| 55 to 64 Years | 49 (43.8%) | 63 (56.2%) |
| 65 to 74 Years | 42 (100.0%) | 0 (0.0%) |
| 75 Years and over | 49 (100.0%) | 26 (53.1%) |
| Total | 197 (39.4%) | 319 (63.8%) |
Disability Status by Sex by Age in Saguache
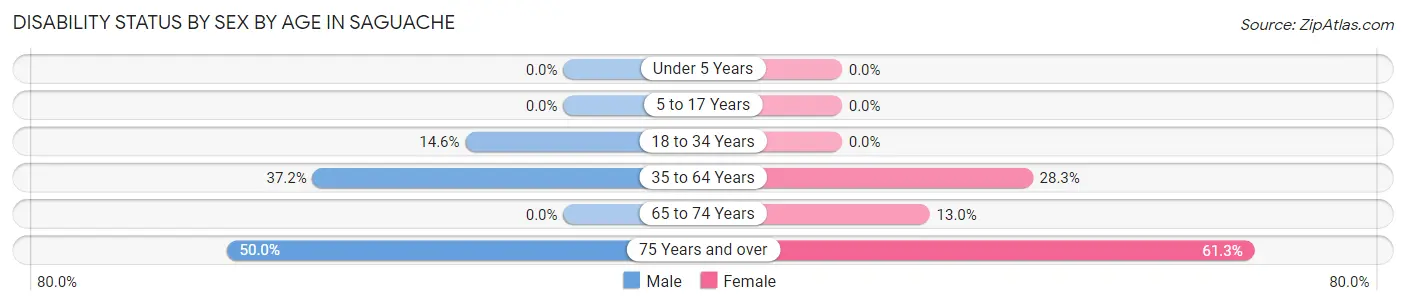
| Age Bracket | Male | Female |
| Under 5 Years | 0 (0.0%) | 0 (0.0%) |
| 5 to 17 Years | 0 (0.0%) | 0 (0.0%) |
| 18 to 34 Years | 8 (14.5%) | 0 (0.0%) |
| 35 to 64 Years | 54 (37.2%) | 17 (28.3%) |
| 65 to 74 Years | 0 (0.0%) | 3 (13.0%) |
| 75 Years and over | 9 (50.0%) | 19 (61.3%) |
Disability Class by Sex by Age in Saguache
Disability Class: Hearing Difficulty
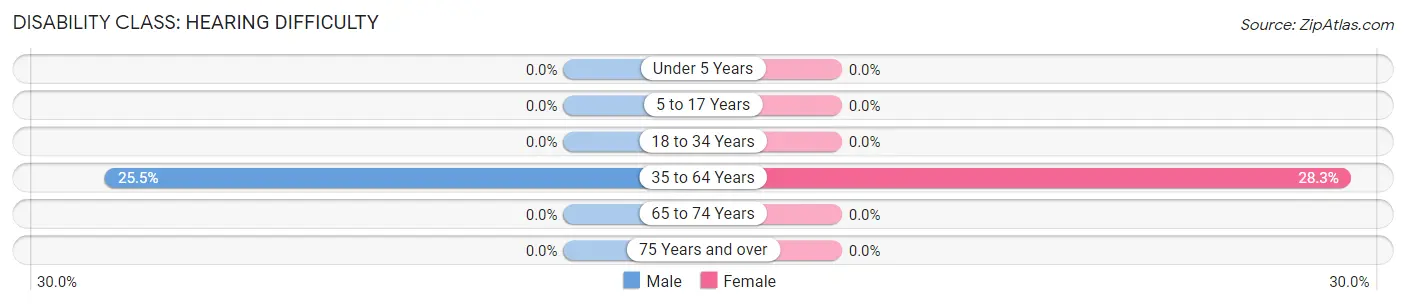
| Age Bracket | Male | Female |
| Under 5 Years | 0 (0.0%) | 0 (0.0%) |
| 5 to 17 Years | 0 (0.0%) | 0 (0.0%) |
| 18 to 34 Years | 0 (0.0%) | 0 (0.0%) |
| 35 to 64 Years | 37 (25.5%) | 17 (28.3%) |
| 65 to 74 Years | 0 (0.0%) | 0 (0.0%) |
| 75 Years and over | 0 (0.0%) | 0 (0.0%) |
Disability Class: Vision Difficulty
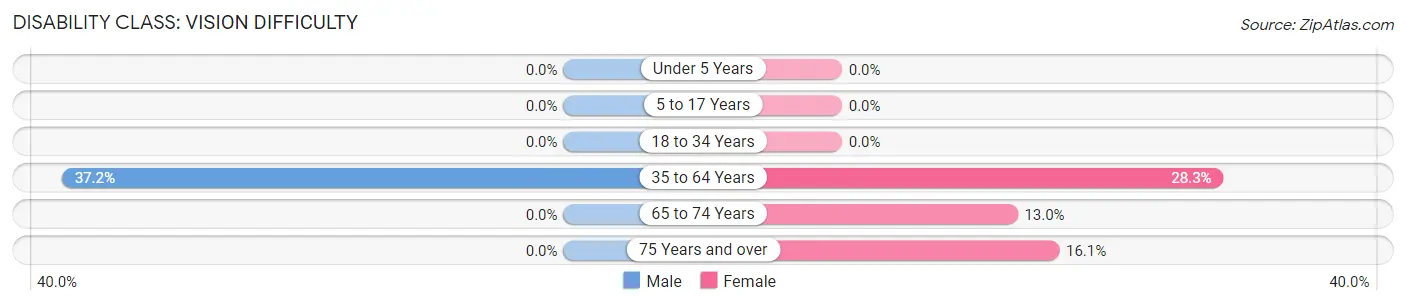
| Age Bracket | Male | Female |
| Under 5 Years | 0 (0.0%) | 0 (0.0%) |
| 5 to 17 Years | 0 (0.0%) | 0 (0.0%) |
| 18 to 34 Years | 0 (0.0%) | 0 (0.0%) |
| 35 to 64 Years | 54 (37.2%) | 17 (28.3%) |
| 65 to 74 Years | 0 (0.0%) | 3 (13.0%) |
| 75 Years and over | 0 (0.0%) | 5 (16.1%) |
Disability Class: Cognitive Difficulty
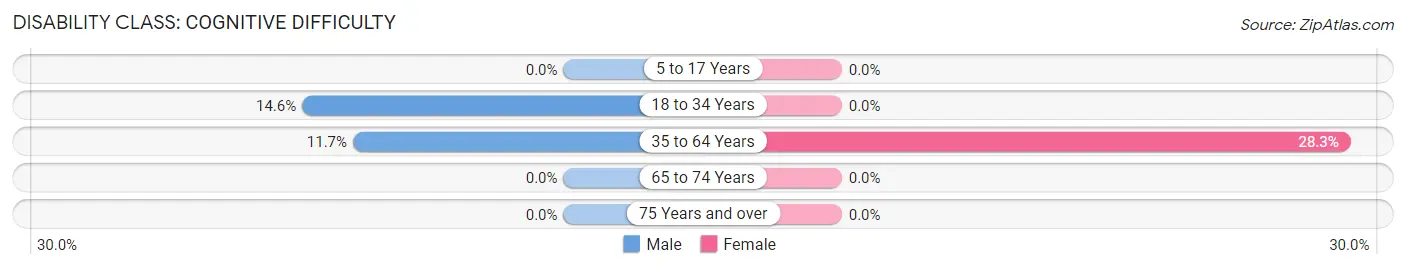
| Age Bracket | Male | Female |
| 5 to 17 Years | 0 (0.0%) | 0 (0.0%) |
| 18 to 34 Years | 8 (14.5%) | 0 (0.0%) |
| 35 to 64 Years | 17 (11.7%) | 17 (28.3%) |
| 65 to 74 Years | 0 (0.0%) | 0 (0.0%) |
| 75 Years and over | 0 (0.0%) | 0 (0.0%) |
Disability Class: Ambulatory Difficulty
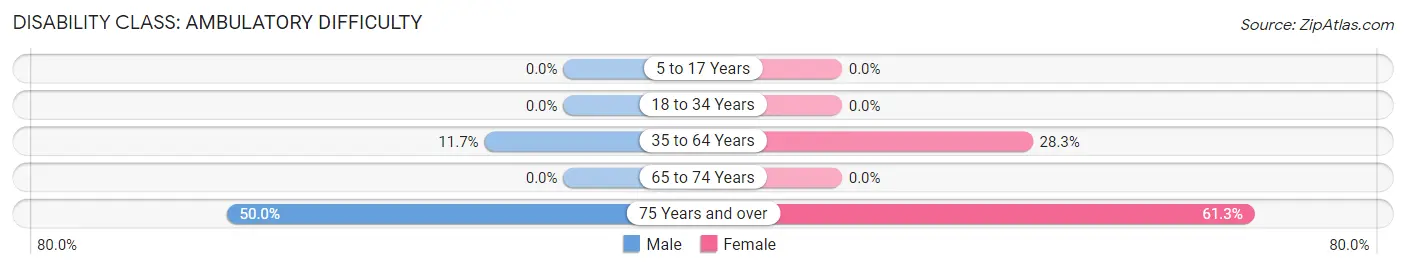
| Age Bracket | Male | Female |
| 5 to 17 Years | 0 (0.0%) | 0 (0.0%) |
| 18 to 34 Years | 0 (0.0%) | 0 (0.0%) |
| 35 to 64 Years | 17 (11.7%) | 17 (28.3%) |
| 65 to 74 Years | 0 (0.0%) | 0 (0.0%) |
| 75 Years and over | 9 (50.0%) | 19 (61.3%) |
Disability Class: Self-Care Difficulty
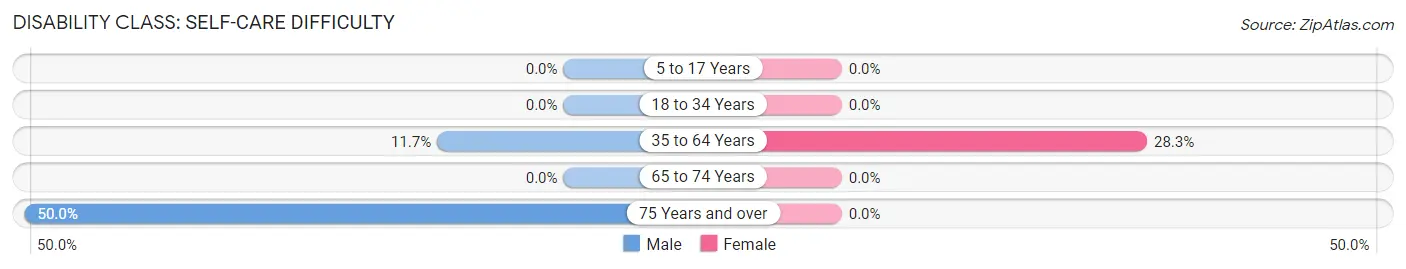
| Age Bracket | Male | Female |
| 5 to 17 Years | 0 (0.0%) | 0 (0.0%) |
| 18 to 34 Years | 0 (0.0%) | 0 (0.0%) |
| 35 to 64 Years | 17 (11.7%) | 17 (28.3%) |
| 65 to 74 Years | 0 (0.0%) | 0 (0.0%) |
| 75 Years and over | 9 (50.0%) | 0 (0.0%) |
Technology Access in Saguache
Computing Device Access in Saguache
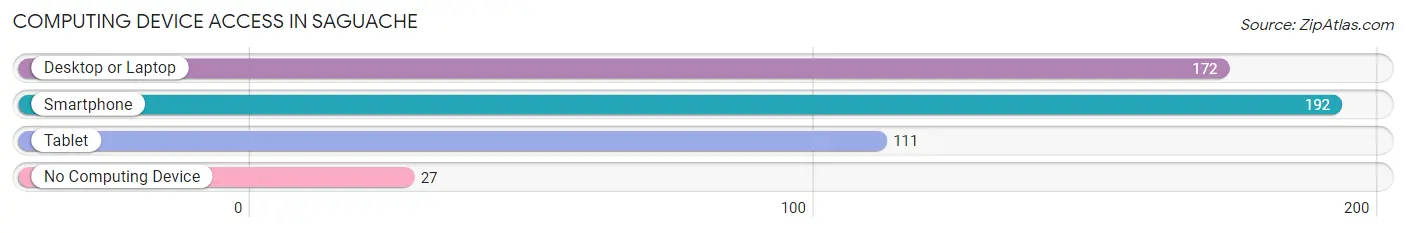
| Device Type | # Households | % Households |
| Desktop or Laptop | 172 | 64.2% |
| Smartphone | 192 | 71.6% |
| Tablet | 111 | 41.4% |
| No Computing Device | 27 | 10.1% |
| Total | 268 | 100.0% |
Internet Access in Saguache
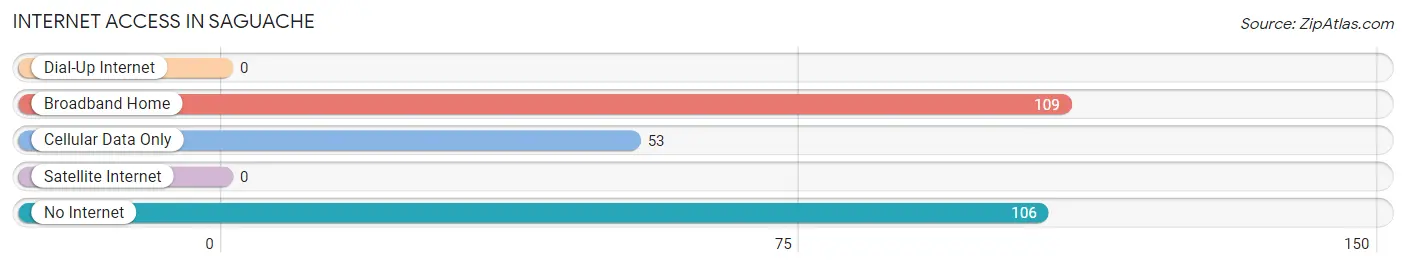
| Internet Type | # Households | % Households |
| Dial-Up Internet | 0 | 0.0% |
| Broadband Home | 109 | 40.7% |
| Cellular Data Only | 53 | 19.8% |
| Satellite Internet | 0 | 0.0% |
| No Internet | 106 | 39.6% |
| Total | 268 | 100.0% |
Saguache Summary
Saguache is a small town located in the San Luis Valley of Colorado. It is situated at the base of the Sangre de Cristo Mountains and is the county seat of Saguache County. The town was founded in 1867 and has a population of about 600 people.
History
The area around Saguache was first inhabited by the Ute Indians, who used the area for hunting and gathering. The first Europeans to settle in the area were Spanish explorers in the late 1700s. The town of Saguache was founded in 1867 by a group of settlers from the San Luis Valley. The town was named after the Ute word for “blue sky”.
The town grew slowly over the years, and by the early 1900s, it had become a center for ranching and farming. The town was also home to a number of businesses, including a hotel, a bank, and a newspaper.
In the early 1900s, Saguache was a popular stop on the Denver and Rio Grande Railroad. The railroad brought tourists to the area, and the town became a popular destination for hunting and fishing.
Geography
Saguache is located in the San Luis Valley of Colorado, at the base of the Sangre de Cristo Mountains. The town is situated at an elevation of 7,741 feet above sea level. The town is surrounded by mountains and is located near the Great Sand Dunes National Park.
The climate in Saguache is semi-arid, with hot summers and cold winters. The average annual temperature is around 50 degrees Fahrenheit. The town receives an average of 12 inches of precipitation per year.
Economy
The economy of Saguache is largely based on agriculture and tourism. The town is home to a number of farms and ranches, which produce hay, alfalfa, and other crops. The town is also home to a number of tourist attractions, including the Great Sand Dunes National Park and the San Luis Valley Museum.
The town is also home to a number of businesses, including restaurants, hotels, and retail stores. The town is also home to a number of government offices, including the Saguache County Courthouse.
Demographics
As of the 2010 census, the population of Saguache was 591. The town is predominantly white, with a small Hispanic population. The median household income in the town is $35,000. The town has a poverty rate of 17.3%.
Conclusion
Saguache is a small town located in the San Luis Valley of Colorado. It is situated at the base of the Sangre de Cristo Mountains and is the county seat of Saguache County. The town was founded in 1867 and has a population of about 600 people. The economy of Saguache is largely based on agriculture and tourism. The town is predominantly white, with a small Hispanic population. The median household income in the town is $35,000. The town has a poverty rate of 17.3%.
Common Questions
What is Per Capita Income in Saguache?
Per Capita income in Saguache is $24,423.
What is the Median Family Income in Saguache?
Median Family Income in Saguache is $53,393.
What is the Median Household income in Saguache?
Median Household Income in Saguache is $35,795.
What is Inequality or Gini Index in Saguache?
Inequality or Gini Index in Saguache is 0.31.
What is the Total Population of Saguache?
Total Population of Saguache is 535.
What is the Total Male Population of Saguache?
Total Male Population of Saguache is 334.
What is the Total Female Population of Saguache?
Total Female Population of Saguache is 201.
What is the Ratio of Males per 100 Females in Saguache?
There are 166.17 Males per 100 Females in Saguache.
What is the Ratio of Females per 100 Males in Saguache?
There are 60.18 Females per 100 Males in Saguache.
What is the Median Population Age in Saguache?
Median Population Age in Saguache is 45.7 Years.
What is the Average Family Size in Saguache
Average Family Size in Saguache is 2.9 People.
What is the Average Household Size in Saguache
Average Household Size in Saguache is 1.9 People.
How Large is the Labor Force in Saguache?
There are 232 People in the Labor Forcein in Saguache.
What is the Percentage of People in the Labor Force in Saguache?
51.6% of People are in the Labor Force in Saguache.
What is the Unemployment Rate in Saguache?
Unemployment Rate in Saguache is 14.2%.