Rye, CO Map & Demographics
Rye Map
Rye Overview
$26,223
PER CAPITA INCOME
$48,938
AVG FAMILY INCOME
$48,875
AVG HOUSEHOLD INCOME
0.32
INEQUALITY / GINI INDEX
202
TOTAL POPULATION
121
MALE POPULATION
81
FEMALE POPULATION
149.38
MALES / 100 FEMALES
66.94
FEMALES / 100 MALES
37.6
MEDIAN AGE
2.7
AVG FAMILY SIZE
2.3
AVG HOUSEHOLD SIZE
82
LABOR FORCE [ PEOPLE ]
62.1%
PERCENT IN LABOR FORCE
Rye Zip Codes
Rye Area Codes
Income in Rye
Income Overview in Rye
Per Capita Income in Rye is $26,223, while median incomes of families and households are $48,938 and $48,875 respectively.
| Characteristic | Number | Measure |
| Per Capita Income | 202 | $26,223 |
| Median Family Income | 63 | $48,938 |
| Mean Family Income | 63 | $54,719 |
| Median Household Income | 88 | $48,875 |
| Mean Household Income | 88 | $58,061 |
| Income Deficit | 63 | $0 |
| Wage / Income Gap (%) | 202 | 0.00% |
| Wage / Income Gap ($) | 202 | 100.00¢ per $1 |
| Gini / Inequality Index | 202 | 0.32 |
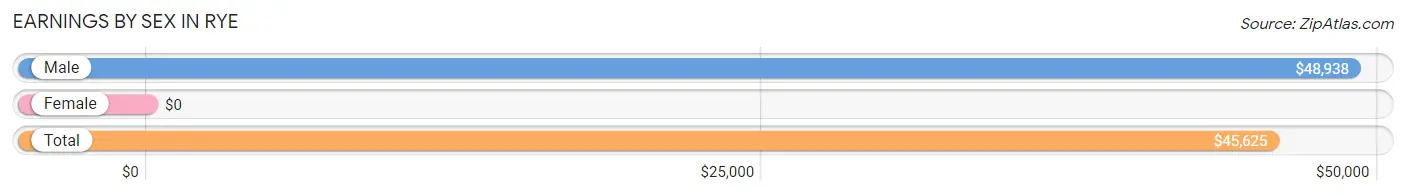
Earnings by Sex in Rye
| Sex | Number | Average Earnings |
| Male | 53 (64.6%) | $48,938 |
| Female | 29 (35.4%) | $0 |
| Total | 82 (100.0%) | $45,625 |
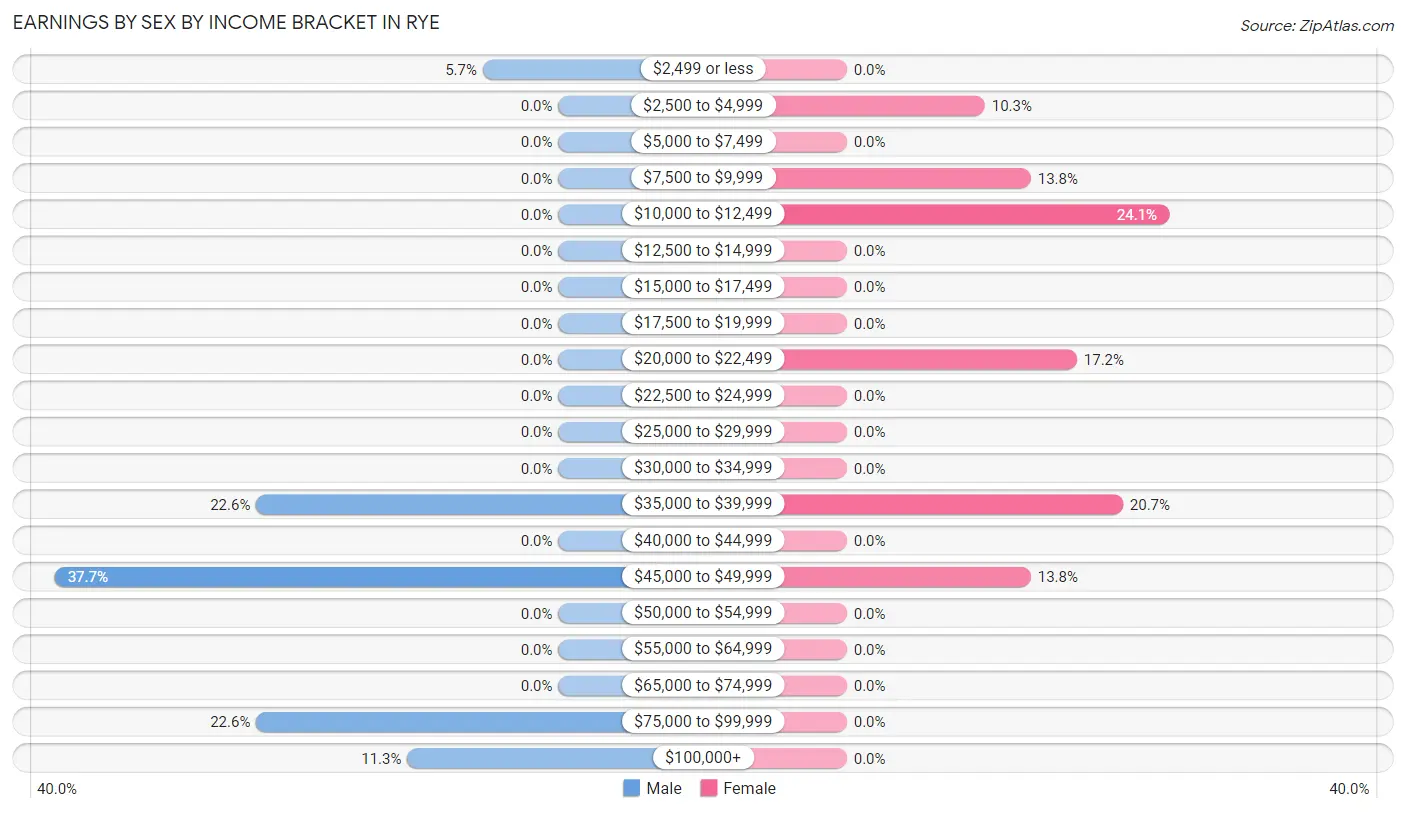
Earnings by Sex by Income Bracket in Rye
The most common earnings brackets in Rye are $45,000 to $49,999 for men (20 | 37.7%) and $10,000 to $12,499 for women (7 | 24.1%).
| Income | Male | Female |
| $2,499 or less | 3 (5.7%) | 0 (0.0%) |
| $2,500 to $4,999 | 0 (0.0%) | 3 (10.3%) |
| $5,000 to $7,499 | 0 (0.0%) | 0 (0.0%) |
| $7,500 to $9,999 | 0 (0.0%) | 4 (13.8%) |
| $10,000 to $12,499 | 0 (0.0%) | 7 (24.1%) |
| $12,500 to $14,999 | 0 (0.0%) | 0 (0.0%) |
| $15,000 to $17,499 | 0 (0.0%) | 0 (0.0%) |
| $17,500 to $19,999 | 0 (0.0%) | 0 (0.0%) |
| $20,000 to $22,499 | 0 (0.0%) | 5 (17.2%) |
| $22,500 to $24,999 | 0 (0.0%) | 0 (0.0%) |
| $25,000 to $29,999 | 0 (0.0%) | 0 (0.0%) |
| $30,000 to $34,999 | 0 (0.0%) | 0 (0.0%) |
| $35,000 to $39,999 | 12 (22.6%) | 6 (20.7%) |
| $40,000 to $44,999 | 0 (0.0%) | 0 (0.0%) |
| $45,000 to $49,999 | 20 (37.7%) | 4 (13.8%) |
| $50,000 to $54,999 | 0 (0.0%) | 0 (0.0%) |
| $55,000 to $64,999 | 0 (0.0%) | 0 (0.0%) |
| $65,000 to $74,999 | 0 (0.0%) | 0 (0.0%) |
| $75,000 to $99,999 | 12 (22.6%) | 0 (0.0%) |
| $100,000+ | 6 (11.3%) | 0 (0.0%) |
| Total | 53 (100.0%) | 29 (100.0%) |
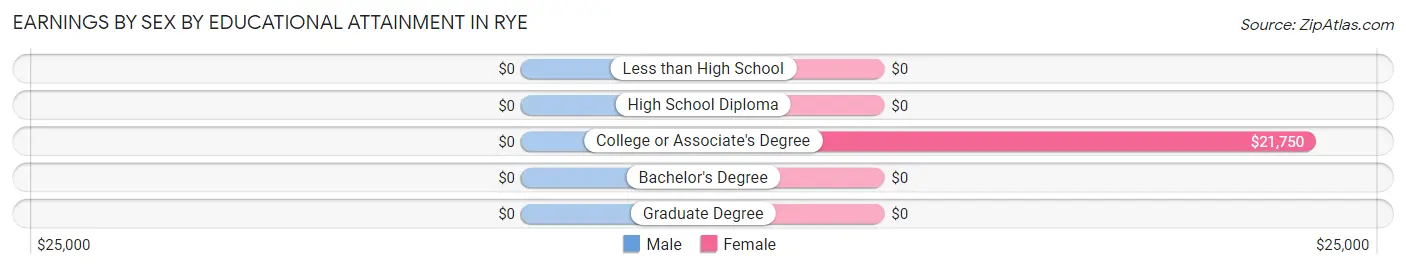
Earnings by Sex by Educational Attainment in Rye
| Educational Attainment | Male Income | Female Income |
| Less than High School | - | - |
| High School Diploma | - | - |
| College or Associate's Degree | - | - |
| Bachelor's Degree | - | - |
| Graduate Degree | - | - |
| Total | $48,938 | $0 |
Family Income in Rye
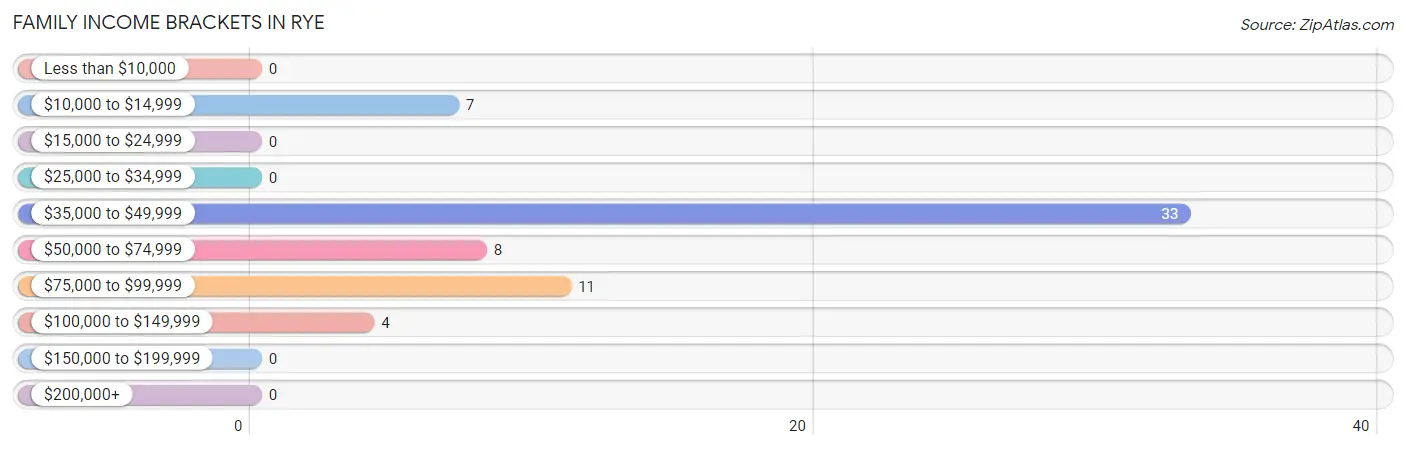
Family Income Brackets in Rye
According to the Rye family income data, there are 33 families falling into the $35,000 to $49,999 income range, which is the most common income bracket and makes up 52.4% of all families.
| Income Bracket | # Families | % Families |
| Less than $10,000 | 0 | 0.0% |
| $10,000 to $14,999 | 7 | 11.1% |
| $15,000 to $24,999 | 0 | 0.0% |
| $25,000 to $34,999 | 0 | 0.0% |
| $35,000 to $49,999 | 33 | 52.4% |
| $50,000 to $74,999 | 8 | 12.7% |
| $75,000 to $99,999 | 11 | 17.5% |
| $100,000 to $149,999 | 4 | 6.3% |
| $150,000 to $199,999 | 0 | 0.0% |
| $200,000+ | 0 | 0.0% |
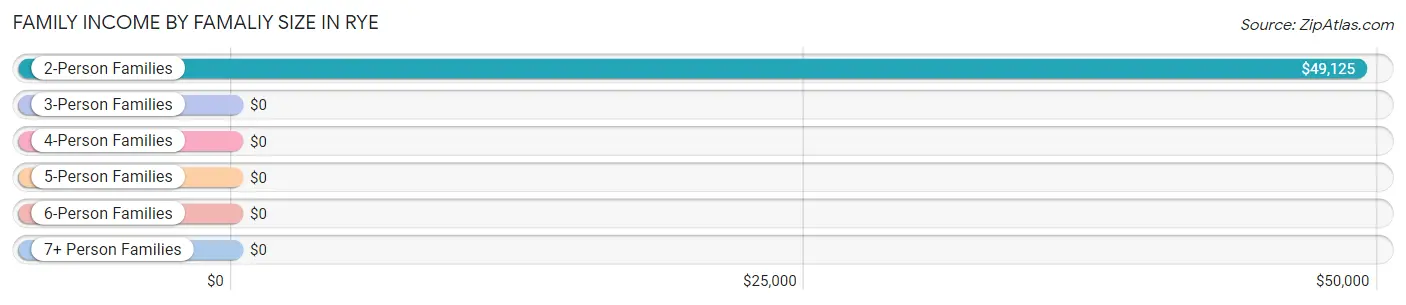
Family Income by Famaliy Size in Rye
2-person families (52 | 82.5%) account for the highest median family income in Rye with $49,125 per family, while 2-person families (52 | 82.5%) have the highest median income of $24,562 per family member.
| Income Bracket | # Families | Median Income |
| 2-Person Families | 52 (82.5%) | $49,125 |
| 3-Person Families | 0 (0.0%) | $0 |
| 4-Person Families | 7 (11.1%) | $0 |
| 5-Person Families | 4 (6.4%) | $0 |
| 6-Person Families | 0 (0.0%) | $0 |
| 7+ Person Families | 0 (0.0%) | $0 |
| Total | 63 (100.0%) | $48,938 |
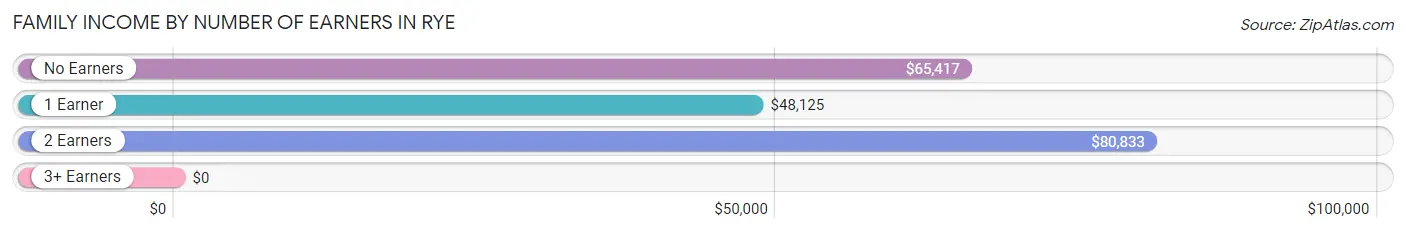
Family Income by Number of Earners in Rye
| Number of Earners | # Families | Median Income |
| No Earners | 13 (20.6%) | $65,417 |
| 1 Earner | 38 (60.3%) | $48,125 |
| 2 Earners | 12 (19.1%) | $80,833 |
| 3+ Earners | 0 (0.0%) | $0 |
| Total | 63 (100.0%) | $48,938 |
Household Income in Rye
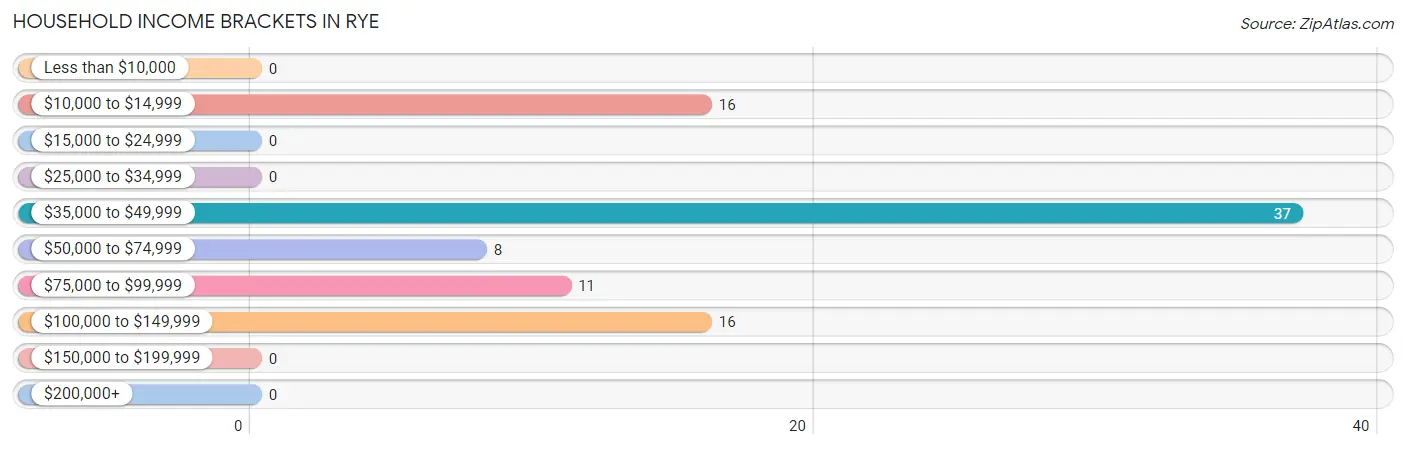
Household Income Brackets in Rye
With 37 households falling in the category, the $35,000 to $49,999 income range is the most frequent in Rye, accounting for 42.0% of all households.
| Income Bracket | # Households | % Households |
| Less than $10,000 | 0 | 0.0% |
| $10,000 to $14,999 | 16 | 18.2% |
| $15,000 to $24,999 | 0 | 0.0% |
| $25,000 to $34,999 | 0 | 0.0% |
| $35,000 to $49,999 | 37 | 42.0% |
| $50,000 to $74,999 | 8 | 9.1% |
| $75,000 to $99,999 | 11 | 12.5% |
| $100,000 to $149,999 | 16 | 18.2% |
| $150,000 to $199,999 | 0 | 0.0% |
| $200,000+ | 0 | 0.0% |
Household Income by Householder Age in Rye
The median household income in Rye is $48,875, with the highest median household income of $100,000 found in the 45 to 64 years age bracket for the primary householder. A total of 24 households (27.3%) fall into this category. Meanwhile, the 15 to 24 years age bracket for the primary householder has the lowest median household income of $0, with 7 households (8.0%) in this group.
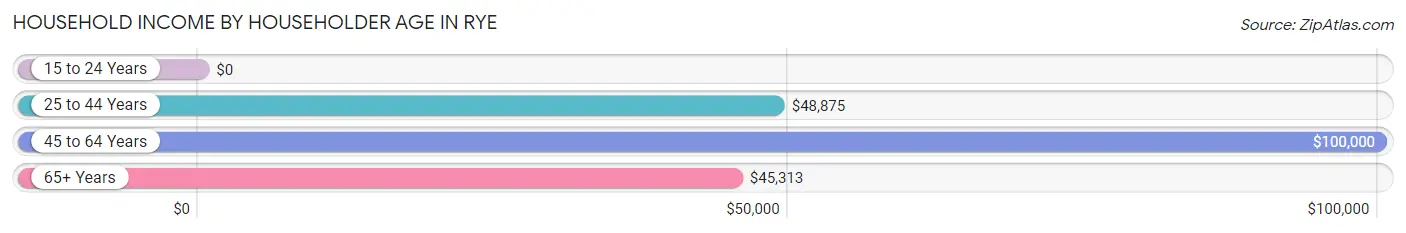
| Income Bracket | # Households | Median Income |
| 15 to 24 Years | 7 (8.0%) | $0 |
| 25 to 44 Years | 36 (40.9%) | $48,875 |
| 45 to 64 Years | 24 (27.3%) | $100,000 |
| 65+ Years | 21 (23.9%) | $45,313 |
| Total | 88 (100.0%) | $48,875 |
Poverty in Rye
Income Below Poverty by Sex and Age in Rye
With 28.9% poverty level for males and 8.6% for females among the residents of Rye, under 5 year old males and 18 to 24 year old females are the most vulnerable to poverty, with 26 males (81.2%) and 7 females (100.0%) in their respective age groups living below the poverty level.
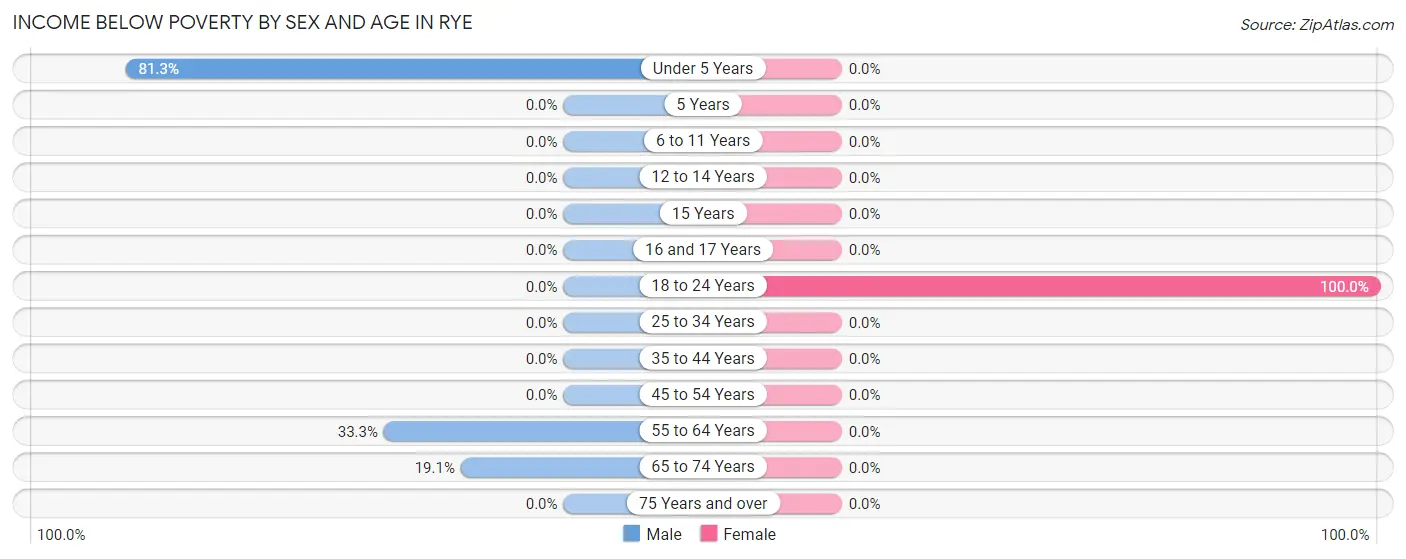
| Age Bracket | Male | Female |
| Under 5 Years | 26 (81.2%) | 0 (0.0%) |
| 5 Years | 0 (0.0%) | 0 (0.0%) |
| 6 to 11 Years | 0 (0.0%) | 0 (0.0%) |
| 12 to 14 Years | 0 (0.0%) | 0 (0.0%) |
| 15 Years | 0 (0.0%) | 0 (0.0%) |
| 16 and 17 Years | 0 (0.0%) | 0 (0.0%) |
| 18 to 24 Years | 0 (0.0%) | 7 (100.0%) |
| 25 to 34 Years | 0 (0.0%) | 0 (0.0%) |
| 35 to 44 Years | 0 (0.0%) | 0 (0.0%) |
| 45 to 54 Years | 0 (0.0%) | 0 (0.0%) |
| 55 to 64 Years | 5 (33.3%) | 0 (0.0%) |
| 65 to 74 Years | 4 (19.1%) | 0 (0.0%) |
| 75 Years and over | 0 (0.0%) | 0 (0.0%) |
| Total | 35 (28.9%) | 7 (8.6%) |
Income Above Poverty by Sex and Age in Rye
According to the poverty statistics in Rye, males aged 6 to 11 years and females aged 6 to 11 years are the age groups that are most secure financially, with 100.0% of males and 100.0% of females in these age groups living above the poverty line.
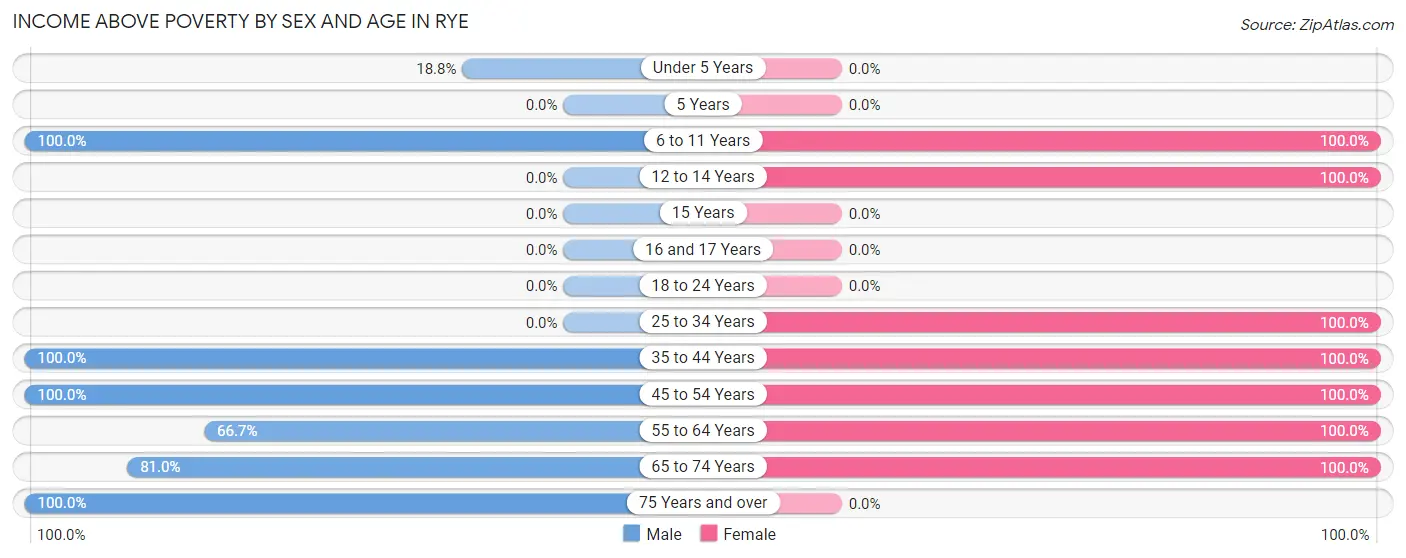
| Age Bracket | Male | Female |
| Under 5 Years | 6 (18.8%) | 0 (0.0%) |
| 5 Years | 0 (0.0%) | 0 (0.0%) |
| 6 to 11 Years | 6 (100.0%) | 22 (100.0%) |
| 12 to 14 Years | 0 (0.0%) | 10 (100.0%) |
| 15 Years | 0 (0.0%) | 0 (0.0%) |
| 16 and 17 Years | 0 (0.0%) | 0 (0.0%) |
| 18 to 24 Years | 0 (0.0%) | 0 (0.0%) |
| 25 to 34 Years | 0 (0.0%) | 7 (100.0%) |
| 35 to 44 Years | 38 (100.0%) | 9 (100.0%) |
| 45 to 54 Years | 6 (100.0%) | 6 (100.0%) |
| 55 to 64 Years | 10 (66.7%) | 11 (100.0%) |
| 65 to 74 Years | 17 (80.9%) | 9 (100.0%) |
| 75 Years and over | 3 (100.0%) | 0 (0.0%) |
| Total | 86 (71.1%) | 74 (91.4%) |
Income Below Poverty Among Married-Couple Families in Rye
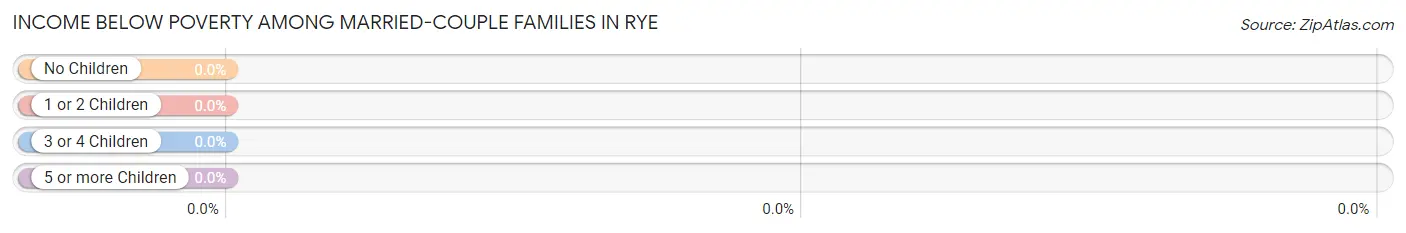
| Children | Above Poverty | Below Poverty |
| No Children | 25 (100.0%) | 0 (0.0%) |
| 1 or 2 Children | 7 (100.0%) | 0 (0.0%) |
| 3 or 4 Children | 4 (100.0%) | 0 (0.0%) |
| 5 or more Children | 0 (0.0%) | 0 (0.0%) |
| Total | 36 (100.0%) | 0 (0.0%) |
Income Below Poverty Among Single-Parent Households in Rye
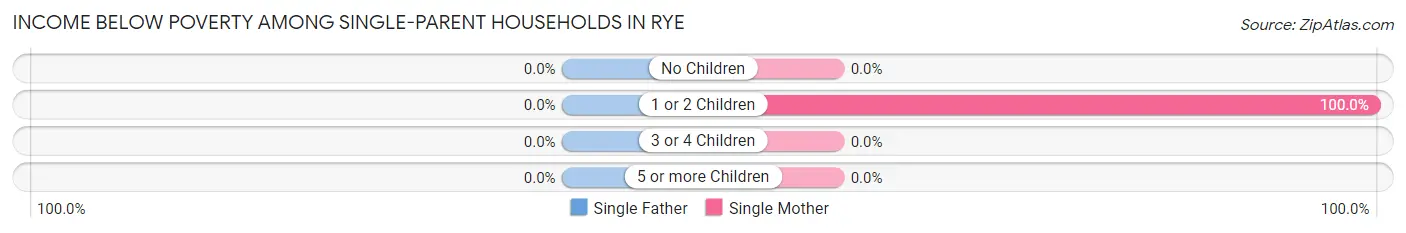
| Children | Single Father | Single Mother |
| No Children | 0 (0.0%) | 0 (0.0%) |
| 1 or 2 Children | 0 (0.0%) | 7 (100.0%) |
| 3 or 4 Children | 0 (0.0%) | 0 (0.0%) |
| 5 or more Children | 0 (0.0%) | 0 (0.0%) |
| Total | 0 (0.0%) | 7 (100.0%) |
Income Below Poverty Among Married-Couple vs Single-Parent Households in Rye
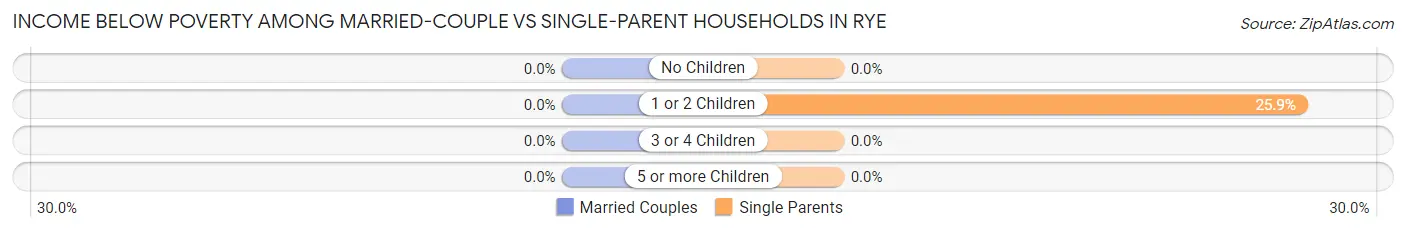
| Children | Married-Couple Families | Single-Parent Households |
| No Children | 0 (0.0%) | 0 (0.0%) |
| 1 or 2 Children | 0 (0.0%) | 7 (25.9%) |
| 3 or 4 Children | 0 (0.0%) | 0 (0.0%) |
| 5 or more Children | 0 (0.0%) | 0 (0.0%) |
| Total | 0 (0.0%) | 7 (25.9%) |
Race in Rye
The most populous races in Rye are White / Caucasian (202 | 100.0%), and Hispanic or Latino (60 | 29.7%).
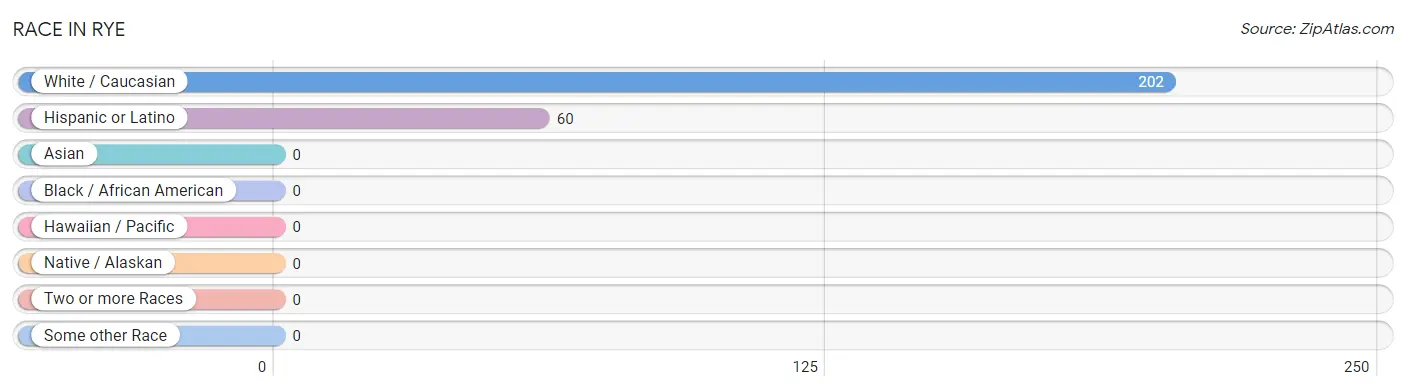
| Race | # Population | % Population |
| Asian | 0 | 0.0% |
| Black / African American | 0 | 0.0% |
| Hawaiian / Pacific | 0 | 0.0% |
| Hispanic or Latino | 60 | 29.7% |
| Native / Alaskan | 0 | 0.0% |
| White / Caucasian | 202 | 100.0% |
| Two or more Races | 0 | 0.0% |
| Some other Race | 0 | 0.0% |
| Total | 202 | 100.0% |
Ancestry in Rye
The most populous ancestries reported in Rye are Mexican (49 | 24.3%), English (31 | 15.3%), German (28 | 13.9%), Irish (24 | 11.9%), and Italian (23 | 11.4%), together accounting for 76.7% of all Rye residents.
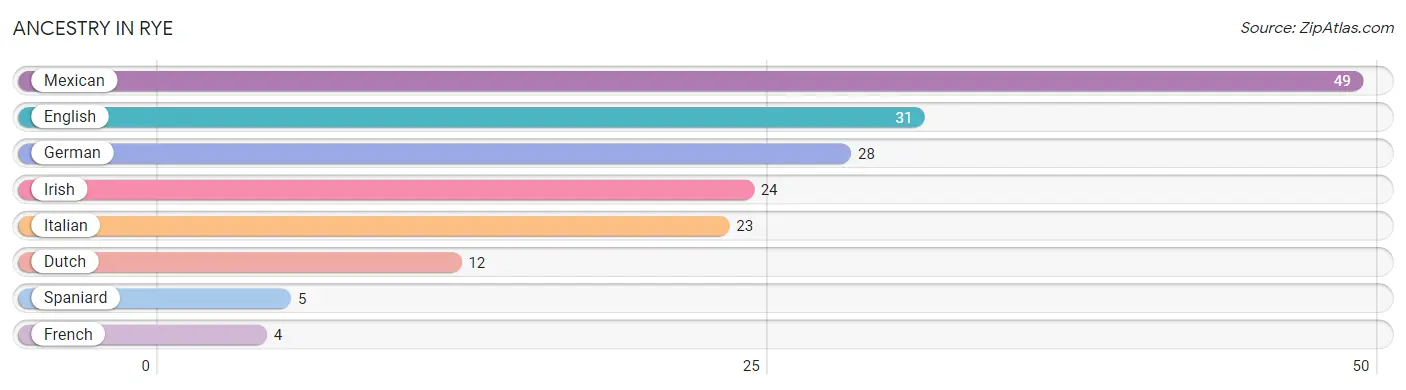
| Ancestry | # Population | % Population |
| Dutch | 12 | 5.9% |
| English | 31 | 15.3% |
| French | 4 | 2.0% |
| German | 28 | 13.9% |
| Irish | 24 | 11.9% |
| Italian | 23 | 11.4% |
| Mexican | 49 | 24.3% |
| Spaniard | 5 | 2.5% | View All 8 Rows |
Immigrants in Rye

| Immigration Origin | # Population | % Population | View All 0 Rows |
Sex and Age in Rye
Sex and Age in Rye
The most populous age groups in Rye are Under 5 Years (32 | 26.5%) for men and 10 to 14 Years (27 | 33.3%) for women.
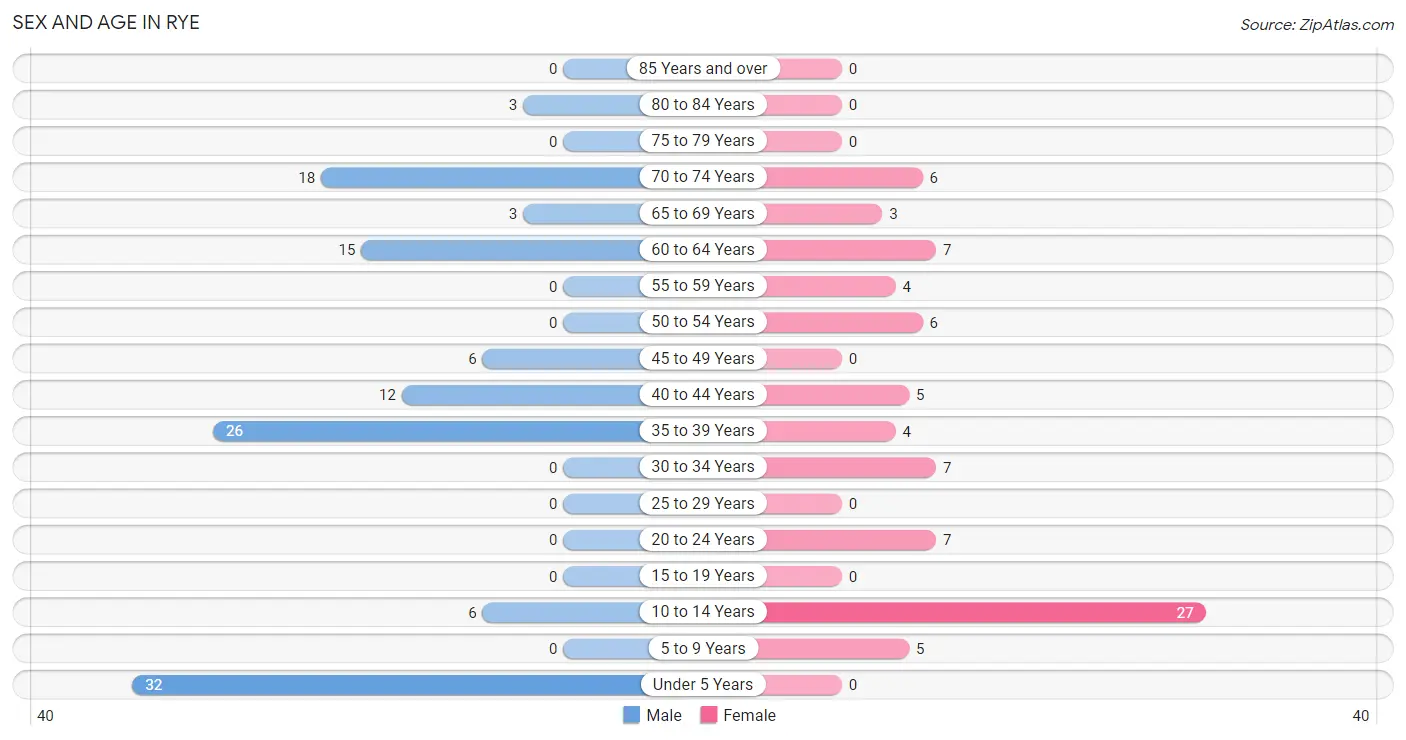
| Age Bracket | Male | Female |
| Under 5 Years | 32 (26.5%) | 0 (0.0%) |
| 5 to 9 Years | 0 (0.0%) | 5 (6.2%) |
| 10 to 14 Years | 6 (5.0%) | 27 (33.3%) |
| 15 to 19 Years | 0 (0.0%) | 0 (0.0%) |
| 20 to 24 Years | 0 (0.0%) | 7 (8.6%) |
| 25 to 29 Years | 0 (0.0%) | 0 (0.0%) |
| 30 to 34 Years | 0 (0.0%) | 7 (8.6%) |
| 35 to 39 Years | 26 (21.5%) | 4 (4.9%) |
| 40 to 44 Years | 12 (9.9%) | 5 (6.2%) |
| 45 to 49 Years | 6 (5.0%) | 0 (0.0%) |
| 50 to 54 Years | 0 (0.0%) | 6 (7.4%) |
| 55 to 59 Years | 0 (0.0%) | 4 (4.9%) |
| 60 to 64 Years | 15 (12.4%) | 7 (8.6%) |
| 65 to 69 Years | 3 (2.5%) | 3 (3.7%) |
| 70 to 74 Years | 18 (14.9%) | 6 (7.4%) |
| 75 to 79 Years | 0 (0.0%) | 0 (0.0%) |
| 80 to 84 Years | 3 (2.5%) | 0 (0.0%) |
| 85 Years and over | 0 (0.0%) | 0 (0.0%) |
| Total | 121 (100.0%) | 81 (100.0%) |
Families and Households in Rye
Median Family Size in Rye
The median family size in Rye is 2.71 persons per family, with single female/mother families (7 | 11.1%) accounting for the largest median family size of 4.71 persons per family. On the other hand, single male/father families (20 | 31.8%) represent the smallest median family size with 1.85 persons per family.
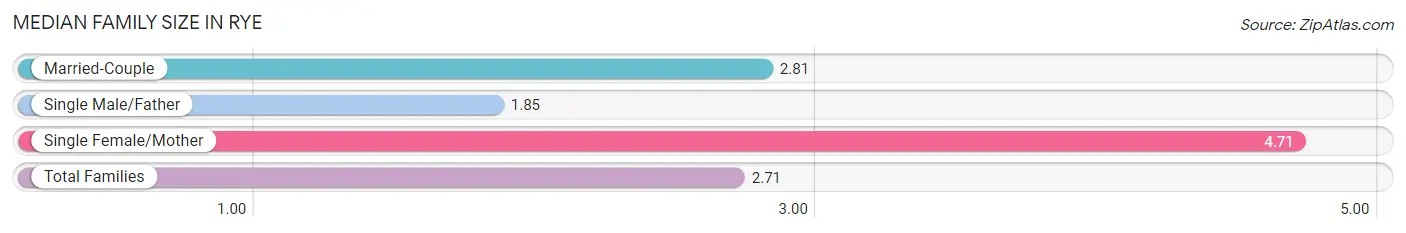
| Family Type | # Families | Family Size |
| Married-Couple | 36 (57.1%) | 2.81 |
| Single Male/Father | 20 (31.8%) | 1.85 |
| Single Female/Mother | 7 (11.1%) | 4.71 |
| Total Families | 63 (100.0%) | 2.71 |
Median Household Size in Rye
The median household size in Rye is 2.30 persons per household, with single female/mother households (7 | 8.0%) accounting for the largest median household size of 4.71 persons per household. non-family households (25 | 28.4%) represent the smallest median household size with 1.24 persons per household.
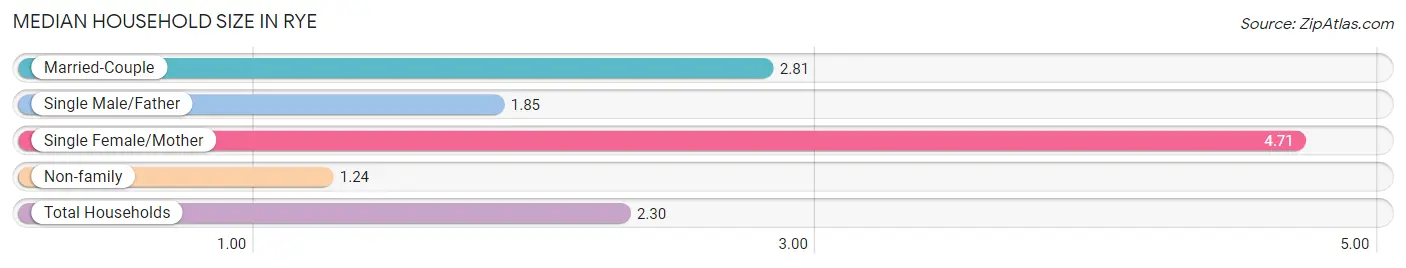
| Household Type | # Households | Household Size |
| Married-Couple | 36 (40.9%) | 2.81 |
| Single Male/Father | 20 (22.7%) | 1.85 |
| Single Female/Mother | 7 (8.0%) | 4.71 |
| Non-family | 25 (28.4%) | 1.24 |
| Total Households | 88 (100.0%) | 2.30 |
Household Size by Marriage Status in Rye
Out of a total of 88 households in Rye, 63 (71.6%) are family households, while 25 (28.4%) are nonfamily households. The most numerous type of family households are 2-person households, comprising 52, and the most common type of nonfamily households are 1-person households, comprising 19.
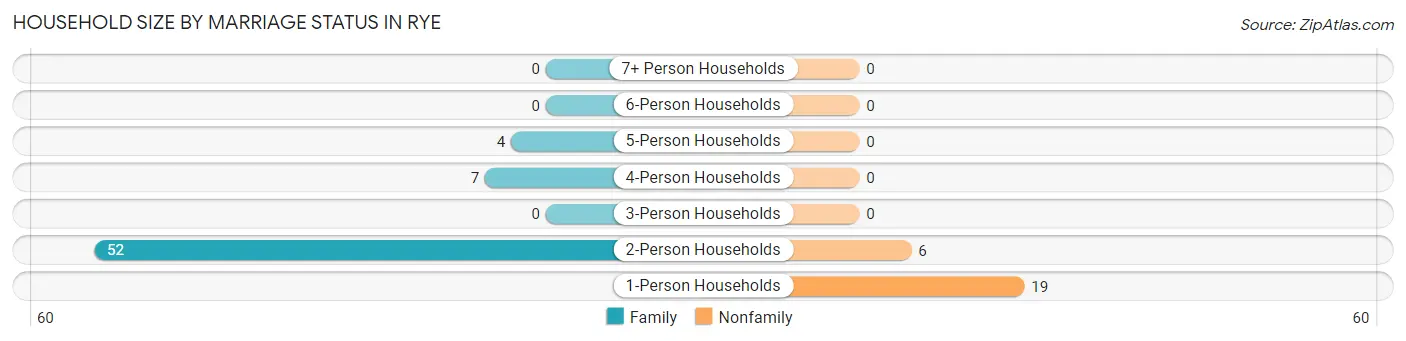
| Household Size | Family Households | Nonfamily Households |
| 1-Person Households | - | 19 (21.6%) |
| 2-Person Households | 52 (59.1%) | 6 (6.8%) |
| 3-Person Households | 0 (0.0%) | 0 (0.0%) |
| 4-Person Households | 7 (8.0%) | 0 (0.0%) |
| 5-Person Households | 4 (4.5%) | 0 (0.0%) |
| 6-Person Households | 0 (0.0%) | 0 (0.0%) |
| 7+ Person Households | 0 (0.0%) | 0 (0.0%) |
| Total | 63 (71.6%) | 25 (28.4%) |
Female Fertility in Rye
Fertility by Age in Rye
| Age Bracket | Women with Births | Births / 1,000 Women |
| 15 to 19 years | 0 (0.0%) | 0.0 |
| 20 to 34 years | 0 (0.0%) | 0.0 |
| 35 to 50 years | 0 (0.0%) | 0.0 |
| Total | 0 (0.0%) | 0.0 |
Fertility by Age by Marriage Status in Rye
| Age Bracket | Married | Unmarried |
| 15 to 19 years | 0 (0.0%) | 0 (0.0%) |
| 20 to 34 years | 0 (0.0%) | 0 (0.0%) |
| 35 to 50 years | 0 (0.0%) | 0 (0.0%) |
| Total | 0 (0.0%) | 0 (0.0%) |
Fertility by Education in Rye
| Educational Attainment | Women with Births | Births / 1,000 Women |
| Less than High School | 0 (0.0%) | 0.0 |
| High School Diploma | 0 (0.0%) | 0.0 |
| College or Associate's Degree | 0 (0.0%) | 0.0 |
| Bachelor's Degree | 0 (0.0%) | 0.0 |
| Graduate Degree | 0 (0.0%) | 0.0 |
| Total | 0 (0.0%) | 0.0 |
Fertility by Education by Marriage Status in Rye
| Educational Attainment | Married | Unmarried |
| Less than High School | 0 (0.0%) | 0 (0.0%) |
| High School Diploma | 0 (0.0%) | 0 (0.0%) |
| College or Associate's Degree | 0 (0.0%) | 0 (0.0%) |
| Bachelor's Degree | 0 (0.0%) | 0 (0.0%) |
| Graduate Degree | 0 (0.0%) | 0 (0.0%) |
| Total | 0 (0.0%) | 0 (0.0%) |
Employment Characteristics in Rye
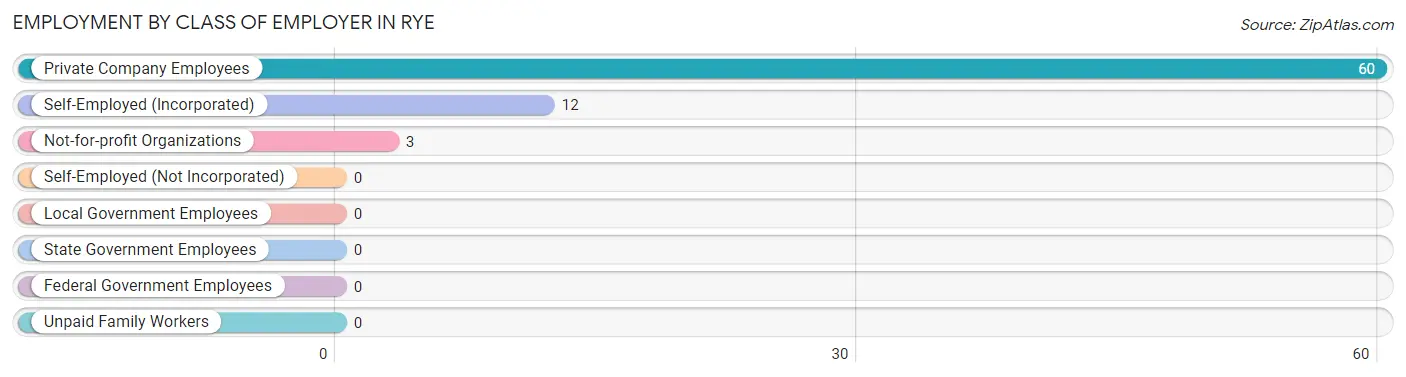
Employment by Class of Employer in Rye
Among the 75 employed individuals in Rye, private company employees (60 | 80.0%), self-employed (incorporated) (12 | 16.0%), and not-for-profit organizations (3 | 4.0%) make up the most common classes of employment.
| Employer Class | # Employees | % Employees |
| Private Company Employees | 60 | 80.0% |
| Self-Employed (Incorporated) | 12 | 16.0% |
| Self-Employed (Not Incorporated) | 0 | 0.0% |
| Not-for-profit Organizations | 3 | 4.0% |
| Local Government Employees | 0 | 0.0% |
| State Government Employees | 0 | 0.0% |
| Federal Government Employees | 0 | 0.0% |
| Unpaid Family Workers | 0 | 0.0% |
| Total | 75 | 100.0% |
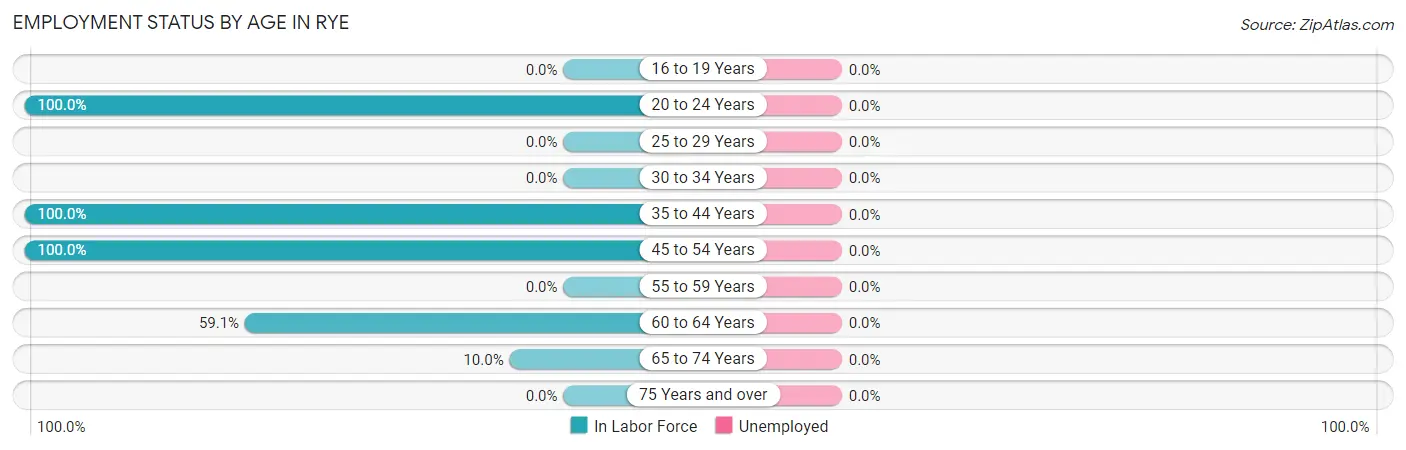
Employment Status by Age in Rye
| Age Bracket | In Labor Force | Unemployed |
| 16 to 19 Years | 0 (0.0%) | 0 (0.0%) |
| 20 to 24 Years | 7 (100.0%) | 0 (0.0%) |
| 25 to 29 Years | 0 (0.0%) | 0 (0.0%) |
| 30 to 34 Years | 0 (0.0%) | 0 (0.0%) |
| 35 to 44 Years | 47 (100.0%) | 0 (0.0%) |
| 45 to 54 Years | 12 (100.0%) | 0 (0.0%) |
| 55 to 59 Years | 0 (0.0%) | 0 (0.0%) |
| 60 to 64 Years | 13 (59.1%) | 0 (0.0%) |
| 65 to 74 Years | 3 (10.0%) | 0 (0.0%) |
| 75 Years and over | 0 (0.0%) | 0 (0.0%) |
| Total | 82 (62.1%) | 0 (0.0%) |
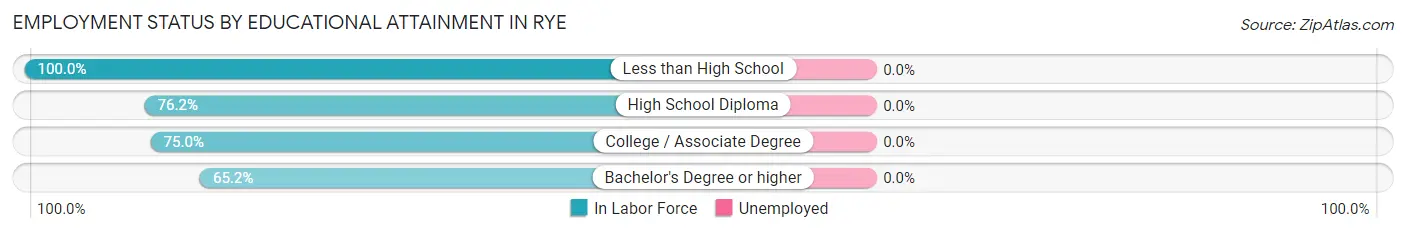
Employment Status by Educational Attainment in Rye
| Educational Attainment | In Labor Force | Unemployed |
| Less than High School | 20 (100.0%) | 0 (0.0%) |
| High School Diploma | 16 (76.2%) | 0 (0.0%) |
| College / Associate Degree | 21 (75.0%) | 0 (0.0%) |
| Bachelor's Degree or higher | 15 (65.2%) | 0 (0.0%) |
| Total | 72 (78.3%) | 0 (0.0%) |
Employment Occupations by Sex in Rye
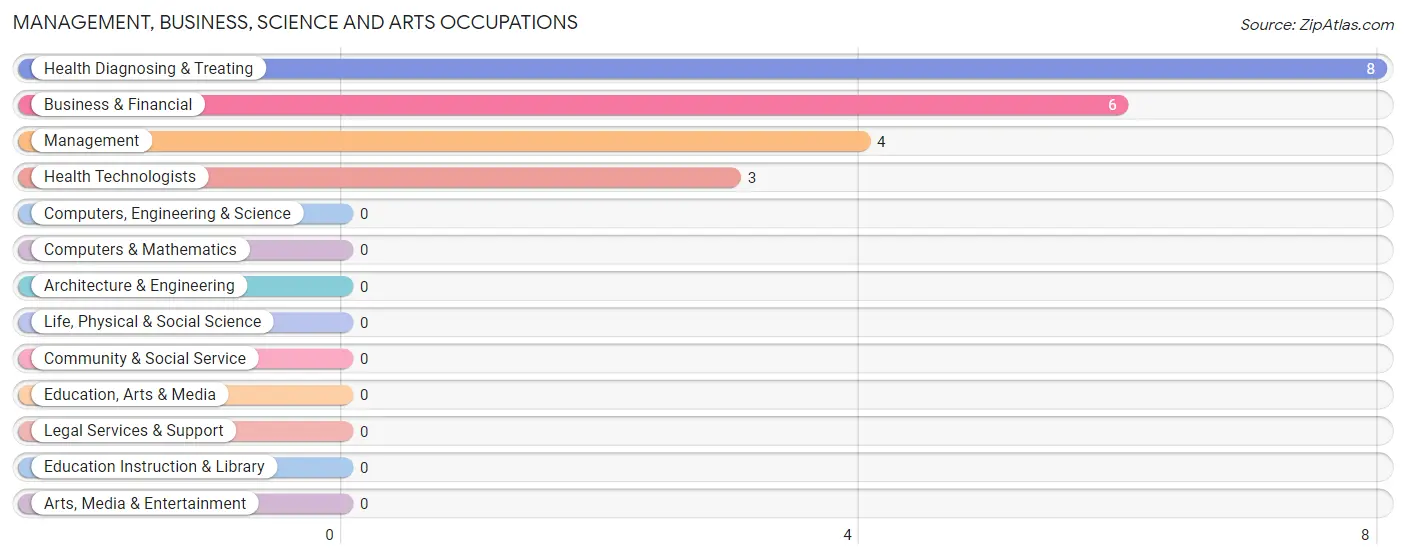
Management, Business, Science and Arts Occupations
The most common Management, Business, Science and Arts occupations in Rye are Health Diagnosing & Treating (8 | 9.8%), Business & Financial (6 | 7.3%), Management (4 | 4.9%), and Health Technologists (3 | 3.7%).
Management, Business, Science and Arts Occupations by Sex
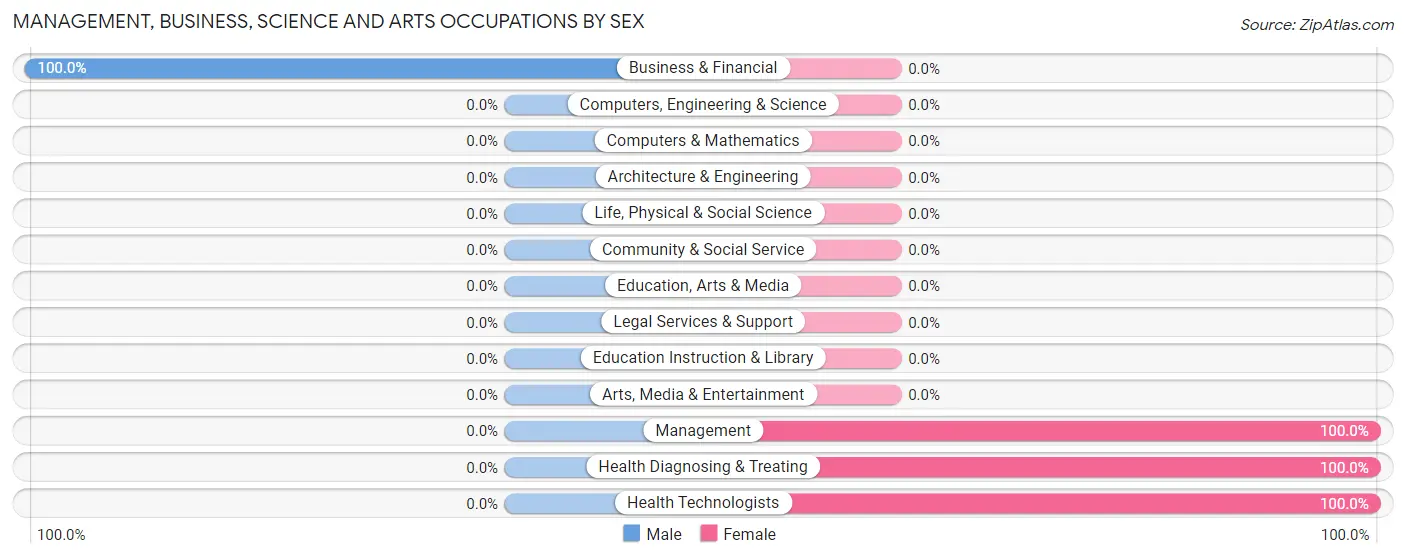
| Occupation | Male | Female |
| Management | 0 (0.0%) | 4 (100.0%) |
| Business & Financial | 6 (100.0%) | 0 (0.0%) |
| Computers, Engineering & Science | 0 (0.0%) | 0 (0.0%) |
| Computers & Mathematics | 0 (0.0%) | 0 (0.0%) |
| Architecture & Engineering | 0 (0.0%) | 0 (0.0%) |
| Life, Physical & Social Science | 0 (0.0%) | 0 (0.0%) |
| Community & Social Service | 0 (0.0%) | 0 (0.0%) |
| Education, Arts & Media | 0 (0.0%) | 0 (0.0%) |
| Legal Services & Support | 0 (0.0%) | 0 (0.0%) |
| Education Instruction & Library | 0 (0.0%) | 0 (0.0%) |
| Arts, Media & Entertainment | 0 (0.0%) | 0 (0.0%) |
| Health Diagnosing & Treating | 0 (0.0%) | 8 (100.0%) |
| Health Technologists | 0 (0.0%) | 3 (100.0%) |
| Total (Category) | 6 (33.3%) | 12 (66.7%) |
| Total (Overall) | 53 (64.6%) | 29 (35.4%) |
Services Occupations
The most common Services occupations in Rye are Personal Care & Service (4 | 4.9%), and Cleaning & Maintenance (3 | 3.7%).
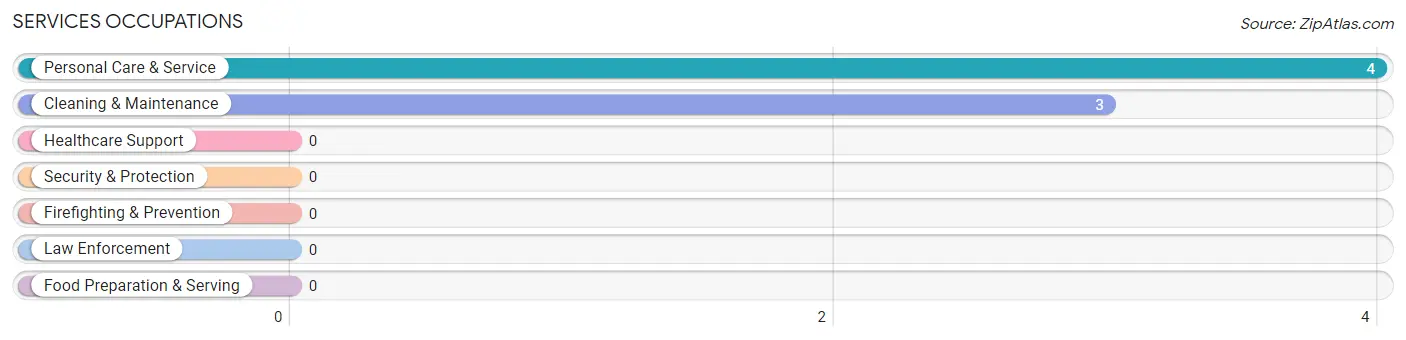
Services Occupations by Sex
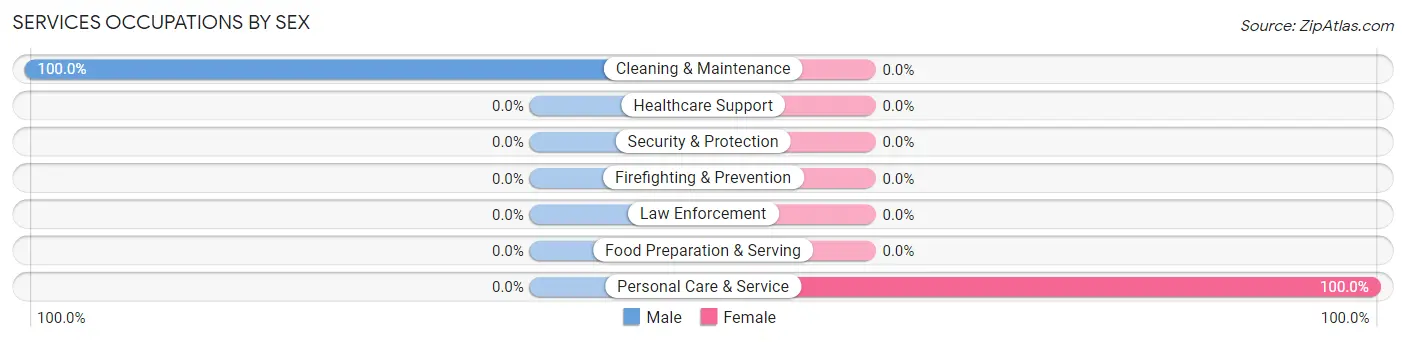
| Occupation | Male | Female |
| Healthcare Support | 0 (0.0%) | 0 (0.0%) |
| Security & Protection | 0 (0.0%) | 0 (0.0%) |
| Firefighting & Prevention | 0 (0.0%) | 0 (0.0%) |
| Law Enforcement | 0 (0.0%) | 0 (0.0%) |
| Food Preparation & Serving | 0 (0.0%) | 0 (0.0%) |
| Cleaning & Maintenance | 3 (100.0%) | 0 (0.0%) |
| Personal Care & Service | 0 (0.0%) | 4 (100.0%) |
| Total (Category) | 3 (42.9%) | 4 (57.1%) |
| Total (Overall) | 53 (64.6%) | 29 (35.4%) |
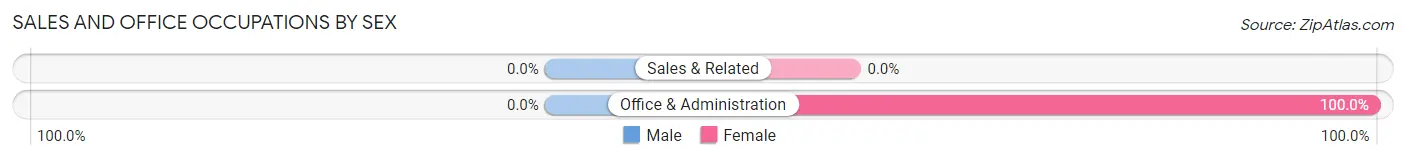
Sales and Office Occupations
The most common Sales and Office occupations in Rye are , and Office & Administration (7 | 8.5%).
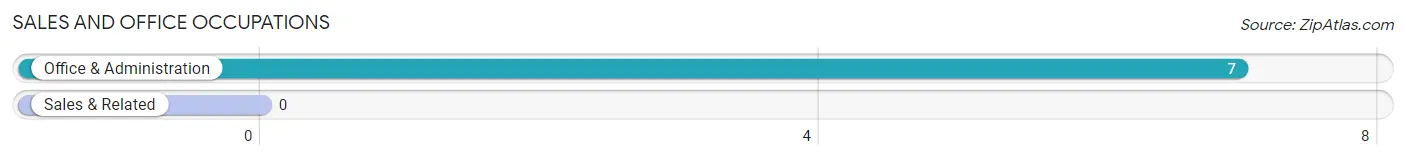
Sales and Office Occupations by Sex
| Occupation | Male | Female |
| Sales & Related | 0 (0.0%) | 0 (0.0%) |
| Office & Administration | 0 (0.0%) | 7 (100.0%) |
| Total (Category) | 0 (0.0%) | 7 (100.0%) |
| Total (Overall) | 53 (64.6%) | 29 (35.4%) |
Natural Resources, Construction and Maintenance Occupations
The most common Natural Resources, Construction and Maintenance occupations in Rye are Construction & Extraction (26 | 31.7%), Farming, Fishing & Forestry (6 | 7.3%), and Installation, Maintenance & Repair (6 | 7.3%).
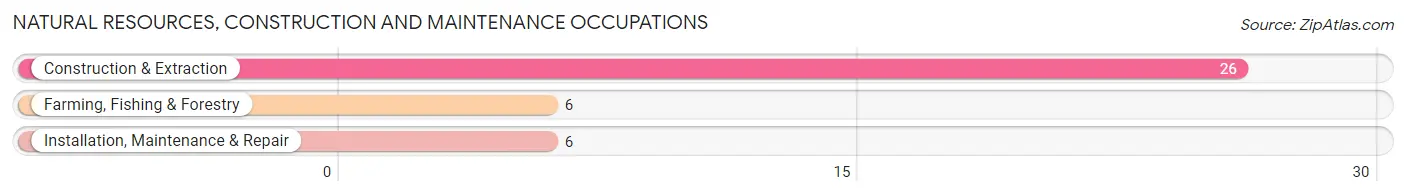
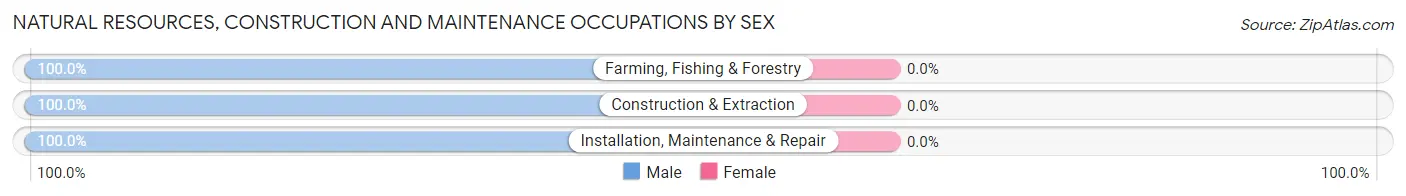
Natural Resources, Construction and Maintenance Occupations by Sex
| Occupation | Male | Female |
| Farming, Fishing & Forestry | 6 (100.0%) | 0 (0.0%) |
| Construction & Extraction | 26 (100.0%) | 0 (0.0%) |
| Installation, Maintenance & Repair | 6 (100.0%) | 0 (0.0%) |
| Total (Category) | 38 (100.0%) | 0 (0.0%) |
| Total (Overall) | 53 (64.6%) | 29 (35.4%) |
Production, Transportation and Moving Occupations
The most common Production, Transportation and Moving occupations in Rye are Production (6 | 7.3%), and Transportation (6 | 7.3%).
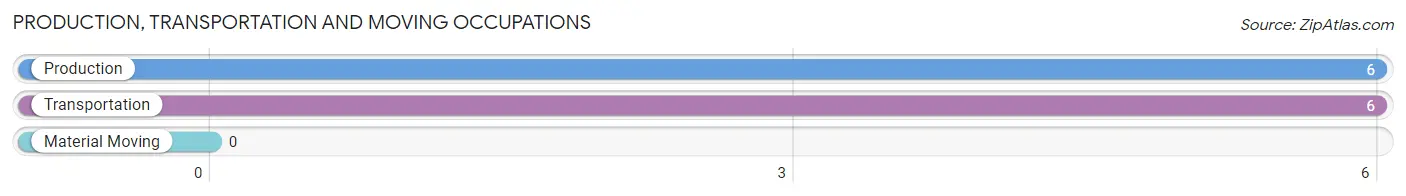
Production, Transportation and Moving Occupations by Sex
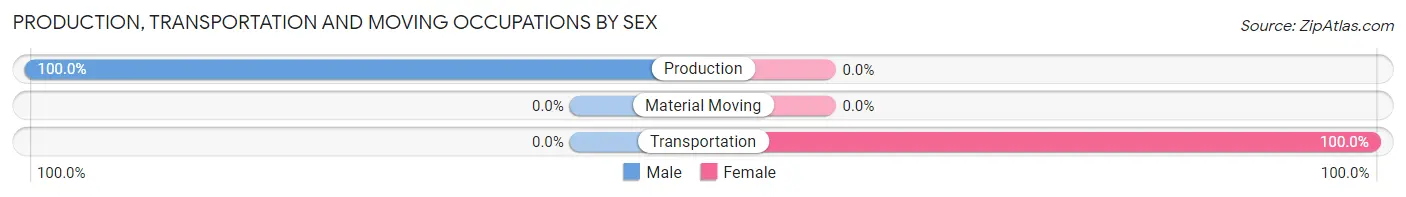
| Occupation | Male | Female |
| Production | 6 (100.0%) | 0 (0.0%) |
| Transportation | 0 (0.0%) | 6 (100.0%) |
| Material Moving | 0 (0.0%) | 0 (0.0%) |
| Total (Category) | 6 (50.0%) | 6 (50.0%) |
| Total (Overall) | 53 (64.6%) | 29 (35.4%) |
Employment Industries by Sex in Rye
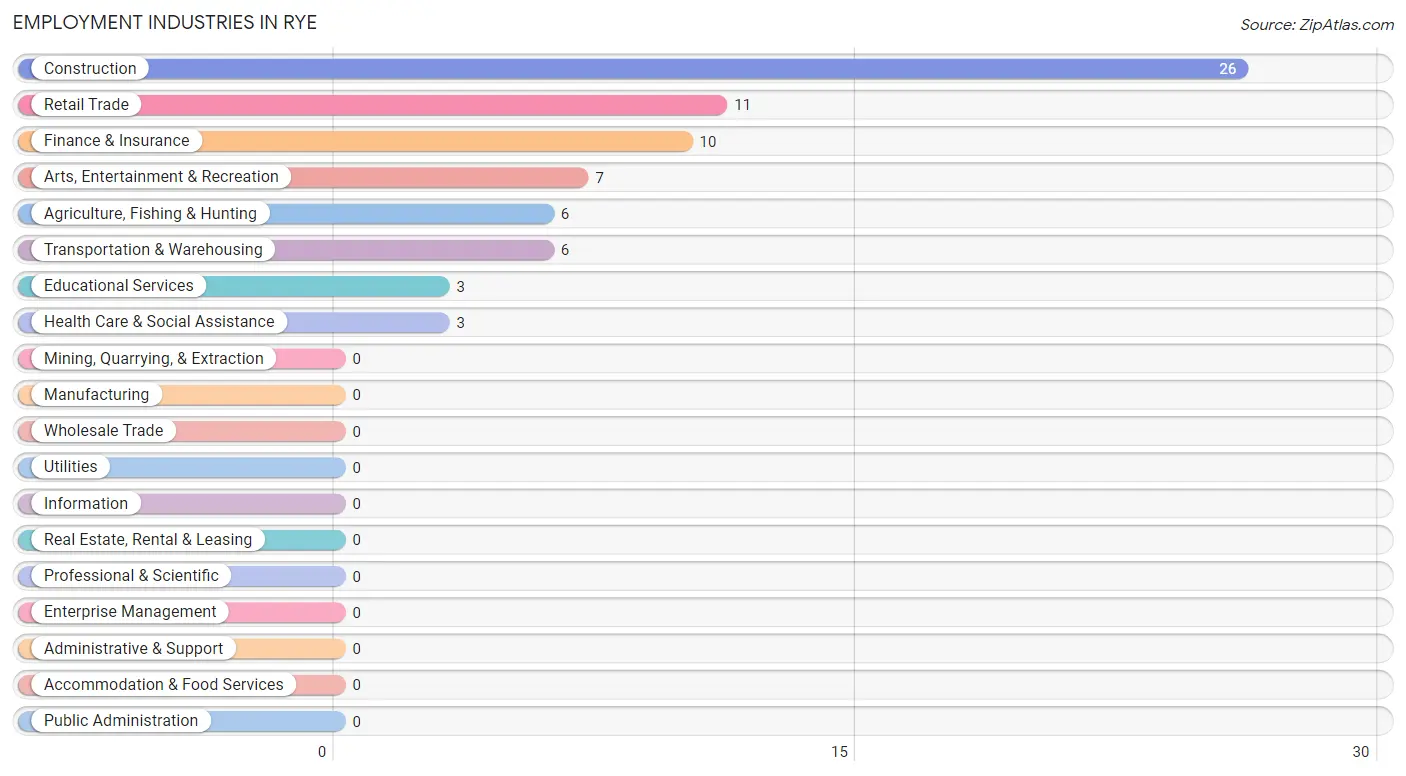
Employment Industries in Rye
The major employment industries in Rye include Construction (26 | 31.7%), Retail Trade (11 | 13.4%), Finance & Insurance (10 | 12.2%), Arts, Entertainment & Recreation (7 | 8.5%), and Agriculture, Fishing & Hunting (6 | 7.3%).
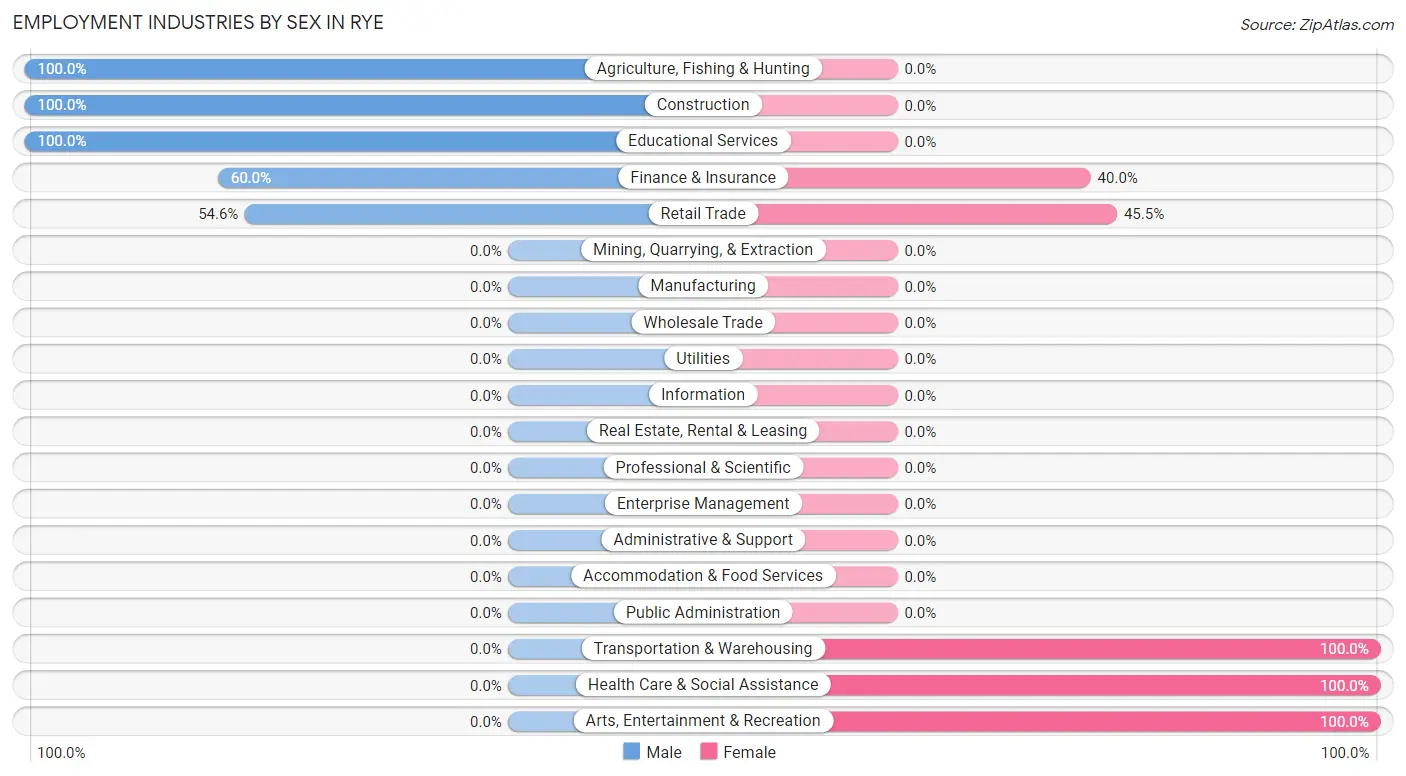
Employment Industries by Sex in Rye
The Rye industries that see more men than women are Agriculture, Fishing & Hunting (100.0%), Construction (100.0%), and Educational Services (100.0%), whereas the industries that tend to have a higher number of women are Transportation & Warehousing (100.0%), Health Care & Social Assistance (100.0%), and Arts, Entertainment & Recreation (100.0%).
| Industry | Male | Female |
| Agriculture, Fishing & Hunting | 6 (100.0%) | 0 (0.0%) |
| Mining, Quarrying, & Extraction | 0 (0.0%) | 0 (0.0%) |
| Construction | 26 (100.0%) | 0 (0.0%) |
| Manufacturing | 0 (0.0%) | 0 (0.0%) |
| Wholesale Trade | 0 (0.0%) | 0 (0.0%) |
| Retail Trade | 6 (54.5%) | 5 (45.5%) |
| Transportation & Warehousing | 0 (0.0%) | 6 (100.0%) |
| Utilities | 0 (0.0%) | 0 (0.0%) |
| Information | 0 (0.0%) | 0 (0.0%) |
| Finance & Insurance | 6 (60.0%) | 4 (40.0%) |
| Real Estate, Rental & Leasing | 0 (0.0%) | 0 (0.0%) |
| Professional & Scientific | 0 (0.0%) | 0 (0.0%) |
| Enterprise Management | 0 (0.0%) | 0 (0.0%) |
| Administrative & Support | 0 (0.0%) | 0 (0.0%) |
| Educational Services | 3 (100.0%) | 0 (0.0%) |
| Health Care & Social Assistance | 0 (0.0%) | 3 (100.0%) |
| Arts, Entertainment & Recreation | 0 (0.0%) | 7 (100.0%) |
| Accommodation & Food Services | 0 (0.0%) | 0 (0.0%) |
| Public Administration | 0 (0.0%) | 0 (0.0%) |
| Total | 53 (64.6%) | 29 (35.4%) |
Education in Rye
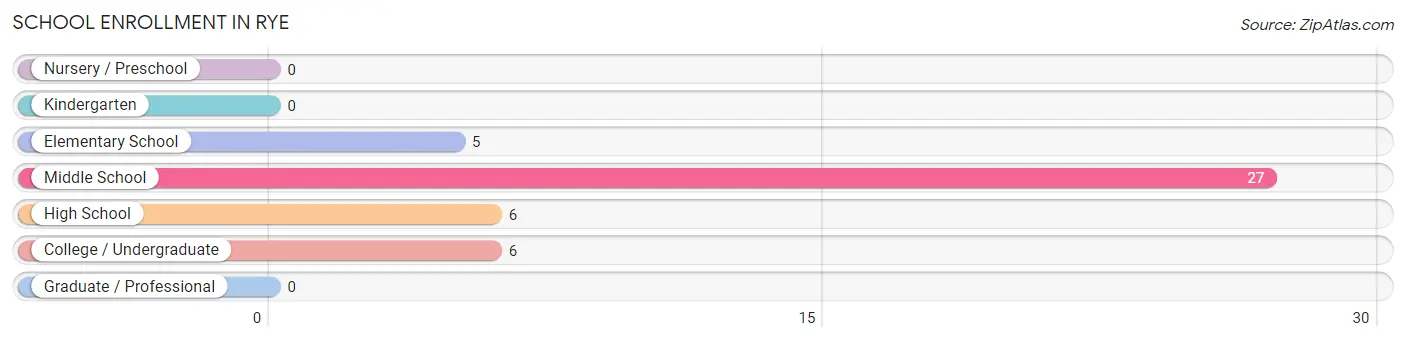
School Enrollment in Rye
The most common levels of schooling among the 44 students in Rye are middle school (27 | 61.4%), high school (6 | 13.6%), and college / undergraduate (6 | 13.6%).
| School Level | # Students | % Students |
| Nursery / Preschool | 0 | 0.0% |
| Kindergarten | 0 | 0.0% |
| Elementary School | 5 | 11.4% |
| Middle School | 27 | 61.4% |
| High School | 6 | 13.6% |
| College / Undergraduate | 6 | 13.6% |
| Graduate / Professional | 0 | 0.0% |
| Total | 44 | 100.0% |
School Enrollment by Age by Funding Source in Rye
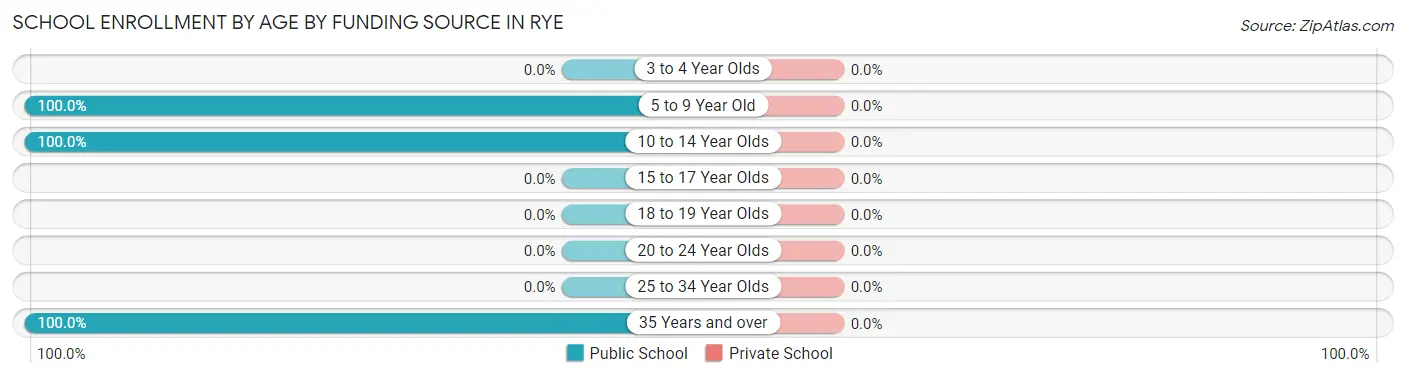
| Age Bracket | Public School | Private School |
| 3 to 4 Year Olds | 0 (0.0%) | 0 (0.0%) |
| 5 to 9 Year Old | 5 (100.0%) | 0 (0.0%) |
| 10 to 14 Year Olds | 33 (100.0%) | 0 (0.0%) |
| 15 to 17 Year Olds | 0 (0.0%) | 0 (0.0%) |
| 18 to 19 Year Olds | 0 (0.0%) | 0 (0.0%) |
| 20 to 24 Year Olds | 0 (0.0%) | 0 (0.0%) |
| 25 to 34 Year Olds | 0 (0.0%) | 0 (0.0%) |
| 35 Years and over | 6 (100.0%) | 0 (0.0%) |
| Total | 44 (100.0%) | 0 (0.0%) |
Educational Attainment by Field of Study in Rye
Business (24 | 77.4%), social sciences (4 | 12.9%), and science & technology (3 | 9.7%) are the most common fields of study among 31 individuals in Rye who have obtained a bachelor's degree or higher.
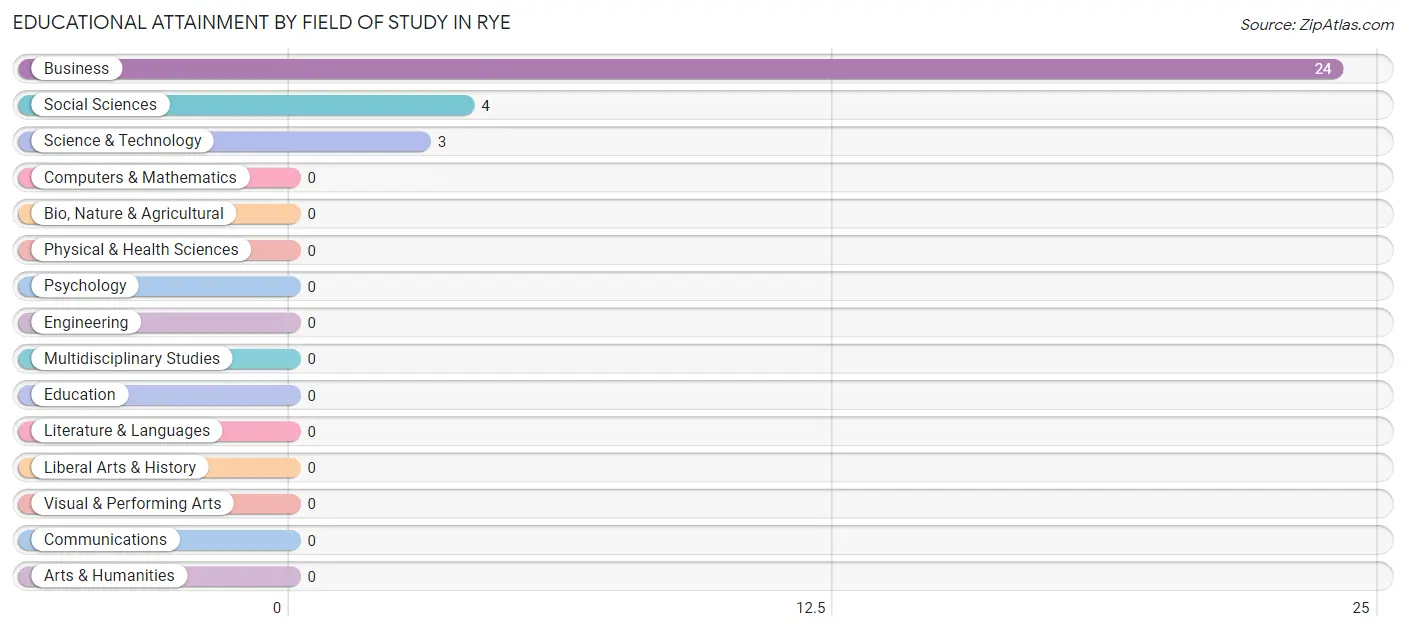
| Field of Study | # Graduates | % Graduates |
| Computers & Mathematics | 0 | 0.0% |
| Bio, Nature & Agricultural | 0 | 0.0% |
| Physical & Health Sciences | 0 | 0.0% |
| Psychology | 0 | 0.0% |
| Social Sciences | 4 | 12.9% |
| Engineering | 0 | 0.0% |
| Multidisciplinary Studies | 0 | 0.0% |
| Science & Technology | 3 | 9.7% |
| Business | 24 | 77.4% |
| Education | 0 | 0.0% |
| Literature & Languages | 0 | 0.0% |
| Liberal Arts & History | 0 | 0.0% |
| Visual & Performing Arts | 0 | 0.0% |
| Communications | 0 | 0.0% |
| Arts & Humanities | 0 | 0.0% |
| Total | 31 | 100.0% |
Transportation & Commute in Rye
Vehicle Availability by Sex in Rye
The most prevalent vehicle ownership categories in Rye are males with 1 vehicle (26, accounting for 49.1%) and females with 1 vehicle (0, making up 118.2%).
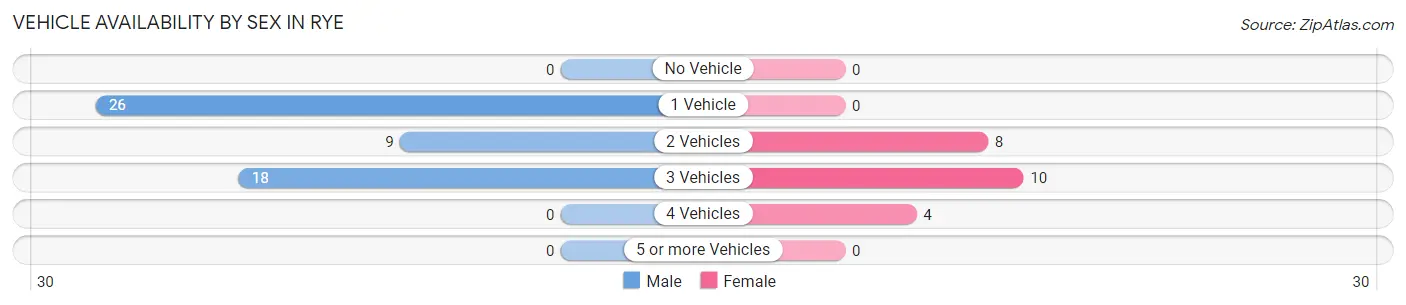
| Vehicles Available | Male | Female |
| No Vehicle | 0 (0.0%) | 0 (0.0%) |
| 1 Vehicle | 26 (49.1%) | 0 (0.0%) |
| 2 Vehicles | 9 (17.0%) | 8 (36.4%) |
| 3 Vehicles | 18 (34.0%) | 10 (45.5%) |
| 4 Vehicles | 0 (0.0%) | 4 (18.2%) |
| 5 or more Vehicles | 0 (0.0%) | 0 (0.0%) |
| Total | 53 (100.0%) | 22 (100.0%) |
Commute Time in Rye
The most frequently occuring commute durations in Rye are 10 to 14 minutes (21 commuters, 28.0%), 45 to 59 minutes (20 commuters, 26.7%), and 40 to 44 minutes (15 commuters, 20.0%).
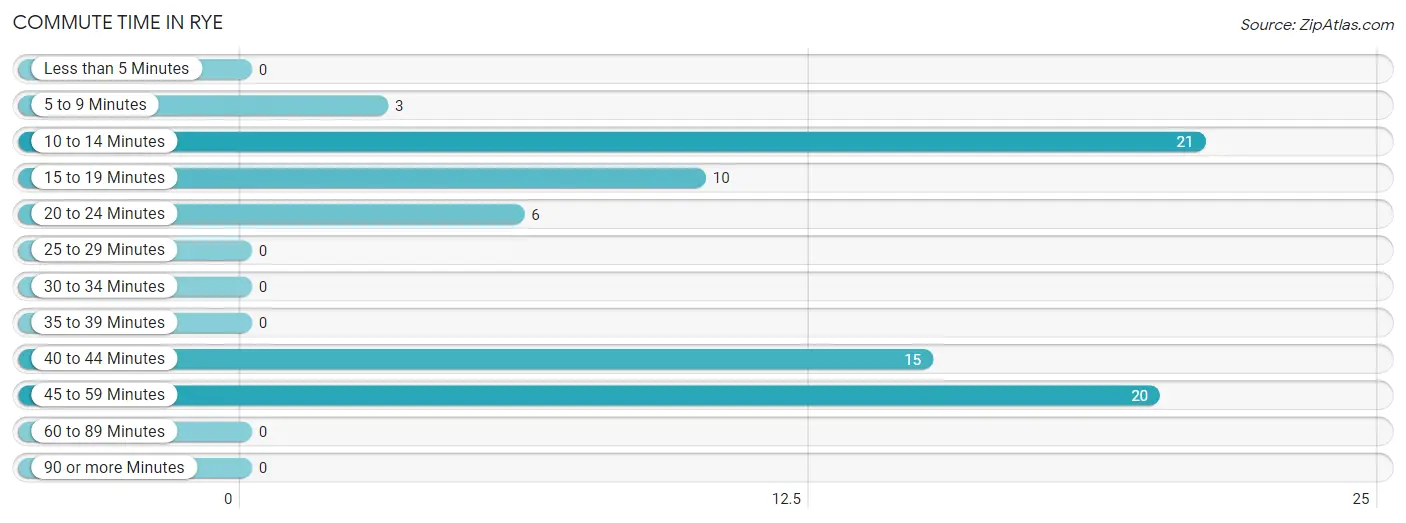
| Commute Time | # Commuters | % Commuters |
| Less than 5 Minutes | 0 | 0.0% |
| 5 to 9 Minutes | 3 | 4.0% |
| 10 to 14 Minutes | 21 | 28.0% |
| 15 to 19 Minutes | 10 | 13.3% |
| 20 to 24 Minutes | 6 | 8.0% |
| 25 to 29 Minutes | 0 | 0.0% |
| 30 to 34 Minutes | 0 | 0.0% |
| 35 to 39 Minutes | 0 | 0.0% |
| 40 to 44 Minutes | 15 | 20.0% |
| 45 to 59 Minutes | 20 | 26.7% |
| 60 to 89 Minutes | 0 | 0.0% |
| 90 or more Minutes | 0 | 0.0% |
Commute Time by Sex in Rye
The most common commute times in Rye are 45 to 59 minutes (20 commuters, 37.7%) for males and 15 to 19 minutes (10 commuters, 45.5%) for females.
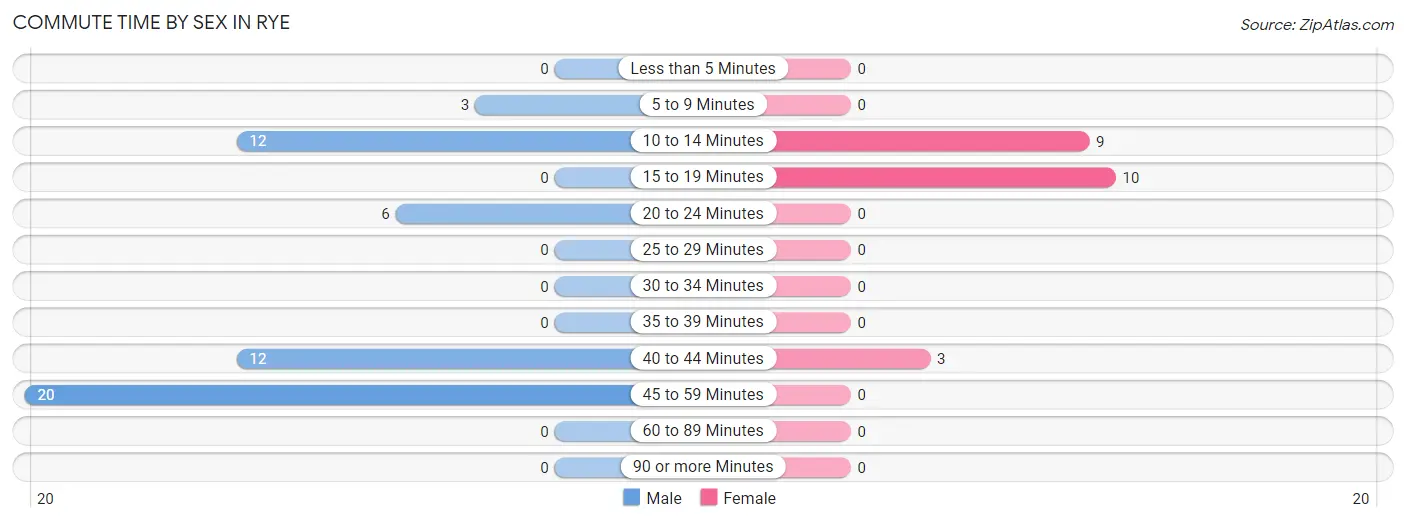
| Commute Time | Male | Female |
| Less than 5 Minutes | 0 (0.0%) | 0 (0.0%) |
| 5 to 9 Minutes | 3 (5.7%) | 0 (0.0%) |
| 10 to 14 Minutes | 12 (22.6%) | 9 (40.9%) |
| 15 to 19 Minutes | 0 (0.0%) | 10 (45.5%) |
| 20 to 24 Minutes | 6 (11.3%) | 0 (0.0%) |
| 25 to 29 Minutes | 0 (0.0%) | 0 (0.0%) |
| 30 to 34 Minutes | 0 (0.0%) | 0 (0.0%) |
| 35 to 39 Minutes | 0 (0.0%) | 0 (0.0%) |
| 40 to 44 Minutes | 12 (22.6%) | 3 (13.6%) |
| 45 to 59 Minutes | 20 (37.7%) | 0 (0.0%) |
| 60 to 89 Minutes | 0 (0.0%) | 0 (0.0%) |
| 90 or more Minutes | 0 (0.0%) | 0 (0.0%) |
Time of Departure to Work by Sex in Rye
The most frequent times of departure to work in Rye are 8:00 AM to 8:29 AM (26, 49.1%) for males and 5:30 AM to 5:59 AM (6, 27.3%) for females.
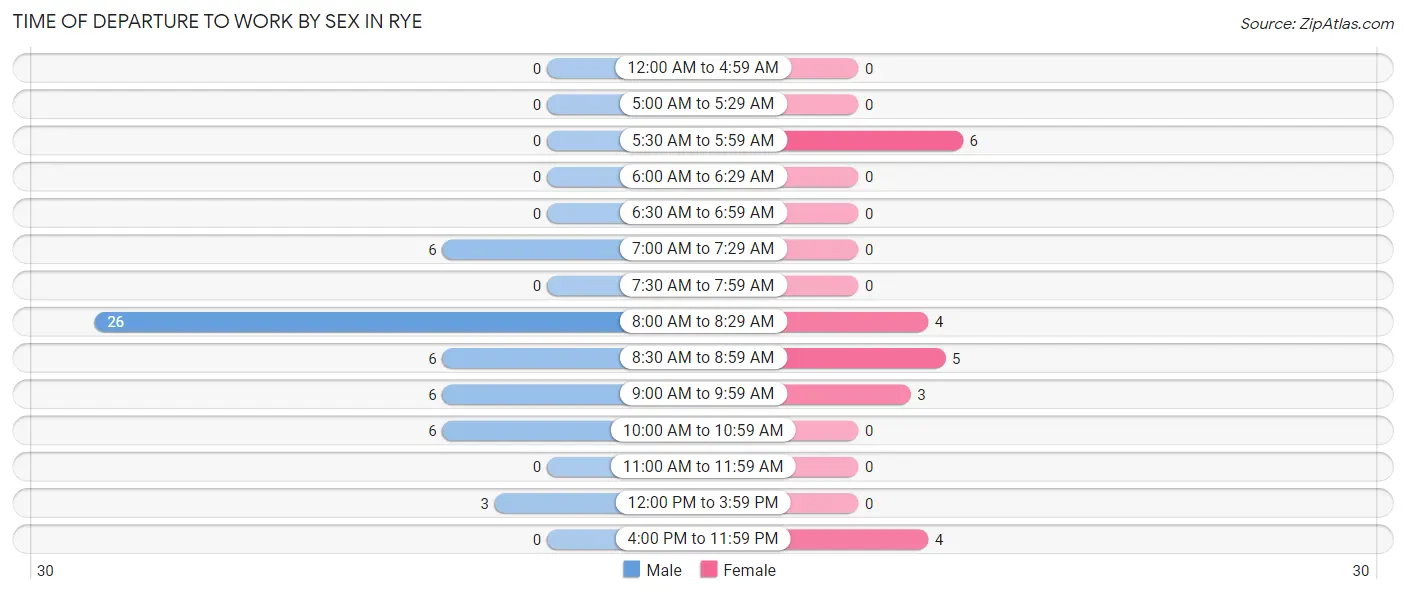
| Time of Departure | Male | Female |
| 12:00 AM to 4:59 AM | 0 (0.0%) | 0 (0.0%) |
| 5:00 AM to 5:29 AM | 0 (0.0%) | 0 (0.0%) |
| 5:30 AM to 5:59 AM | 0 (0.0%) | 6 (27.3%) |
| 6:00 AM to 6:29 AM | 0 (0.0%) | 0 (0.0%) |
| 6:30 AM to 6:59 AM | 0 (0.0%) | 0 (0.0%) |
| 7:00 AM to 7:29 AM | 6 (11.3%) | 0 (0.0%) |
| 7:30 AM to 7:59 AM | 0 (0.0%) | 0 (0.0%) |
| 8:00 AM to 8:29 AM | 26 (49.1%) | 4 (18.2%) |
| 8:30 AM to 8:59 AM | 6 (11.3%) | 5 (22.7%) |
| 9:00 AM to 9:59 AM | 6 (11.3%) | 3 (13.6%) |
| 10:00 AM to 10:59 AM | 6 (11.3%) | 0 (0.0%) |
| 11:00 AM to 11:59 AM | 0 (0.0%) | 0 (0.0%) |
| 12:00 PM to 3:59 PM | 3 (5.7%) | 0 (0.0%) |
| 4:00 PM to 11:59 PM | 0 (0.0%) | 4 (18.2%) |
| Total | 53 (100.0%) | 22 (100.0%) |
Housing Occupancy in Rye
Occupancy by Ownership in Rye
Of the total 88 dwellings in Rye, owner-occupied units account for 65 (73.9%), while renter-occupied units make up 23 (26.1%).
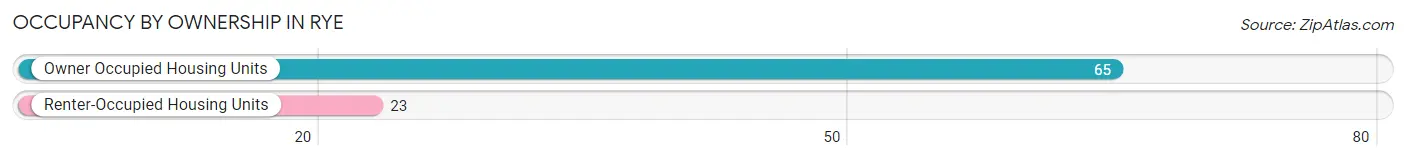
| Occupancy | # Housing Units | % Housing Units |
| Owner Occupied Housing Units | 65 | 73.9% |
| Renter-Occupied Housing Units | 23 | 26.1% |
| Total Occupied Housing Units | 88 | 100.0% |
Occupancy by Household Size in Rye
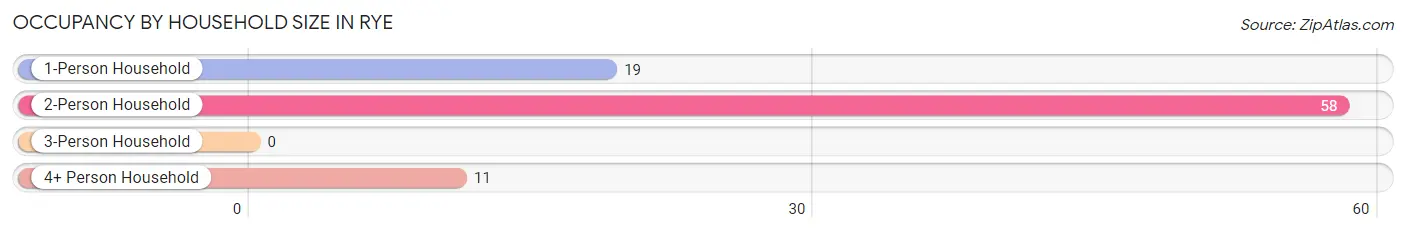
| Household Size | # Housing Units | % Housing Units |
| 1-Person Household | 19 | 21.6% |
| 2-Person Household | 58 | 65.9% |
| 3-Person Household | 0 | 0.0% |
| 4+ Person Household | 11 | 12.5% |
| Total Housing Units | 88 | 100.0% |
Occupancy by Ownership by Household Size in Rye
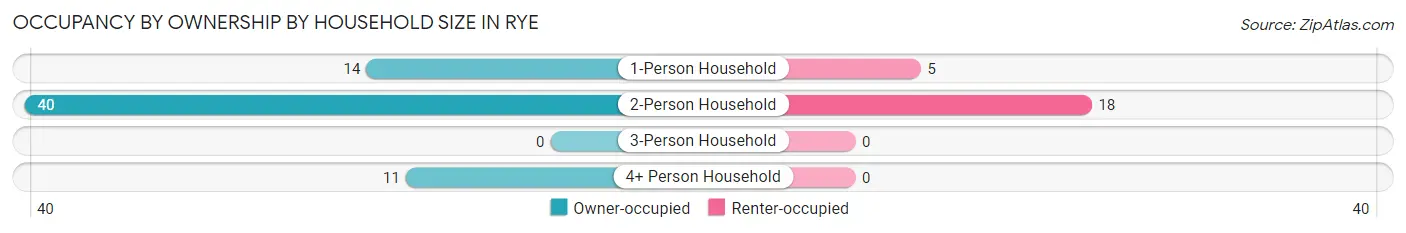
| Household Size | Owner-occupied | Renter-occupied |
| 1-Person Household | 14 (73.7%) | 5 (26.3%) |
| 2-Person Household | 40 (69.0%) | 18 (31.0%) |
| 3-Person Household | 0 (0.0%) | 0 (0.0%) |
| 4+ Person Household | 11 (100.0%) | 0 (0.0%) |
| Total Housing Units | 65 (73.9%) | 23 (26.1%) |
Occupancy by Educational Attainment in Rye
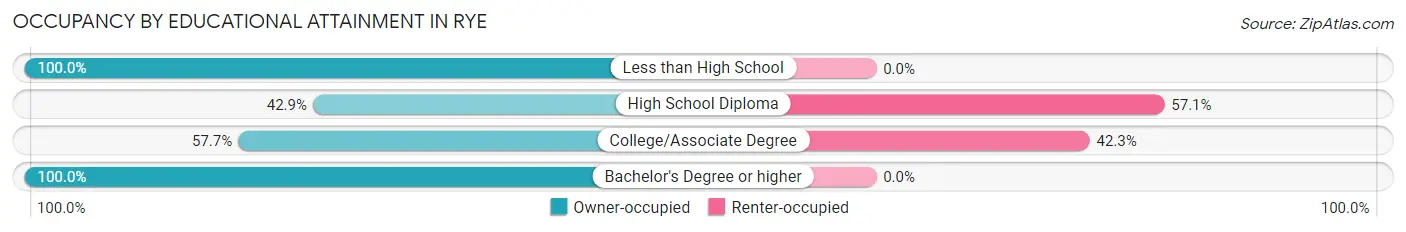
| Household Size | Owner-occupied | Renter-occupied |
| Less than High School | 20 (100.0%) | 0 (0.0%) |
| High School Diploma | 9 (42.9%) | 12 (57.1%) |
| College/Associate Degree | 15 (57.7%) | 11 (42.3%) |
| Bachelor's Degree or higher | 21 (100.0%) | 0 (0.0%) |
Occupancy by Age of Householder in Rye
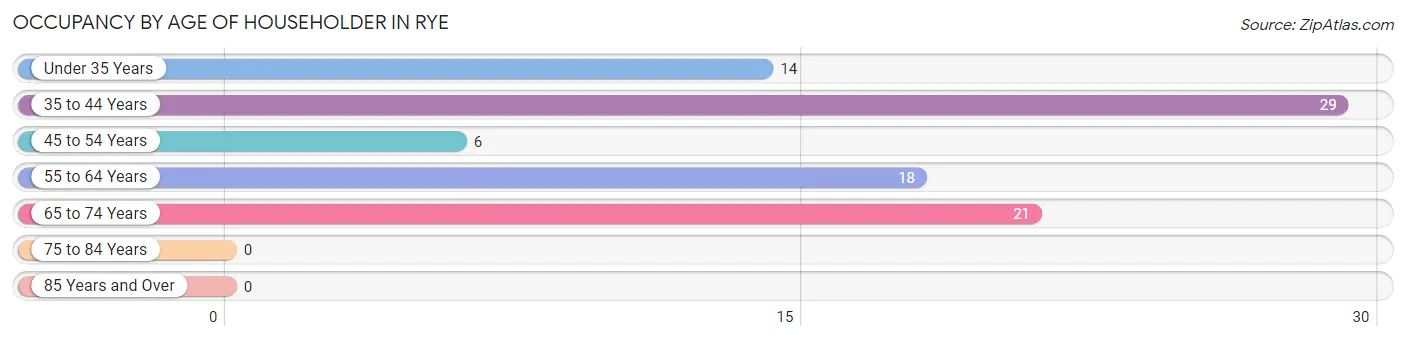
| Age Bracket | # Households | % Households |
| Under 35 Years | 14 | 15.9% |
| 35 to 44 Years | 29 | 33.0% |
| 45 to 54 Years | 6 | 6.8% |
| 55 to 64 Years | 18 | 20.4% |
| 65 to 74 Years | 21 | 23.9% |
| 75 to 84 Years | 0 | 0.0% |
| 85 Years and Over | 0 | 0.0% |
| Total | 88 | 100.0% |
Housing Finances in Rye
Median Income by Occupancy in Rye
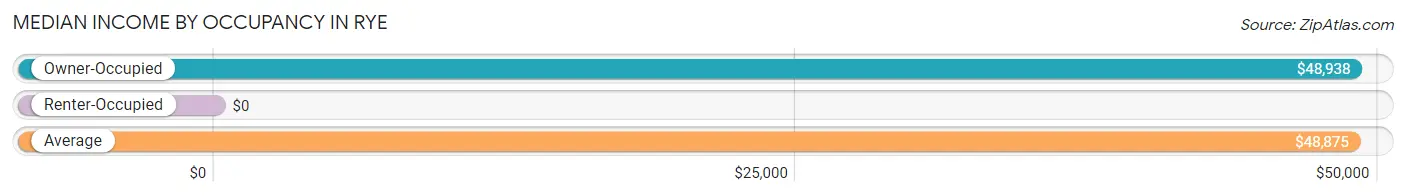
| Occupancy Type | # Households | Median Income |
| Owner-Occupied | 65 (73.9%) | $48,938 |
| Renter-Occupied | 23 (26.1%) | $0 |
| Average | 88 (100.0%) | $48,875 |
Occupancy by Householder Income Bracket in Rye
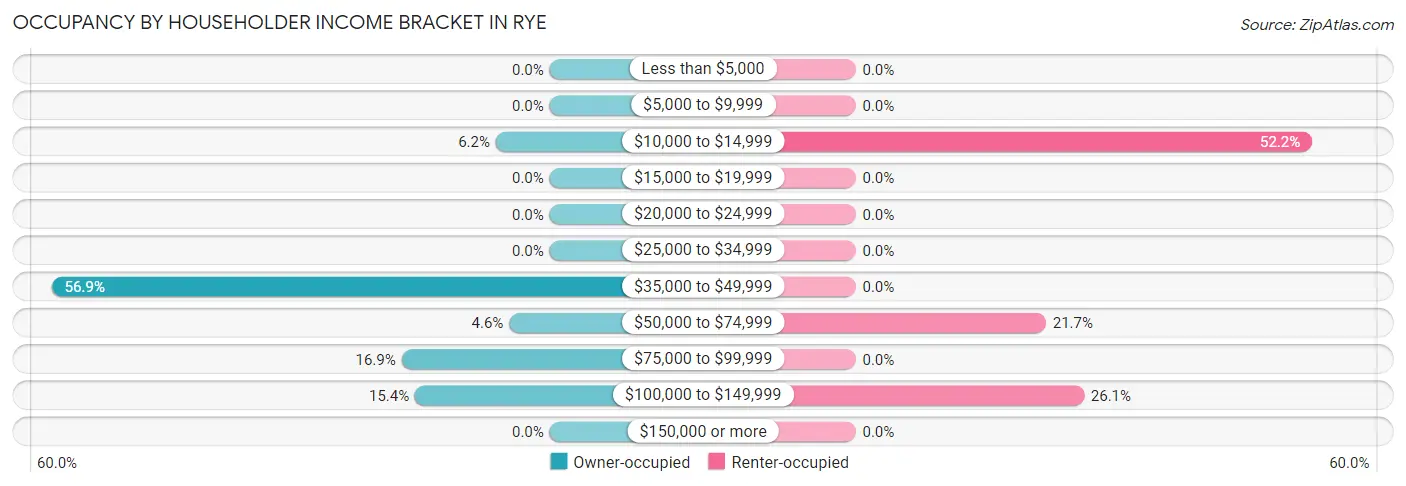
| Income Bracket | Owner-occupied | Renter-occupied |
| Less than $5,000 | 0 (0.0%) | 0 (0.0%) |
| $5,000 to $9,999 | 0 (0.0%) | 0 (0.0%) |
| $10,000 to $14,999 | 4 (6.1%) | 12 (52.2%) |
| $15,000 to $19,999 | 0 (0.0%) | 0 (0.0%) |
| $20,000 to $24,999 | 0 (0.0%) | 0 (0.0%) |
| $25,000 to $34,999 | 0 (0.0%) | 0 (0.0%) |
| $35,000 to $49,999 | 37 (56.9%) | 0 (0.0%) |
| $50,000 to $74,999 | 3 (4.6%) | 5 (21.7%) |
| $75,000 to $99,999 | 11 (16.9%) | 0 (0.0%) |
| $100,000 to $149,999 | 10 (15.4%) | 6 (26.1%) |
| $150,000 or more | 0 (0.0%) | 0 (0.0%) |
| Total | 65 (100.0%) | 23 (100.0%) |
Monthly Housing Cost Tiers in Rye
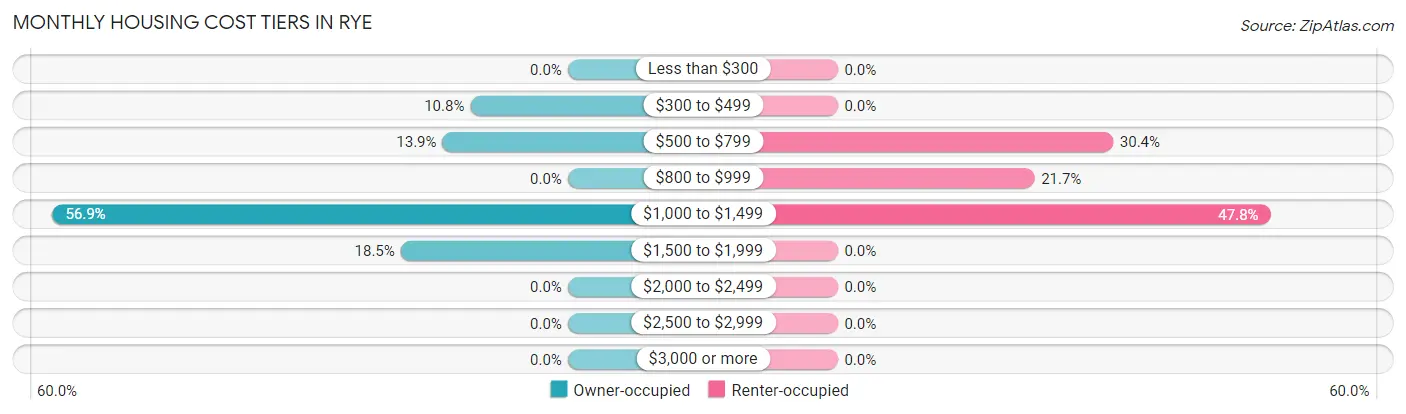
| Monthly Cost | Owner-occupied | Renter-occupied |
| Less than $300 | 0 (0.0%) | 0 (0.0%) |
| $300 to $499 | 7 (10.8%) | 0 (0.0%) |
| $500 to $799 | 9 (13.9%) | 7 (30.4%) |
| $800 to $999 | 0 (0.0%) | 5 (21.7%) |
| $1,000 to $1,499 | 37 (56.9%) | 11 (47.8%) |
| $1,500 to $1,999 | 12 (18.5%) | 0 (0.0%) |
| $2,000 to $2,499 | 0 (0.0%) | 0 (0.0%) |
| $2,500 to $2,999 | 0 (0.0%) | 0 (0.0%) |
| $3,000 or more | 0 (0.0%) | 0 (0.0%) |
| Total | 65 (100.0%) | 23 (100.0%) |
Physical Housing Characteristics in Rye
Housing Structures in Rye
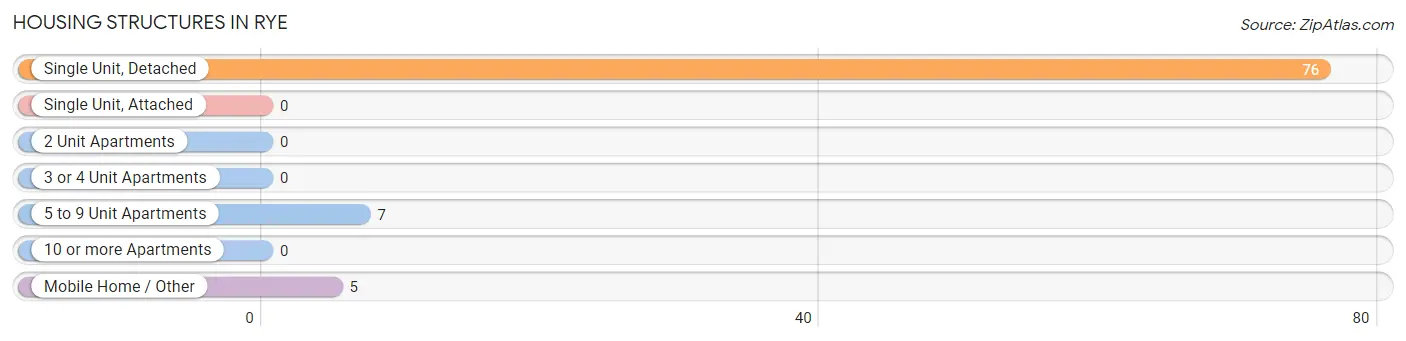
| Structure Type | # Housing Units | % Housing Units |
| Single Unit, Detached | 76 | 86.4% |
| Single Unit, Attached | 0 | 0.0% |
| 2 Unit Apartments | 0 | 0.0% |
| 3 or 4 Unit Apartments | 0 | 0.0% |
| 5 to 9 Unit Apartments | 7 | 8.0% |
| 10 or more Apartments | 0 | 0.0% |
| Mobile Home / Other | 5 | 5.7% |
| Total | 88 | 100.0% |
Housing Structures by Occupancy in Rye
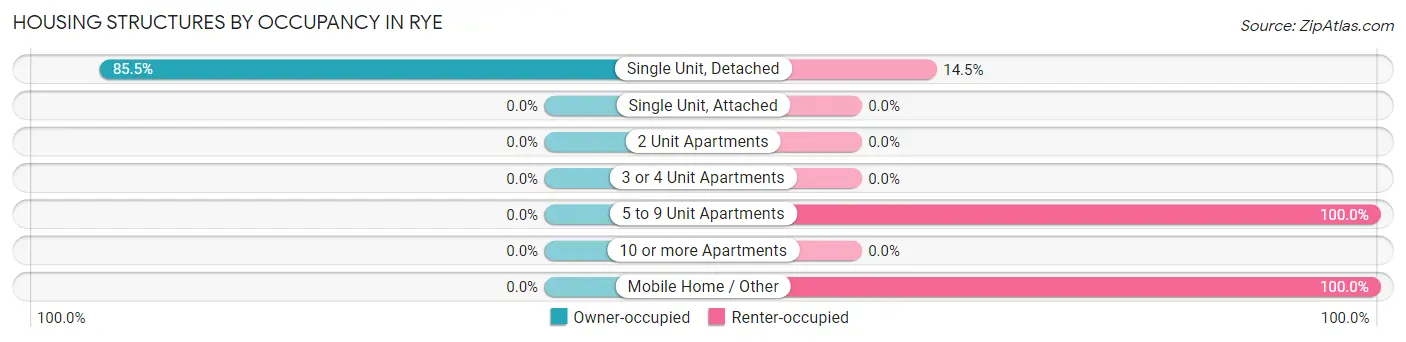
| Structure Type | Owner-occupied | Renter-occupied |
| Single Unit, Detached | 65 (85.5%) | 11 (14.5%) |
| Single Unit, Attached | 0 (0.0%) | 0 (0.0%) |
| 2 Unit Apartments | 0 (0.0%) | 0 (0.0%) |
| 3 or 4 Unit Apartments | 0 (0.0%) | 0 (0.0%) |
| 5 to 9 Unit Apartments | 0 (0.0%) | 7 (100.0%) |
| 10 or more Apartments | 0 (0.0%) | 0 (0.0%) |
| Mobile Home / Other | 0 (0.0%) | 5 (100.0%) |
| Total | 65 (73.9%) | 23 (26.1%) |
Housing Structures by Number of Rooms in Rye
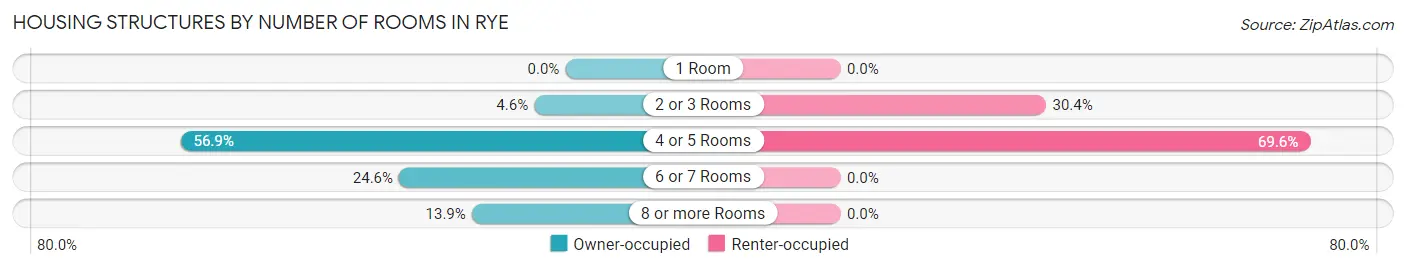
| Number of Rooms | Owner-occupied | Renter-occupied |
| 1 Room | 0 (0.0%) | 0 (0.0%) |
| 2 or 3 Rooms | 3 (4.6%) | 7 (30.4%) |
| 4 or 5 Rooms | 37 (56.9%) | 16 (69.6%) |
| 6 or 7 Rooms | 16 (24.6%) | 0 (0.0%) |
| 8 or more Rooms | 9 (13.9%) | 0 (0.0%) |
| Total | 65 (100.0%) | 23 (100.0%) |
Housing Structure by Heating Type in Rye
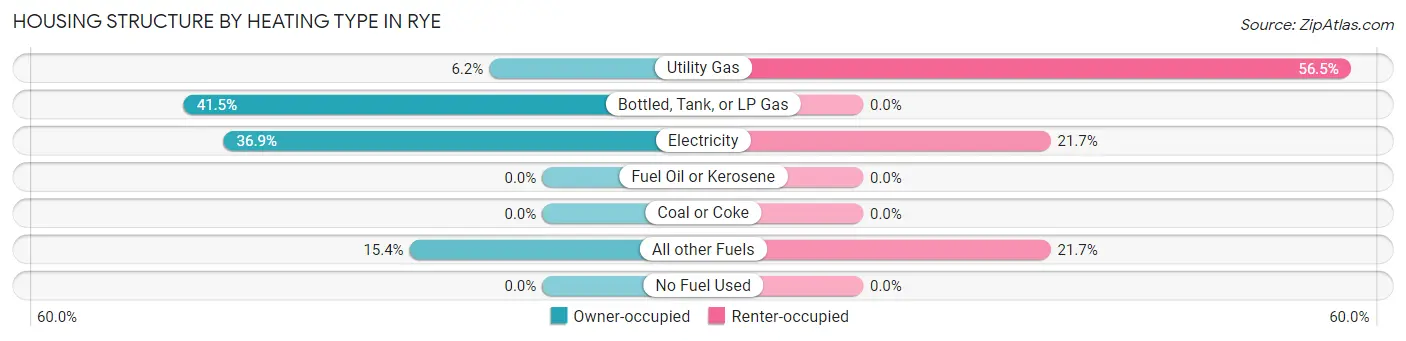
| Heating Type | Owner-occupied | Renter-occupied |
| Utility Gas | 4 (6.1%) | 13 (56.5%) |
| Bottled, Tank, or LP Gas | 27 (41.5%) | 0 (0.0%) |
| Electricity | 24 (36.9%) | 5 (21.7%) |
| Fuel Oil or Kerosene | 0 (0.0%) | 0 (0.0%) |
| Coal or Coke | 0 (0.0%) | 0 (0.0%) |
| All other Fuels | 10 (15.4%) | 5 (21.7%) |
| No Fuel Used | 0 (0.0%) | 0 (0.0%) |
| Total | 65 (100.0%) | 23 (100.0%) |
Household Vehicle Usage in Rye
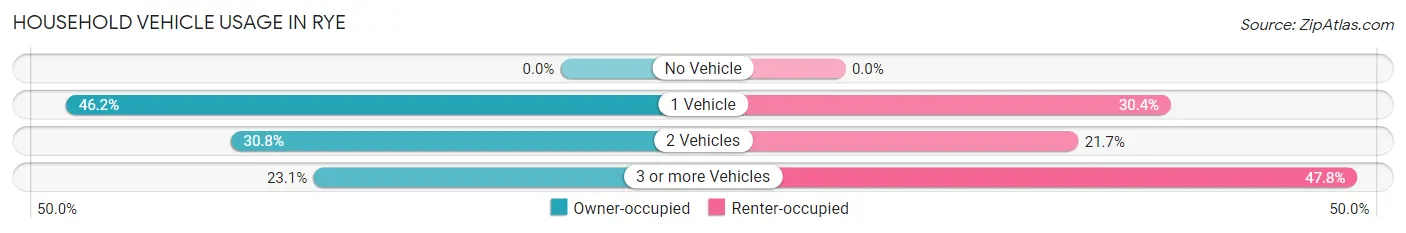
| Vehicles per Household | Owner-occupied | Renter-occupied |
| No Vehicle | 0 (0.0%) | 0 (0.0%) |
| 1 Vehicle | 30 (46.2%) | 7 (30.4%) |
| 2 Vehicles | 20 (30.8%) | 5 (21.7%) |
| 3 or more Vehicles | 15 (23.1%) | 11 (47.8%) |
| Total | 65 (100.0%) | 23 (100.0%) |
Real Estate & Mortgages in Rye
Real Estate and Mortgage Overview in Rye
| Characteristic | Without Mortgage | With Mortgage |
| Housing Units | 16 | 49 |
| Median Property Value | $188,900 | $223,800 |
| Median Household Income | $80,833 | $0 |
| Monthly Housing Costs | $511 | $0 |
| Real Estate Taxes | $578 | $0 |
Property Value by Mortgage Status in Rye
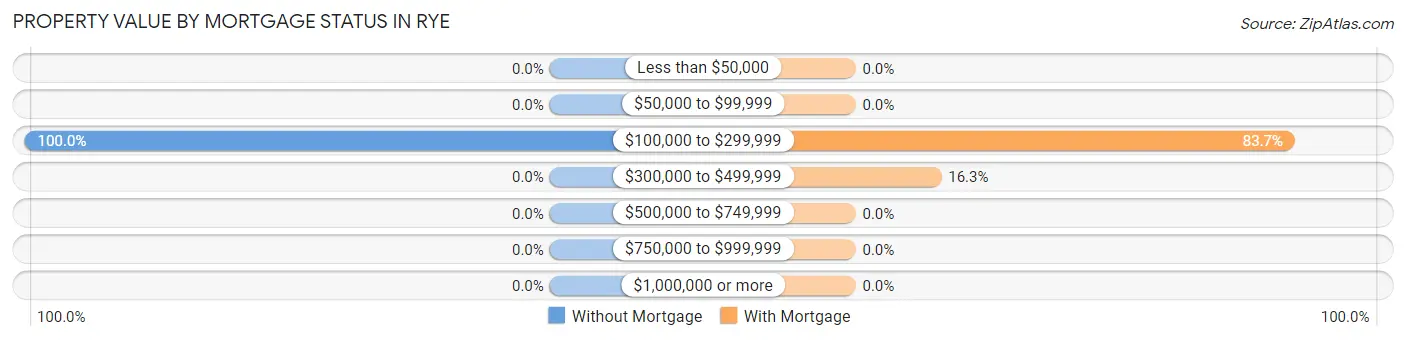
| Property Value | Without Mortgage | With Mortgage |
| Less than $50,000 | 0 (0.0%) | 0 (0.0%) |
| $50,000 to $99,999 | 0 (0.0%) | 0 (0.0%) |
| $100,000 to $299,999 | 16 (100.0%) | 41 (83.7%) |
| $300,000 to $499,999 | 0 (0.0%) | 8 (16.3%) |
| $500,000 to $749,999 | 0 (0.0%) | 0 (0.0%) |
| $750,000 to $999,999 | 0 (0.0%) | 0 (0.0%) |
| $1,000,000 or more | 0 (0.0%) | 0 (0.0%) |
| Total | 16 (100.0%) | 49 (100.0%) |
Household Income by Mortgage Status in Rye
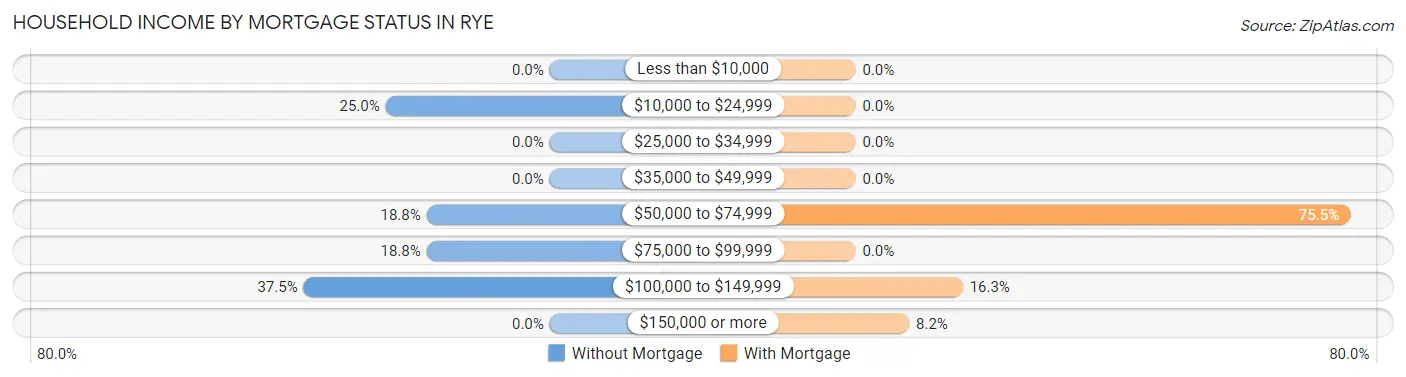
| Household Income | Without Mortgage | With Mortgage |
| Less than $10,000 | 0 (0.0%) | 0 (0.0%) |
| $10,000 to $24,999 | 4 (25.0%) | 0 (0.0%) |
| $25,000 to $34,999 | 0 (0.0%) | 0 (0.0%) |
| $35,000 to $49,999 | 0 (0.0%) | 0 (0.0%) |
| $50,000 to $74,999 | 3 (18.8%) | 37 (75.5%) |
| $75,000 to $99,999 | 3 (18.8%) | 0 (0.0%) |
| $100,000 to $149,999 | 6 (37.5%) | 8 (16.3%) |
| $150,000 or more | 0 (0.0%) | 4 (8.2%) |
| Total | 16 (100.0%) | 49 (100.0%) |
Property Value to Household Income Ratio in Rye
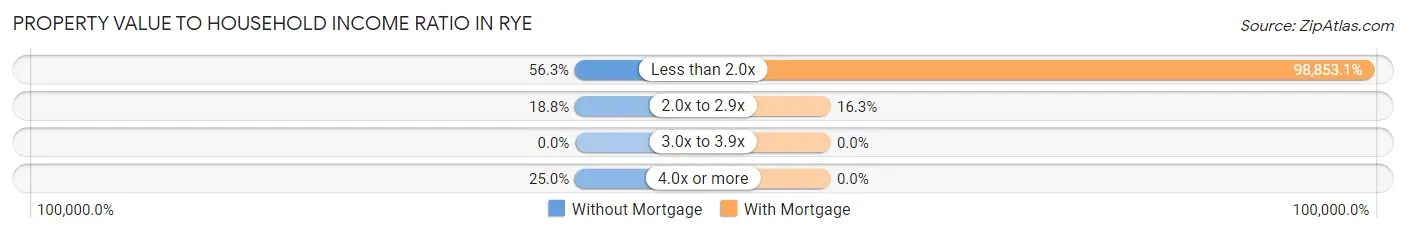
| Value-to-Income Ratio | Without Mortgage | With Mortgage |
| Less than 2.0x | 9 (56.2%) | 48,438 (98,853.1%) |
| 2.0x to 2.9x | 3 (18.8%) | 8 (16.3%) |
| 3.0x to 3.9x | 0 (0.0%) | 0 (0.0%) |
| 4.0x or more | 4 (25.0%) | 0 (0.0%) |
| Total | 16 (100.0%) | 49 (100.0%) |
Real Estate Taxes by Mortgage Status in Rye
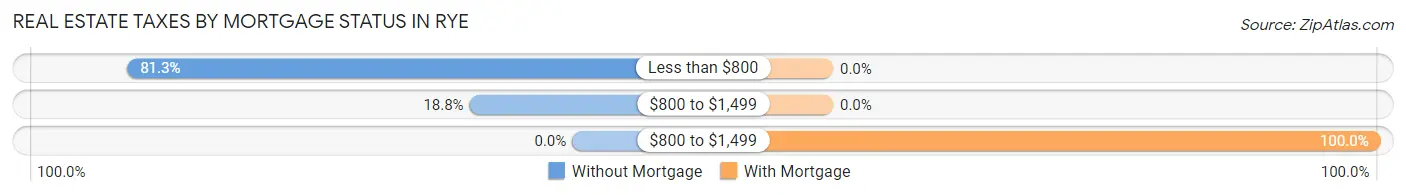
| Property Taxes | Without Mortgage | With Mortgage |
| Less than $800 | 13 (81.2%) | 0 (0.0%) |
| $800 to $1,499 | 3 (18.8%) | 0 (0.0%) |
| $800 to $1,499 | 0 (0.0%) | 49 (100.0%) |
| Total | 16 (100.0%) | 49 (100.0%) |
Health & Disability in Rye
Health Insurance Coverage by Age in Rye
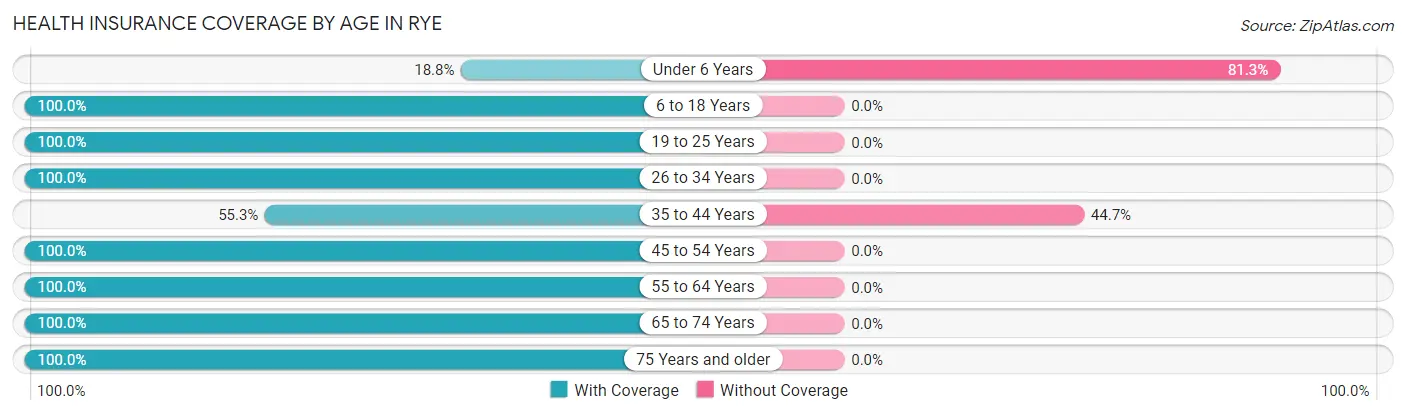
| Age Bracket | With Coverage | Without Coverage |
| Under 6 Years | 6 (18.8%) | 26 (81.2%) |
| 6 to 18 Years | 38 (100.0%) | 0 (0.0%) |
| 19 to 25 Years | 7 (100.0%) | 0 (0.0%) |
| 26 to 34 Years | 7 (100.0%) | 0 (0.0%) |
| 35 to 44 Years | 26 (55.3%) | 21 (44.7%) |
| 45 to 54 Years | 12 (100.0%) | 0 (0.0%) |
| 55 to 64 Years | 26 (100.0%) | 0 (0.0%) |
| 65 to 74 Years | 30 (100.0%) | 0 (0.0%) |
| 75 Years and older | 3 (100.0%) | 0 (0.0%) |
| Total | 155 (76.7%) | 47 (23.3%) |
Health Insurance Coverage by Citizenship Status in Rye
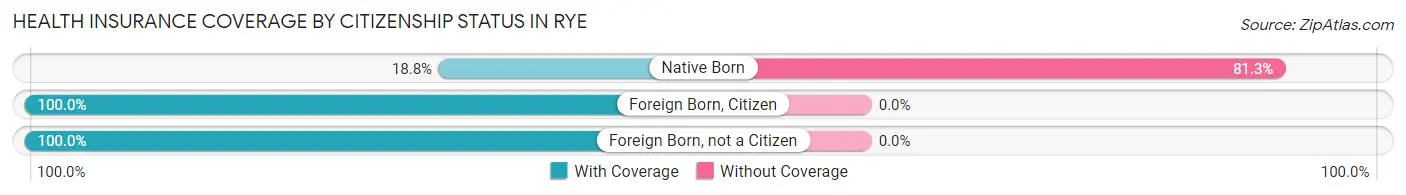
| Citizenship Status | With Coverage | Without Coverage |
| Native Born | 6 (18.8%) | 26 (81.2%) |
| Foreign Born, Citizen | 38 (100.0%) | 0 (0.0%) |
| Foreign Born, not a Citizen | 7 (100.0%) | 0 (0.0%) |
Health Insurance Coverage by Household Income in Rye
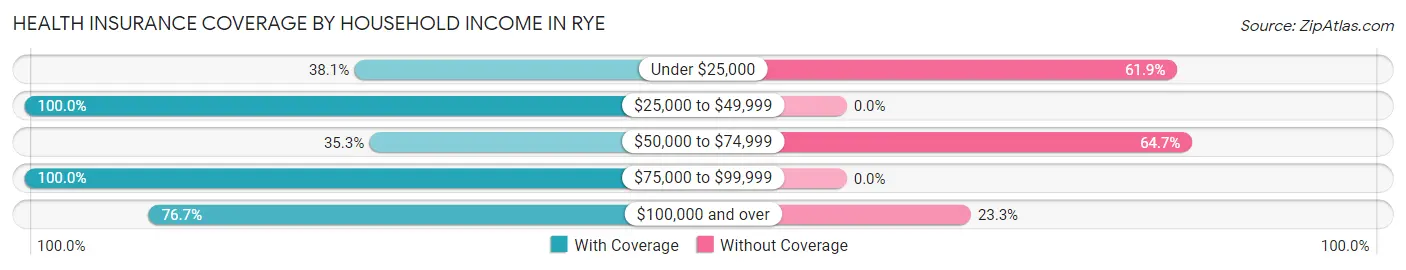
| Household Income | With Coverage | Without Coverage |
| Under $25,000 | 16 (38.1%) | 26 (61.9%) |
| $25,000 to $49,999 | 78 (100.0%) | 0 (0.0%) |
| $50,000 to $74,999 | 6 (35.3%) | 11 (64.7%) |
| $75,000 to $99,999 | 22 (100.0%) | 0 (0.0%) |
| $100,000 and over | 33 (76.7%) | 10 (23.3%) |
Public vs Private Health Insurance Coverage by Age in Rye
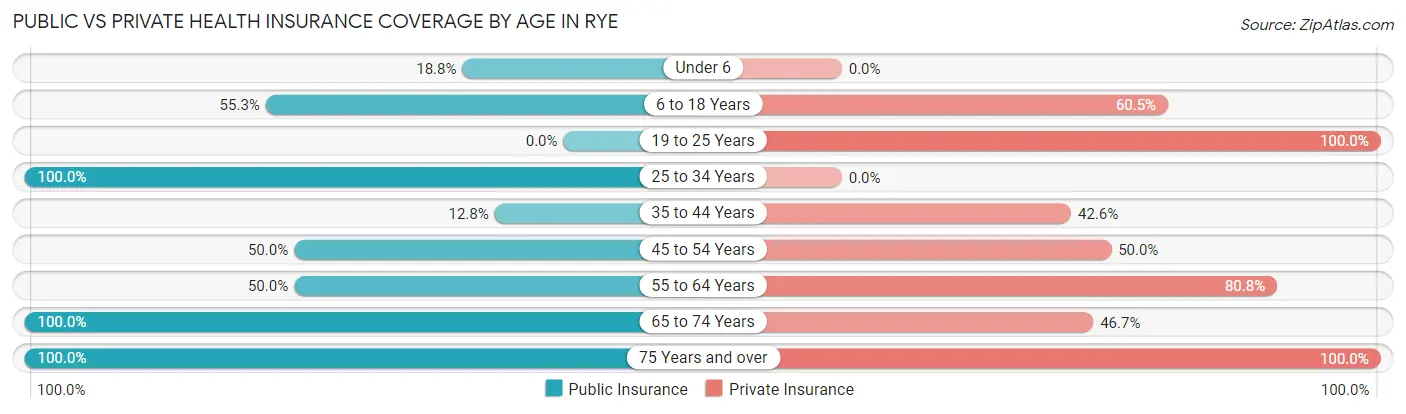
| Age Bracket | Public Insurance | Private Insurance |
| Under 6 | 6 (18.8%) | 0 (0.0%) |
| 6 to 18 Years | 21 (55.3%) | 23 (60.5%) |
| 19 to 25 Years | 0 (0.0%) | 7 (100.0%) |
| 25 to 34 Years | 7 (100.0%) | 0 (0.0%) |
| 35 to 44 Years | 6 (12.8%) | 20 (42.5%) |
| 45 to 54 Years | 6 (50.0%) | 6 (50.0%) |
| 55 to 64 Years | 13 (50.0%) | 21 (80.8%) |
| 65 to 74 Years | 30 (100.0%) | 14 (46.7%) |
| 75 Years and over | 3 (100.0%) | 3 (100.0%) |
| Total | 92 (45.5%) | 94 (46.5%) |
Disability Status by Sex by Age in Rye
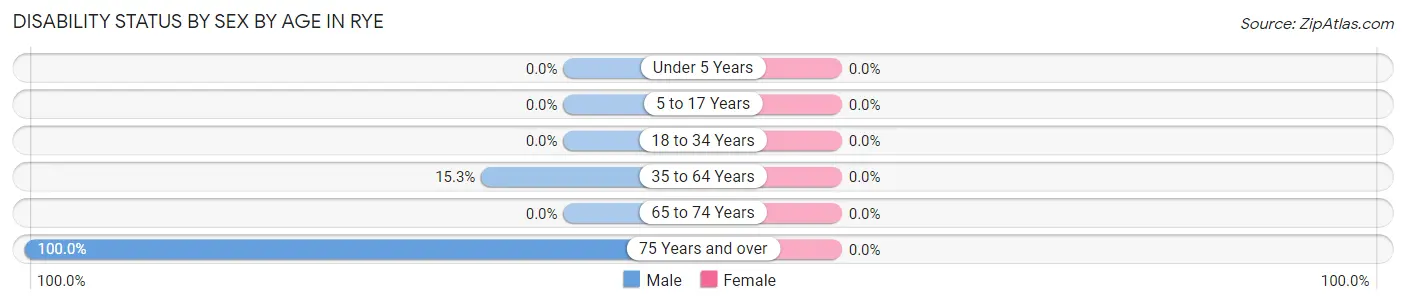
| Age Bracket | Male | Female |
| Under 5 Years | 0 (0.0%) | 0 (0.0%) |
| 5 to 17 Years | 0 (0.0%) | 0 (0.0%) |
| 18 to 34 Years | 0 (0.0%) | 0 (0.0%) |
| 35 to 64 Years | 9 (15.2%) | 0 (0.0%) |
| 65 to 74 Years | 0 (0.0%) | 0 (0.0%) |
| 75 Years and over | 3 (100.0%) | 0 (0.0%) |
Disability Class by Sex by Age in Rye
Disability Class: Hearing Difficulty
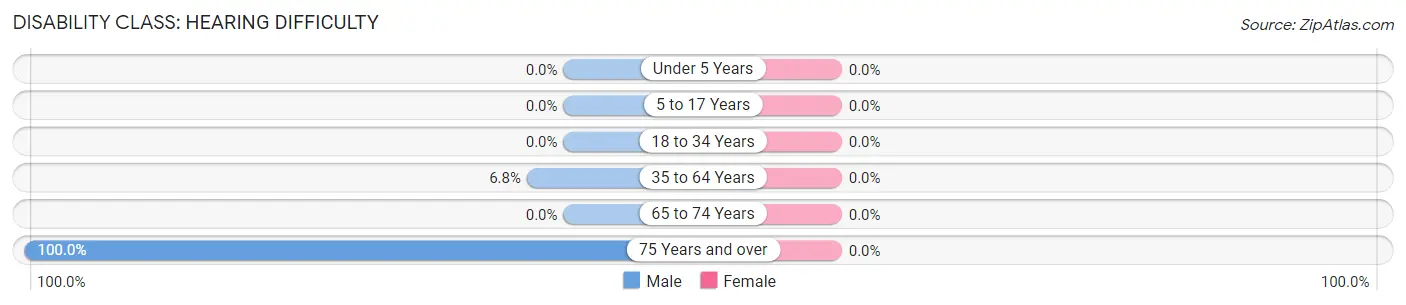
| Age Bracket | Male | Female |
| Under 5 Years | 0 (0.0%) | 0 (0.0%) |
| 5 to 17 Years | 0 (0.0%) | 0 (0.0%) |
| 18 to 34 Years | 0 (0.0%) | 0 (0.0%) |
| 35 to 64 Years | 4 (6.8%) | 0 (0.0%) |
| 65 to 74 Years | 0 (0.0%) | 0 (0.0%) |
| 75 Years and over | 3 (100.0%) | 0 (0.0%) |
Disability Class: Vision Difficulty
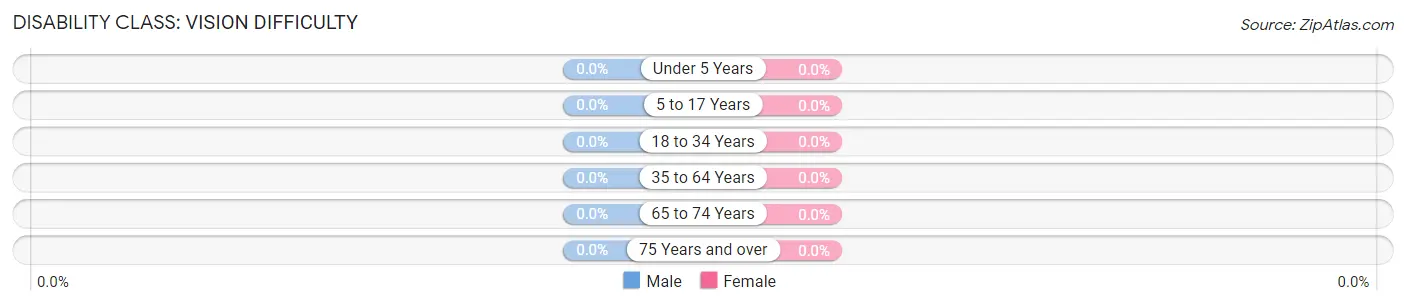
| Age Bracket | Male | Female |
| Under 5 Years | 0 (0.0%) | 0 (0.0%) |
| 5 to 17 Years | 0 (0.0%) | 0 (0.0%) |
| 18 to 34 Years | 0 (0.0%) | 0 (0.0%) |
| 35 to 64 Years | 0 (0.0%) | 0 (0.0%) |
| 65 to 74 Years | 0 (0.0%) | 0 (0.0%) |
| 75 Years and over | 0 (0.0%) | 0 (0.0%) |
Disability Class: Cognitive Difficulty
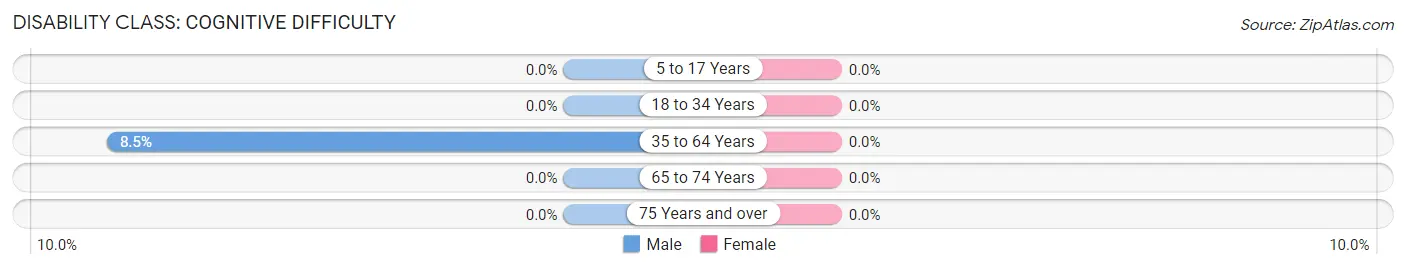
| Age Bracket | Male | Female |
| 5 to 17 Years | 0 (0.0%) | 0 (0.0%) |
| 18 to 34 Years | 0 (0.0%) | 0 (0.0%) |
| 35 to 64 Years | 5 (8.5%) | 0 (0.0%) |
| 65 to 74 Years | 0 (0.0%) | 0 (0.0%) |
| 75 Years and over | 0 (0.0%) | 0 (0.0%) |
Disability Class: Ambulatory Difficulty
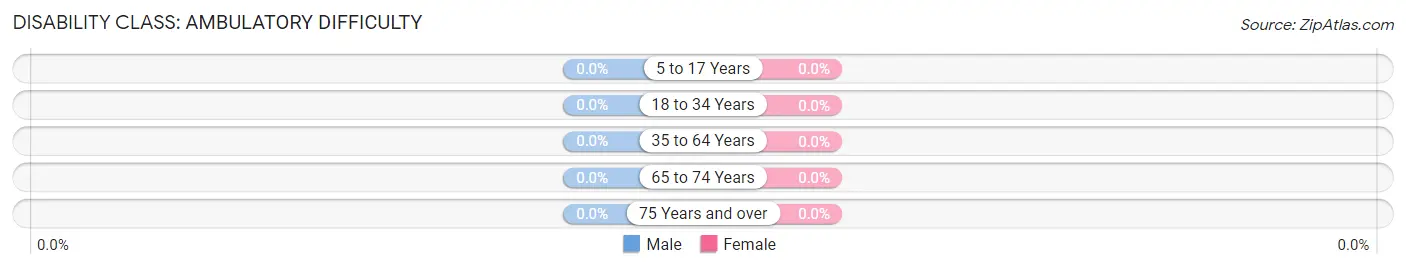
| Age Bracket | Male | Female |
| 5 to 17 Years | 0 (0.0%) | 0 (0.0%) |
| 18 to 34 Years | 0 (0.0%) | 0 (0.0%) |
| 35 to 64 Years | 0 (0.0%) | 0 (0.0%) |
| 65 to 74 Years | 0 (0.0%) | 0 (0.0%) |
| 75 Years and over | 0 (0.0%) | 0 (0.0%) |
Disability Class: Self-Care Difficulty
| Age Bracket | Male | Female |
| 5 to 17 Years | 0 (0.0%) | 0 (0.0%) |
| 18 to 34 Years | 0 (0.0%) | 0 (0.0%) |
| 35 to 64 Years | 0 (0.0%) | 0 (0.0%) |
| 65 to 74 Years | 0 (0.0%) | 0 (0.0%) |
| 75 Years and over | 0 (0.0%) | 0 (0.0%) |
Technology Access in Rye
Computing Device Access in Rye
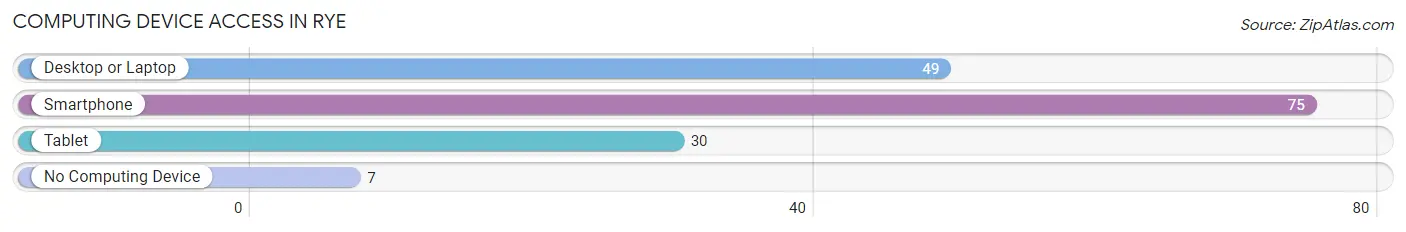
| Device Type | # Households | % Households |
| Desktop or Laptop | 49 | 55.7% |
| Smartphone | 75 | 85.2% |
| Tablet | 30 | 34.1% |
| No Computing Device | 7 | 8.0% |
| Total | 88 | 100.0% |
Internet Access in Rye
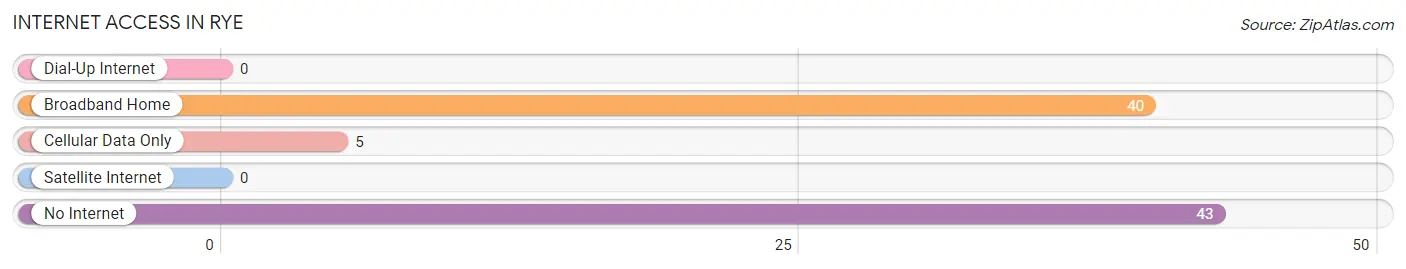
| Internet Type | # Households | % Households |
| Dial-Up Internet | 0 | 0.0% |
| Broadband Home | 40 | 45.5% |
| Cellular Data Only | 5 | 5.7% |
| Satellite Internet | 0 | 0.0% |
| No Internet | 43 | 48.9% |
| Total | 88 | 100.0% |
Rye Summary
Rye is a small town located in Pueblo County, Colorado, United States. It is situated in the Arkansas River Valley, approximately 10 miles east of Pueblo. The town was founded in 1878 and incorporated in 1887. As of the 2010 census, the population of Rye was 531.
History
Rye was founded in 1878 by a group of settlers from Rye, New York. The town was named after the New York town, and the settlers brought with them the same agricultural practices that had been successful in their former home. Rye was incorporated in 1887 and quickly became a thriving agricultural community. Rye was known for its production of wheat, oats, barley, and hay.
In the early 1900s, the town began to experience a decline in its agricultural production. This was due to the introduction of new farming techniques and the development of new irrigation systems. As a result, many of the farmers in the area moved away, leaving the town with a much smaller population.
In the late 1950s, the town began to experience a resurgence in its economy. This was due to the development of the nearby Pueblo Army Depot, which provided jobs for many of the town's residents. The town also benefited from the construction of the nearby Pueblo Reservoir, which provided a reliable source of water for the town's agricultural production.
Geography
Rye is located in the Arkansas River Valley, approximately 10 miles east of Pueblo. The town is situated at an elevation of 5,845 feet above sea level. The town is surrounded by rolling hills and is located in a semi-arid climate. The average annual precipitation in Rye is approximately 14 inches.
Economy
Rye's economy is largely based on agriculture. The town is known for its production of wheat, oats, barley, and hay. The town also has a small manufacturing sector, which produces a variety of products, including furniture, clothing, and food products.
The town is also home to a number of small businesses, including restaurants, retail stores, and service providers. The town is also home to a number of tourist attractions, including the Pueblo Reservoir and the Pueblo Army Depot.
Demographics
As of the 2010 census, the population of Rye was 531. The town has a population density of approximately 5.3 people per square mile. The median age of the town's population is 44.7 years. The median household income in Rye is $45,938. The town's population is predominantly white, with approximately 95% of the population identifying as white. The town also has a small Hispanic population, with approximately 4% of the population identifying as Hispanic or Latino.
Common Questions
What is Per Capita Income in Rye?
Per Capita income in Rye is $26,223.
What is the Median Family Income in Rye?
Median Family Income in Rye is $48,938.
What is the Median Household income in Rye?
Median Household Income in Rye is $48,875.
What is Inequality or Gini Index in Rye?
Inequality or Gini Index in Rye is 0.32.
What is the Total Population of Rye?
Total Population of Rye is 202.
What is the Total Male Population of Rye?
Total Male Population of Rye is 121.
What is the Total Female Population of Rye?
Total Female Population of Rye is 81.
What is the Ratio of Males per 100 Females in Rye?
There are 149.38 Males per 100 Females in Rye.
What is the Ratio of Females per 100 Males in Rye?
There are 66.94 Females per 100 Males in Rye.
What is the Median Population Age in Rye?
Median Population Age in Rye is 37.6 Years.
What is the Average Family Size in Rye
Average Family Size in Rye is 2.7 People.
What is the Average Household Size in Rye
Average Household Size in Rye is 2.3 People.
How Large is the Labor Force in Rye?
There are 82 People in the Labor Forcein in Rye.
What is the Percentage of People in the Labor Force in Rye?
62.1% of People are in the Labor Force in Rye.