Penrose, CO Map & Demographics
Penrose Map
Penrose Overview
$48,683
PER CAPITA INCOME
$84,740
AVG FAMILY INCOME
$77,286
AVG HOUSEHOLD INCOME
27.2%
WAGE / INCOME GAP [ % ]
72.8¢/ $1
WAGE / INCOME GAP [ $ ]
0.54
INEQUALITY / GINI INDEX
3,900
TOTAL POPULATION
1,910
MALE POPULATION
1,990
FEMALE POPULATION
95.98
MALES / 100 FEMALES
104.19
FEMALES / 100 MALES
41.2
MEDIAN AGE
3.1
AVG FAMILY SIZE
2.7
AVG HOUSEHOLD SIZE
1,633
LABOR FORCE [ PEOPLE ]
56.4%
PERCENT IN LABOR FORCE
8.5%
UNEMPLOYMENT RATE
Penrose Zip Codes
Penrose Area Codes
Income in Penrose
Income Overview in Penrose
Per Capita Income in Penrose is $48,683, while median incomes of families and households are $84,740 and $77,286 respectively.
| Characteristic | Number | Measure |
| Per Capita Income | 3,900 | $48,683 |
| Median Family Income | 1,083 | $84,740 |
| Mean Family Income | 1,083 | $135,078 |
| Median Household Income | 1,436 | $77,286 |
| Mean Household Income | 1,436 | $119,940 |
| Income Deficit | 1,083 | $0 |
| Wage / Income Gap (%) | 3,900 | 27.20% |
| Wage / Income Gap ($) | 3,900 | 72.80¢ per $1 |
| Gini / Inequality Index | 3,900 | 0.54 |
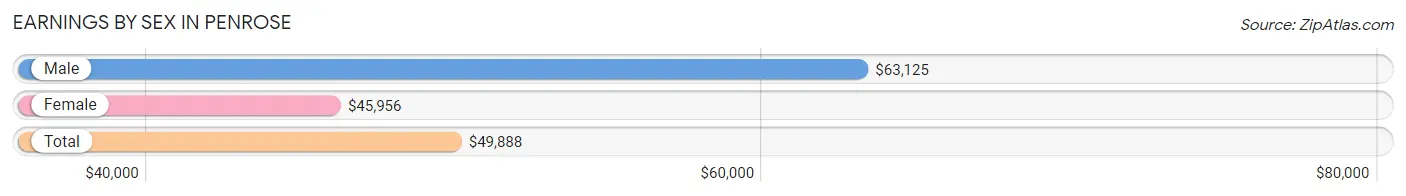
Earnings by Sex in Penrose
Average Earnings in Penrose are $49,888, $63,125 for men and $45,956 for women, a difference of 27.2%.
| Sex | Number | Average Earnings |
| Male | 936 (54.9%) | $63,125 |
| Female | 770 (45.1%) | $45,956 |
| Total | 1,706 (100.0%) | $49,888 |
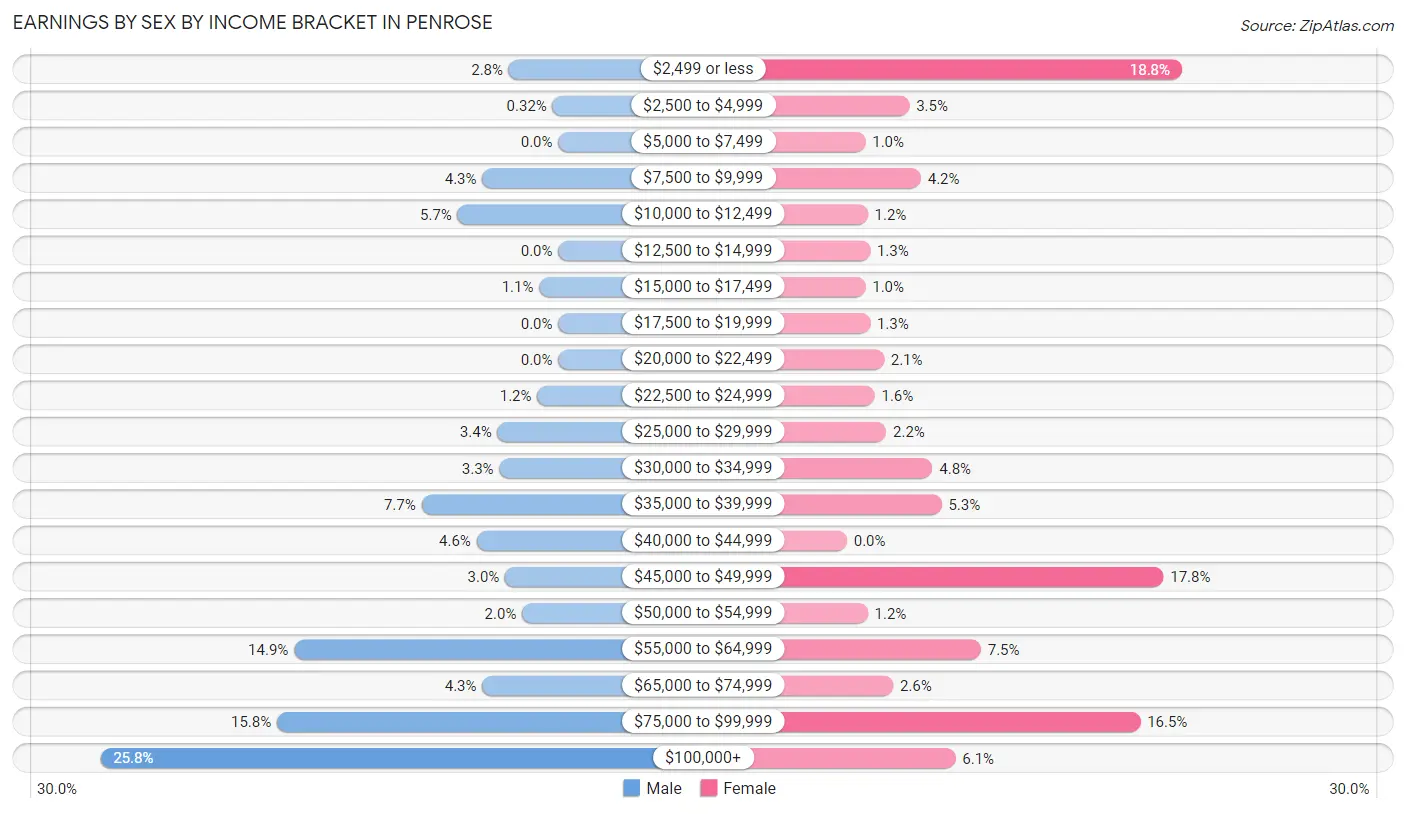
Earnings by Sex by Income Bracket in Penrose
The most common earnings brackets in Penrose are $100,000+ for men (241 | 25.8%) and $2,499 or less for women (145 | 18.8%).
| Income | Male | Female |
| $2,499 or less | 26 (2.8%) | 145 (18.8%) |
| $2,500 to $4,999 | 3 (0.3%) | 27 (3.5%) |
| $5,000 to $7,499 | 0 (0.0%) | 8 (1.0%) |
| $7,500 to $9,999 | 40 (4.3%) | 32 (4.2%) |
| $10,000 to $12,499 | 53 (5.7%) | 9 (1.2%) |
| $12,500 to $14,999 | 0 (0.0%) | 10 (1.3%) |
| $15,000 to $17,499 | 10 (1.1%) | 8 (1.0%) |
| $17,500 to $19,999 | 0 (0.0%) | 10 (1.3%) |
| $20,000 to $22,499 | 0 (0.0%) | 16 (2.1%) |
| $22,500 to $24,999 | 11 (1.2%) | 12 (1.6%) |
| $25,000 to $29,999 | 32 (3.4%) | 17 (2.2%) |
| $30,000 to $34,999 | 31 (3.3%) | 37 (4.8%) |
| $35,000 to $39,999 | 72 (7.7%) | 41 (5.3%) |
| $40,000 to $44,999 | 43 (4.6%) | 0 (0.0%) |
| $45,000 to $49,999 | 28 (3.0%) | 137 (17.8%) |
| $50,000 to $54,999 | 19 (2.0%) | 9 (1.2%) |
| $55,000 to $64,999 | 139 (14.8%) | 58 (7.5%) |
| $65,000 to $74,999 | 40 (4.3%) | 20 (2.6%) |
| $75,000 to $99,999 | 148 (15.8%) | 127 (16.5%) |
| $100,000+ | 241 (25.8%) | 47 (6.1%) |
| Total | 936 (100.0%) | 770 (100.0%) |
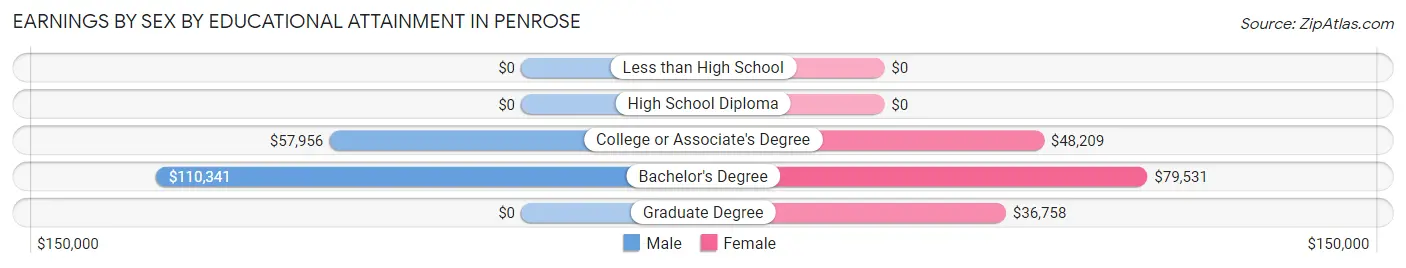
Earnings by Sex by Educational Attainment in Penrose
Average earnings in Penrose are $62,019 for men and $47,500 for women, a difference of 23.4%. Men with an educational attainment of bachelor's degree enjoy the highest average annual earnings of $110,341, while those with college or associate's degree education earn the least with $57,956. Women with an educational attainment of bachelor's degree earn the most with the average annual earnings of $79,531, while those with graduate degree education have the smallest earnings of $36,758.
| Educational Attainment | Male Income | Female Income |
| Less than High School | - | - |
| High School Diploma | - | - |
| College or Associate's Degree | $57,956 | $48,209 |
| Bachelor's Degree | $110,341 | $79,531 |
| Graduate Degree | - | - |
| Total | $62,019 | $47,500 |
Family Income in Penrose
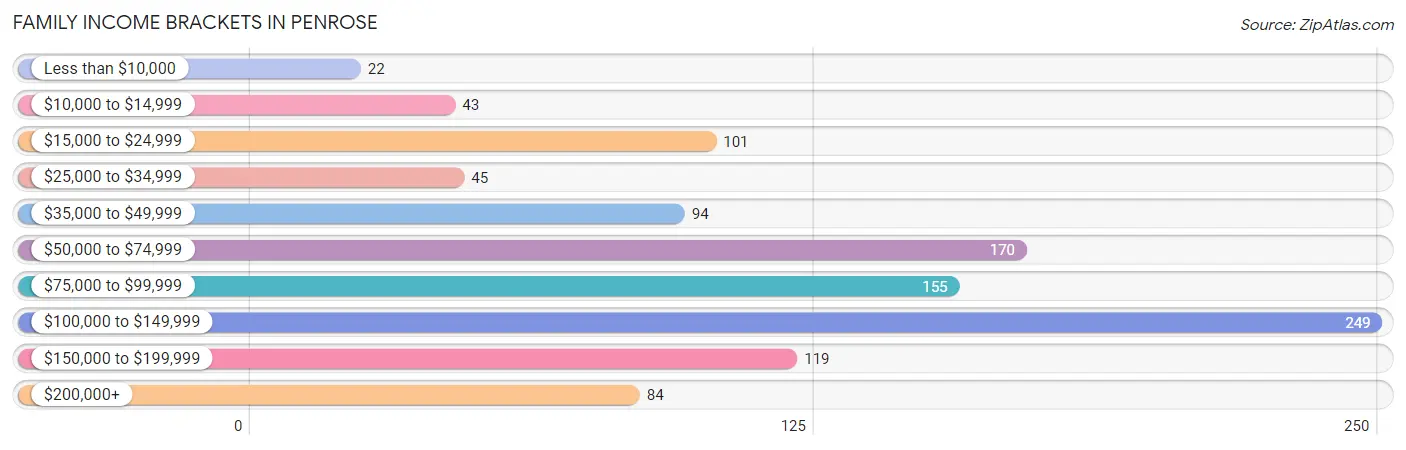
Family Income Brackets in Penrose
According to the Penrose family income data, there are 249 families falling into the $100,000 to $149,999 income range, which is the most common income bracket and makes up 23.0% of all families. Conversely, the less than $10,000 income bracket is the least frequent group with only 22 families (2.0%) belonging to this category.
| Income Bracket | # Families | % Families |
| Less than $10,000 | 22 | 2.0% |
| $10,000 to $14,999 | 43 | 4.0% |
| $15,000 to $24,999 | 101 | 9.3% |
| $25,000 to $34,999 | 45 | 4.2% |
| $35,000 to $49,999 | 94 | 8.7% |
| $50,000 to $74,999 | 170 | 15.7% |
| $75,000 to $99,999 | 155 | 14.3% |
| $100,000 to $149,999 | 249 | 23.0% |
| $150,000 to $199,999 | 119 | 11.0% |
| $200,000+ | 84 | 7.8% |
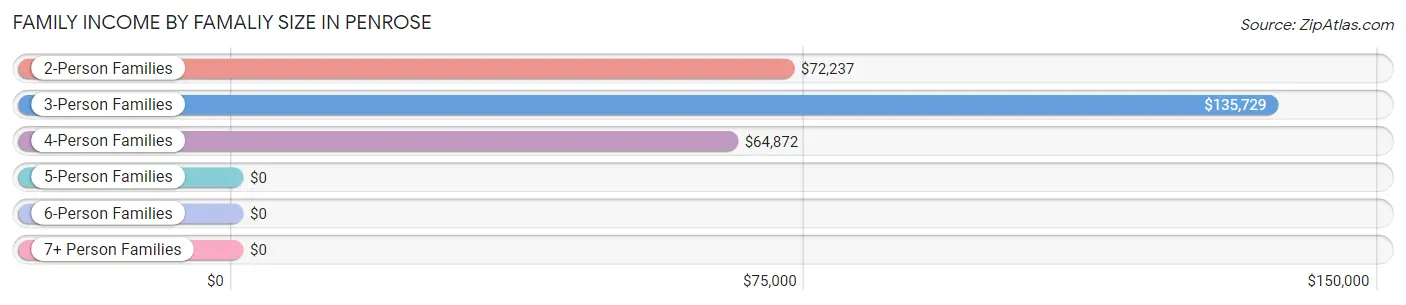
Family Income by Famaliy Size in Penrose
3-person families (263 | 24.3%) account for the highest median family income in Penrose with $135,729 per family, while 3-person families (263 | 24.3%) have the highest median income of $45,243 per family member.
| Income Bracket | # Families | Median Income |
| 2-Person Families | 418 (38.6%) | $72,237 |
| 3-Person Families | 263 (24.3%) | $135,729 |
| 4-Person Families | 229 (21.1%) | $64,872 |
| 5-Person Families | 95 (8.8%) | $0 |
| 6-Person Families | 25 (2.3%) | $0 |
| 7+ Person Families | 53 (4.9%) | $0 |
| Total | 1,083 (100.0%) | $84,740 |
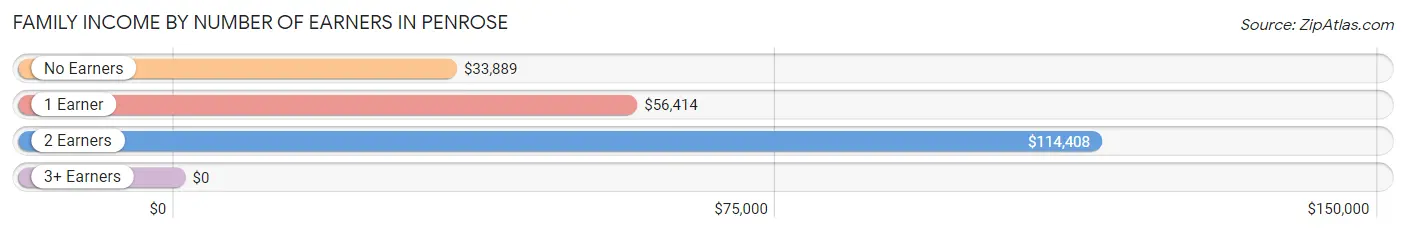
Family Income by Number of Earners in Penrose
| Number of Earners | # Families | Median Income |
| No Earners | 222 (20.5%) | $33,889 |
| 1 Earner | 333 (30.7%) | $56,414 |
| 2 Earners | 507 (46.8%) | $114,408 |
| 3+ Earners | 21 (1.9%) | $0 |
| Total | 1,083 (100.0%) | $84,740 |
Household Income in Penrose
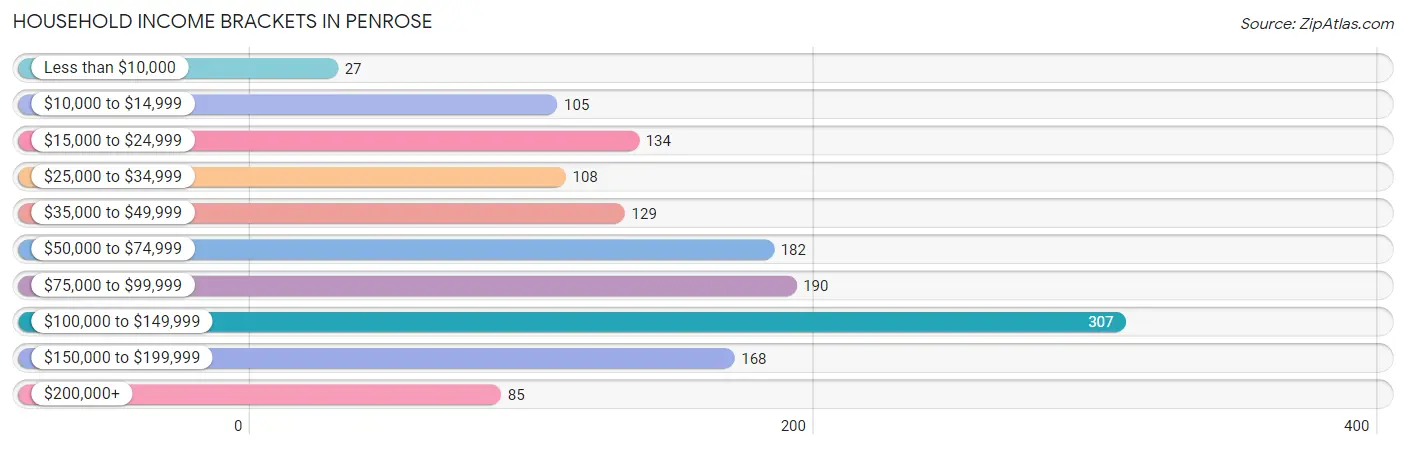
Household Income Brackets in Penrose
With 307 households falling in the category, the $100,000 to $149,999 income range is the most frequent in Penrose, accounting for 21.4% of all households. In contrast, only 27 households (1.9%) fall into the less than $10,000 income bracket, making it the least populous group.
| Income Bracket | # Households | % Households |
| Less than $10,000 | 27 | 1.9% |
| $10,000 to $14,999 | 105 | 7.3% |
| $15,000 to $24,999 | 134 | 9.3% |
| $25,000 to $34,999 | 108 | 7.5% |
| $35,000 to $49,999 | 129 | 9.0% |
| $50,000 to $74,999 | 182 | 12.7% |
| $75,000 to $99,999 | 190 | 13.2% |
| $100,000 to $149,999 | 307 | 21.4% |
| $150,000 to $199,999 | 168 | 11.7% |
| $200,000+ | 85 | 5.9% |
Household Income by Householder Age in Penrose
The median household income in Penrose is $77,286, with the highest median household income of $102,125 found in the 45 to 64 years age bracket for the primary householder. A total of 471 households (32.8%) fall into this category. Meanwhile, the 15 to 24 years age bracket for the primary householder has the lowest median household income of $0, with 99 households (6.9%) in this group.
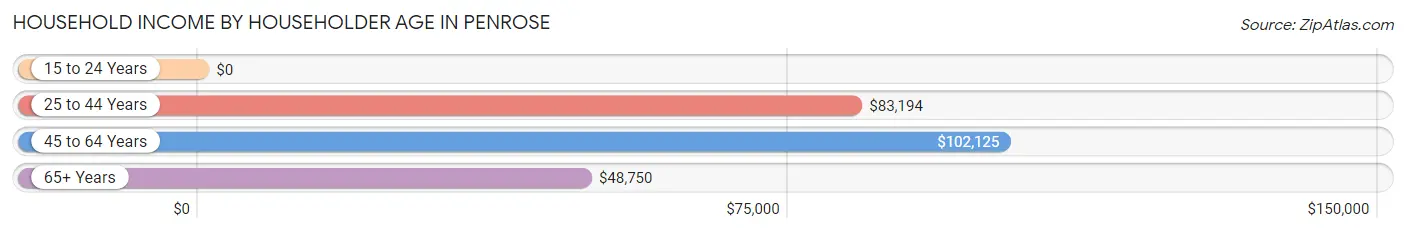
| Income Bracket | # Households | Median Income |
| 15 to 24 Years | 99 (6.9%) | $0 |
| 25 to 44 Years | 413 (28.8%) | $83,194 |
| 45 to 64 Years | 471 (32.8%) | $102,125 |
| 65+ Years | 453 (31.6%) | $48,750 |
| Total | 1,436 (100.0%) | $77,286 |
Poverty in Penrose
Income Below Poverty by Sex and Age in Penrose
With 7.6% poverty level for males and 14.2% for females among the residents of Penrose, under 5 year old males and 75 year old and over females are the most vulnerable to poverty, with 38 males (37.2%) and 53 females (39.0%) in their respective age groups living below the poverty level.
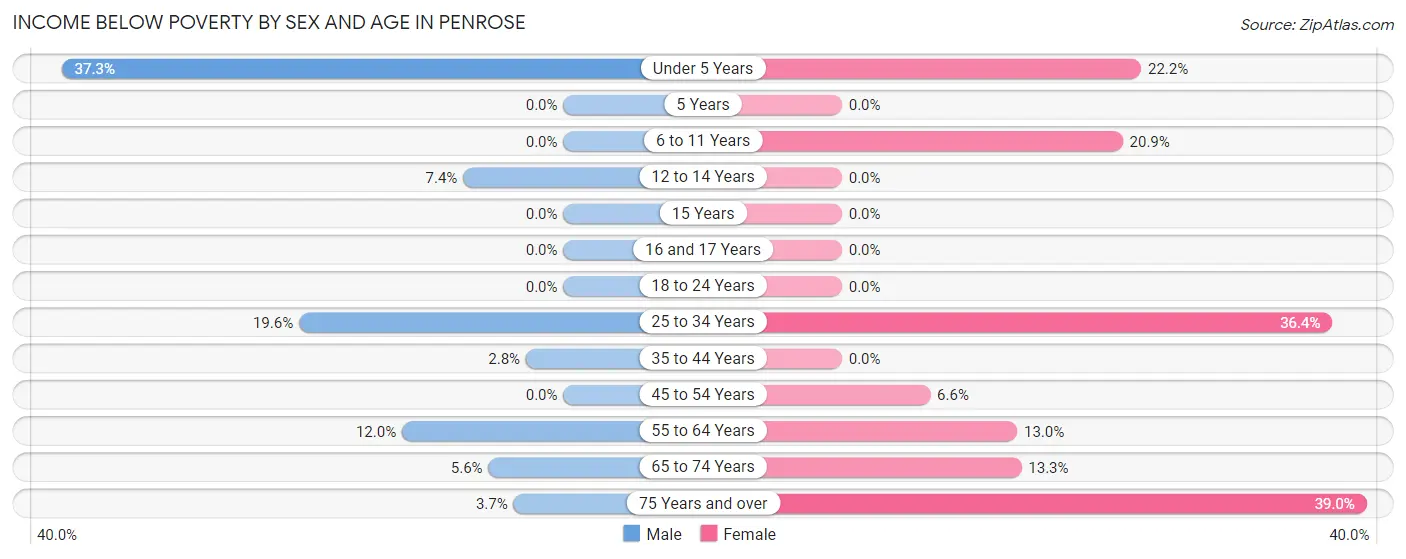
| Age Bracket | Male | Female |
| Under 5 Years | 38 (37.2%) | 24 (22.2%) |
| 5 Years | 0 (0.0%) | 0 (0.0%) |
| 6 to 11 Years | 0 (0.0%) | 54 (20.8%) |
| 12 to 14 Years | 9 (7.4%) | 0 (0.0%) |
| 15 Years | 0 (0.0%) | 0 (0.0%) |
| 16 and 17 Years | 0 (0.0%) | 0 (0.0%) |
| 18 to 24 Years | 0 (0.0%) | 0 (0.0%) |
| 25 to 34 Years | 43 (19.6%) | 71 (36.4%) |
| 35 to 44 Years | 8 (2.8%) | 0 (0.0%) |
| 45 to 54 Years | 0 (0.0%) | 16 (6.6%) |
| 55 to 64 Years | 29 (12.0%) | 38 (13.0%) |
| 65 to 74 Years | 11 (5.6%) | 26 (13.3%) |
| 75 Years and over | 6 (3.7%) | 53 (39.0%) |
| Total | 144 (7.6%) | 282 (14.2%) |
Income Above Poverty by Sex and Age in Penrose
According to the poverty statistics in Penrose, males aged 5 years and females aged 5 years are the age groups that are most secure financially, with 100.0% of males and 100.0% of females in these age groups living above the poverty line.
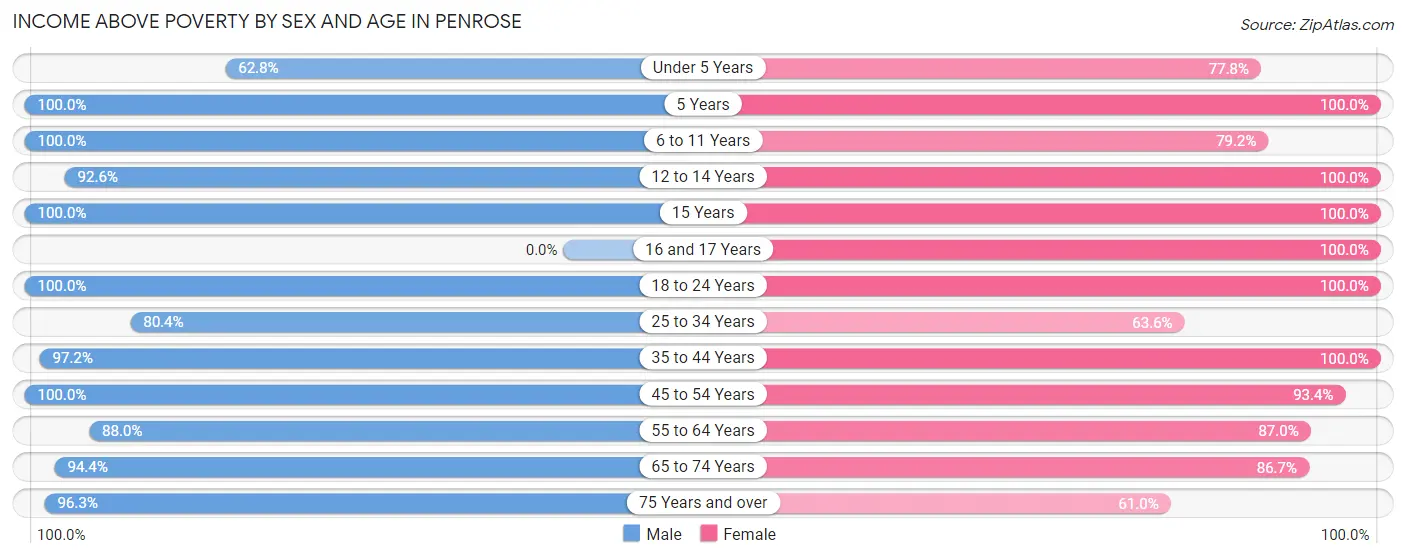
| Age Bracket | Male | Female |
| Under 5 Years | 64 (62.7%) | 84 (77.8%) |
| 5 Years | 17 (100.0%) | 68 (100.0%) |
| 6 to 11 Years | 220 (100.0%) | 205 (79.1%) |
| 12 to 14 Years | 112 (92.6%) | 35 (100.0%) |
| 15 Years | 19 (100.0%) | 48 (100.0%) |
| 16 and 17 Years | 0 (0.0%) | 20 (100.0%) |
| 18 to 24 Years | 73 (100.0%) | 121 (100.0%) |
| 25 to 34 Years | 176 (80.4%) | 124 (63.6%) |
| 35 to 44 Years | 280 (97.2%) | 269 (100.0%) |
| 45 to 54 Years | 242 (100.0%) | 228 (93.4%) |
| 55 to 64 Years | 213 (88.0%) | 254 (87.0%) |
| 65 to 74 Years | 187 (94.4%) | 169 (86.7%) |
| 75 Years and over | 156 (96.3%) | 83 (61.0%) |
| Total | 1,759 (92.4%) | 1,708 (85.8%) |
Income Below Poverty Among Married-Couple Families in Penrose
The poverty statistics for married-couple families in Penrose show that 6.1% or 54 of the total 890 families live below the poverty line. Families with 3 or 4 children have the highest poverty rate of 81.1%, comprising of 43 families. On the other hand, families with 1 or 2 children have the lowest poverty rate of 0.0%, which includes 0 families.
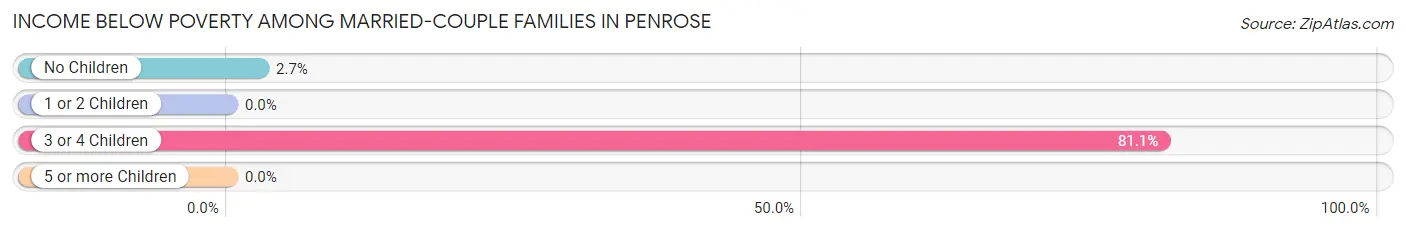
| Children | Above Poverty | Below Poverty |
| No Children | 396 (97.3%) | 11 (2.7%) |
| 1 or 2 Children | 387 (100.0%) | 0 (0.0%) |
| 3 or 4 Children | 10 (18.9%) | 43 (81.1%) |
| 5 or more Children | 43 (100.0%) | 0 (0.0%) |
| Total | 836 (93.9%) | 54 (6.1%) |
Income Below Poverty Among Single-Parent Households in Penrose
According to the poverty data in Penrose, 57.1% or 8 single-father households and 21.2% or 38 single-mother households are living below the poverty line. Among single-father households, those with 1 or 2 children have the highest poverty rate, with 8 households (100.0%) experiencing poverty. Likewise, among single-mother households, those with 3 or 4 children have the highest poverty rate, with 27 households (62.8%) falling below the poverty line.
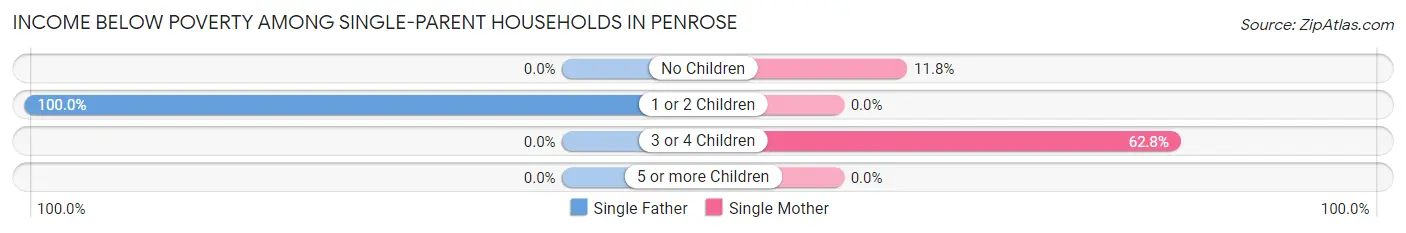
| Children | Single Father | Single Mother |
| No Children | 0 (0.0%) | 11 (11.8%) |
| 1 or 2 Children | 8 (100.0%) | 0 (0.0%) |
| 3 or 4 Children | 0 (0.0%) | 27 (62.8%) |
| 5 or more Children | 0 (0.0%) | 0 (0.0%) |
| Total | 8 (57.1%) | 38 (21.2%) |
Income Below Poverty Among Married-Couple vs Single-Parent Households in Penrose
The poverty data for Penrose shows that 54 of the married-couple family households (6.1%) and 46 of the single-parent households (23.8%) are living below the poverty level. Within the married-couple family households, those with 3 or 4 children have the highest poverty rate, with 43 households (81.1%) falling below the poverty line. Among the single-parent households, those with 3 or 4 children have the highest poverty rate, with 27 household (62.8%) living below poverty.
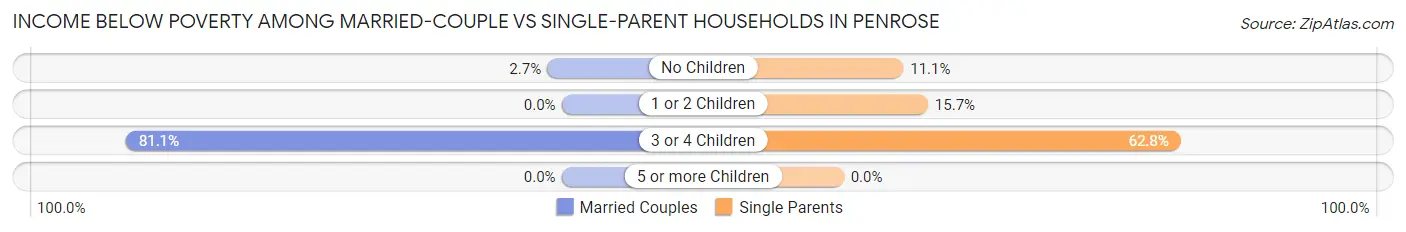
| Children | Married-Couple Families | Single-Parent Households |
| No Children | 11 (2.7%) | 11 (11.1%) |
| 1 or 2 Children | 0 (0.0%) | 8 (15.7%) |
| 3 or 4 Children | 43 (81.1%) | 27 (62.8%) |
| 5 or more Children | 0 (0.0%) | 0 (0.0%) |
| Total | 54 (6.1%) | 46 (23.8%) |
Race in Penrose
The most populous races in Penrose are White / Caucasian (3,683 | 94.4%), Hispanic or Latino (426 | 10.9%), and Two or more Races (204 | 5.2%).
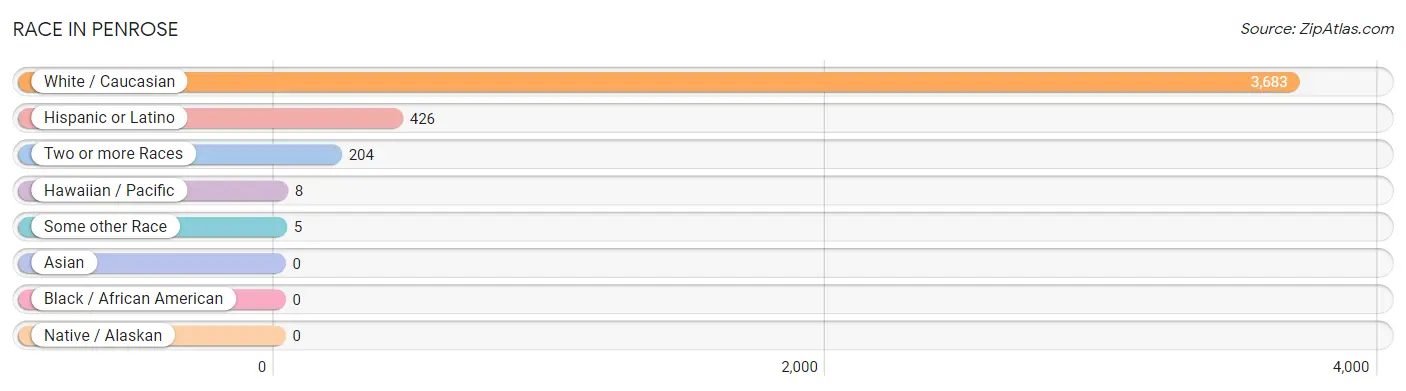
| Race | # Population | % Population |
| Asian | 0 | 0.0% |
| Black / African American | 0 | 0.0% |
| Hawaiian / Pacific | 8 | 0.2% |
| Hispanic or Latino | 426 | 10.9% |
| Native / Alaskan | 0 | 0.0% |
| White / Caucasian | 3,683 | 94.4% |
| Two or more Races | 204 | 5.2% |
| Some other Race | 5 | 0.1% |
| Total | 3,900 | 100.0% |
Ancestry in Penrose
The most populous ancestries reported in Penrose are English (830 | 21.3%), German (570 | 14.6%), Irish (391 | 10.0%), Dutch (340 | 8.7%), and Norwegian (272 | 7.0%), together accounting for 61.6% of all Penrose residents.
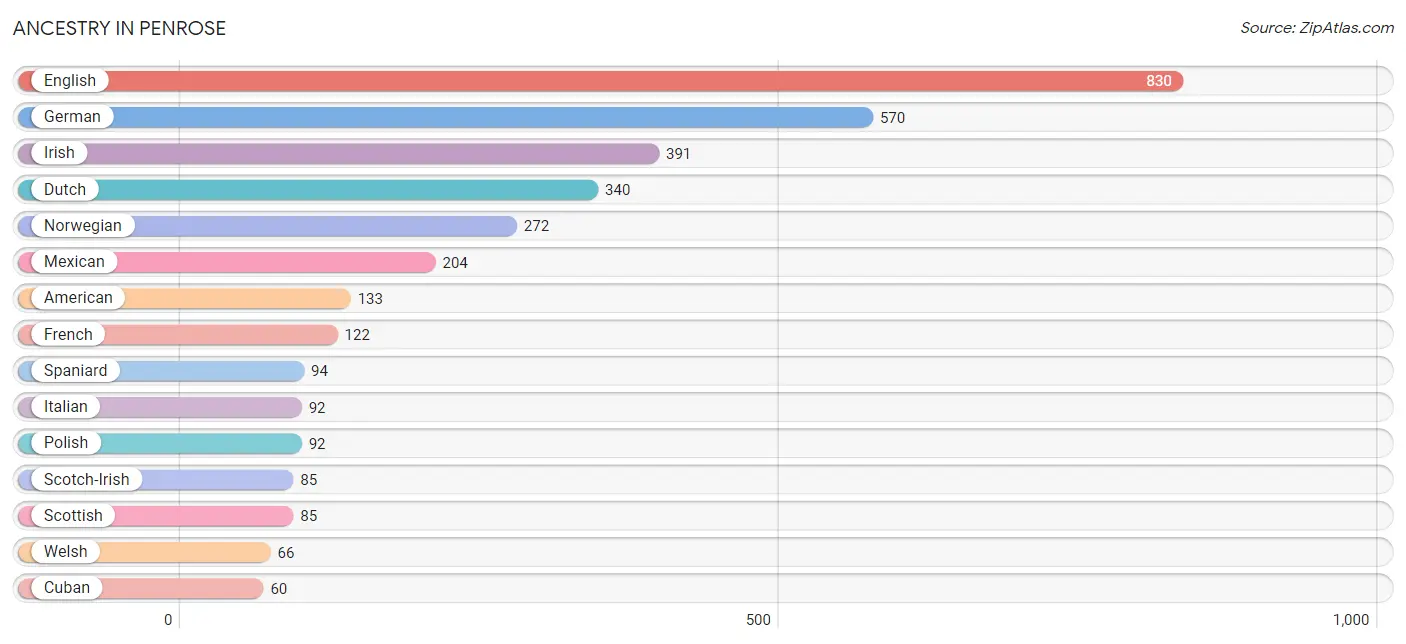
| Ancestry | # Population | % Population |
| American | 133 | 3.4% |
| Austrian | 9 | 0.2% |
| British | 10 | 0.3% |
| Cherokee | 7 | 0.2% |
| Colombian | 52 | 1.3% |
| Cuban | 60 | 1.5% |
| Danish | 19 | 0.5% |
| Dutch | 340 | 8.7% |
| English | 830 | 21.3% |
| European | 20 | 0.5% |
| French | 122 | 3.1% |
| German | 570 | 14.6% |
| Greek | 8 | 0.2% |
| Guamanian / Chamorro | 8 | 0.2% |
| Irish | 391 | 10.0% |
| Italian | 92 | 2.4% |
| Mexican | 204 | 5.2% |
| Northern European | 12 | 0.3% |
| Norwegian | 272 | 7.0% |
| Polish | 92 | 2.4% |
| Portuguese | 19 | 0.5% |
| Russian | 25 | 0.6% |
| Scotch-Irish | 85 | 2.2% |
| Scottish | 85 | 2.2% |
| South American | 52 | 1.3% |
| Spaniard | 94 | 2.4% |
| Spanish | 16 | 0.4% |
| Swedish | 32 | 0.8% |
| Welsh | 66 | 1.7% |
| Yugoslavian | 18 | 0.5% | View All 30 Rows |
Immigrants in Penrose
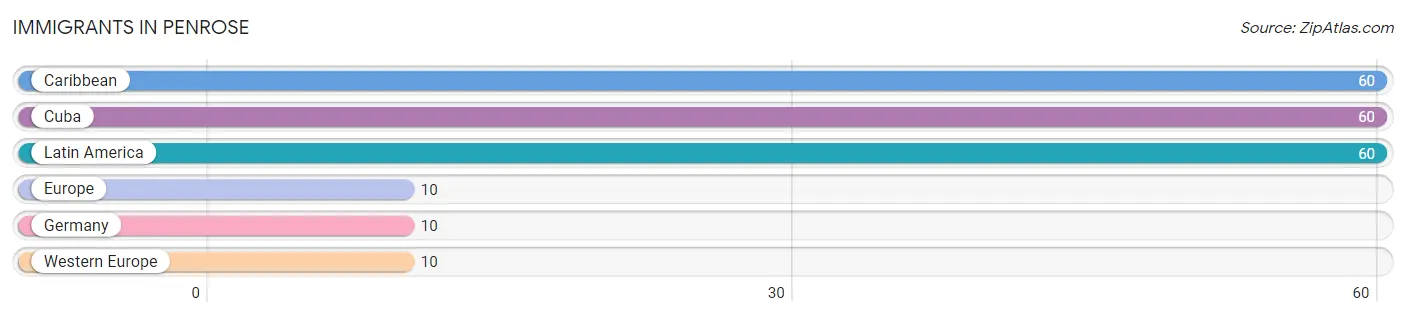
The most numerous immigrant groups reported in Penrose came from Caribbean (60 | 1.5%), Cuba (60 | 1.5%), Latin America (60 | 1.5%), Europe (10 | 0.3%), and Germany (10 | 0.3%), together accounting for 5.1% of all Penrose residents.
| Immigration Origin | # Population | % Population |
| Caribbean | 60 | 1.5% |
| Cuba | 60 | 1.5% |
| Europe | 10 | 0.3% |
| Germany | 10 | 0.3% |
| Latin America | 60 | 1.5% |
| Western Europe | 10 | 0.3% | View All 6 Rows |
Sex and Age in Penrose
Sex and Age in Penrose
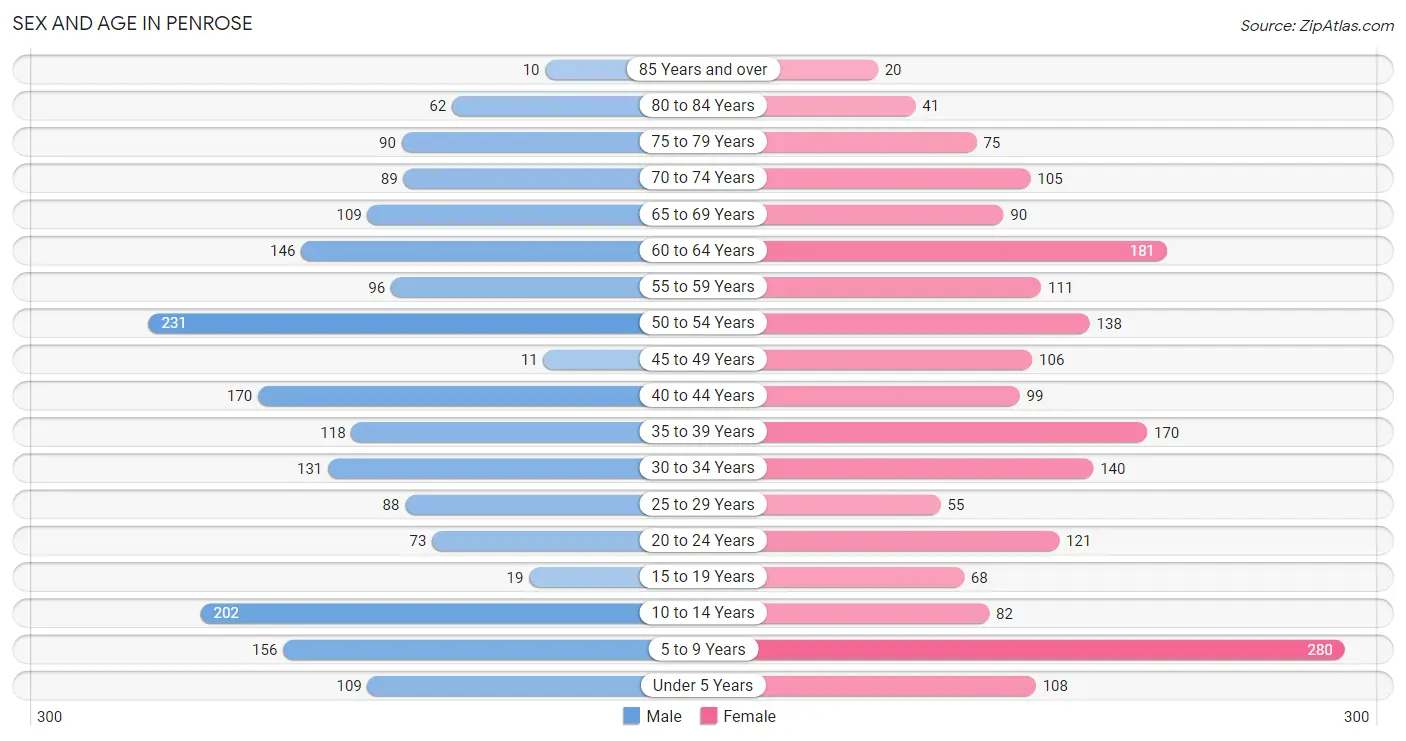
The most populous age groups in Penrose are 50 to 54 Years (231 | 12.1%) for men and 5 to 9 Years (280 | 14.1%) for women.
| Age Bracket | Male | Female |
| Under 5 Years | 109 (5.7%) | 108 (5.4%) |
| 5 to 9 Years | 156 (8.2%) | 280 (14.1%) |
| 10 to 14 Years | 202 (10.6%) | 82 (4.1%) |
| 15 to 19 Years | 19 (1.0%) | 68 (3.4%) |
| 20 to 24 Years | 73 (3.8%) | 121 (6.1%) |
| 25 to 29 Years | 88 (4.6%) | 55 (2.8%) |
| 30 to 34 Years | 131 (6.9%) | 140 (7.0%) |
| 35 to 39 Years | 118 (6.2%) | 170 (8.5%) |
| 40 to 44 Years | 170 (8.9%) | 99 (5.0%) |
| 45 to 49 Years | 11 (0.6%) | 106 (5.3%) |
| 50 to 54 Years | 231 (12.1%) | 138 (6.9%) |
| 55 to 59 Years | 96 (5.0%) | 111 (5.6%) |
| 60 to 64 Years | 146 (7.6%) | 181 (9.1%) |
| 65 to 69 Years | 109 (5.7%) | 90 (4.5%) |
| 70 to 74 Years | 89 (4.7%) | 105 (5.3%) |
| 75 to 79 Years | 90 (4.7%) | 75 (3.8%) |
| 80 to 84 Years | 62 (3.3%) | 41 (2.1%) |
| 85 Years and over | 10 (0.5%) | 20 (1.0%) |
| Total | 1,910 (100.0%) | 1,990 (100.0%) |
Families and Households in Penrose
Median Family Size in Penrose
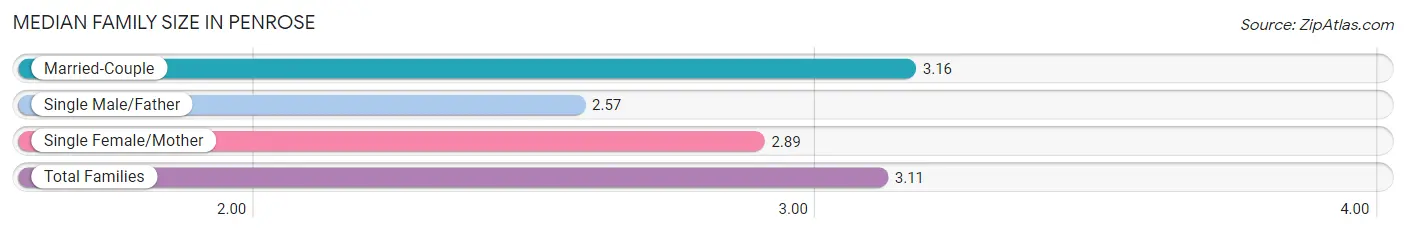
The median family size in Penrose is 3.11 persons per family, with married-couple families (890 | 82.2%) accounting for the largest median family size of 3.16 persons per family. On the other hand, single male/father families (14 | 1.3%) represent the smallest median family size with 2.57 persons per family.
| Family Type | # Families | Family Size |
| Married-Couple | 890 (82.2%) | 3.16 |
| Single Male/Father | 14 (1.3%) | 2.57 |
| Single Female/Mother | 179 (16.5%) | 2.89 |
| Total Families | 1,083 (100.0%) | 3.11 |
Median Household Size in Penrose
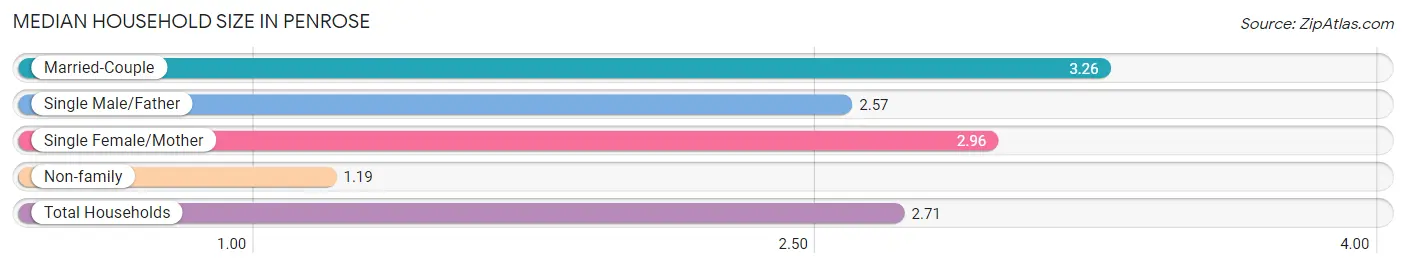
The median household size in Penrose is 2.71 persons per household, with married-couple households (890 | 62.0%) accounting for the largest median household size of 3.26 persons per household. non-family households (353 | 24.6%) represent the smallest median household size with 1.19 persons per household.
| Household Type | # Households | Household Size |
| Married-Couple | 890 (62.0%) | 3.26 |
| Single Male/Father | 14 (1.0%) | 2.57 |
| Single Female/Mother | 179 (12.5%) | 2.96 |
| Non-family | 353 (24.6%) | 1.19 |
| Total Households | 1,436 (100.0%) | 2.71 |
Household Size by Marriage Status in Penrose
Out of a total of 1,436 households in Penrose, 1,083 (75.4%) are family households, while 353 (24.6%) are nonfamily households. The most numerous type of family households are 2-person households, comprising 418, and the most common type of nonfamily households are 1-person households, comprising 277.
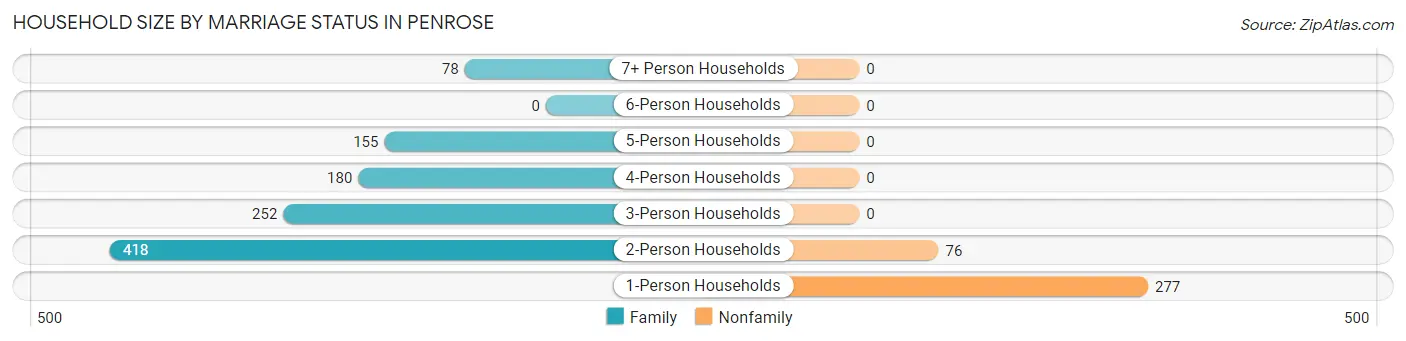
| Household Size | Family Households | Nonfamily Households |
| 1-Person Households | - | 277 (19.3%) |
| 2-Person Households | 418 (29.1%) | 76 (5.3%) |
| 3-Person Households | 252 (17.5%) | 0 (0.0%) |
| 4-Person Households | 180 (12.5%) | 0 (0.0%) |
| 5-Person Households | 155 (10.8%) | 0 (0.0%) |
| 6-Person Households | 0 (0.0%) | 0 (0.0%) |
| 7+ Person Households | 78 (5.4%) | 0 (0.0%) |
| Total | 1,083 (75.4%) | 353 (24.6%) |
Female Fertility in Penrose
Fertility by Age in Penrose
Average fertility rate in Penrose is 52.0 births per 1,000 women. Women in the age bracket of 20 to 34 years have the highest fertility rate with 127.0 births per 1,000 women. Women in the age bracket of 20 to 34 years acount for 100.0% of all women with births.
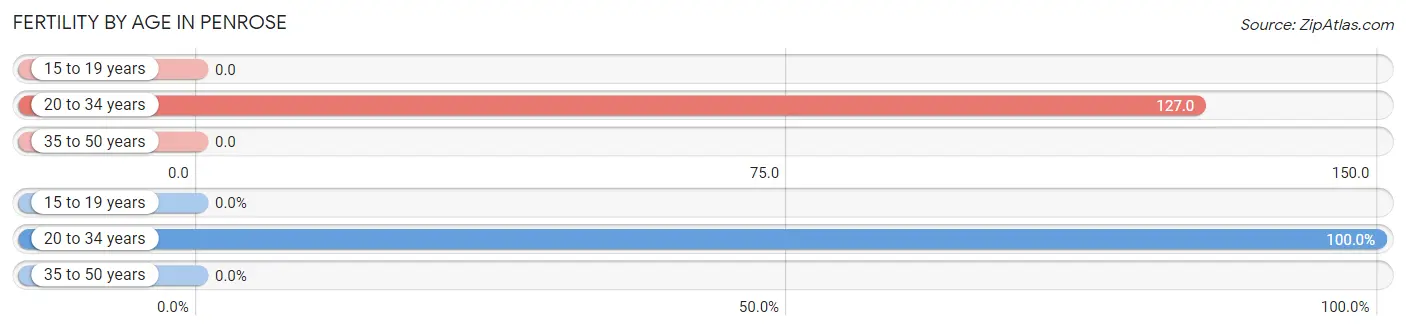
| Age Bracket | Women with Births | Births / 1,000 Women |
| 15 to 19 years | 0 (0.0%) | 0.0 |
| 20 to 34 years | 40 (100.0%) | 127.0 |
| 35 to 50 years | 0 (0.0%) | 0.0 |
| Total | 40 (100.0%) | 52.0 |
Fertility by Age by Marriage Status in Penrose
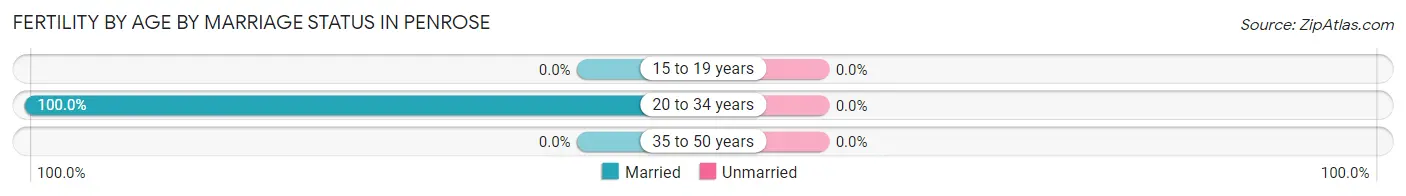
| Age Bracket | Married | Unmarried |
| 15 to 19 years | 0 (0.0%) | 0 (0.0%) |
| 20 to 34 years | 40 (100.0%) | 0 (0.0%) |
| 35 to 50 years | 0 (0.0%) | 0 (0.0%) |
| Total | 40 (100.0%) | 0 (0.0%) |
Fertility by Education in Penrose
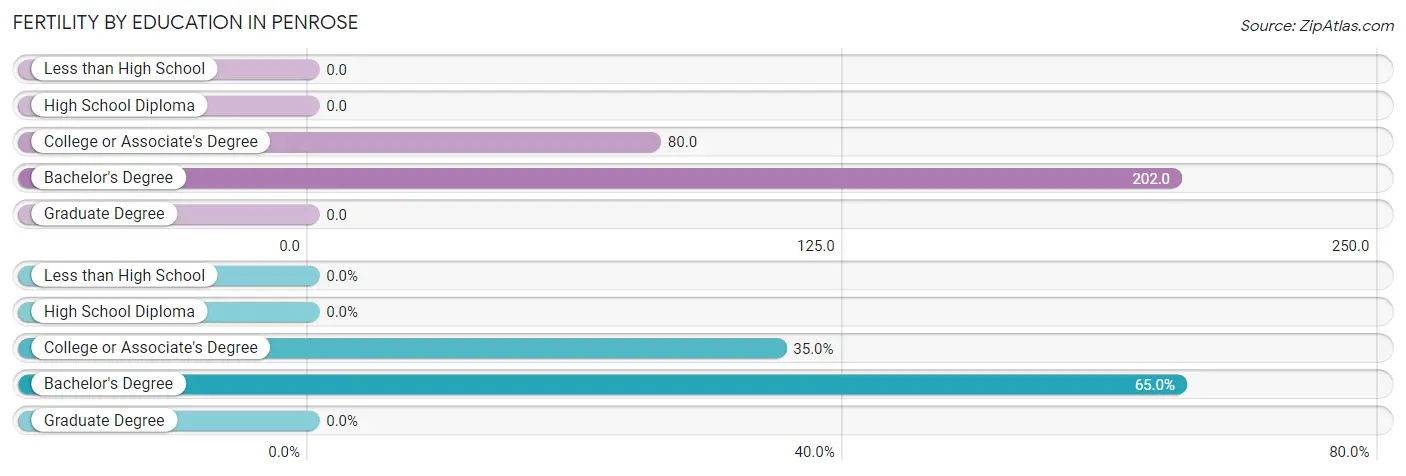
| Educational Attainment | Women with Births | Births / 1,000 Women |
| Less than High School | 0 (0.0%) | 0.0 |
| High School Diploma | 0 (0.0%) | 0.0 |
| College or Associate's Degree | 14 (35.0%) | 80.0 |
| Bachelor's Degree | 26 (65.0%) | 202.0 |
| Graduate Degree | 0 (0.0%) | 0.0 |
| Total | 40 (100.0%) | 52.0 |
Fertility by Education by Marriage Status in Penrose
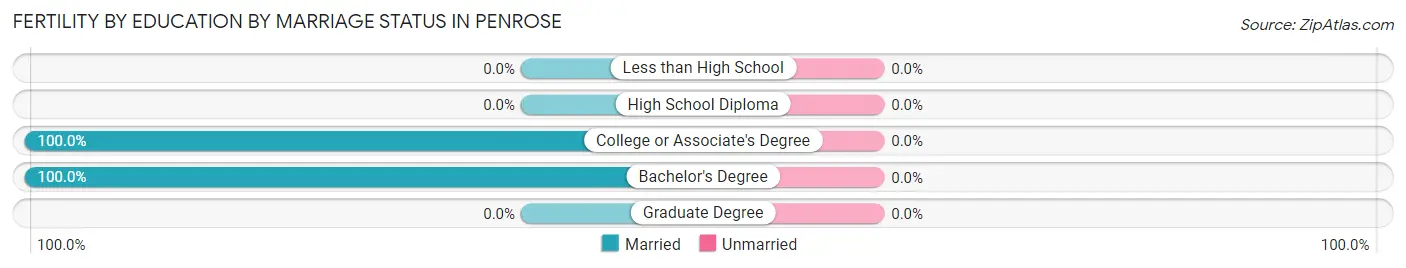
| Educational Attainment | Married | Unmarried |
| Less than High School | 0 (0.0%) | 0 (0.0%) |
| High School Diploma | 0 (0.0%) | 0 (0.0%) |
| College or Associate's Degree | 14 (100.0%) | 0 (0.0%) |
| Bachelor's Degree | 26 (100.0%) | 0 (0.0%) |
| Graduate Degree | 0 (0.0%) | 0 (0.0%) |
| Total | 40 (100.0%) | 0 (0.0%) |
Employment Characteristics in Penrose
Employment by Class of Employer in Penrose
Among the 1,498 employed individuals in Penrose, private company employees (822 | 54.9%), local government employees (174 | 11.6%), and self-employed (not incorporated) (148 | 9.9%) make up the most common classes of employment.
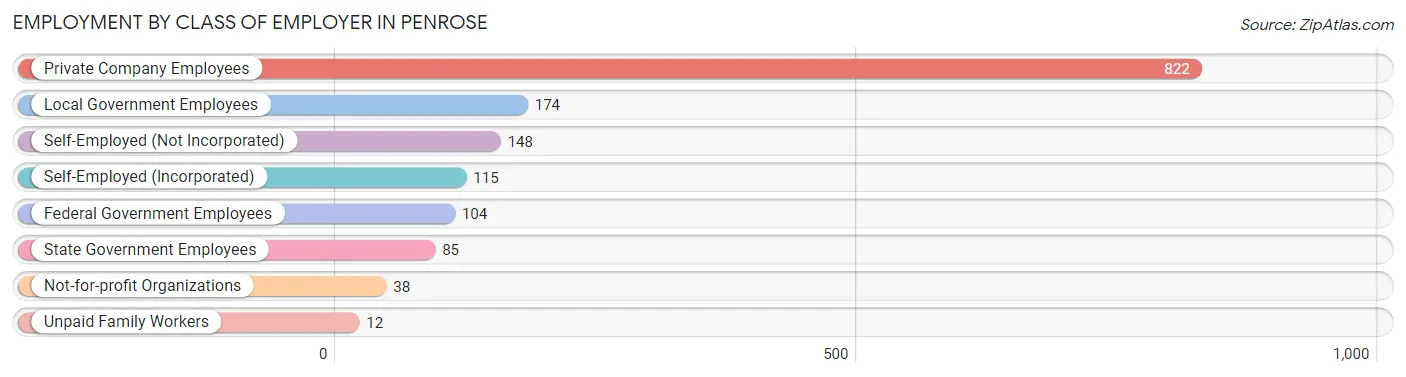
| Employer Class | # Employees | % Employees |
| Private Company Employees | 822 | 54.9% |
| Self-Employed (Incorporated) | 115 | 7.7% |
| Self-Employed (Not Incorporated) | 148 | 9.9% |
| Not-for-profit Organizations | 38 | 2.5% |
| Local Government Employees | 174 | 11.6% |
| State Government Employees | 85 | 5.7% |
| Federal Government Employees | 104 | 6.9% |
| Unpaid Family Workers | 12 | 0.8% |
| Total | 1,498 | 100.0% |
Employment Status by Age in Penrose
According to the labor force statistics for Penrose, out of the total population over 16 years of age (2,896), 56.4% or 1,633 individuals are in the labor force, with 8.5% or 139 of them unemployed. The age group with the highest labor force participation rate is 16 to 19 years, with 100.0% or 20 individuals in the labor force. Within the labor force, the 75 years and over age range has the highest percentage of unemployed individuals, with 30.8% or 8 of them being unemployed.
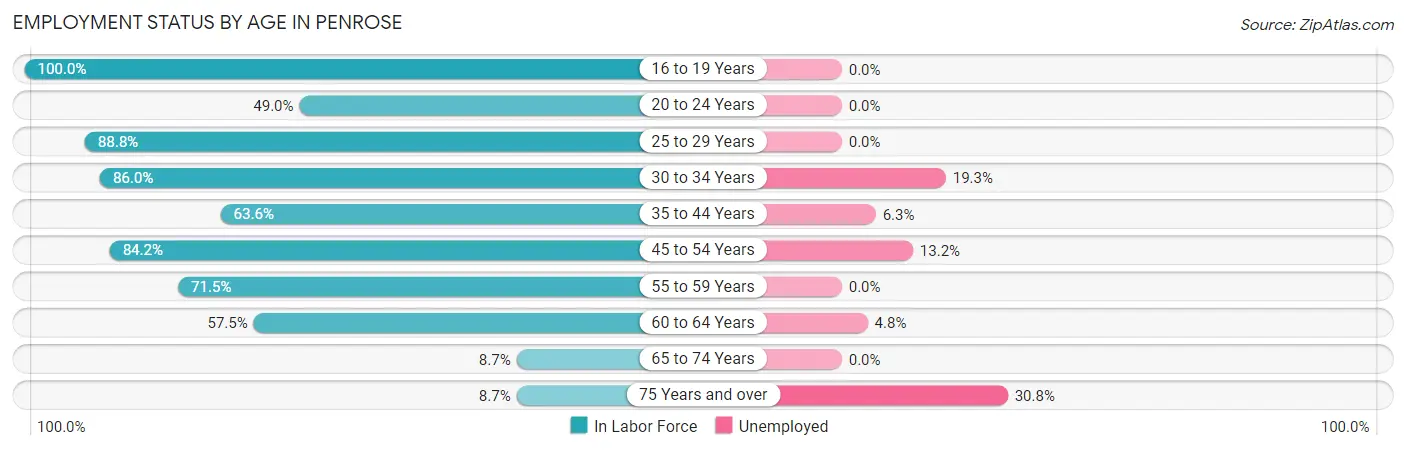
| Age Bracket | In Labor Force | Unemployed |
| 16 to 19 Years | 20 (100.0%) | 0 (0.0%) |
| 20 to 24 Years | 95 (49.0%) | 0 (0.0%) |
| 25 to 29 Years | 127 (88.8%) | 0 (0.0%) |
| 30 to 34 Years | 233 (86.0%) | 45 (19.3%) |
| 35 to 44 Years | 354 (63.6%) | 22 (6.3%) |
| 45 to 54 Years | 409 (84.2%) | 54 (13.2%) |
| 55 to 59 Years | 148 (71.5%) | 0 (0.0%) |
| 60 to 64 Years | 188 (57.5%) | 9 (4.8%) |
| 65 to 74 Years | 34 (8.7%) | 0 (0.0%) |
| 75 Years and over | 26 (8.7%) | 8 (30.8%) |
| Total | 1,633 (56.4%) | 139 (8.5%) |
Employment Status by Educational Attainment in Penrose
According to labor force statistics for Penrose, 73.3% of individuals (1,459) out of the total population between 25 and 64 years of age (1,991) are in the labor force, with 9.0% or 131 of them being unemployed. The group with the highest labor force participation rate are those with the educational attainment of college / associate degree, with 82.3% or 554 individuals in the labor force. Within the labor force, individuals with college / associate degree education have the highest percentage of unemployment, with 14.3% or 79 of them being unemployed.
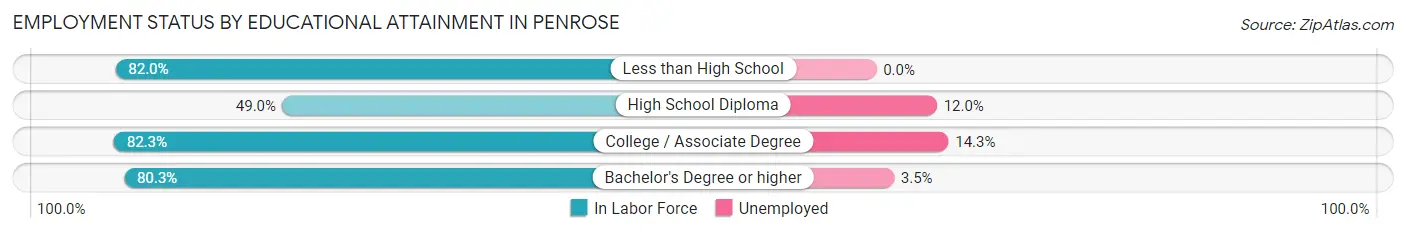
| Educational Attainment | In Labor Force | Unemployed |
| Less than High School | 50 (82.0%) | 0 (0.0%) |
| High School Diploma | 241 (49.0%) | 59 (12.0%) |
| College / Associate Degree | 554 (82.3%) | 96 (14.3%) |
| Bachelor's Degree or higher | 614 (80.3%) | 27 (3.5%) |
| Total | 1,459 (73.3%) | 179 (9.0%) |
Employment Occupations by Sex in Penrose
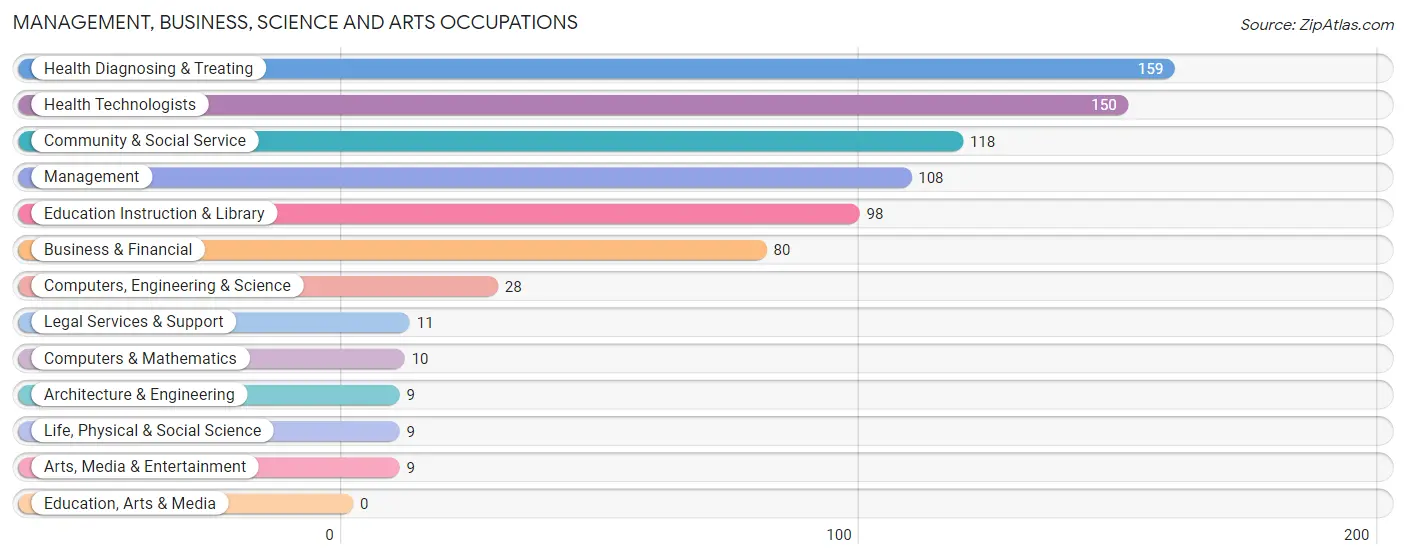
Management, Business, Science and Arts Occupations
The most common Management, Business, Science and Arts occupations in Penrose are Health Diagnosing & Treating (159 | 10.9%), Health Technologists (150 | 10.3%), Community & Social Service (118 | 8.1%), Management (108 | 7.4%), and Education Instruction & Library (98 | 6.7%).
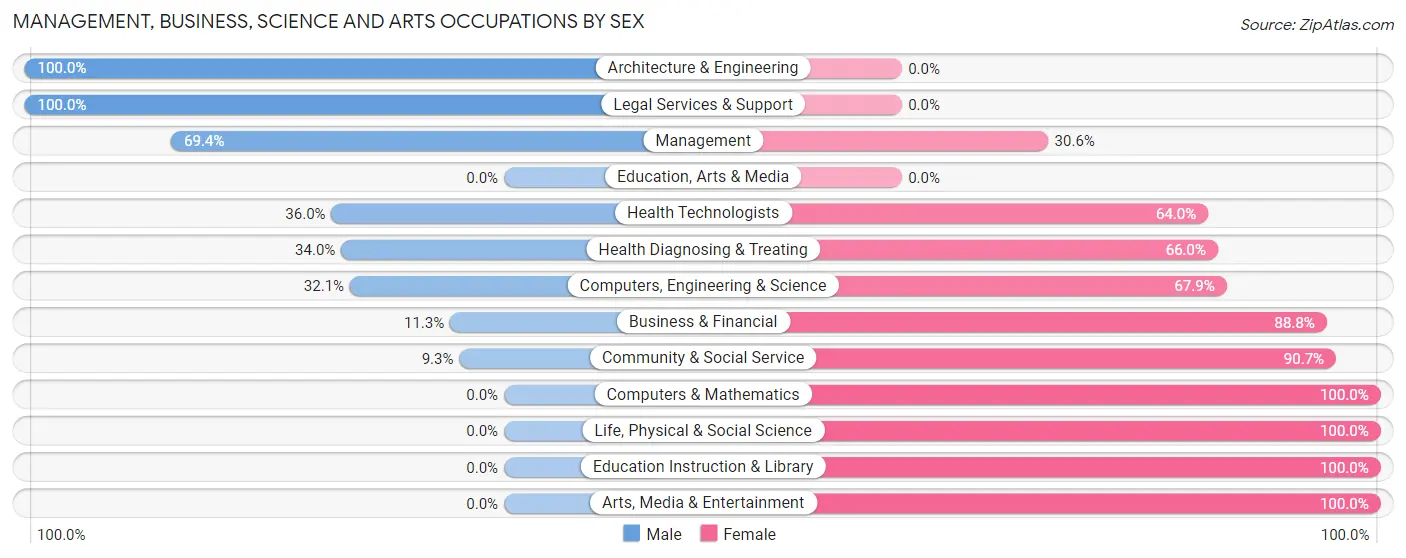
Management, Business, Science and Arts Occupations by Sex
Within the Management, Business, Science and Arts occupations in Penrose, the most male-oriented occupations are Architecture & Engineering (100.0%), Legal Services & Support (100.0%), and Management (69.4%), while the most female-oriented occupations are Computers & Mathematics (100.0%), Life, Physical & Social Science (100.0%), and Education Instruction & Library (100.0%).
| Occupation | Male | Female |
| Management | 75 (69.4%) | 33 (30.6%) |
| Business & Financial | 9 (11.3%) | 71 (88.7%) |
| Computers, Engineering & Science | 9 (32.1%) | 19 (67.9%) |
| Computers & Mathematics | 0 (0.0%) | 10 (100.0%) |
| Architecture & Engineering | 9 (100.0%) | 0 (0.0%) |
| Life, Physical & Social Science | 0 (0.0%) | 9 (100.0%) |
| Community & Social Service | 11 (9.3%) | 107 (90.7%) |
| Education, Arts & Media | 0 (0.0%) | 0 (0.0%) |
| Legal Services & Support | 11 (100.0%) | 0 (0.0%) |
| Education Instruction & Library | 0 (0.0%) | 98 (100.0%) |
| Arts, Media & Entertainment | 0 (0.0%) | 9 (100.0%) |
| Health Diagnosing & Treating | 54 (34.0%) | 105 (66.0%) |
| Health Technologists | 54 (36.0%) | 96 (64.0%) |
| Total (Category) | 158 (32.1%) | 335 (67.9%) |
| Total (Overall) | 810 (55.5%) | 650 (44.5%) |
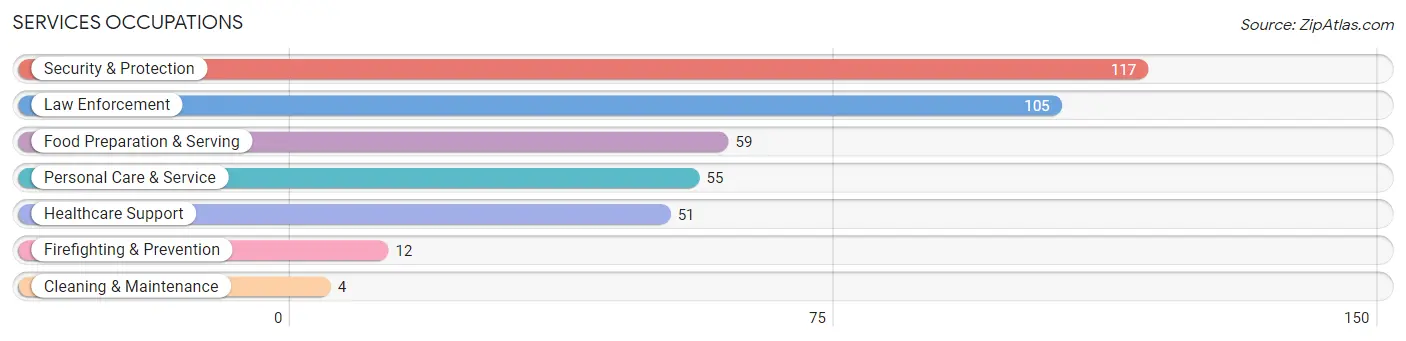
Services Occupations
The most common Services occupations in Penrose are Security & Protection (117 | 8.0%), Law Enforcement (105 | 7.2%), Food Preparation & Serving (59 | 4.0%), Personal Care & Service (55 | 3.8%), and Healthcare Support (51 | 3.5%).
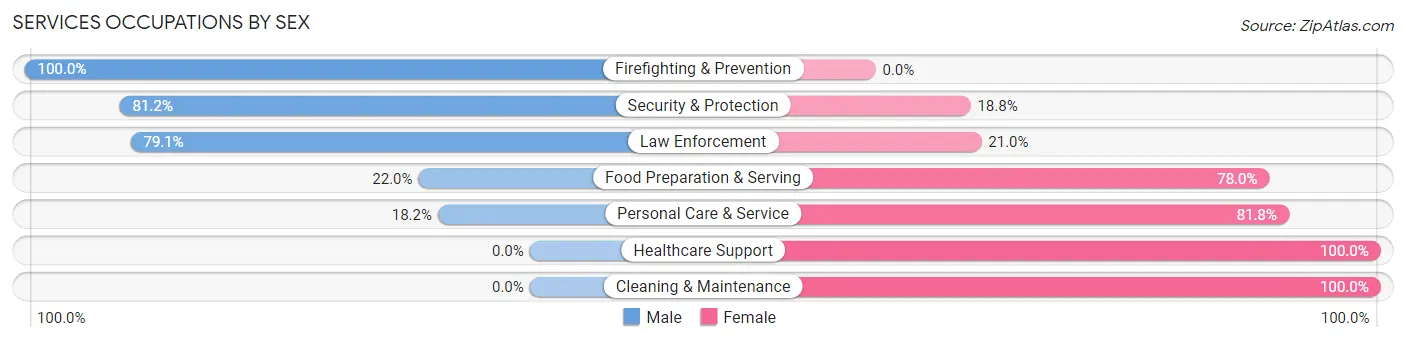
Services Occupations by Sex
Within the Services occupations in Penrose, the most male-oriented occupations are Firefighting & Prevention (100.0%), Security & Protection (81.2%), and Law Enforcement (79.0%), while the most female-oriented occupations are Healthcare Support (100.0%), Cleaning & Maintenance (100.0%), and Personal Care & Service (81.8%).
| Occupation | Male | Female |
| Healthcare Support | 0 (0.0%) | 51 (100.0%) |
| Security & Protection | 95 (81.2%) | 22 (18.8%) |
| Firefighting & Prevention | 12 (100.0%) | 0 (0.0%) |
| Law Enforcement | 83 (79.0%) | 22 (20.9%) |
| Food Preparation & Serving | 13 (22.0%) | 46 (78.0%) |
| Cleaning & Maintenance | 0 (0.0%) | 4 (100.0%) |
| Personal Care & Service | 10 (18.2%) | 45 (81.8%) |
| Total (Category) | 118 (41.3%) | 168 (58.7%) |
| Total (Overall) | 810 (55.5%) | 650 (44.5%) |
Sales and Office Occupations
The most common Sales and Office occupations in Penrose are Sales & Related (148 | 10.1%), and Office & Administration (124 | 8.5%).
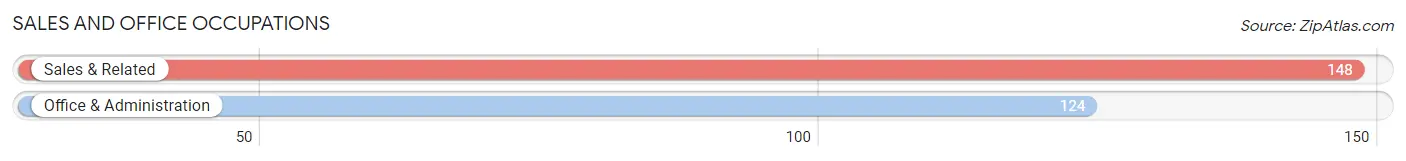
Sales and Office Occupations by Sex

| Occupation | Male | Female |
| Sales & Related | 111 (75.0%) | 37 (25.0%) |
| Office & Administration | 29 (23.4%) | 95 (76.6%) |
| Total (Category) | 140 (51.5%) | 132 (48.5%) |
| Total (Overall) | 810 (55.5%) | 650 (44.5%) |
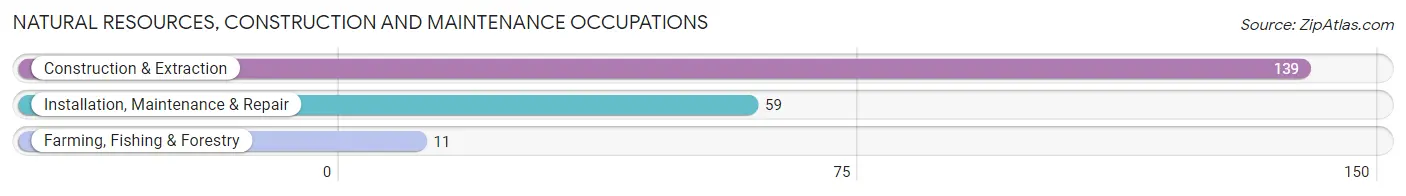
Natural Resources, Construction and Maintenance Occupations
The most common Natural Resources, Construction and Maintenance occupations in Penrose are Construction & Extraction (139 | 9.5%), Installation, Maintenance & Repair (59 | 4.0%), and Farming, Fishing & Forestry (11 | 0.7%).
Natural Resources, Construction and Maintenance Occupations by Sex
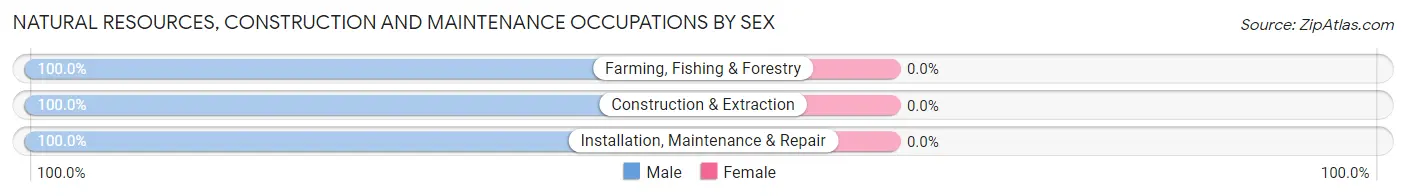
| Occupation | Male | Female |
| Farming, Fishing & Forestry | 11 (100.0%) | 0 (0.0%) |
| Construction & Extraction | 139 (100.0%) | 0 (0.0%) |
| Installation, Maintenance & Repair | 59 (100.0%) | 0 (0.0%) |
| Total (Category) | 209 (100.0%) | 0 (0.0%) |
| Total (Overall) | 810 (55.5%) | 650 (44.5%) |
Production, Transportation and Moving Occupations
The most common Production, Transportation and Moving occupations in Penrose are Transportation (142 | 9.7%), Production (48 | 3.3%), and Material Moving (10 | 0.7%).
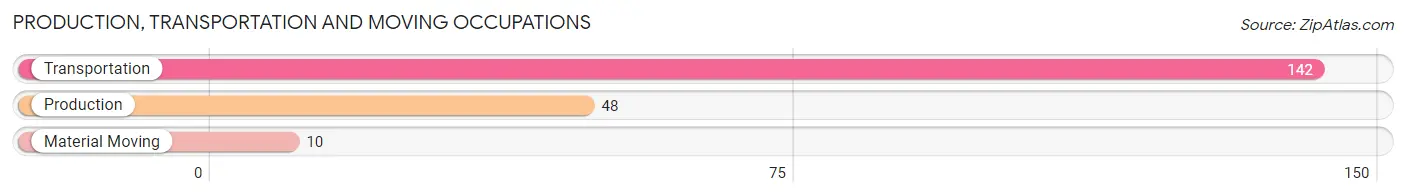
Production, Transportation and Moving Occupations by Sex
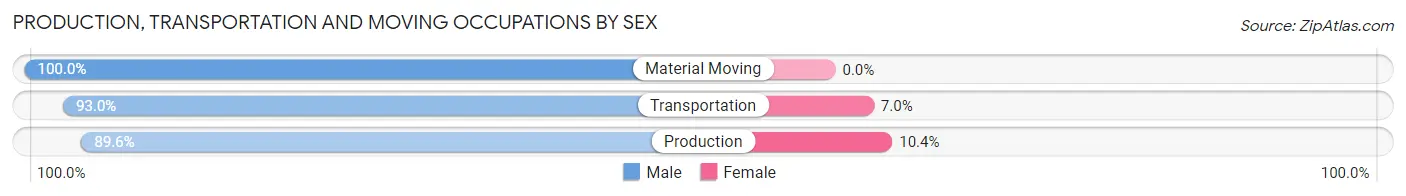
| Occupation | Male | Female |
| Production | 43 (89.6%) | 5 (10.4%) |
| Transportation | 132 (93.0%) | 10 (7.0%) |
| Material Moving | 10 (100.0%) | 0 (0.0%) |
| Total (Category) | 185 (92.5%) | 15 (7.5%) |
| Total (Overall) | 810 (55.5%) | 650 (44.5%) |
Employment Industries by Sex in Penrose
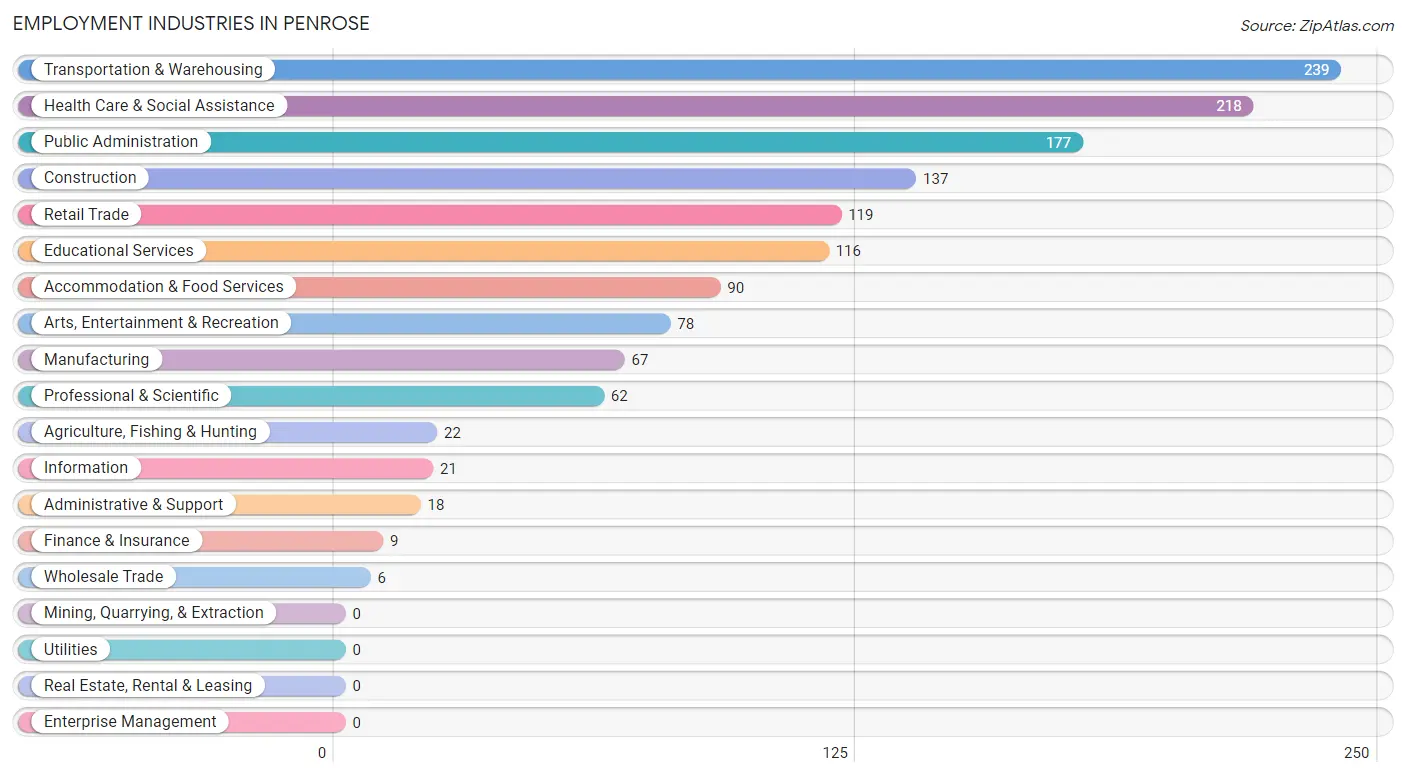
Employment Industries in Penrose
The major employment industries in Penrose include Transportation & Warehousing (239 | 16.4%), Health Care & Social Assistance (218 | 14.9%), Public Administration (177 | 12.1%), Construction (137 | 9.4%), and Retail Trade (119 | 8.2%).
Employment Industries by Sex in Penrose
The Penrose industries that see more men than women are Construction (100.0%), Wholesale Trade (100.0%), and Arts, Entertainment & Recreation (100.0%), whereas the industries that tend to have a higher number of women are Information (100.0%), Finance & Insurance (100.0%), and Educational Services (100.0%).
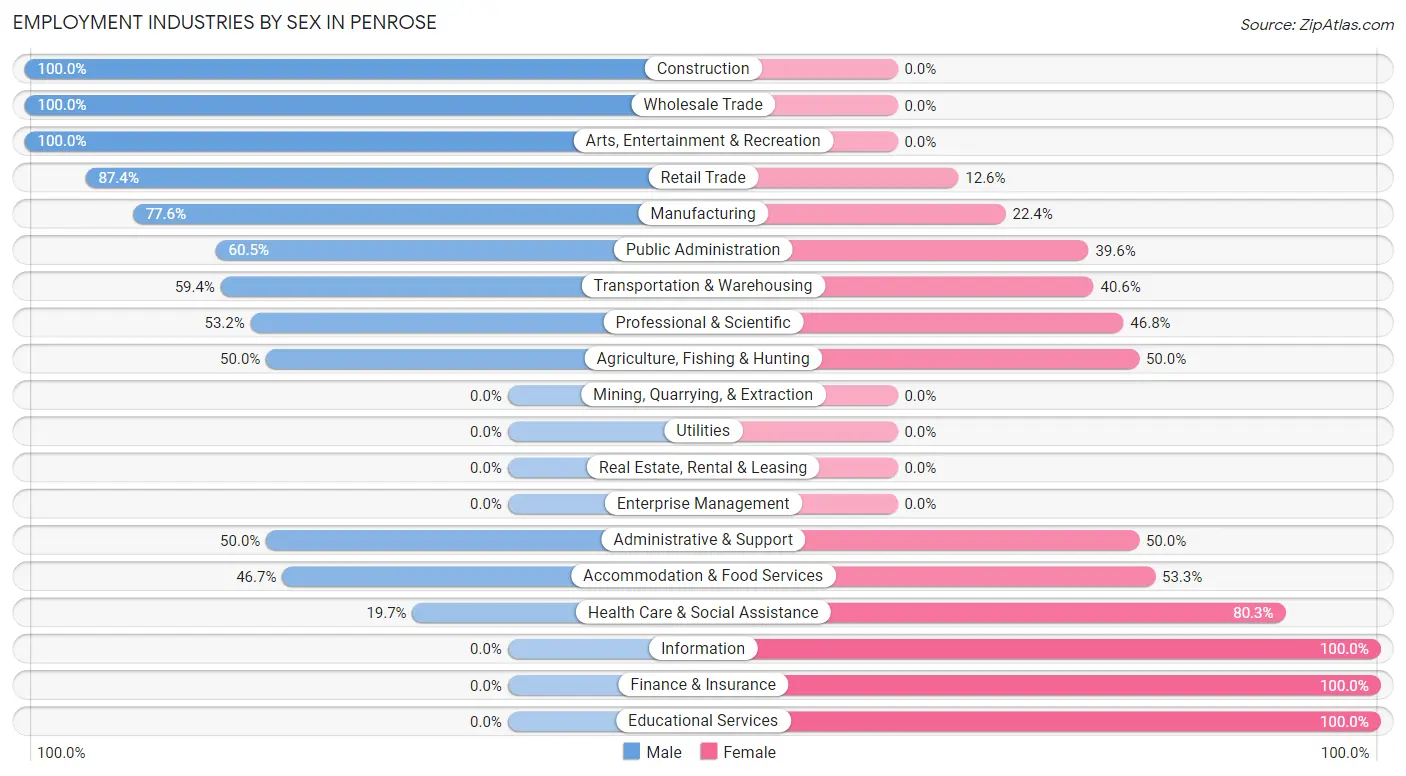
| Industry | Male | Female |
| Agriculture, Fishing & Hunting | 11 (50.0%) | 11 (50.0%) |
| Mining, Quarrying, & Extraction | 0 (0.0%) | 0 (0.0%) |
| Construction | 137 (100.0%) | 0 (0.0%) |
| Manufacturing | 52 (77.6%) | 15 (22.4%) |
| Wholesale Trade | 6 (100.0%) | 0 (0.0%) |
| Retail Trade | 104 (87.4%) | 15 (12.6%) |
| Transportation & Warehousing | 142 (59.4%) | 97 (40.6%) |
| Utilities | 0 (0.0%) | 0 (0.0%) |
| Information | 0 (0.0%) | 21 (100.0%) |
| Finance & Insurance | 0 (0.0%) | 9 (100.0%) |
| Real Estate, Rental & Leasing | 0 (0.0%) | 0 (0.0%) |
| Professional & Scientific | 33 (53.2%) | 29 (46.8%) |
| Enterprise Management | 0 (0.0%) | 0 (0.0%) |
| Administrative & Support | 9 (50.0%) | 9 (50.0%) |
| Educational Services | 0 (0.0%) | 116 (100.0%) |
| Health Care & Social Assistance | 43 (19.7%) | 175 (80.3%) |
| Arts, Entertainment & Recreation | 78 (100.0%) | 0 (0.0%) |
| Accommodation & Food Services | 42 (46.7%) | 48 (53.3%) |
| Public Administration | 107 (60.5%) | 70 (39.6%) |
| Total | 810 (55.5%) | 650 (44.5%) |
Education in Penrose
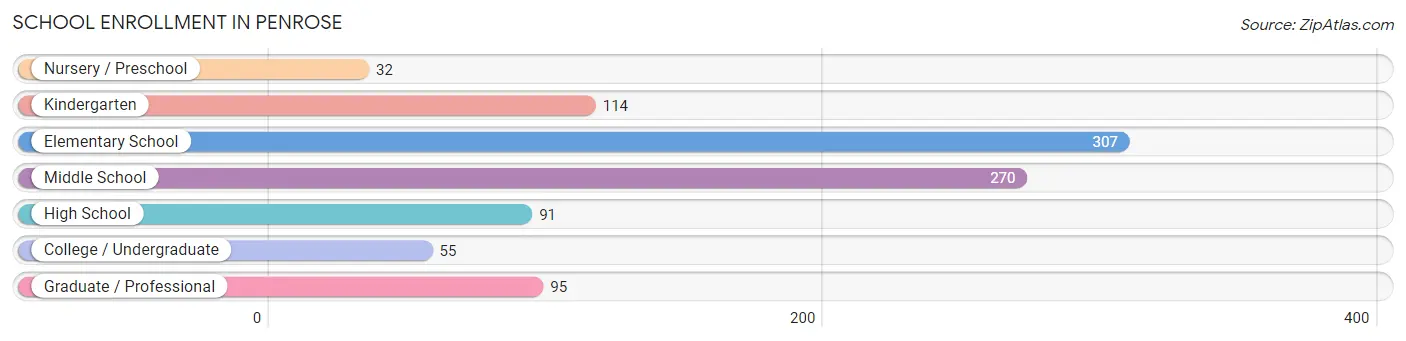
School Enrollment in Penrose
The most common levels of schooling among the 964 students in Penrose are elementary school (307 | 31.9%), middle school (270 | 28.0%), and kindergarten (114 | 11.8%).
| School Level | # Students | % Students |
| Nursery / Preschool | 32 | 3.3% |
| Kindergarten | 114 | 11.8% |
| Elementary School | 307 | 31.9% |
| Middle School | 270 | 28.0% |
| High School | 91 | 9.4% |
| College / Undergraduate | 55 | 5.7% |
| Graduate / Professional | 95 | 9.9% |
| Total | 964 | 100.0% |
School Enrollment by Age by Funding Source in Penrose
Out of a total of 964 students who are enrolled in schools in Penrose, 337 (35.0%) attend a private institution, while the remaining 627 (65.0%) are enrolled in public schools. The age group of 20 to 24 year olds has the highest likelihood of being enrolled in private schools, with 22 (100.0% in the age bracket) enrolled. Conversely, the age group of 3 to 4 year olds has the lowest likelihood of being enrolled in a private school, with 15 (100.0% in the age bracket) attending a public institution.
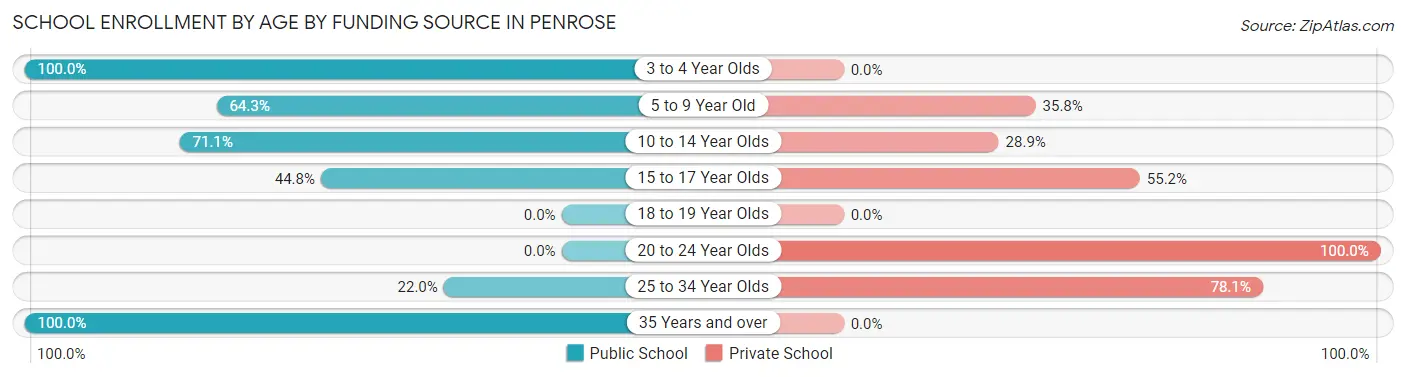
| Age Bracket | Public School | Private School |
| 3 to 4 Year Olds | 15 (100.0%) | 0 (0.0%) |
| 5 to 9 Year Old | 275 (64.2%) | 153 (35.7%) |
| 10 to 14 Year Olds | 202 (71.1%) | 82 (28.9%) |
| 15 to 17 Year Olds | 39 (44.8%) | 48 (55.2%) |
| 18 to 19 Year Olds | 0 (0.0%) | 0 (0.0%) |
| 20 to 24 Year Olds | 0 (0.0%) | 22 (100.0%) |
| 25 to 34 Year Olds | 9 (22.0%) | 32 (78.0%) |
| 35 Years and over | 87 (100.0%) | 0 (0.0%) |
| Total | 627 (65.0%) | 337 (35.0%) |
Educational Attainment by Field of Study in Penrose
Business (256 | 26.0%), social sciences (157 | 15.9%), psychology (98 | 10.0%), education (95 | 9.6%), and science & technology (79 | 8.0%) are the most common fields of study among 985 individuals in Penrose who have obtained a bachelor's degree or higher.
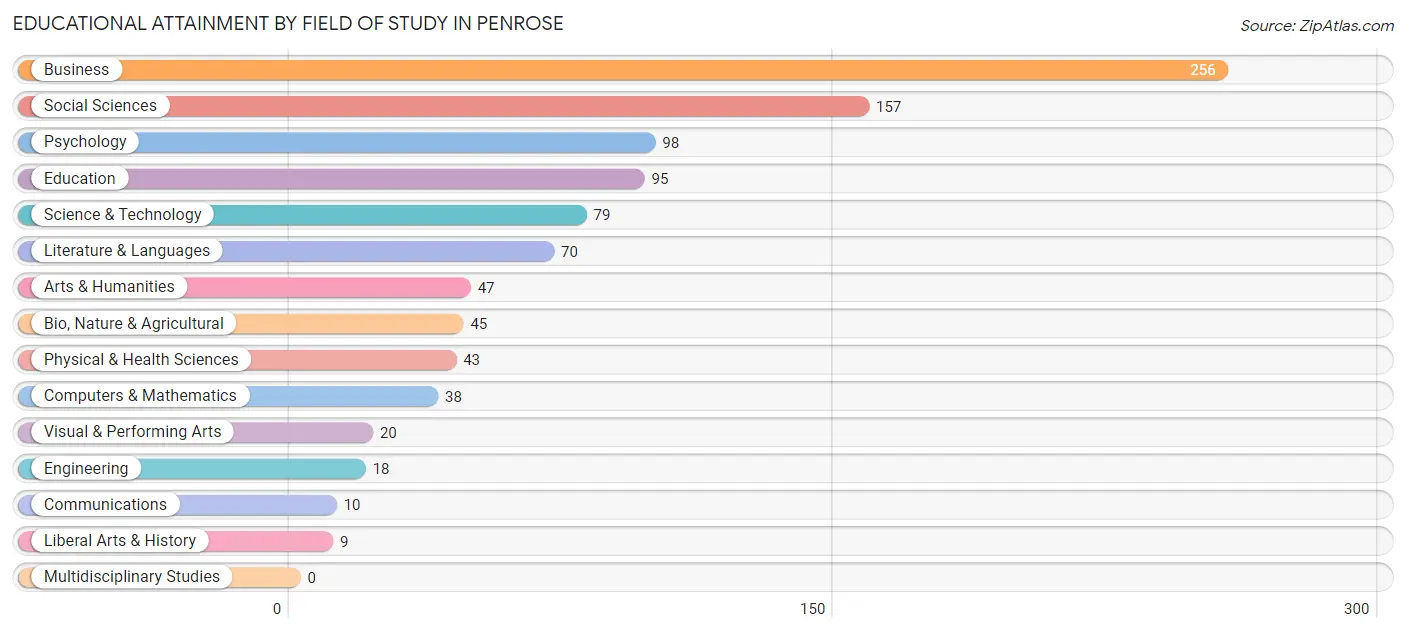
| Field of Study | # Graduates | % Graduates |
| Computers & Mathematics | 38 | 3.9% |
| Bio, Nature & Agricultural | 45 | 4.6% |
| Physical & Health Sciences | 43 | 4.4% |
| Psychology | 98 | 10.0% |
| Social Sciences | 157 | 15.9% |
| Engineering | 18 | 1.8% |
| Multidisciplinary Studies | 0 | 0.0% |
| Science & Technology | 79 | 8.0% |
| Business | 256 | 26.0% |
| Education | 95 | 9.6% |
| Literature & Languages | 70 | 7.1% |
| Liberal Arts & History | 9 | 0.9% |
| Visual & Performing Arts | 20 | 2.0% |
| Communications | 10 | 1.0% |
| Arts & Humanities | 47 | 4.8% |
| Total | 985 | 100.0% |
Transportation & Commute in Penrose
Vehicle Availability by Sex in Penrose
The most prevalent vehicle ownership categories in Penrose are males with 3 vehicles (405, accounting for 47.8%) and females with 3 vehicles (278, making up 62.3%).
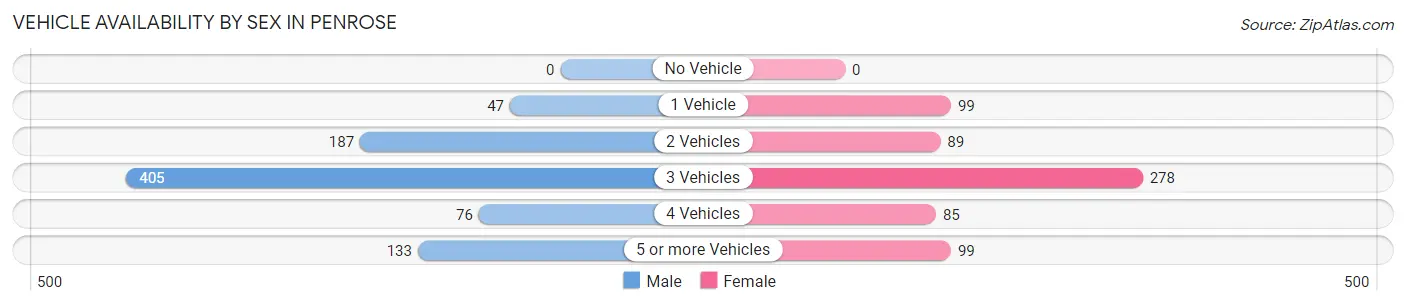
| Vehicles Available | Male | Female |
| No Vehicle | 0 (0.0%) | 0 (0.0%) |
| 1 Vehicle | 47 (5.5%) | 99 (15.2%) |
| 2 Vehicles | 187 (22.1%) | 89 (13.7%) |
| 3 Vehicles | 405 (47.8%) | 278 (42.8%) |
| 4 Vehicles | 76 (9.0%) | 85 (13.1%) |
| 5 or more Vehicles | 133 (15.7%) | 99 (15.2%) |
| Total | 848 (100.0%) | 650 (100.0%) |
Commute Time in Penrose
The most frequently occuring commute durations in Penrose are 20 to 24 minutes (286 commuters, 21.7%), 15 to 19 minutes (220 commuters, 16.7%), and 40 to 44 minutes (142 commuters, 10.8%).
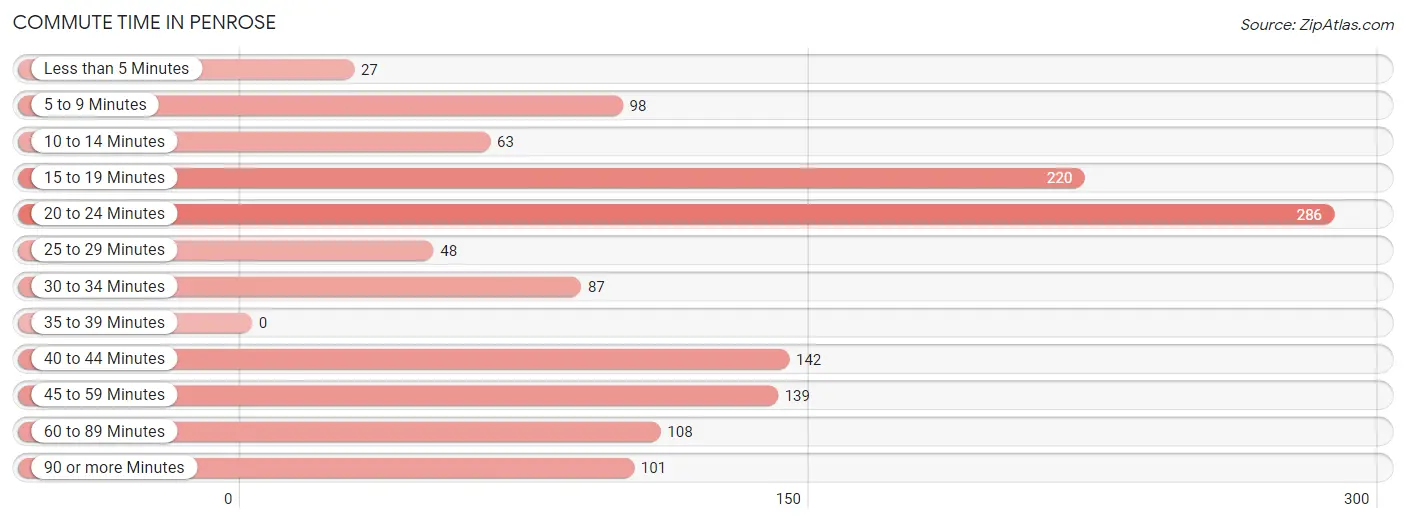
| Commute Time | # Commuters | % Commuters |
| Less than 5 Minutes | 27 | 2.1% |
| 5 to 9 Minutes | 98 | 7.4% |
| 10 to 14 Minutes | 63 | 4.8% |
| 15 to 19 Minutes | 220 | 16.7% |
| 20 to 24 Minutes | 286 | 21.7% |
| 25 to 29 Minutes | 48 | 3.6% |
| 30 to 34 Minutes | 87 | 6.6% |
| 35 to 39 Minutes | 0 | 0.0% |
| 40 to 44 Minutes | 142 | 10.8% |
| 45 to 59 Minutes | 139 | 10.5% |
| 60 to 89 Minutes | 108 | 8.2% |
| 90 or more Minutes | 101 | 7.7% |
Commute Time by Sex in Penrose
The most common commute times in Penrose are 15 to 19 minutes (161 commuters, 21.5%) for males and 20 to 24 minutes (174 commuters, 30.5%) for females.
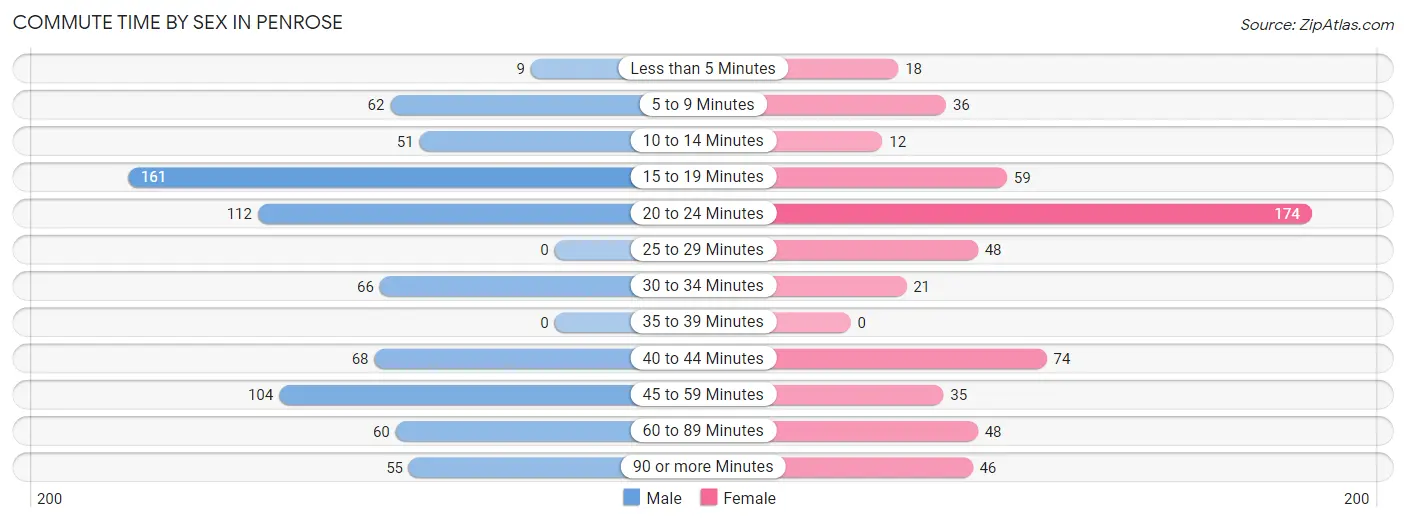
| Commute Time | Male | Female |
| Less than 5 Minutes | 9 (1.2%) | 18 (3.2%) |
| 5 to 9 Minutes | 62 (8.3%) | 36 (6.3%) |
| 10 to 14 Minutes | 51 (6.8%) | 12 (2.1%) |
| 15 to 19 Minutes | 161 (21.5%) | 59 (10.3%) |
| 20 to 24 Minutes | 112 (15.0%) | 174 (30.5%) |
| 25 to 29 Minutes | 0 (0.0%) | 48 (8.4%) |
| 30 to 34 Minutes | 66 (8.8%) | 21 (3.7%) |
| 35 to 39 Minutes | 0 (0.0%) | 0 (0.0%) |
| 40 to 44 Minutes | 68 (9.1%) | 74 (13.0%) |
| 45 to 59 Minutes | 104 (13.9%) | 35 (6.1%) |
| 60 to 89 Minutes | 60 (8.0%) | 48 (8.4%) |
| 90 or more Minutes | 55 (7.3%) | 46 (8.1%) |
Time of Departure to Work by Sex in Penrose
The most frequent times of departure to work in Penrose are 6:00 AM to 6:29 AM (136, 18.2%) for males and 7:00 AM to 7:29 AM (138, 24.2%) for females.
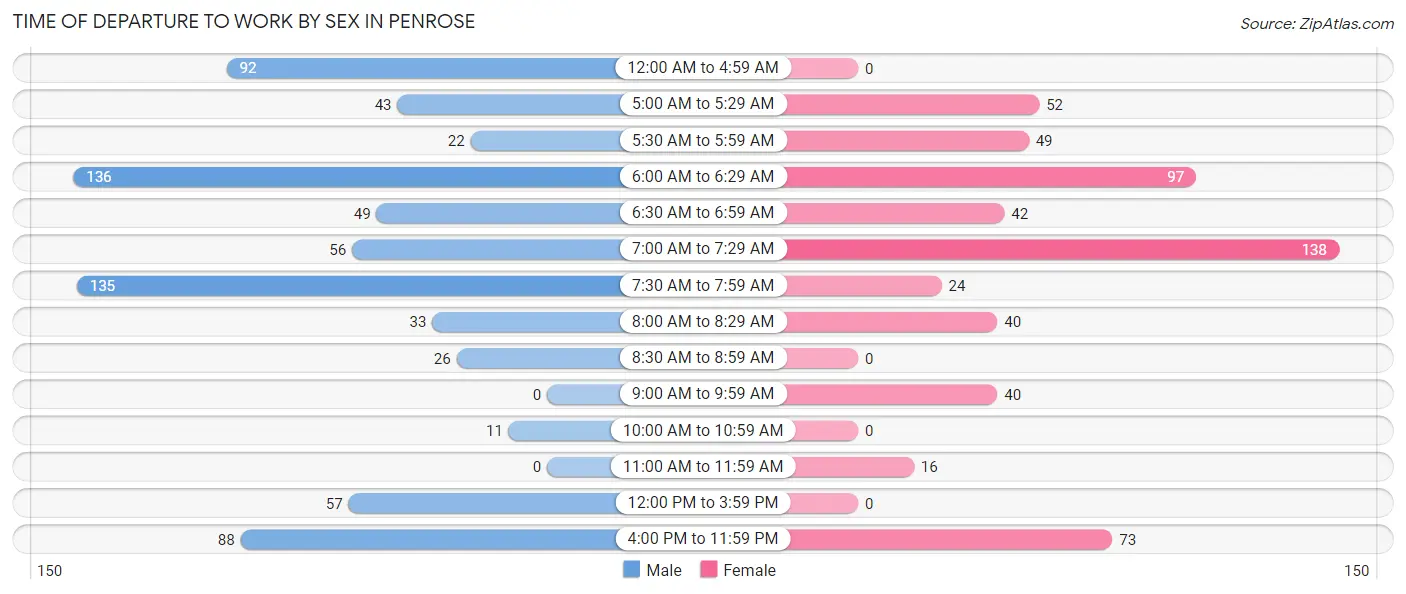
| Time of Departure | Male | Female |
| 12:00 AM to 4:59 AM | 92 (12.3%) | 0 (0.0%) |
| 5:00 AM to 5:29 AM | 43 (5.8%) | 52 (9.1%) |
| 5:30 AM to 5:59 AM | 22 (2.9%) | 49 (8.6%) |
| 6:00 AM to 6:29 AM | 136 (18.2%) | 97 (17.0%) |
| 6:30 AM to 6:59 AM | 49 (6.6%) | 42 (7.4%) |
| 7:00 AM to 7:29 AM | 56 (7.5%) | 138 (24.2%) |
| 7:30 AM to 7:59 AM | 135 (18.0%) | 24 (4.2%) |
| 8:00 AM to 8:29 AM | 33 (4.4%) | 40 (7.0%) |
| 8:30 AM to 8:59 AM | 26 (3.5%) | 0 (0.0%) |
| 9:00 AM to 9:59 AM | 0 (0.0%) | 40 (7.0%) |
| 10:00 AM to 10:59 AM | 11 (1.5%) | 0 (0.0%) |
| 11:00 AM to 11:59 AM | 0 (0.0%) | 16 (2.8%) |
| 12:00 PM to 3:59 PM | 57 (7.6%) | 0 (0.0%) |
| 4:00 PM to 11:59 PM | 88 (11.8%) | 73 (12.8%) |
| Total | 748 (100.0%) | 571 (100.0%) |
Housing Occupancy in Penrose
Occupancy by Ownership in Penrose
Of the total 1,436 dwellings in Penrose, owner-occupied units account for 1,198 (83.4%), while renter-occupied units make up 238 (16.6%).
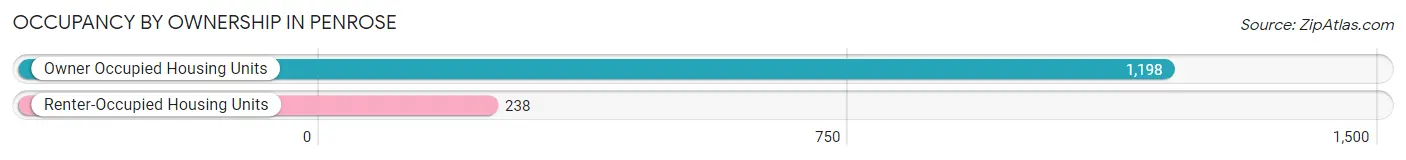
| Occupancy | # Housing Units | % Housing Units |
| Owner Occupied Housing Units | 1,198 | 83.4% |
| Renter-Occupied Housing Units | 238 | 16.6% |
| Total Occupied Housing Units | 1,436 | 100.0% |
Occupancy by Household Size in Penrose
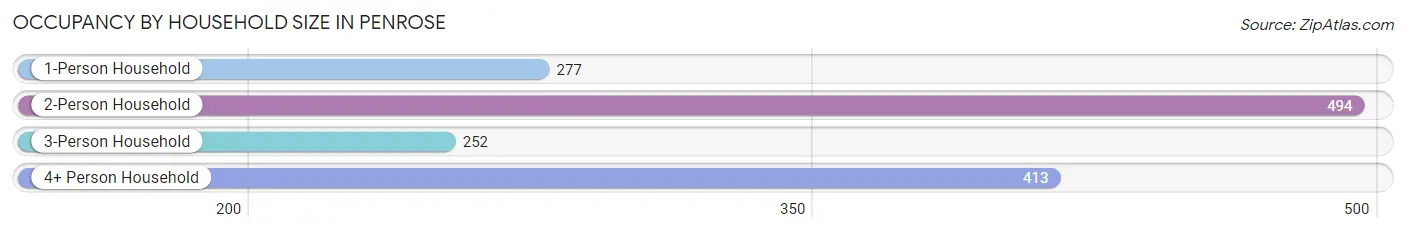
| Household Size | # Housing Units | % Housing Units |
| 1-Person Household | 277 | 19.3% |
| 2-Person Household | 494 | 34.4% |
| 3-Person Household | 252 | 17.5% |
| 4+ Person Household | 413 | 28.8% |
| Total Housing Units | 1,436 | 100.0% |
Occupancy by Ownership by Household Size in Penrose
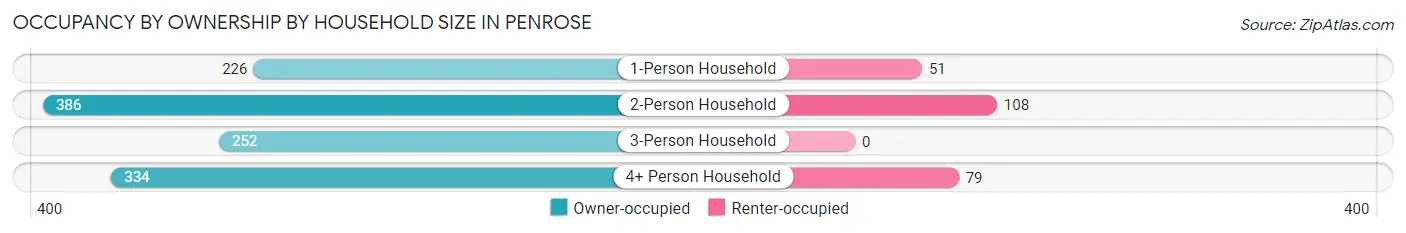
| Household Size | Owner-occupied | Renter-occupied |
| 1-Person Household | 226 (81.6%) | 51 (18.4%) |
| 2-Person Household | 386 (78.1%) | 108 (21.9%) |
| 3-Person Household | 252 (100.0%) | 0 (0.0%) |
| 4+ Person Household | 334 (80.9%) | 79 (19.1%) |
| Total Housing Units | 1,198 (83.4%) | 238 (16.6%) |
Occupancy by Educational Attainment in Penrose
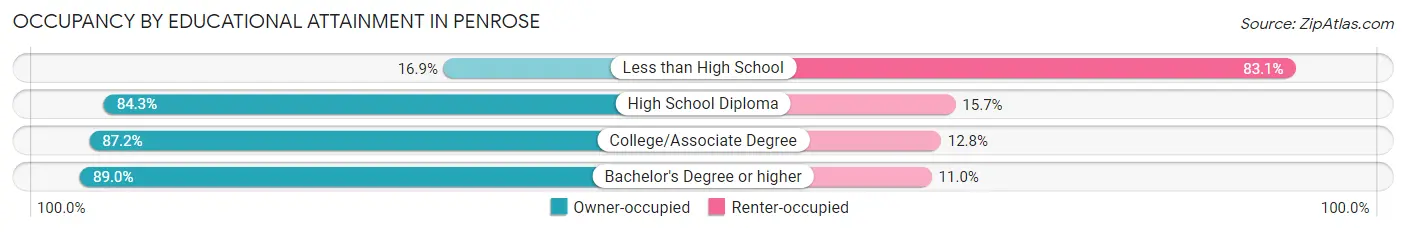
| Household Size | Owner-occupied | Renter-occupied |
| Less than High School | 12 (16.9%) | 59 (83.1%) |
| High School Diploma | 338 (84.3%) | 63 (15.7%) |
| College/Associate Degree | 476 (87.2%) | 70 (12.8%) |
| Bachelor's Degree or higher | 372 (89.0%) | 46 (11.0%) |
Occupancy by Age of Householder in Penrose
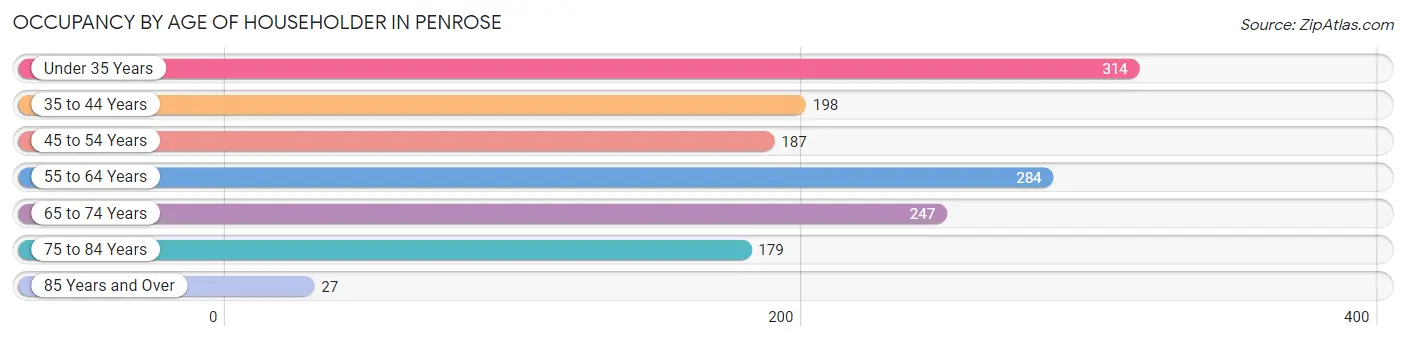
| Age Bracket | # Households | % Households |
| Under 35 Years | 314 | 21.9% |
| 35 to 44 Years | 198 | 13.8% |
| 45 to 54 Years | 187 | 13.0% |
| 55 to 64 Years | 284 | 19.8% |
| 65 to 74 Years | 247 | 17.2% |
| 75 to 84 Years | 179 | 12.5% |
| 85 Years and Over | 27 | 1.9% |
| Total | 1,436 | 100.0% |
Housing Finances in Penrose
Median Income by Occupancy in Penrose
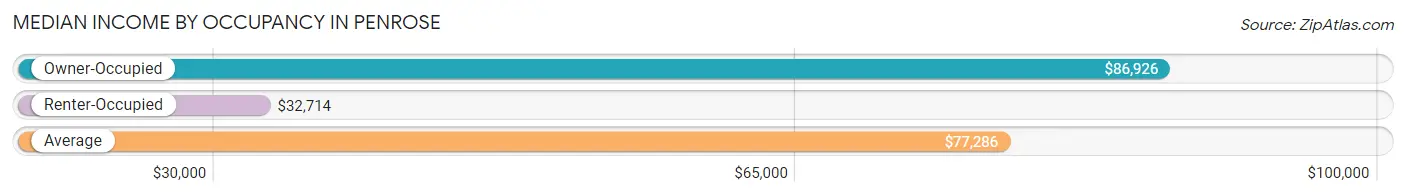
| Occupancy Type | # Households | Median Income |
| Owner-Occupied | 1,198 (83.4%) | $86,926 |
| Renter-Occupied | 238 (16.6%) | $32,714 |
| Average | 1,436 (100.0%) | $77,286 |
Occupancy by Householder Income Bracket in Penrose
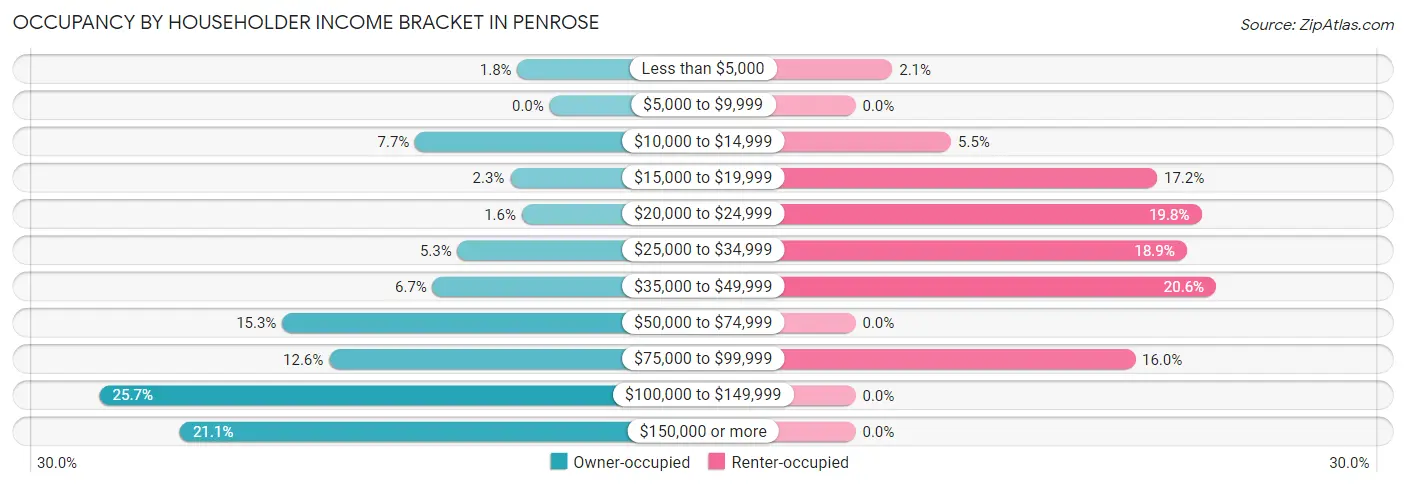
| Income Bracket | Owner-occupied | Renter-occupied |
| Less than $5,000 | 22 (1.8%) | 5 (2.1%) |
| $5,000 to $9,999 | 0 (0.0%) | 0 (0.0%) |
| $10,000 to $14,999 | 92 (7.7%) | 13 (5.5%) |
| $15,000 to $19,999 | 27 (2.2%) | 41 (17.2%) |
| $20,000 to $24,999 | 19 (1.6%) | 47 (19.8%) |
| $25,000 to $34,999 | 63 (5.3%) | 45 (18.9%) |
| $35,000 to $49,999 | 80 (6.7%) | 49 (20.6%) |
| $50,000 to $74,999 | 183 (15.3%) | 0 (0.0%) |
| $75,000 to $99,999 | 151 (12.6%) | 38 (16.0%) |
| $100,000 to $149,999 | 308 (25.7%) | 0 (0.0%) |
| $150,000 or more | 253 (21.1%) | 0 (0.0%) |
| Total | 1,198 (100.0%) | 238 (100.0%) |
Monthly Housing Cost Tiers in Penrose
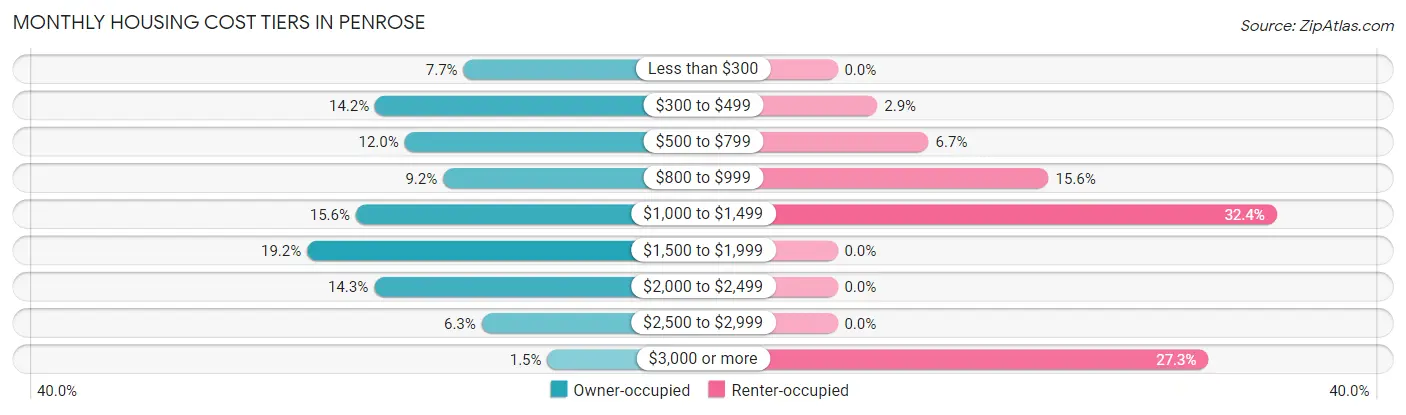
| Monthly Cost | Owner-occupied | Renter-occupied |
| Less than $300 | 92 (7.7%) | 0 (0.0%) |
| $300 to $499 | 170 (14.2%) | 7 (2.9%) |
| $500 to $799 | 144 (12.0%) | 16 (6.7%) |
| $800 to $999 | 110 (9.2%) | 37 (15.5%) |
| $1,000 to $1,499 | 187 (15.6%) | 77 (32.4%) |
| $1,500 to $1,999 | 230 (19.2%) | 0 (0.0%) |
| $2,000 to $2,499 | 171 (14.3%) | 0 (0.0%) |
| $2,500 to $2,999 | 76 (6.3%) | 0 (0.0%) |
| $3,000 or more | 18 (1.5%) | 65 (27.3%) |
| Total | 1,198 (100.0%) | 238 (100.0%) |
Physical Housing Characteristics in Penrose
Housing Structures in Penrose
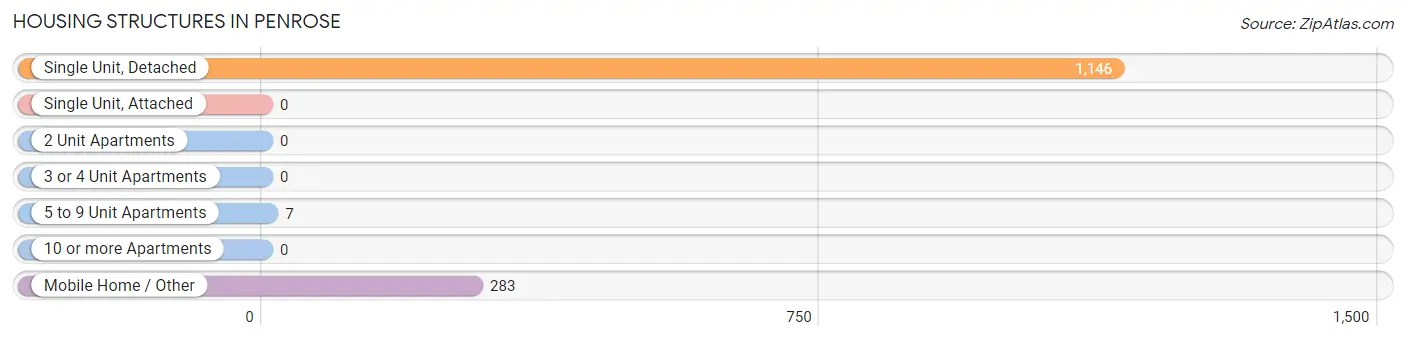
| Structure Type | # Housing Units | % Housing Units |
| Single Unit, Detached | 1,146 | 79.8% |
| Single Unit, Attached | 0 | 0.0% |
| 2 Unit Apartments | 0 | 0.0% |
| 3 or 4 Unit Apartments | 0 | 0.0% |
| 5 to 9 Unit Apartments | 7 | 0.5% |
| 10 or more Apartments | 0 | 0.0% |
| Mobile Home / Other | 283 | 19.7% |
| Total | 1,436 | 100.0% |
Housing Structures by Occupancy in Penrose
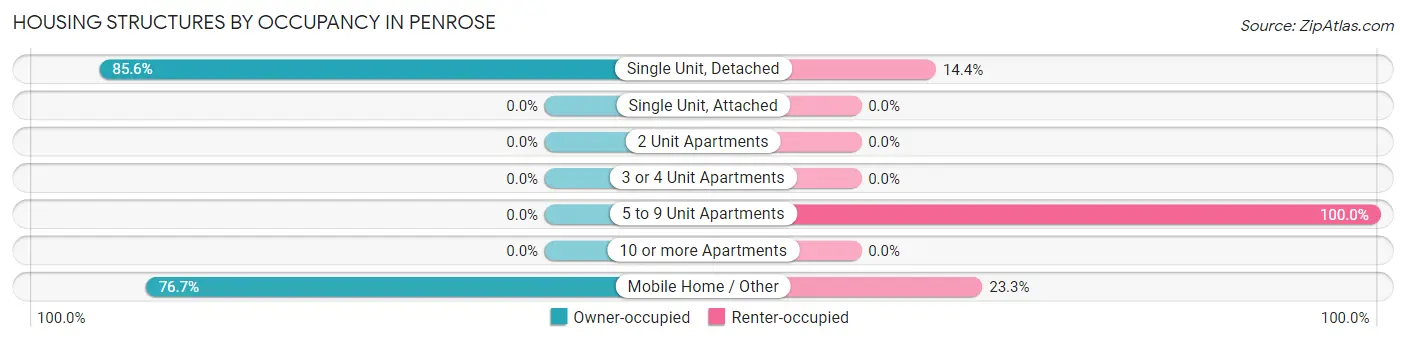
| Structure Type | Owner-occupied | Renter-occupied |
| Single Unit, Detached | 981 (85.6%) | 165 (14.4%) |
| Single Unit, Attached | 0 (0.0%) | 0 (0.0%) |
| 2 Unit Apartments | 0 (0.0%) | 0 (0.0%) |
| 3 or 4 Unit Apartments | 0 (0.0%) | 0 (0.0%) |
| 5 to 9 Unit Apartments | 0 (0.0%) | 7 (100.0%) |
| 10 or more Apartments | 0 (0.0%) | 0 (0.0%) |
| Mobile Home / Other | 217 (76.7%) | 66 (23.3%) |
| Total | 1,198 (83.4%) | 238 (16.6%) |
Housing Structures by Number of Rooms in Penrose
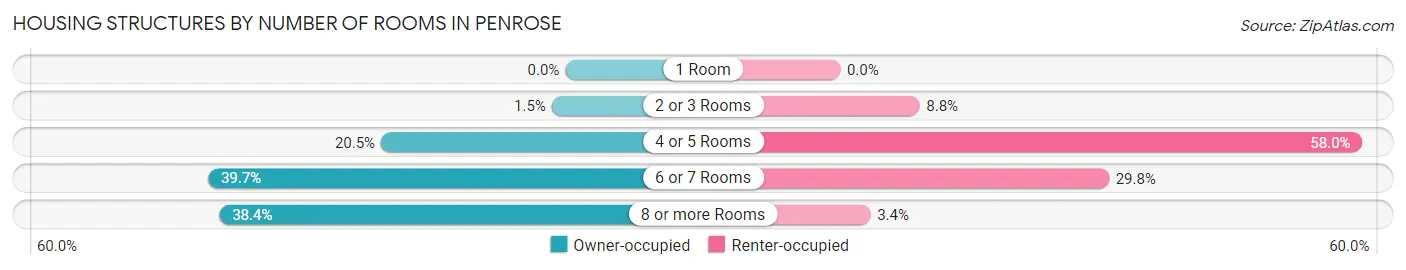
| Number of Rooms | Owner-occupied | Renter-occupied |
| 1 Room | 0 (0.0%) | 0 (0.0%) |
| 2 or 3 Rooms | 18 (1.5%) | 21 (8.8%) |
| 4 or 5 Rooms | 245 (20.4%) | 138 (58.0%) |
| 6 or 7 Rooms | 475 (39.7%) | 71 (29.8%) |
| 8 or more Rooms | 460 (38.4%) | 8 (3.4%) |
| Total | 1,198 (100.0%) | 238 (100.0%) |
Housing Structure by Heating Type in Penrose
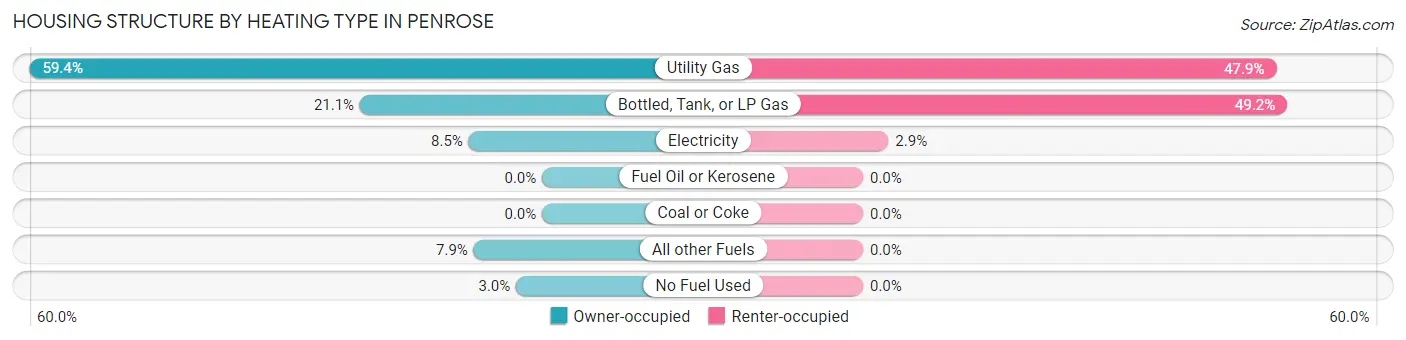
| Heating Type | Owner-occupied | Renter-occupied |
| Utility Gas | 712 (59.4%) | 114 (47.9%) |
| Bottled, Tank, or LP Gas | 253 (21.1%) | 117 (49.2%) |
| Electricity | 102 (8.5%) | 7 (2.9%) |
| Fuel Oil or Kerosene | 0 (0.0%) | 0 (0.0%) |
| Coal or Coke | 0 (0.0%) | 0 (0.0%) |
| All other Fuels | 95 (7.9%) | 0 (0.0%) |
| No Fuel Used | 36 (3.0%) | 0 (0.0%) |
| Total | 1,198 (100.0%) | 238 (100.0%) |
Household Vehicle Usage in Penrose
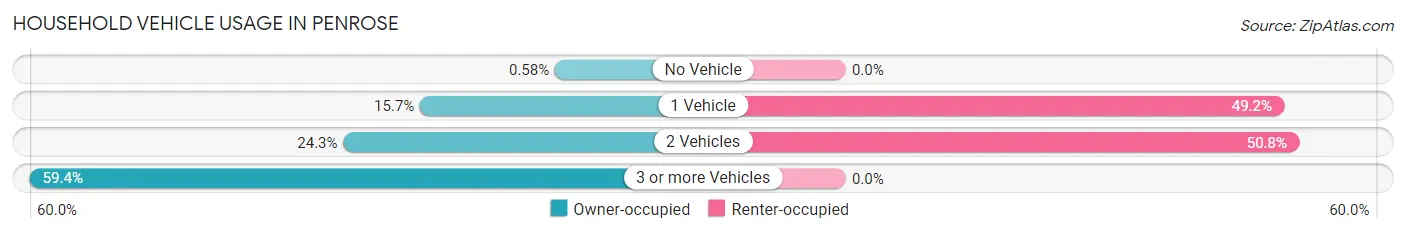
| Vehicles per Household | Owner-occupied | Renter-occupied |
| No Vehicle | 7 (0.6%) | 0 (0.0%) |
| 1 Vehicle | 188 (15.7%) | 117 (49.2%) |
| 2 Vehicles | 291 (24.3%) | 121 (50.8%) |
| 3 or more Vehicles | 712 (59.4%) | 0 (0.0%) |
| Total | 1,198 (100.0%) | 238 (100.0%) |
Real Estate & Mortgages in Penrose
Real Estate and Mortgage Overview in Penrose
| Characteristic | Without Mortgage | With Mortgage |
| Housing Units | 432 | 766 |
| Median Property Value | $253,800 | $316,400 |
| Median Household Income | $83,500 | $225 |
| Monthly Housing Costs | $454 | $18 |
| Real Estate Taxes | $987 | $0 |
Property Value by Mortgage Status in Penrose
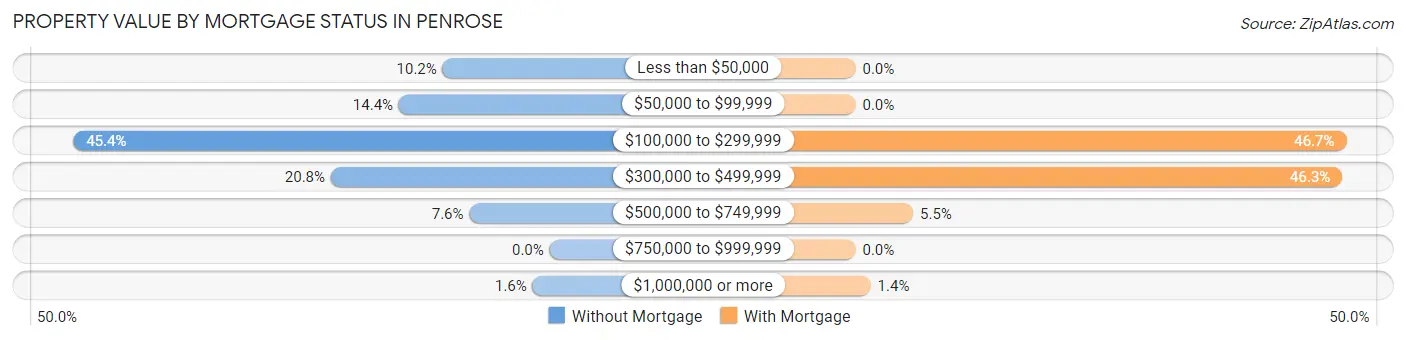
| Property Value | Without Mortgage | With Mortgage |
| Less than $50,000 | 44 (10.2%) | 0 (0.0%) |
| $50,000 to $99,999 | 62 (14.3%) | 0 (0.0%) |
| $100,000 to $299,999 | 196 (45.4%) | 358 (46.7%) |
| $300,000 to $499,999 | 90 (20.8%) | 355 (46.3%) |
| $500,000 to $749,999 | 33 (7.6%) | 42 (5.5%) |
| $750,000 to $999,999 | 0 (0.0%) | 0 (0.0%) |
| $1,000,000 or more | 7 (1.6%) | 11 (1.4%) |
| Total | 432 (100.0%) | 766 (100.0%) |
Household Income by Mortgage Status in Penrose
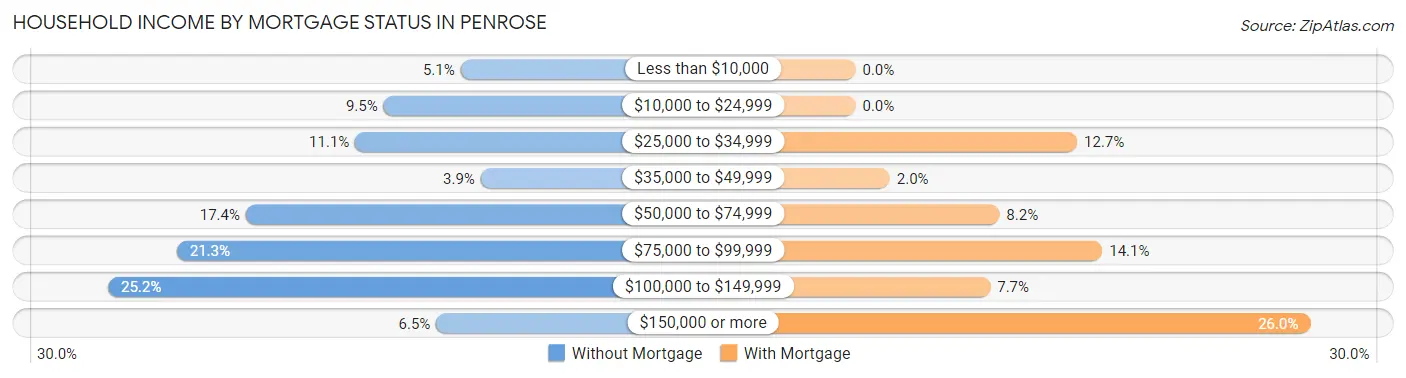
| Household Income | Without Mortgage | With Mortgage |
| Less than $10,000 | 22 (5.1%) | 0 (0.0%) |
| $10,000 to $24,999 | 41 (9.5%) | 0 (0.0%) |
| $25,000 to $34,999 | 48 (11.1%) | 97 (12.7%) |
| $35,000 to $49,999 | 17 (3.9%) | 15 (2.0%) |
| $50,000 to $74,999 | 75 (17.4%) | 63 (8.2%) |
| $75,000 to $99,999 | 92 (21.3%) | 108 (14.1%) |
| $100,000 to $149,999 | 109 (25.2%) | 59 (7.7%) |
| $150,000 or more | 28 (6.5%) | 199 (26.0%) |
| Total | 432 (100.0%) | 766 (100.0%) |
Property Value to Household Income Ratio in Penrose
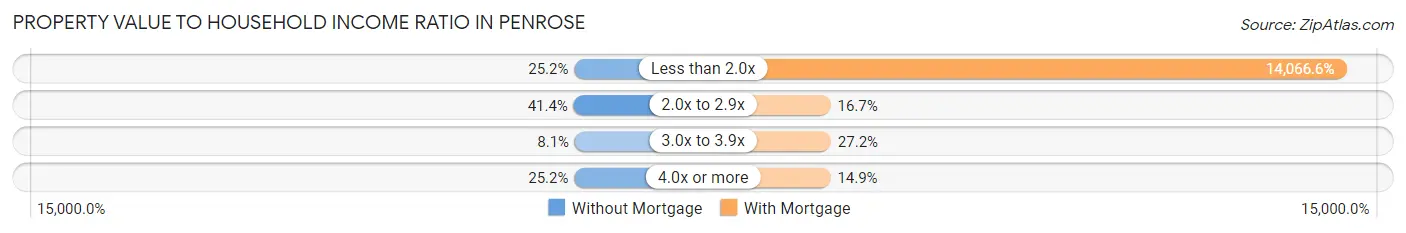
| Value-to-Income Ratio | Without Mortgage | With Mortgage |
| Less than 2.0x | 109 (25.2%) | 107,750 (14,066.6%) |
| 2.0x to 2.9x | 179 (41.4%) | 128 (16.7%) |
| 3.0x to 3.9x | 35 (8.1%) | 208 (27.2%) |
| 4.0x or more | 109 (25.2%) | 114 (14.9%) |
| Total | 432 (100.0%) | 766 (100.0%) |
Real Estate Taxes by Mortgage Status in Penrose
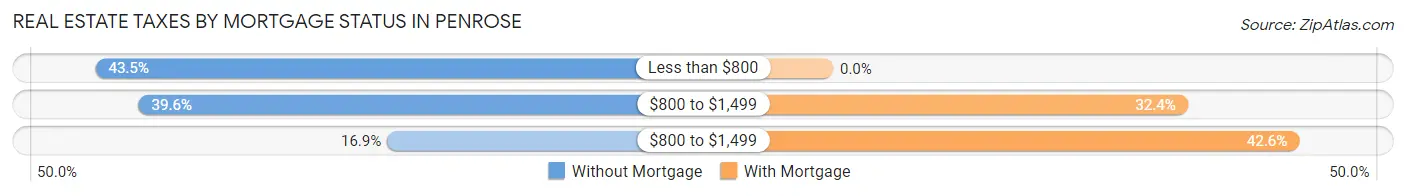
| Property Taxes | Without Mortgage | With Mortgage |
| Less than $800 | 188 (43.5%) | 0 (0.0%) |
| $800 to $1,499 | 171 (39.6%) | 248 (32.4%) |
| $800 to $1,499 | 73 (16.9%) | 326 (42.6%) |
| Total | 432 (100.0%) | 766 (100.0%) |
Health & Disability in Penrose
Health Insurance Coverage by Age in Penrose
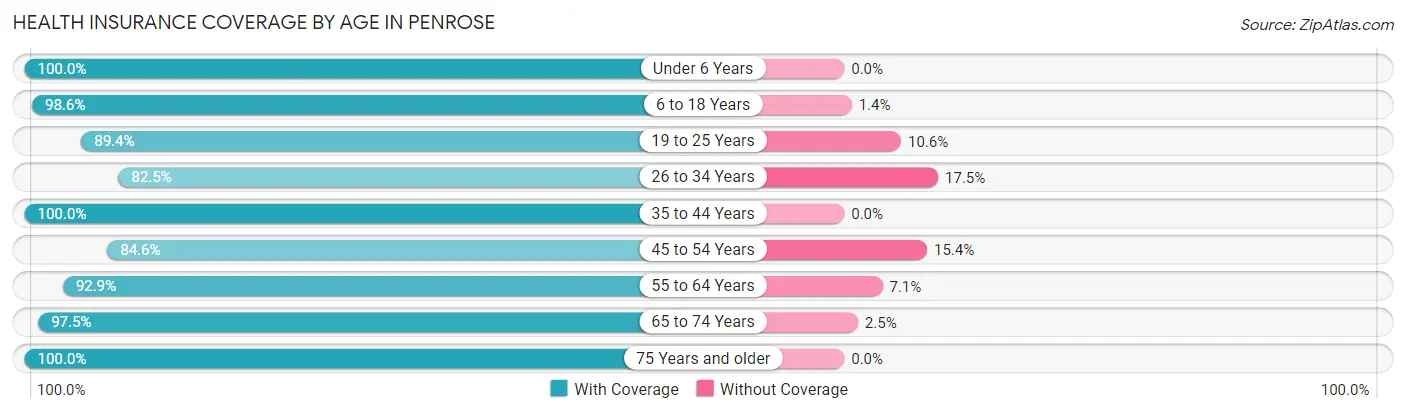
| Age Bracket | With Coverage | Without Coverage |
| Under 6 Years | 302 (100.0%) | 0 (0.0%) |
| 6 to 18 Years | 712 (98.6%) | 10 (1.4%) |
| 19 to 25 Years | 186 (89.4%) | 22 (10.6%) |
| 26 to 34 Years | 330 (82.5%) | 70 (17.5%) |
| 35 to 44 Years | 519 (100.0%) | 0 (0.0%) |
| 45 to 54 Years | 411 (84.6%) | 75 (15.4%) |
| 55 to 64 Years | 496 (92.9%) | 38 (7.1%) |
| 65 to 74 Years | 383 (97.5%) | 10 (2.5%) |
| 75 Years and older | 298 (100.0%) | 0 (0.0%) |
| Total | 3,637 (94.2%) | 225 (5.8%) |
Health Insurance Coverage by Citizenship Status in Penrose

| Citizenship Status | With Coverage | Without Coverage |
| Native Born | 302 (100.0%) | 0 (0.0%) |
| Foreign Born, Citizen | 712 (98.6%) | 10 (1.4%) |
| Foreign Born, not a Citizen | 186 (89.4%) | 22 (10.6%) |
Health Insurance Coverage by Household Income in Penrose
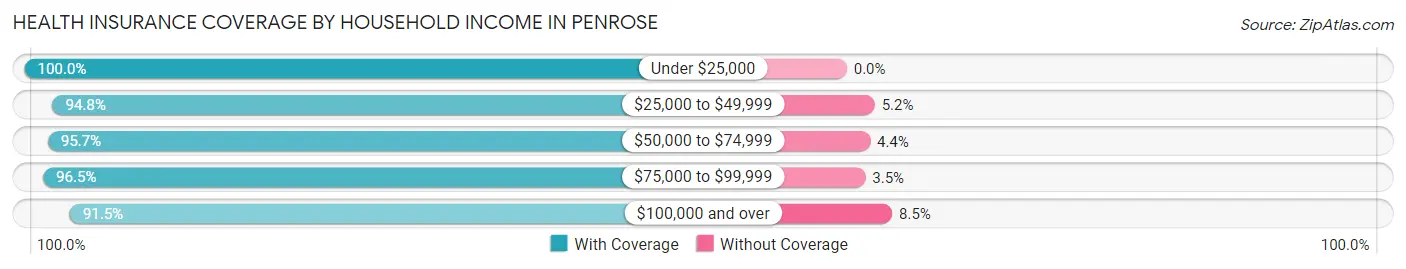
| Household Income | With Coverage | Without Coverage |
| Under $25,000 | 486 (100.0%) | 0 (0.0%) |
| $25,000 to $49,999 | 452 (94.8%) | 25 (5.2%) |
| $50,000 to $74,999 | 506 (95.7%) | 23 (4.3%) |
| $75,000 to $99,999 | 444 (96.5%) | 16 (3.5%) |
| $100,000 and over | 1,736 (91.5%) | 161 (8.5%) |
Public vs Private Health Insurance Coverage by Age in Penrose
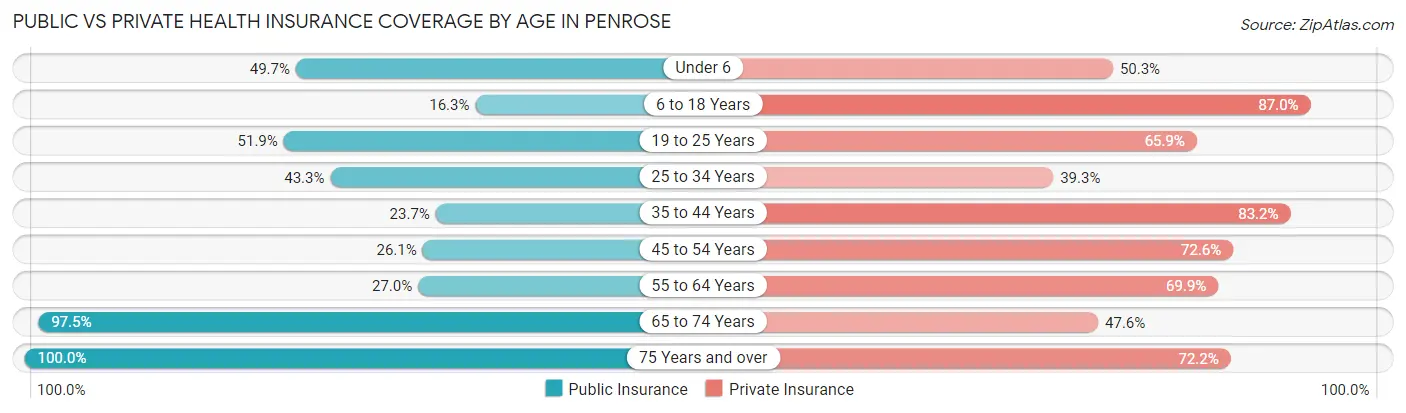
| Age Bracket | Public Insurance | Private Insurance |
| Under 6 | 150 (49.7%) | 152 (50.3%) |
| 6 to 18 Years | 118 (16.3%) | 628 (87.0%) |
| 19 to 25 Years | 108 (51.9%) | 137 (65.9%) |
| 25 to 34 Years | 173 (43.2%) | 157 (39.3%) |
| 35 to 44 Years | 123 (23.7%) | 432 (83.2%) |
| 45 to 54 Years | 127 (26.1%) | 353 (72.6%) |
| 55 to 64 Years | 144 (27.0%) | 373 (69.9%) |
| 65 to 74 Years | 383 (97.5%) | 187 (47.6%) |
| 75 Years and over | 298 (100.0%) | 215 (72.2%) |
| Total | 1,624 (42.0%) | 2,634 (68.2%) |
Disability Status by Sex by Age in Penrose
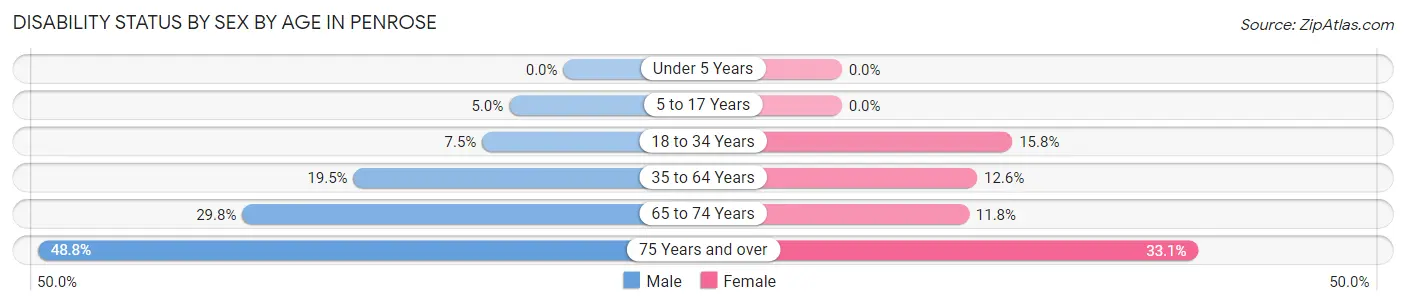
| Age Bracket | Male | Female |
| Under 5 Years | 0 (0.0%) | 0 (0.0%) |
| 5 to 17 Years | 19 (5.0%) | 0 (0.0%) |
| 18 to 34 Years | 22 (7.5%) | 50 (15.8%) |
| 35 to 64 Years | 143 (19.5%) | 101 (12.6%) |
| 65 to 74 Years | 59 (29.8%) | 23 (11.8%) |
| 75 Years and over | 79 (48.8%) | 45 (33.1%) |
Disability Class by Sex by Age in Penrose
Disability Class: Hearing Difficulty
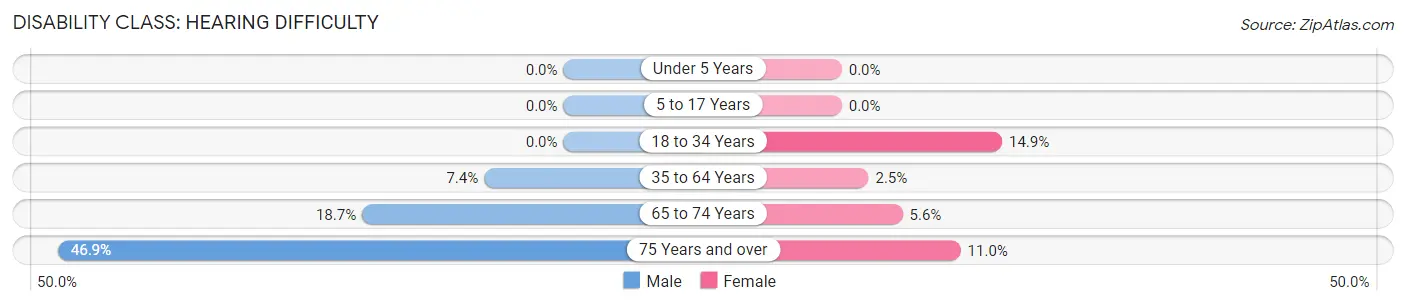
| Age Bracket | Male | Female |
| Under 5 Years | 0 (0.0%) | 0 (0.0%) |
| 5 to 17 Years | 0 (0.0%) | 0 (0.0%) |
| 18 to 34 Years | 0 (0.0%) | 47 (14.9%) |
| 35 to 64 Years | 54 (7.4%) | 20 (2.5%) |
| 65 to 74 Years | 37 (18.7%) | 11 (5.6%) |
| 75 Years and over | 76 (46.9%) | 15 (11.0%) |
Disability Class: Vision Difficulty
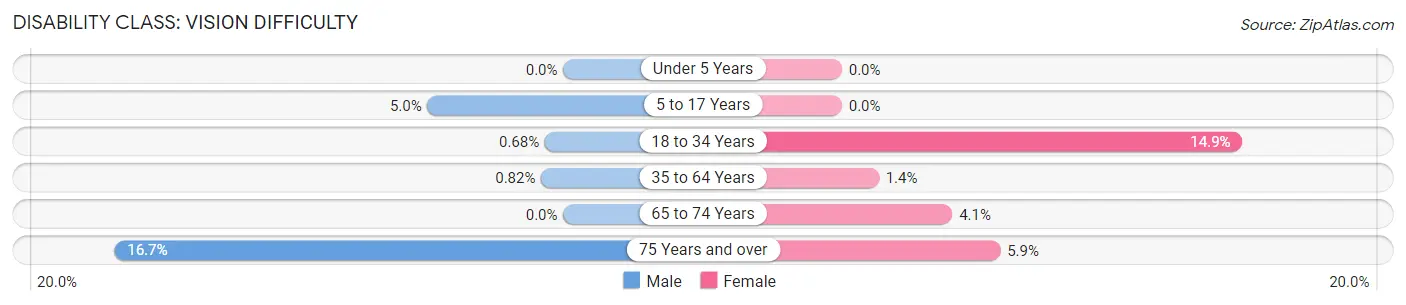
| Age Bracket | Male | Female |
| Under 5 Years | 0 (0.0%) | 0 (0.0%) |
| 5 to 17 Years | 19 (5.0%) | 0 (0.0%) |
| 18 to 34 Years | 2 (0.7%) | 47 (14.9%) |
| 35 to 64 Years | 6 (0.8%) | 11 (1.4%) |
| 65 to 74 Years | 0 (0.0%) | 8 (4.1%) |
| 75 Years and over | 27 (16.7%) | 8 (5.9%) |
Disability Class: Cognitive Difficulty
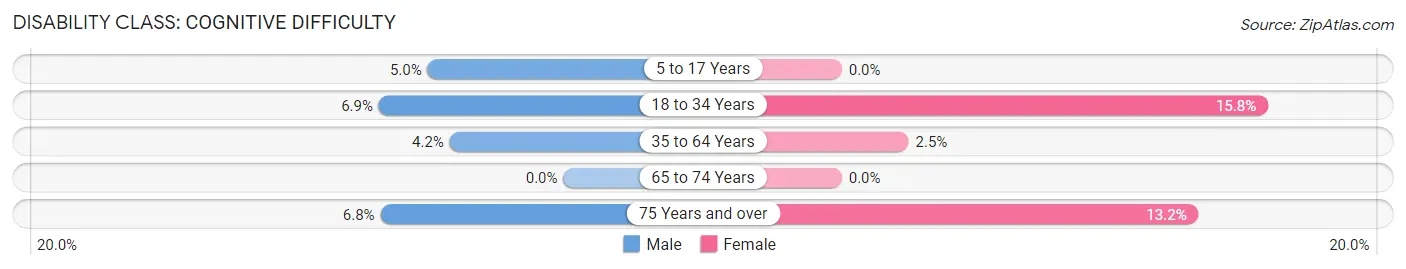
| Age Bracket | Male | Female |
| 5 to 17 Years | 19 (5.0%) | 0 (0.0%) |
| 18 to 34 Years | 20 (6.9%) | 50 (15.8%) |
| 35 to 64 Years | 31 (4.2%) | 20 (2.5%) |
| 65 to 74 Years | 0 (0.0%) | 0 (0.0%) |
| 75 Years and over | 11 (6.8%) | 18 (13.2%) |
Disability Class: Ambulatory Difficulty
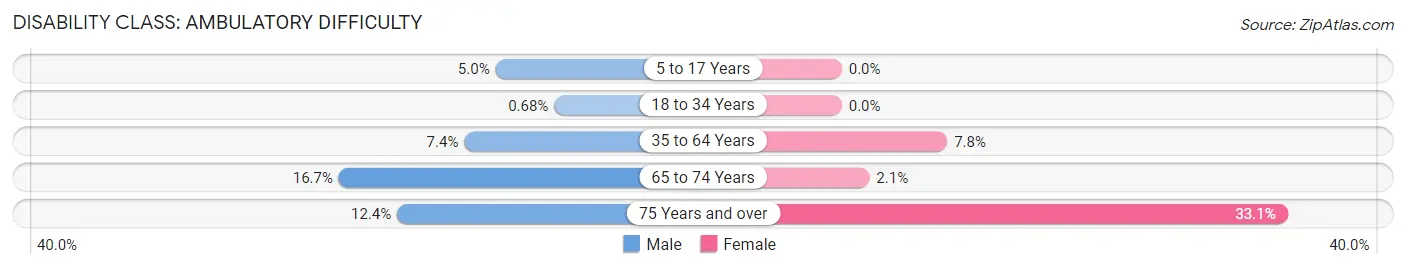
| Age Bracket | Male | Female |
| 5 to 17 Years | 19 (5.0%) | 0 (0.0%) |
| 18 to 34 Years | 2 (0.7%) | 0 (0.0%) |
| 35 to 64 Years | 54 (7.4%) | 63 (7.8%) |
| 65 to 74 Years | 33 (16.7%) | 4 (2.1%) |
| 75 Years and over | 20 (12.3%) | 45 (33.1%) |
Disability Class: Self-Care Difficulty
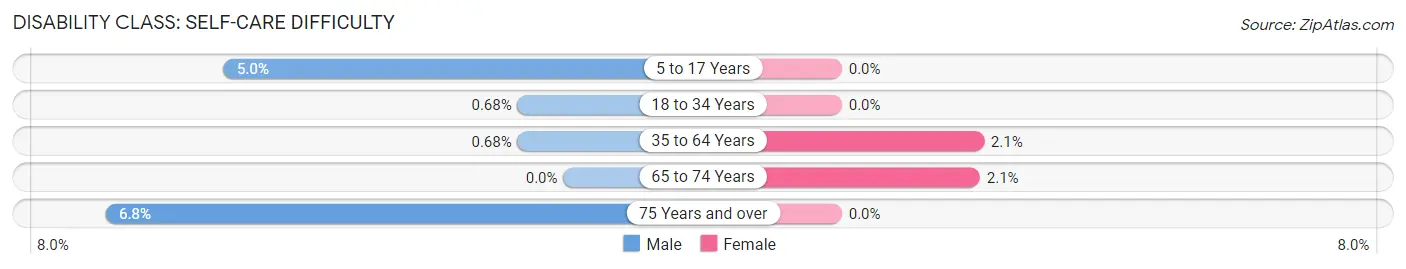
| Age Bracket | Male | Female |
| 5 to 17 Years | 19 (5.0%) | 0 (0.0%) |
| 18 to 34 Years | 2 (0.7%) | 0 (0.0%) |
| 35 to 64 Years | 5 (0.7%) | 17 (2.1%) |
| 65 to 74 Years | 0 (0.0%) | 4 (2.1%) |
| 75 Years and over | 11 (6.8%) | 0 (0.0%) |
Technology Access in Penrose
Computing Device Access in Penrose
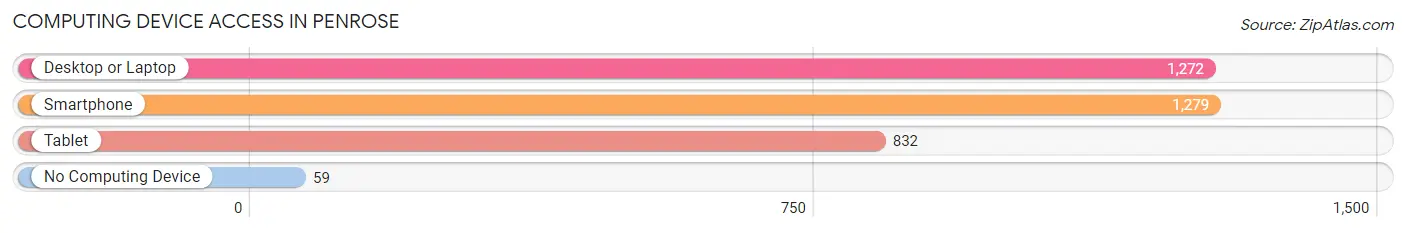
| Device Type | # Households | % Households |
| Desktop or Laptop | 1,272 | 88.6% |
| Smartphone | 1,279 | 89.1% |
| Tablet | 832 | 57.9% |
| No Computing Device | 59 | 4.1% |
| Total | 1,436 | 100.0% |
Internet Access in Penrose
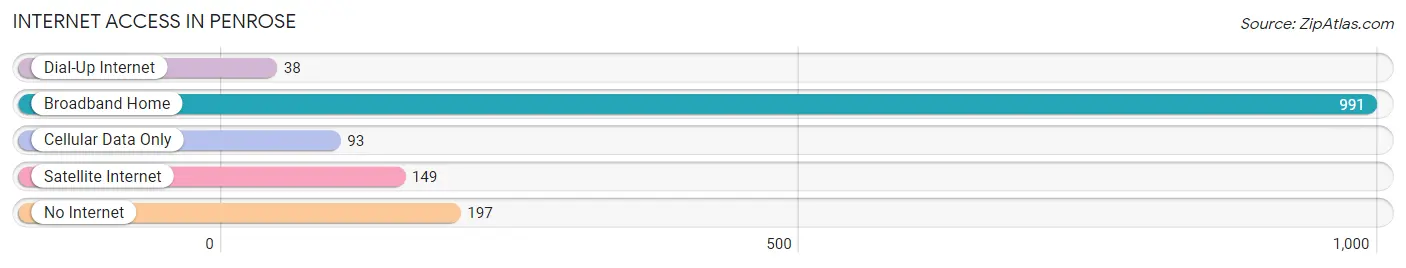
| Internet Type | # Households | % Households |
| Dial-Up Internet | 38 | 2.6% |
| Broadband Home | 991 | 69.0% |
| Cellular Data Only | 93 | 6.5% |
| Satellite Internet | 149 | 10.4% |
| No Internet | 197 | 13.7% |
| Total | 1,436 | 100.0% |
Penrose Summary
Introduction
Located in the heart of the Rocky Mountains, the small town of Penrose, Colorado is a picturesque mountain community with a rich history and a bright future. With a population of just over 1,000 people, Penrose is a small but vibrant community that is home to a variety of businesses, organizations, and attractions. From its beginnings as a mining town to its current status as a popular tourist destination, Penrose has a unique history and culture that make it a great place to live and visit.
History
Penrose, Colorado was founded in 1881 by a group of miners who were looking for gold and silver in the area. The town was named after the Penrose family, who owned the land where the town was built. The town quickly grew and by the early 1900s, it had become a bustling mining town with a population of over 1,000 people.
The town was home to several mines, including the Penrose Mine, which was the largest and most successful of the mines in the area. The mine produced gold, silver, and other minerals, and it was the main source of income for the town.
In the early 1900s, the town began to decline as the mines closed and the population decreased. However, in the late 1970s, the town began to experience a resurgence as it became a popular tourist destination. Today, Penrose is a thriving mountain community with a variety of businesses, organizations, and attractions.
Geography
Penrose is located in Fremont County, Colorado, in the heart of the Rocky Mountains. The town is situated at an elevation of 7,000 feet, and it is surrounded by mountains and forests. The town is located near the Arkansas River, which provides a variety of recreational activities, including fishing, rafting, and kayaking.
The town is also close to several ski resorts, including Monarch Mountain and Ski Cooper. The town is also home to several parks, including Penrose Park, which is a popular spot for camping, hiking, and other outdoor activities.
Economy
The economy of Penrose is largely based on tourism. The town is home to several businesses, including restaurants, hotels, and shops. The town is also home to several attractions, including the Penrose Mine, which is a popular tourist destination.
The town is also home to several organizations, including the Penrose Historical Society, which is dedicated to preserving the town’s history and culture. The town is also home to several events, including the Penrose Days Festival, which is held every summer.
Demographics
As of the 2010 census, the population of Penrose was 1,039. The town is predominantly white, with 87.3% of the population identifying as white. The town is also home to a small Hispanic population, with 8.3% of the population identifying as Hispanic or Latino. The median household income in Penrose is $41,250, and the median home value is $179,000.
Conclusion
Penrose, Colorado is a small but vibrant mountain community with a rich history and a bright future. From its beginnings as a mining town to its current status as a popular tourist destination, Penrose has a unique history and culture that make it a great place to live and visit. With its beautiful scenery, variety of businesses and attractions, and friendly people, Penrose is a great place to call home.
Common Questions
What is Per Capita Income in Penrose?
Per Capita income in Penrose is $48,683.
What is the Median Family Income in Penrose?
Median Family Income in Penrose is $84,740.
What is the Median Household income in Penrose?
Median Household Income in Penrose is $77,286.
What is Income or Wage Gap in Penrose?
Income or Wage Gap in Penrose is 27.2%.
Women in Penrose earn 72.8 cents for every dollar earned by a man.
What is Inequality or Gini Index in Penrose?
Inequality or Gini Index in Penrose is 0.54.
What is the Total Population of Penrose?
Total Population of Penrose is 3,900.
What is the Total Male Population of Penrose?
Total Male Population of Penrose is 1,910.
What is the Total Female Population of Penrose?
Total Female Population of Penrose is 1,990.
What is the Ratio of Males per 100 Females in Penrose?
There are 95.98 Males per 100 Females in Penrose.
What is the Ratio of Females per 100 Males in Penrose?
There are 104.19 Females per 100 Males in Penrose.
What is the Median Population Age in Penrose?
Median Population Age in Penrose is 41.2 Years.
What is the Average Family Size in Penrose
Average Family Size in Penrose is 3.1 People.
What is the Average Household Size in Penrose
Average Household Size in Penrose is 2.7 People.
How Large is the Labor Force in Penrose?
There are 1,633 People in the Labor Forcein in Penrose.
What is the Percentage of People in the Labor Force in Penrose?
56.4% of People are in the Labor Force in Penrose.
What is the Unemployment Rate in Penrose?
Unemployment Rate in Penrose is 8.5%.