Palmer Lake, CO Map & Demographics
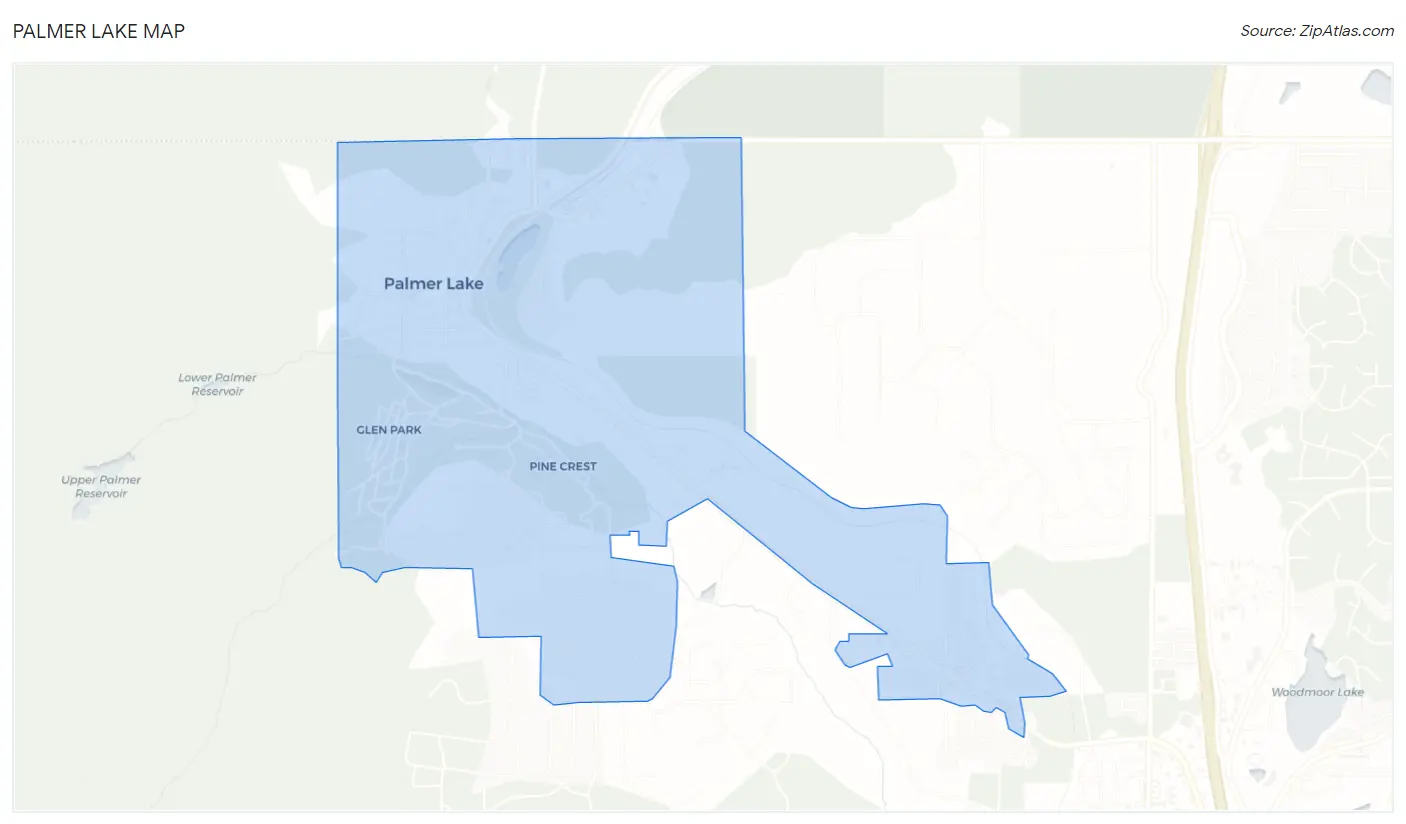
Palmer Lake Map
Palmer Lake Overview
$48,290
PER CAPITA INCOME
$113,229
AVG FAMILY INCOME
$104,712
AVG HOUSEHOLD INCOME
20.4%
WAGE / INCOME GAP [ % ]
79.6¢/ $1
WAGE / INCOME GAP [ $ ]
0.34
INEQUALITY / GINI INDEX
2,642
TOTAL POPULATION
1,349
MALE POPULATION
1,293
FEMALE POPULATION
104.33
MALES / 100 FEMALES
95.85
FEMALES / 100 MALES
54.5
MEDIAN AGE
2.7
AVG FAMILY SIZE
2.4
AVG HOUSEHOLD SIZE
1,631
LABOR FORCE [ PEOPLE ]
68.0%
PERCENT IN LABOR FORCE
7.0%
UNEMPLOYMENT RATE
Palmer Lake Zip Codes
Palmer Lake Area Codes
Income in Palmer Lake
Income Overview in Palmer Lake
Per Capita Income in Palmer Lake is $48,290, while median incomes of families and households are $113,229 and $104,712 respectively.
| Characteristic | Number | Measure |
| Per Capita Income | 2,642 | $48,290 |
| Median Family Income | 819 | $113,229 |
| Mean Family Income | 819 | $128,909 |
| Median Household Income | 1,107 | $104,712 |
| Mean Household Income | 1,107 | $115,397 |
| Income Deficit | 819 | $0 |
| Wage / Income Gap (%) | 2,642 | 20.41% |
| Wage / Income Gap ($) | 2,642 | 79.59¢ per $1 |
| Gini / Inequality Index | 2,642 | 0.34 |
Earnings by Sex in Palmer Lake
Average Earnings in Palmer Lake are $46,373, $53,535 for men and $42,609 for women, a difference of 20.4%.
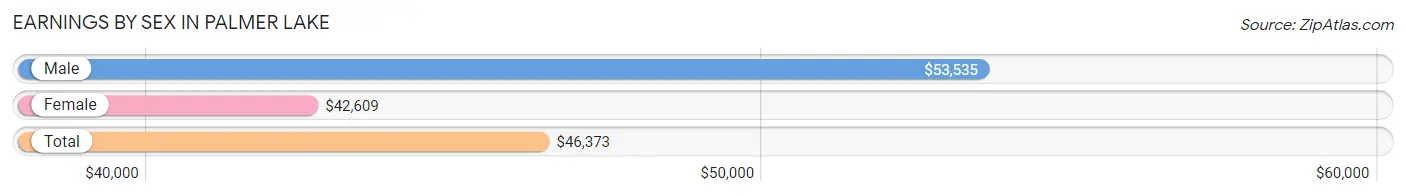
| Sex | Number | Average Earnings |
| Male | 915 (52.0%) | $53,535 |
| Female | 846 (48.0%) | $42,609 |
| Total | 1,761 (100.0%) | $46,373 |
Earnings by Sex by Income Bracket in Palmer Lake
The most common earnings brackets in Palmer Lake are $75,000 to $99,999 for men (244 | 26.7%) and $45,000 to $49,999 for women (137 | 16.2%).
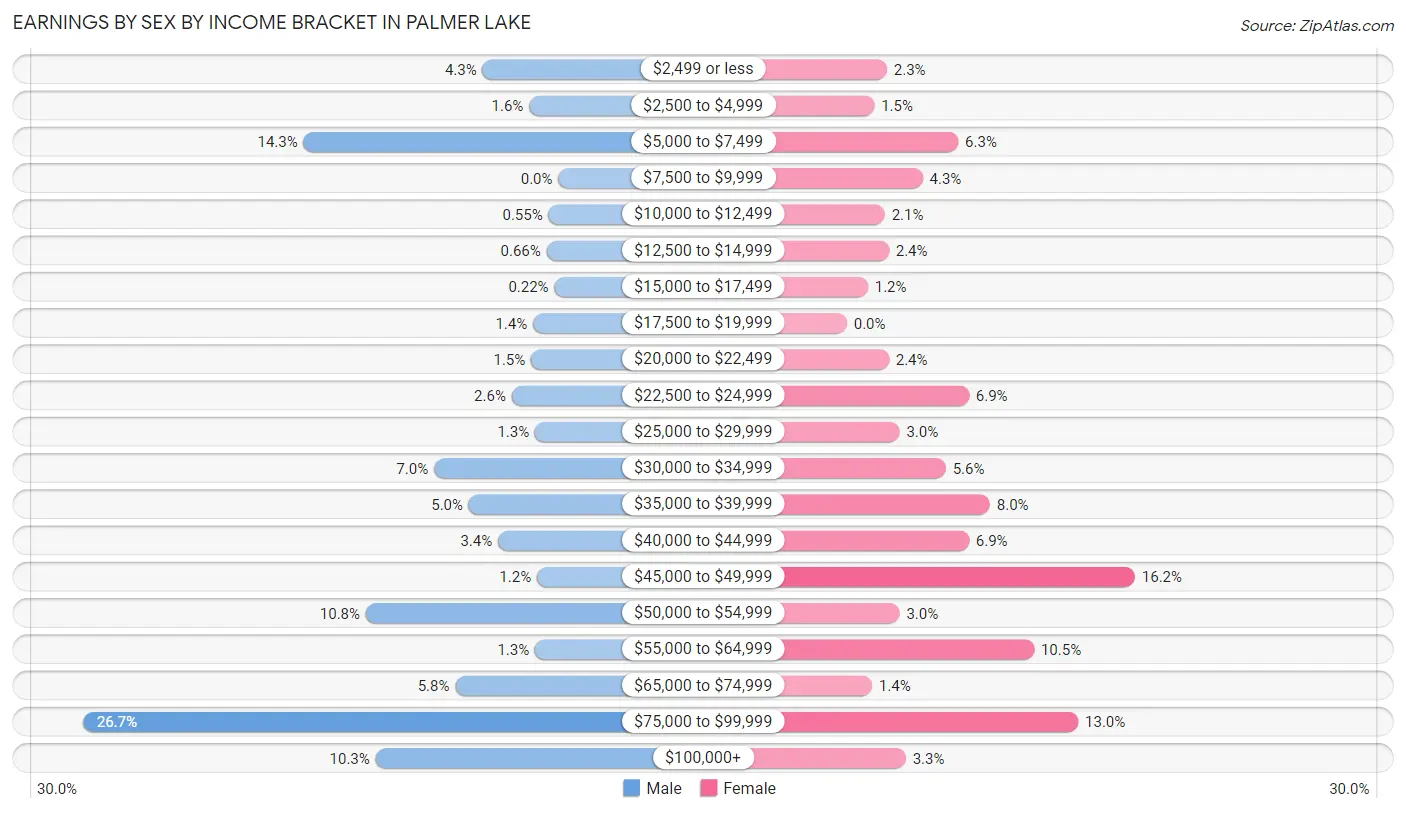
| Income | Male | Female |
| $2,499 or less | 39 (4.3%) | 19 (2.2%) |
| $2,500 to $4,999 | 15 (1.6%) | 13 (1.5%) |
| $5,000 to $7,499 | 131 (14.3%) | 53 (6.3%) |
| $7,500 to $9,999 | 0 (0.0%) | 36 (4.3%) |
| $10,000 to $12,499 | 5 (0.5%) | 18 (2.1%) |
| $12,500 to $14,999 | 6 (0.7%) | 20 (2.4%) |
| $15,000 to $17,499 | 2 (0.2%) | 10 (1.2%) |
| $17,500 to $19,999 | 13 (1.4%) | 0 (0.0%) |
| $20,000 to $22,499 | 14 (1.5%) | 20 (2.4%) |
| $22,500 to $24,999 | 24 (2.6%) | 58 (6.9%) |
| $25,000 to $29,999 | 12 (1.3%) | 25 (3.0%) |
| $30,000 to $34,999 | 64 (7.0%) | 47 (5.6%) |
| $35,000 to $39,999 | 46 (5.0%) | 68 (8.0%) |
| $40,000 to $44,999 | 31 (3.4%) | 58 (6.9%) |
| $45,000 to $49,999 | 11 (1.2%) | 137 (16.2%) |
| $50,000 to $54,999 | 99 (10.8%) | 25 (3.0%) |
| $55,000 to $64,999 | 12 (1.3%) | 89 (10.5%) |
| $65,000 to $74,999 | 53 (5.8%) | 12 (1.4%) |
| $75,000 to $99,999 | 244 (26.7%) | 110 (13.0%) |
| $100,000+ | 94 (10.3%) | 28 (3.3%) |
| Total | 915 (100.0%) | 846 (100.0%) |
Earnings by Sex by Educational Attainment in Palmer Lake
Average earnings in Palmer Lake are $68,074 for men and $45,915 for women, a difference of 32.6%. Men with an educational attainment of graduate degree enjoy the highest average annual earnings of $97,321, while those with high school diploma education earn the least with $53,372. Women with an educational attainment of high school diploma earn the most with the average annual earnings of $48,563, while those with bachelor's degree education have the smallest earnings of $43,696.
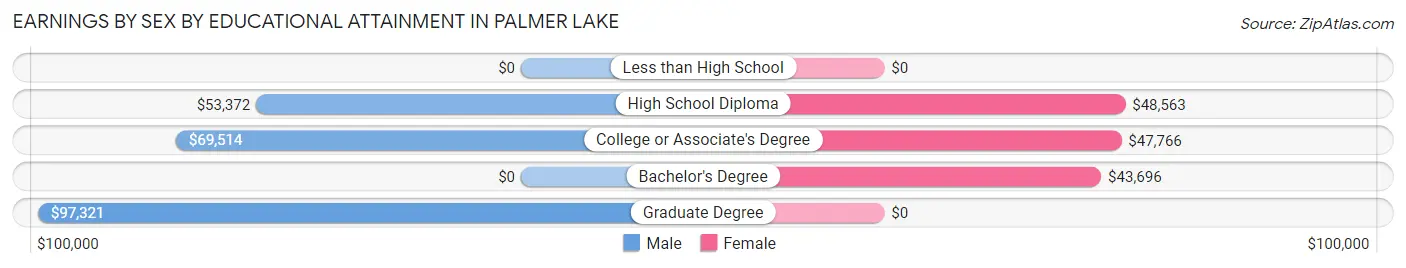
| Educational Attainment | Male Income | Female Income |
| Less than High School | - | - |
| High School Diploma | $53,372 | $48,563 |
| College or Associate's Degree | $69,514 | $47,766 |
| Bachelor's Degree | - | - |
| Graduate Degree | $97,321 | $0 |
| Total | $68,074 | $45,915 |
Family Income in Palmer Lake
Family Income Brackets in Palmer Lake
According to the Palmer Lake family income data, there are 260 families falling into the $100,000 to $149,999 income range, which is the most common income bracket and makes up 31.8% of all families.
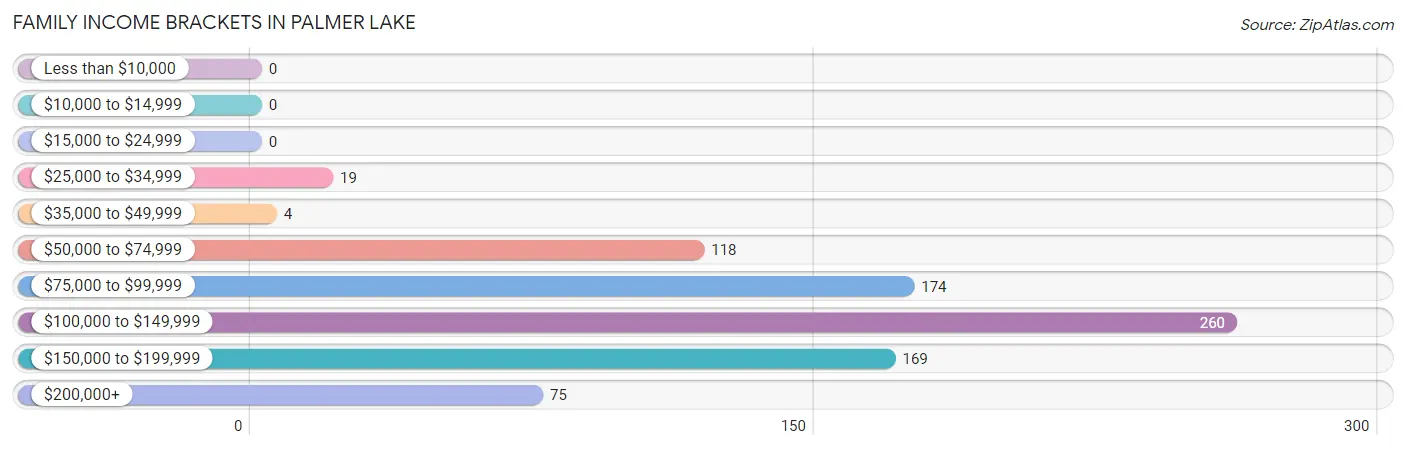
| Income Bracket | # Families | % Families |
| Less than $10,000 | 0 | 0.0% |
| $10,000 to $14,999 | 0 | 0.0% |
| $15,000 to $24,999 | 0 | 0.0% |
| $25,000 to $34,999 | 19 | 2.3% |
| $35,000 to $49,999 | 4 | 0.5% |
| $50,000 to $74,999 | 118 | 14.4% |
| $75,000 to $99,999 | 174 | 21.2% |
| $100,000 to $149,999 | 260 | 31.7% |
| $150,000 to $199,999 | 169 | 20.6% |
| $200,000+ | 75 | 9.2% |
Family Income by Famaliy Size in Palmer Lake
3-person families (195 | 23.8%) account for the highest median family income in Palmer Lake with $164,281 per family, while 3-person families (195 | 23.8%) have the highest median income of $54,760 per family member.
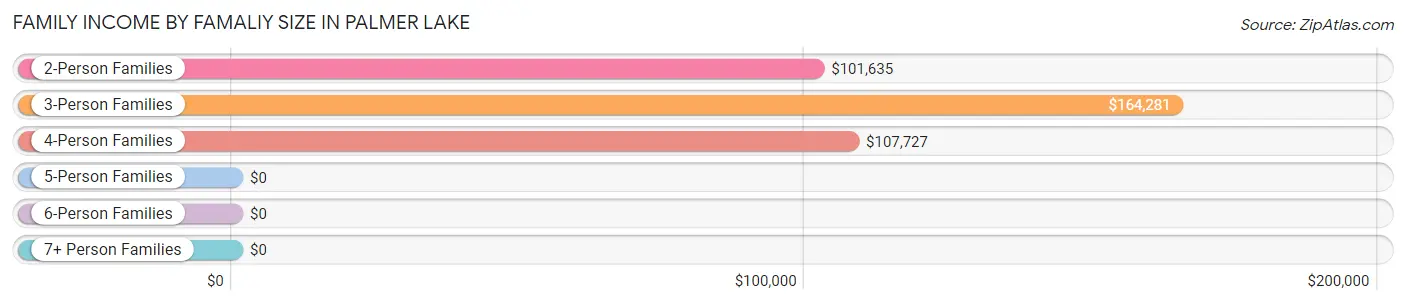
| Income Bracket | # Families | Median Income |
| 2-Person Families | 478 (58.4%) | $101,635 |
| 3-Person Families | 195 (23.8%) | $164,281 |
| 4-Person Families | 102 (12.4%) | $107,727 |
| 5-Person Families | 11 (1.3%) | $0 |
| 6-Person Families | 6 (0.7%) | $0 |
| 7+ Person Families | 27 (3.3%) | $0 |
| Total | 819 (100.0%) | $113,229 |
Family Income by Number of Earners in Palmer Lake
The median family income in Palmer Lake is $113,229, with families comprising 3+ earners (164) having the highest median family income of $171,146, while families with 1 earner (254) have the lowest median family income of $78,936, accounting for 20.0% and 31.0% of families, respectively.
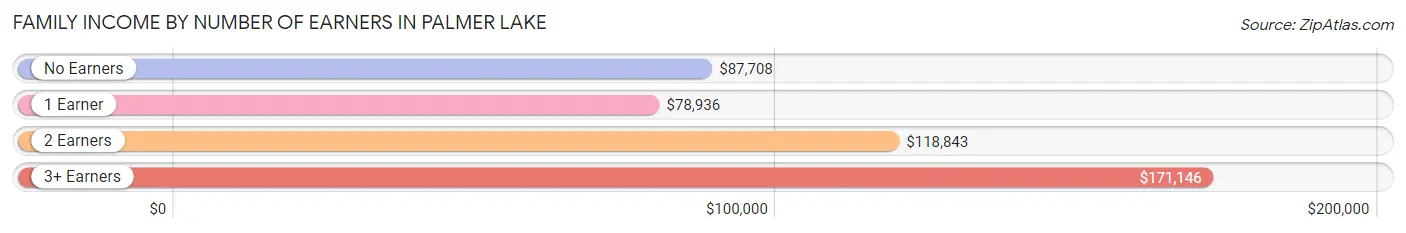
| Number of Earners | # Families | Median Income |
| No Earners | 58 (7.1%) | $87,708 |
| 1 Earner | 254 (31.0%) | $78,936 |
| 2 Earners | 343 (41.9%) | $118,843 |
| 3+ Earners | 164 (20.0%) | $171,146 |
| Total | 819 (100.0%) | $113,229 |
Household Income in Palmer Lake
Household Income Brackets in Palmer Lake
With 286 households falling in the category, the $100,000 to $149,999 income range is the most frequent in Palmer Lake, accounting for 25.8% of all households. In contrast, only 17 households (1.5%) fall into the $35,000 to $49,999 income bracket, making it the least populous group.
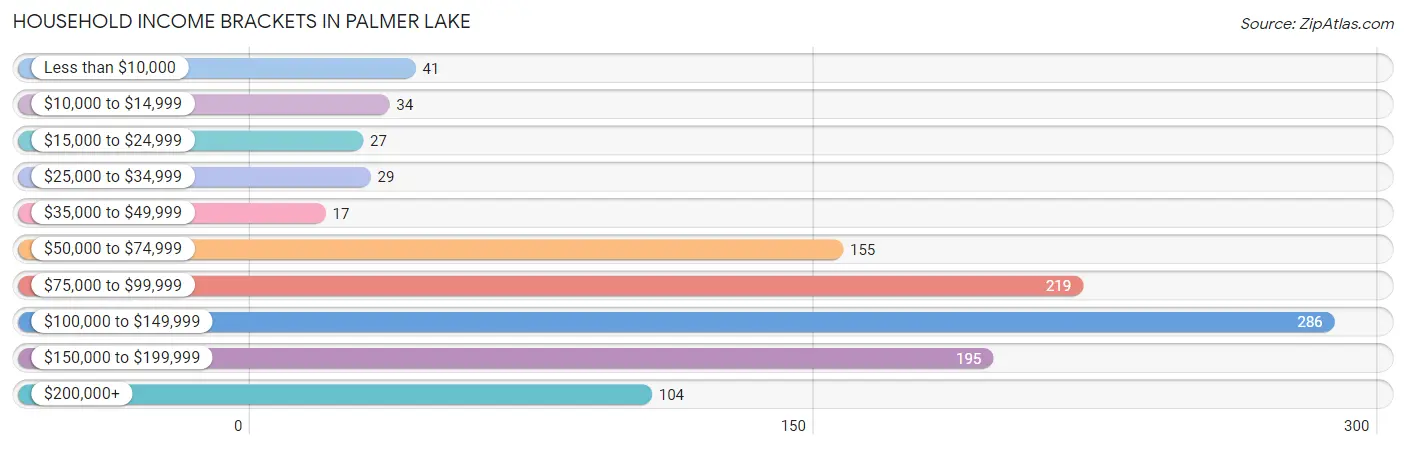
| Income Bracket | # Households | % Households |
| Less than $10,000 | 41 | 3.7% |
| $10,000 to $14,999 | 34 | 3.1% |
| $15,000 to $24,999 | 27 | 2.4% |
| $25,000 to $34,999 | 29 | 2.6% |
| $35,000 to $49,999 | 17 | 1.5% |
| $50,000 to $74,999 | 155 | 14.0% |
| $75,000 to $99,999 | 219 | 19.8% |
| $100,000 to $149,999 | 286 | 25.8% |
| $150,000 to $199,999 | 195 | 17.6% |
| $200,000+ | 104 | 9.4% |
Household Income by Householder Age in Palmer Lake
The median household income in Palmer Lake is $104,712, with the highest median household income of $118,287 found in the 25 to 44 years age bracket for the primary householder. A total of 305 households (27.6%) fall into this category. Meanwhile, the 15 to 24 years age bracket for the primary householder has the lowest median household income of $0, with 3 households (0.3%) in this group.
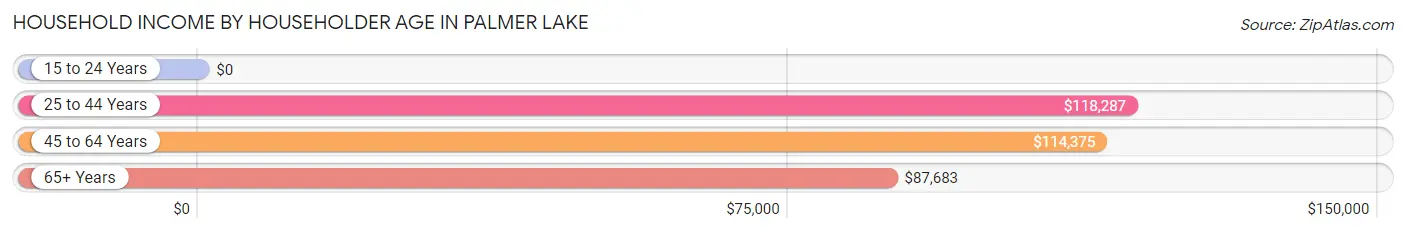
| Income Bracket | # Households | Median Income |
| 15 to 24 Years | 3 (0.3%) | $0 |
| 25 to 44 Years | 305 (27.6%) | $118,287 |
| 45 to 64 Years | 447 (40.4%) | $114,375 |
| 65+ Years | 352 (31.8%) | $87,683 |
| Total | 1,107 (100.0%) | $104,712 |
Poverty in Palmer Lake
Income Below Poverty by Sex and Age in Palmer Lake
With 0.7% poverty level for males and 5.5% for females among the residents of Palmer Lake, 35 to 44 year old males and 18 to 24 year old females are the most vulnerable to poverty, with 10 males (5.9%) and 23 females (27.1%) in their respective age groups living below the poverty level.
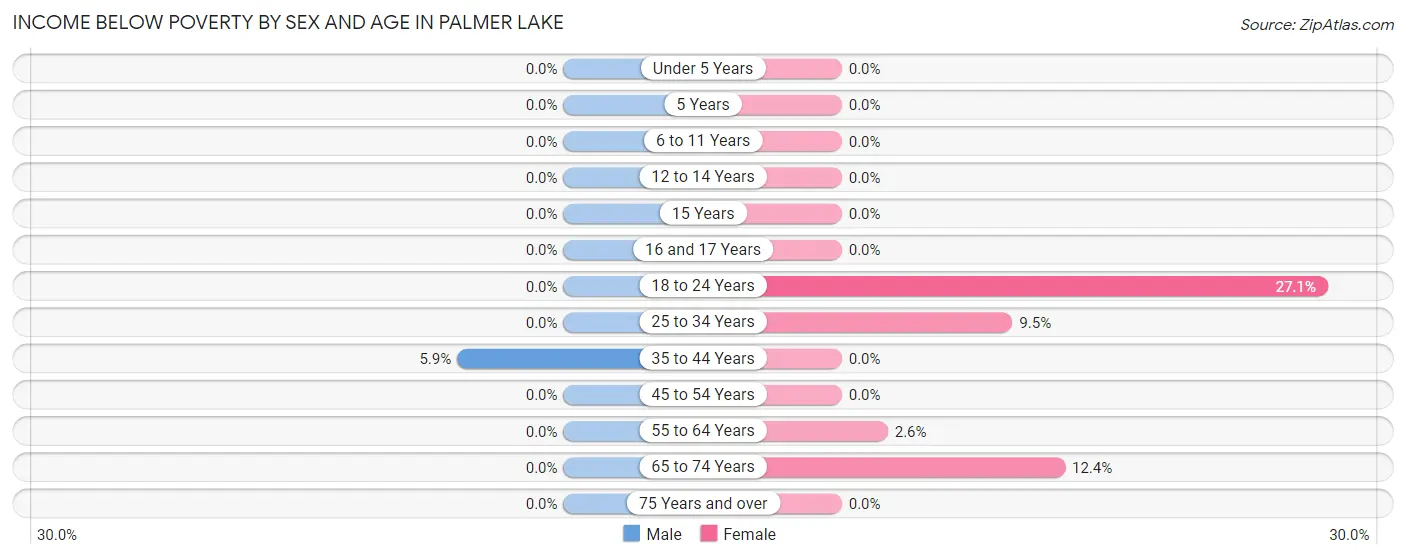
| Age Bracket | Male | Female |
| Under 5 Years | 0 (0.0%) | 0 (0.0%) |
| 5 Years | 0 (0.0%) | 0 (0.0%) |
| 6 to 11 Years | 0 (0.0%) | 0 (0.0%) |
| 12 to 14 Years | 0 (0.0%) | 0 (0.0%) |
| 15 Years | 0 (0.0%) | 0 (0.0%) |
| 16 and 17 Years | 0 (0.0%) | 0 (0.0%) |
| 18 to 24 Years | 0 (0.0%) | 23 (27.1%) |
| 25 to 34 Years | 0 (0.0%) | 17 (9.5%) |
| 35 to 44 Years | 10 (5.9%) | 0 (0.0%) |
| 45 to 54 Years | 0 (0.0%) | 0 (0.0%) |
| 55 to 64 Years | 0 (0.0%) | 10 (2.6%) |
| 65 to 74 Years | 0 (0.0%) | 21 (12.4%) |
| 75 Years and over | 0 (0.0%) | 0 (0.0%) |
| Total | 10 (0.7%) | 71 (5.5%) |
Income Above Poverty by Sex and Age in Palmer Lake
According to the poverty statistics in Palmer Lake, males aged under 5 years and females aged under 5 years are the age groups that are most secure financially, with 100.0% of males and 100.0% of females in these age groups living above the poverty line.
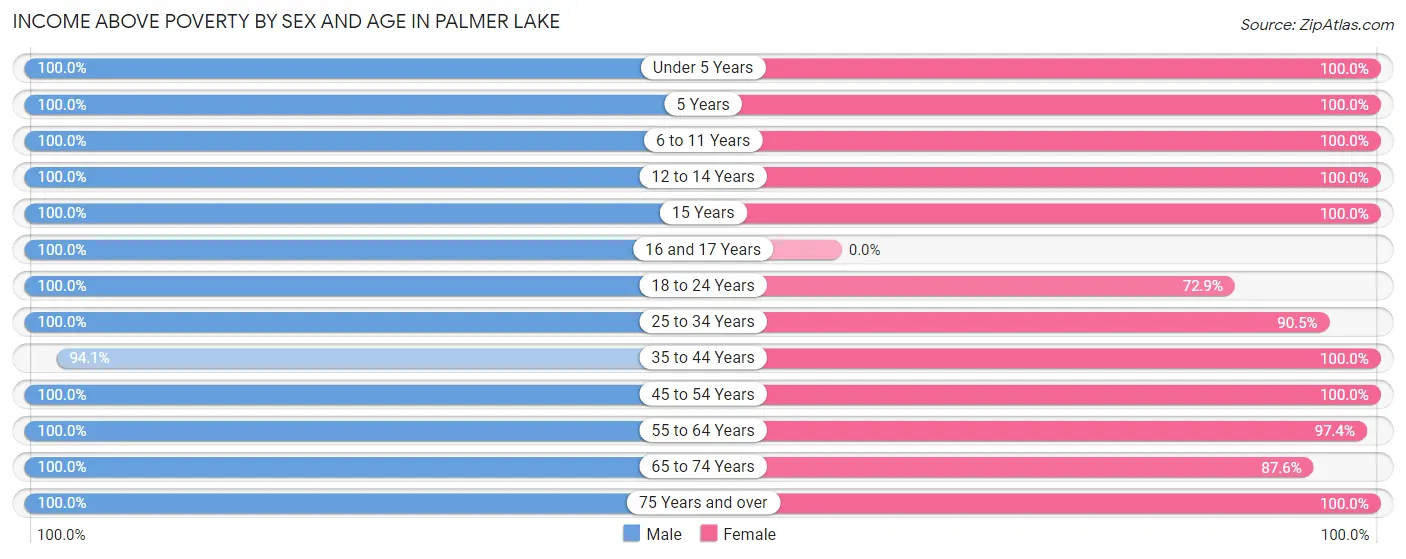
| Age Bracket | Male | Female |
| Under 5 Years | 34 (100.0%) | 6 (100.0%) |
| 5 Years | 12 (100.0%) | 24 (100.0%) |
| 6 to 11 Years | 51 (100.0%) | 65 (100.0%) |
| 12 to 14 Years | 9 (100.0%) | 24 (100.0%) |
| 15 Years | 5 (100.0%) | 7 (100.0%) |
| 16 and 17 Years | 42 (100.0%) | 0 (0.0%) |
| 18 to 24 Years | 124 (100.0%) | 62 (72.9%) |
| 25 to 34 Years | 193 (100.0%) | 162 (90.5%) |
| 35 to 44 Years | 159 (94.1%) | 138 (100.0%) |
| 45 to 54 Years | 66 (100.0%) | 90 (100.0%) |
| 55 to 64 Years | 353 (100.0%) | 380 (97.4%) |
| 65 to 74 Years | 234 (100.0%) | 148 (87.6%) |
| 75 Years and over | 57 (100.0%) | 110 (100.0%) |
| Total | 1,339 (99.3%) | 1,216 (94.5%) |
Income Below Poverty Among Married-Couple Families in Palmer Lake
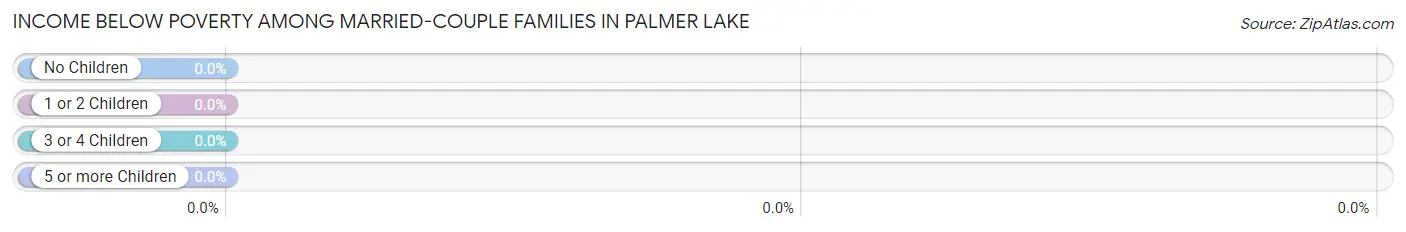
| Children | Above Poverty | Below Poverty |
| No Children | 574 (100.0%) | 0 (0.0%) |
| 1 or 2 Children | 144 (100.0%) | 0 (0.0%) |
| 3 or 4 Children | 12 (100.0%) | 0 (0.0%) |
| 5 or more Children | 0 (0.0%) | 0 (0.0%) |
| Total | 730 (100.0%) | 0 (0.0%) |
Income Below Poverty Among Single-Parent Households in Palmer Lake
| Children | Single Father | Single Mother |
| No Children | 0 (0.0%) | 0 (0.0%) |
| 1 or 2 Children | 0 (0.0%) | 0 (0.0%) |
| 3 or 4 Children | 0 (0.0%) | 0 (0.0%) |
| 5 or more Children | 0 (0.0%) | 0 (0.0%) |
| Total | 0 (0.0%) | 0 (0.0%) |
Income Below Poverty Among Married-Couple vs Single-Parent Households in Palmer Lake
| Children | Married-Couple Families | Single-Parent Households |
| No Children | 0 (0.0%) | 0 (0.0%) |
| 1 or 2 Children | 0 (0.0%) | 0 (0.0%) |
| 3 or 4 Children | 0 (0.0%) | 0 (0.0%) |
| 5 or more Children | 0 (0.0%) | 0 (0.0%) |
| Total | 0 (0.0%) | 0 (0.0%) |
Race in Palmer Lake
The most populous races in Palmer Lake are White / Caucasian (2,337 | 88.5%), Hispanic or Latino (327 | 12.4%), and Two or more Races (185 | 7.0%).
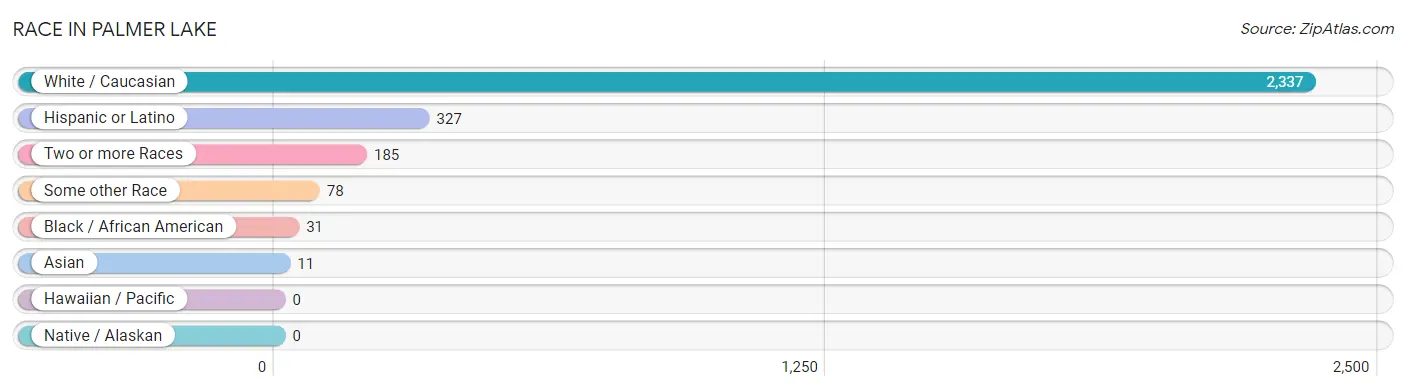
| Race | # Population | % Population |
| Asian | 11 | 0.4% |
| Black / African American | 31 | 1.2% |
| Hawaiian / Pacific | 0 | 0.0% |
| Hispanic or Latino | 327 | 12.4% |
| Native / Alaskan | 0 | 0.0% |
| White / Caucasian | 2,337 | 88.5% |
| Two or more Races | 185 | 7.0% |
| Some other Race | 78 | 2.9% |
| Total | 2,642 | 100.0% |
Ancestry in Palmer Lake
The most populous ancestries reported in Palmer Lake are German (895 | 33.9%), English (503 | 19.0%), Irish (376 | 14.2%), Mexican (256 | 9.7%), and Norwegian (159 | 6.0%), together accounting for 82.9% of all Palmer Lake residents.
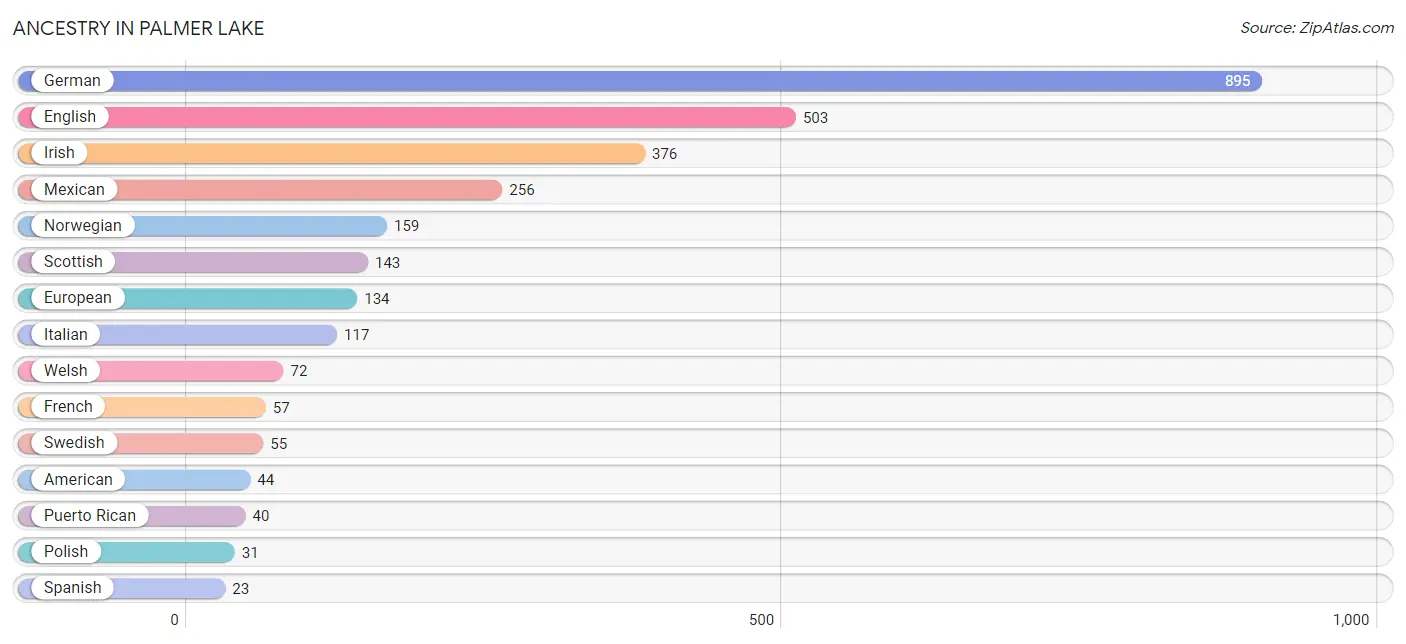
| Ancestry | # Population | % Population |
| American | 44 | 1.7% |
| Canadian | 12 | 0.4% |
| Carpatho Rusyn | 5 | 0.2% |
| Cherokee | 5 | 0.2% |
| Czech | 6 | 0.2% |
| Czechoslovakian | 17 | 0.6% |
| Dutch | 18 | 0.7% |
| English | 503 | 19.0% |
| European | 134 | 5.1% |
| French | 57 | 2.2% |
| French Canadian | 19 | 0.7% |
| German | 895 | 33.9% |
| Greek | 6 | 0.2% |
| Indian (Asian) | 11 | 0.4% |
| Irish | 376 | 14.2% |
| Italian | 117 | 4.4% |
| Mexican | 256 | 9.7% |
| Norwegian | 159 | 6.0% |
| Polish | 31 | 1.2% |
| Portuguese | 5 | 0.2% |
| Puerto Rican | 40 | 1.5% |
| Russian | 6 | 0.2% |
| Scotch-Irish | 6 | 0.2% |
| Scottish | 143 | 5.4% |
| Serbian | 7 | 0.3% |
| South American | 8 | 0.3% |
| Spanish | 23 | 0.9% |
| Swedish | 55 | 2.1% |
| Swiss | 11 | 0.4% |
| Uruguayan | 8 | 0.3% |
| Welsh | 72 | 2.7% |
| Yugoslavian | 17 | 0.6% | View All 32 Rows |
Immigrants in Palmer Lake
The most numerous immigrant groups reported in Palmer Lake came from Central America (64 | 2.4%), Latin America (64 | 2.4%), Mexico (64 | 2.4%), Europe (63 | 2.4%), and Western Europe (41 | 1.5%), together accounting for 11.2% of all Palmer Lake residents.
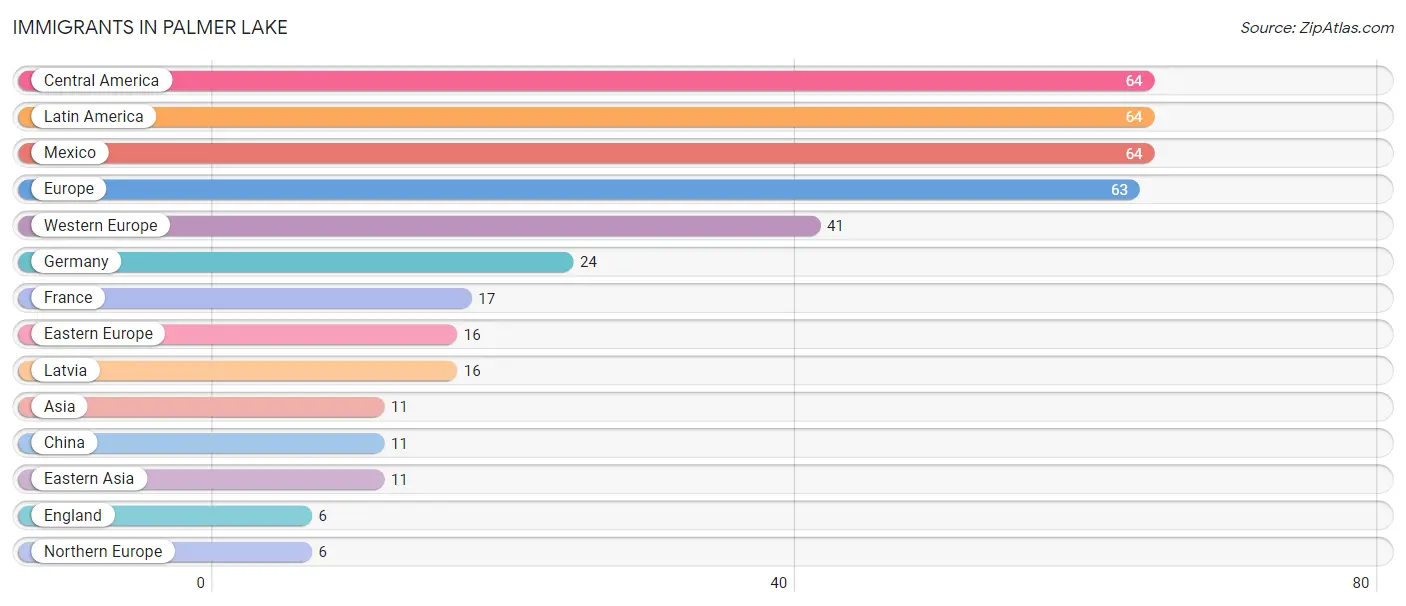
| Immigration Origin | # Population | % Population |
| Asia | 11 | 0.4% |
| Central America | 64 | 2.4% |
| China | 11 | 0.4% |
| Eastern Asia | 11 | 0.4% |
| Eastern Europe | 16 | 0.6% |
| England | 6 | 0.2% |
| Europe | 63 | 2.4% |
| France | 17 | 0.6% |
| Germany | 24 | 0.9% |
| Latin America | 64 | 2.4% |
| Latvia | 16 | 0.6% |
| Mexico | 64 | 2.4% |
| Northern Europe | 6 | 0.2% |
| Western Europe | 41 | 1.5% | View All 14 Rows |
Sex and Age in Palmer Lake
Sex and Age in Palmer Lake
The most populous age groups in Palmer Lake are 55 to 59 Years (190 | 14.1%) for men and 55 to 59 Years (247 | 19.1%) for women.
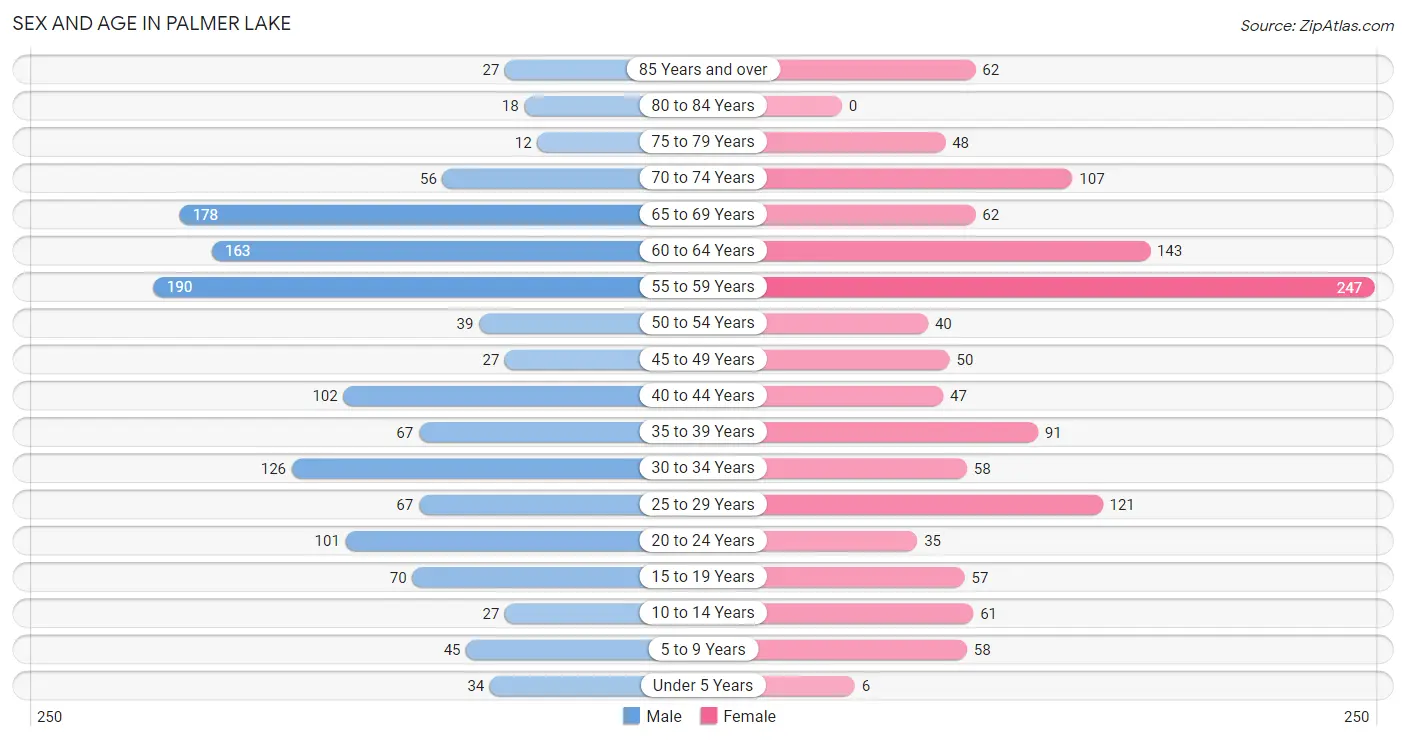
| Age Bracket | Male | Female |
| Under 5 Years | 34 (2.5%) | 6 (0.5%) |
| 5 to 9 Years | 45 (3.3%) | 58 (4.5%) |
| 10 to 14 Years | 27 (2.0%) | 61 (4.7%) |
| 15 to 19 Years | 70 (5.2%) | 57 (4.4%) |
| 20 to 24 Years | 101 (7.5%) | 35 (2.7%) |
| 25 to 29 Years | 67 (5.0%) | 121 (9.4%) |
| 30 to 34 Years | 126 (9.3%) | 58 (4.5%) |
| 35 to 39 Years | 67 (5.0%) | 91 (7.0%) |
| 40 to 44 Years | 102 (7.6%) | 47 (3.6%) |
| 45 to 49 Years | 27 (2.0%) | 50 (3.9%) |
| 50 to 54 Years | 39 (2.9%) | 40 (3.1%) |
| 55 to 59 Years | 190 (14.1%) | 247 (19.1%) |
| 60 to 64 Years | 163 (12.1%) | 143 (11.1%) |
| 65 to 69 Years | 178 (13.2%) | 62 (4.8%) |
| 70 to 74 Years | 56 (4.2%) | 107 (8.3%) |
| 75 to 79 Years | 12 (0.9%) | 48 (3.7%) |
| 80 to 84 Years | 18 (1.3%) | 0 (0.0%) |
| 85 Years and over | 27 (2.0%) | 62 (4.8%) |
| Total | 1,349 (100.0%) | 1,293 (100.0%) |
Families and Households in Palmer Lake
Median Family Size in Palmer Lake
The median family size in Palmer Lake is 2.72 persons per family, with single male/father families (24 | 2.9%) accounting for the largest median family size of 3.5 persons per family. On the other hand, married-couple families (730 | 89.1%) represent the smallest median family size with 2.65 persons per family.
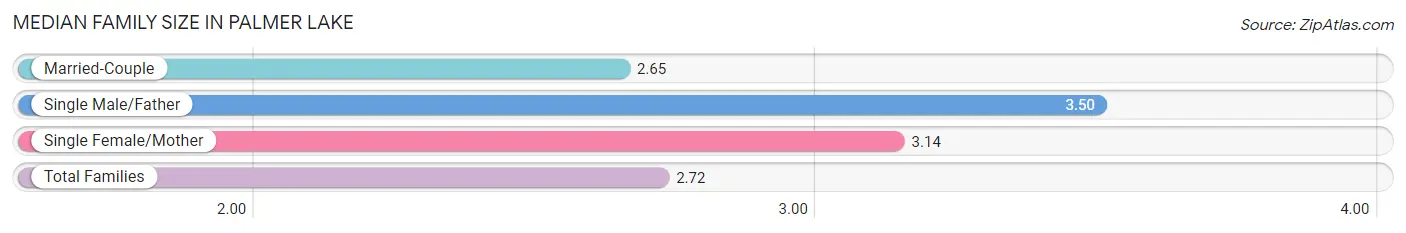
| Family Type | # Families | Family Size |
| Married-Couple | 730 (89.1%) | 2.65 |
| Single Male/Father | 24 (2.9%) | 3.50 |
| Single Female/Mother | 65 (7.9%) | 3.14 |
| Total Families | 819 (100.0%) | 2.72 |
Median Household Size in Palmer Lake
The median household size in Palmer Lake is 2.38 persons per household, with single male/father households (24 | 2.2%) accounting for the largest median household size of 3.75 persons per household. non-family households (288 | 26.0%) represent the smallest median household size with 1.28 persons per household.
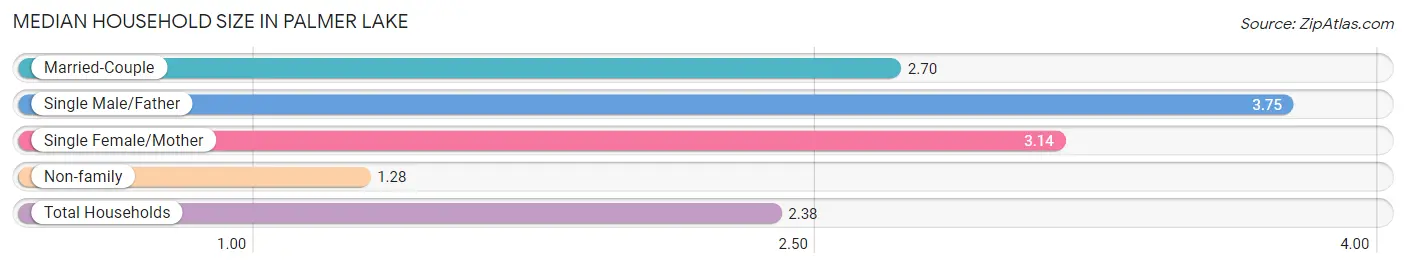
| Household Type | # Households | Household Size |
| Married-Couple | 730 (65.9%) | 2.70 |
| Single Male/Father | 24 (2.2%) | 3.75 |
| Single Female/Mother | 65 (5.9%) | 3.14 |
| Non-family | 288 (26.0%) | 1.28 |
| Total Households | 1,107 (100.0%) | 2.38 |
Household Size by Marriage Status in Palmer Lake
Out of a total of 1,107 households in Palmer Lake, 819 (74.0%) are family households, while 288 (26.0%) are nonfamily households. The most numerous type of family households are 2-person households, comprising 467, and the most common type of nonfamily households are 1-person households, comprising 222.
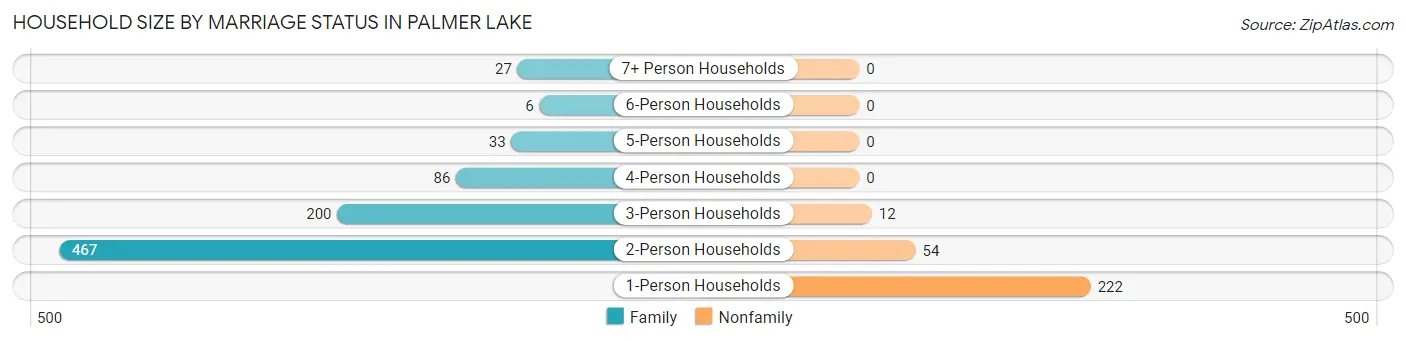
| Household Size | Family Households | Nonfamily Households |
| 1-Person Households | - | 222 (20.1%) |
| 2-Person Households | 467 (42.2%) | 54 (4.9%) |
| 3-Person Households | 200 (18.1%) | 12 (1.1%) |
| 4-Person Households | 86 (7.8%) | 0 (0.0%) |
| 5-Person Households | 33 (3.0%) | 0 (0.0%) |
| 6-Person Households | 6 (0.5%) | 0 (0.0%) |
| 7+ Person Households | 27 (2.4%) | 0 (0.0%) |
| Total | 819 (74.0%) | 288 (26.0%) |
Female Fertility in Palmer Lake
Fertility by Age in Palmer Lake
Average fertility rate in Palmer Lake is 91.0 births per 1,000 women. Women in the age bracket of 20 to 34 years have the highest fertility rate with 196.0 births per 1,000 women. Women in the age bracket of 20 to 34 years acount for 100.0% of all women with births.
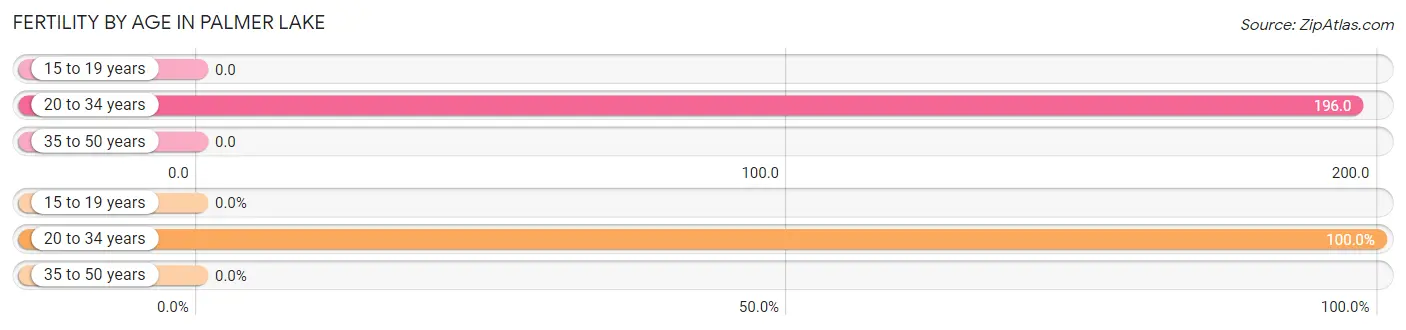
| Age Bracket | Women with Births | Births / 1,000 Women |
| 15 to 19 years | 0 (0.0%) | 0.0 |
| 20 to 34 years | 42 (100.0%) | 196.0 |
| 35 to 50 years | 0 (0.0%) | 0.0 |
| Total | 42 (100.0%) | 91.0 |
Fertility by Age by Marriage Status in Palmer Lake
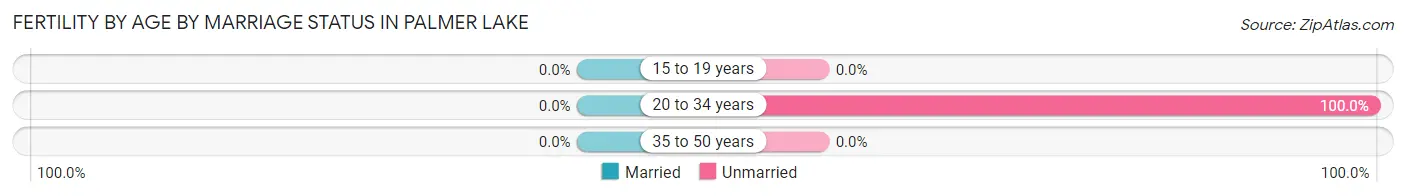
| Age Bracket | Married | Unmarried |
| 15 to 19 years | 0 (0.0%) | 0 (0.0%) |
| 20 to 34 years | 0 (0.0%) | 42 (100.0%) |
| 35 to 50 years | 0 (0.0%) | 0 (0.0%) |
| Total | 0 (0.0%) | 42 (100.0%) |
Fertility by Education in Palmer Lake
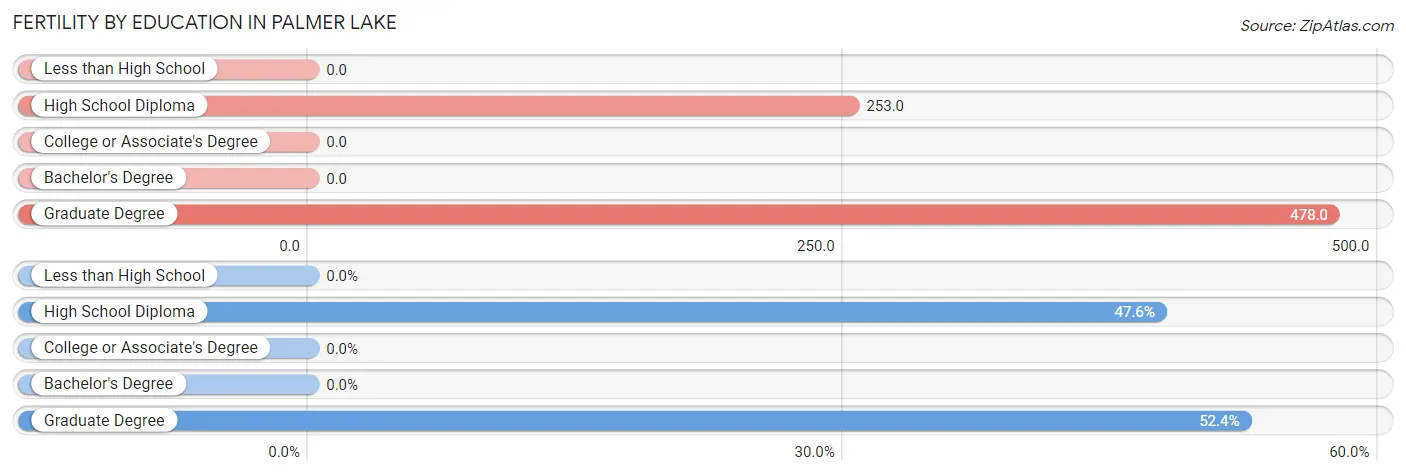
| Educational Attainment | Women with Births | Births / 1,000 Women |
| Less than High School | 0 (0.0%) | 0.0 |
| High School Diploma | 20 (47.6%) | 253.0 |
| College or Associate's Degree | 0 (0.0%) | 0.0 |
| Bachelor's Degree | 0 (0.0%) | 0.0 |
| Graduate Degree | 22 (52.4%) | 478.0 |
| Total | 42 (100.0%) | 91.0 |
Fertility by Education by Marriage Status in Palmer Lake
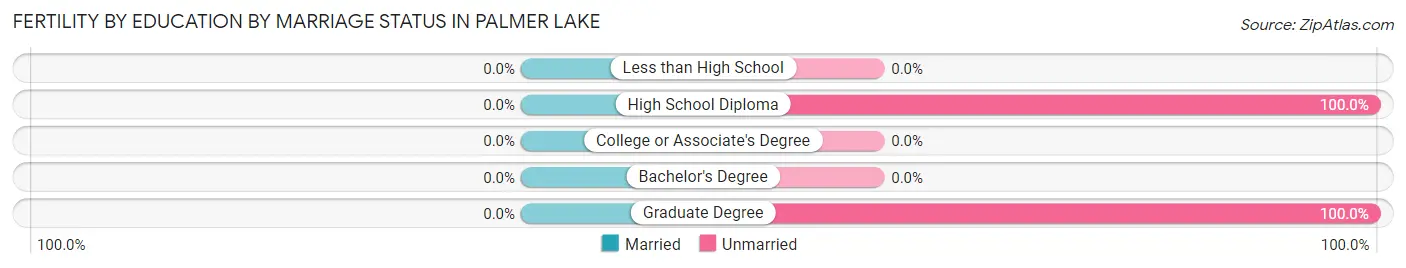
| Educational Attainment | Married | Unmarried |
| Less than High School | 0 (0.0%) | 0 (0.0%) |
| High School Diploma | 0 (0.0%) | 20 (100.0%) |
| College or Associate's Degree | 0 (0.0%) | 0 (0.0%) |
| Bachelor's Degree | 0 (0.0%) | 0 (0.0%) |
| Graduate Degree | 0 (0.0%) | 22 (100.0%) |
| Total | 0 (0.0%) | 42 (100.0%) |
Employment Characteristics in Palmer Lake
Employment by Class of Employer in Palmer Lake
Among the 1,510 employed individuals in Palmer Lake, private company employees (945 | 62.6%), local government employees (291 | 19.3%), and self-employed (not incorporated) (96 | 6.4%) make up the most common classes of employment.
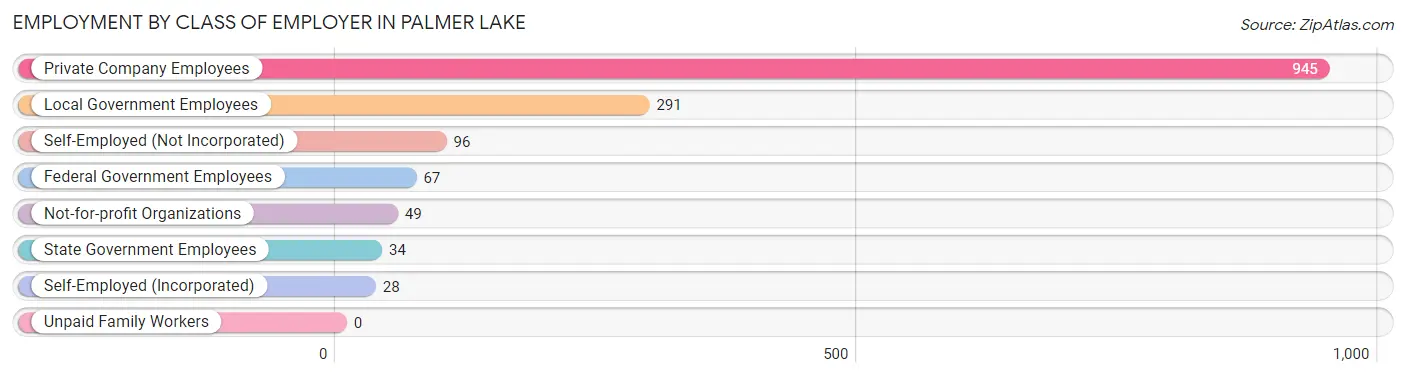
| Employer Class | # Employees | % Employees |
| Private Company Employees | 945 | 62.6% |
| Self-Employed (Incorporated) | 28 | 1.8% |
| Self-Employed (Not Incorporated) | 96 | 6.4% |
| Not-for-profit Organizations | 49 | 3.3% |
| Local Government Employees | 291 | 19.3% |
| State Government Employees | 34 | 2.2% |
| Federal Government Employees | 67 | 4.4% |
| Unpaid Family Workers | 0 | 0.0% |
| Total | 1,510 | 100.0% |
Employment Status by Age in Palmer Lake
According to the labor force statistics for Palmer Lake, out of the total population over 16 years of age (2,399), 68.0% or 1,631 individuals are in the labor force, with 7.0% or 114 of them unemployed. The age group with the highest labor force participation rate is 20 to 24 years, with 100.0% or 136 individuals in the labor force. Within the labor force, the 20 to 24 years age range has the highest percentage of unemployed individuals, with 48.5% or 66 of them being unemployed.
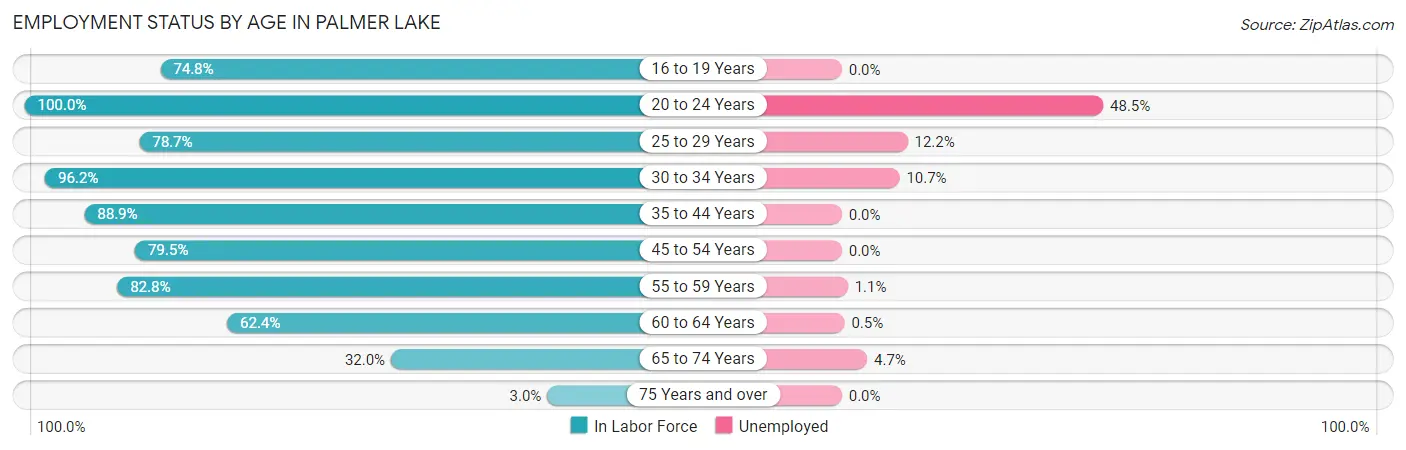
| Age Bracket | In Labor Force | Unemployed |
| 16 to 19 Years | 86 (74.8%) | 0 (0.0%) |
| 20 to 24 Years | 136 (100.0%) | 66 (48.5%) |
| 25 to 29 Years | 148 (78.7%) | 18 (12.2%) |
| 30 to 34 Years | 177 (96.2%) | 19 (10.7%) |
| 35 to 44 Years | 273 (88.9%) | 0 (0.0%) |
| 45 to 54 Years | 124 (79.5%) | 0 (0.0%) |
| 55 to 59 Years | 362 (82.8%) | 4 (1.1%) |
| 60 to 64 Years | 191 (62.4%) | 1 (0.5%) |
| 65 to 74 Years | 129 (32.0%) | 6 (4.7%) |
| 75 Years and over | 5 (3.0%) | 0 (0.0%) |
| Total | 1,631 (68.0%) | 114 (7.0%) |
Employment Status by Educational Attainment in Palmer Lake
According to labor force statistics for Palmer Lake, 80.8% of individuals (1,275) out of the total population between 25 and 64 years of age (1,578) are in the labor force, with 3.3% or 42 of them being unemployed. The group with the highest labor force participation rate are those with the educational attainment of bachelor's degree or higher, with 89.6% or 524 individuals in the labor force. Within the labor force, individuals with college / associate degree education have the highest percentage of unemployment, with 4.5% or 22 of them being unemployed.
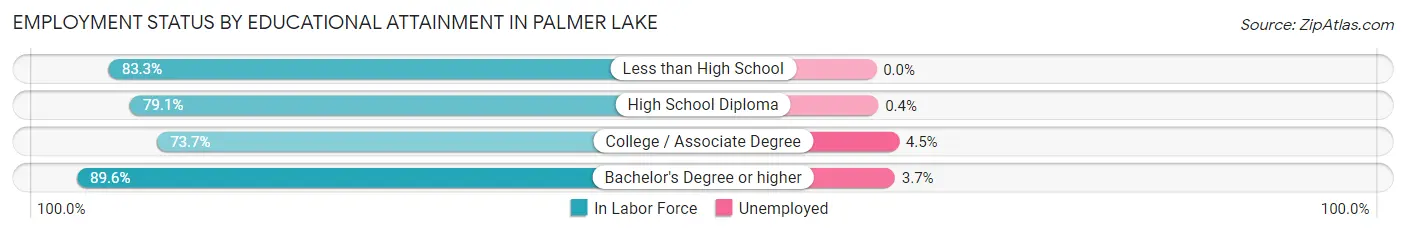
| Educational Attainment | In Labor Force | Unemployed |
| Less than High School | 30 (83.3%) | 0 (0.0%) |
| High School Diploma | 234 (79.1%) | 1 (0.4%) |
| College / Associate Degree | 487 (73.7%) | 30 (4.5%) |
| Bachelor's Degree or higher | 524 (89.6%) | 22 (3.7%) |
| Total | 1,275 (80.8%) | 52 (3.3%) |
Employment Occupations by Sex in Palmer Lake
Management, Business, Science and Arts Occupations
The most common Management, Business, Science and Arts occupations in Palmer Lake are Community & Social Service (192 | 12.7%), Education Instruction & Library (155 | 10.3%), Management (140 | 9.3%), Business & Financial (83 | 5.5%), and Health Diagnosing & Treating (80 | 5.3%).
Management, Business, Science and Arts Occupations by Sex
Within the Management, Business, Science and Arts occupations in Palmer Lake, the most male-oriented occupations are Architecture & Engineering (100.0%), Computers, Engineering & Science (88.9%), and Computers & Mathematics (70.6%), while the most female-oriented occupations are Education, Arts & Media (100.0%), Health Diagnosing & Treating (100.0%), and Health Technologists (100.0%).
| Occupation | Male | Female |
| Management | 70 (50.0%) | 70 (50.0%) |
| Business & Financial | 47 (56.6%) | 36 (43.4%) |
| Computers, Engineering & Science | 40 (88.9%) | 5 (11.1%) |
| Computers & Mathematics | 12 (70.6%) | 5 (29.4%) |
| Architecture & Engineering | 28 (100.0%) | 0 (0.0%) |
| Life, Physical & Social Science | 0 (0.0%) | 0 (0.0%) |
| Community & Social Service | 81 (42.2%) | 111 (57.8%) |
| Education, Arts & Media | 0 (0.0%) | 12 (100.0%) |
| Legal Services & Support | 0 (0.0%) | 0 (0.0%) |
| Education Instruction & Library | 68 (43.9%) | 87 (56.1%) |
| Arts, Media & Entertainment | 13 (52.0%) | 12 (48.0%) |
| Health Diagnosing & Treating | 0 (0.0%) | 80 (100.0%) |
| Health Technologists | 0 (0.0%) | 41 (100.0%) |
| Total (Category) | 238 (44.1%) | 302 (55.9%) |
| Total (Overall) | 719 (47.6%) | 791 (52.4%) |
Services Occupations
The most common Services occupations in Palmer Lake are Food Preparation & Serving (98 | 6.5%), Cleaning & Maintenance (91 | 6.0%), Healthcare Support (88 | 5.8%), Security & Protection (62 | 4.1%), and Law Enforcement (49 | 3.3%).
Services Occupations by Sex
Within the Services occupations in Palmer Lake, the most male-oriented occupations are Firefighting & Prevention (100.0%), Security & Protection (90.3%), and Law Enforcement (87.8%), while the most female-oriented occupations are Healthcare Support (62.5%), Food Preparation & Serving (61.2%), and Cleaning & Maintenance (53.8%).
| Occupation | Male | Female |
| Healthcare Support | 33 (37.5%) | 55 (62.5%) |
| Security & Protection | 56 (90.3%) | 6 (9.7%) |
| Firefighting & Prevention | 13 (100.0%) | 0 (0.0%) |
| Law Enforcement | 43 (87.8%) | 6 (12.2%) |
| Food Preparation & Serving | 38 (38.8%) | 60 (61.2%) |
| Cleaning & Maintenance | 42 (46.2%) | 49 (53.8%) |
| Personal Care & Service | 20 (58.8%) | 14 (41.2%) |
| Total (Category) | 189 (50.7%) | 184 (49.3%) |
| Total (Overall) | 719 (47.6%) | 791 (52.4%) |
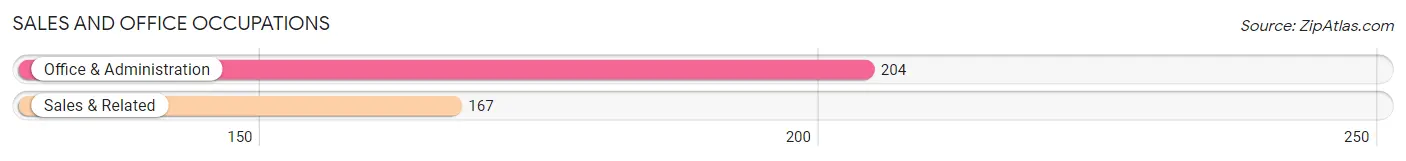
Sales and Office Occupations
The most common Sales and Office occupations in Palmer Lake are Office & Administration (204 | 13.5%), and Sales & Related (167 | 11.1%).
Sales and Office Occupations by Sex
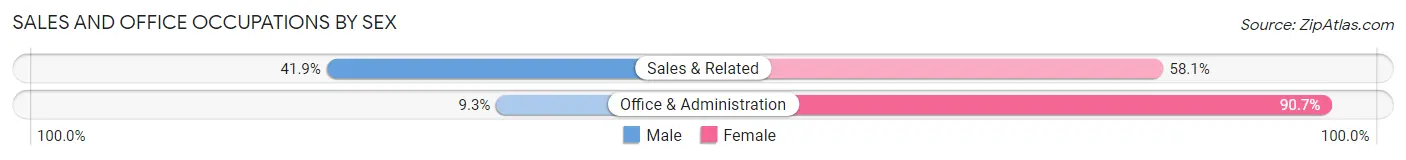
| Occupation | Male | Female |
| Sales & Related | 70 (41.9%) | 97 (58.1%) |
| Office & Administration | 19 (9.3%) | 185 (90.7%) |
| Total (Category) | 89 (24.0%) | 282 (76.0%) |
| Total (Overall) | 719 (47.6%) | 791 (52.4%) |
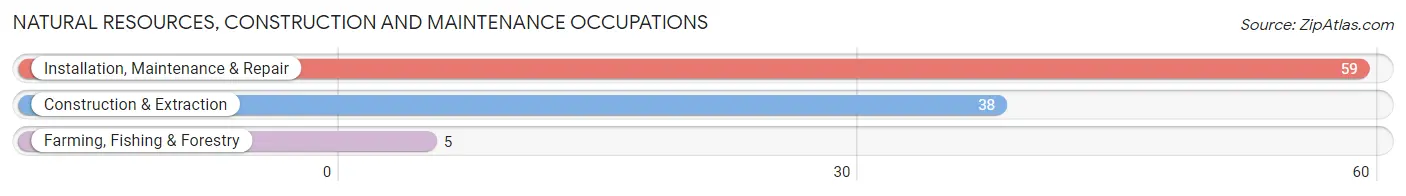
Natural Resources, Construction and Maintenance Occupations
The most common Natural Resources, Construction and Maintenance occupations in Palmer Lake are Installation, Maintenance & Repair (59 | 3.9%), Construction & Extraction (38 | 2.5%), and Farming, Fishing & Forestry (5 | 0.3%).
Natural Resources, Construction and Maintenance Occupations by Sex
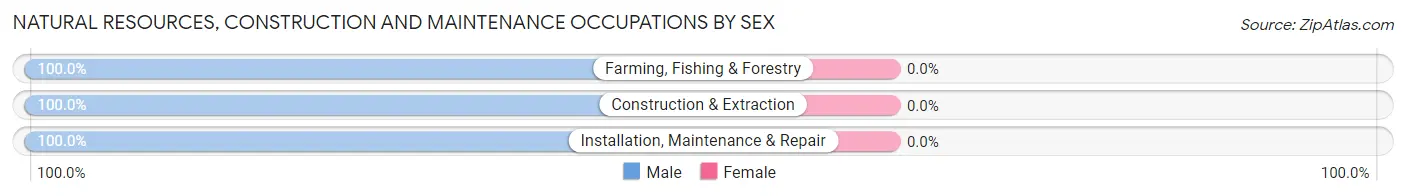
| Occupation | Male | Female |
| Farming, Fishing & Forestry | 5 (100.0%) | 0 (0.0%) |
| Construction & Extraction | 38 (100.0%) | 0 (0.0%) |
| Installation, Maintenance & Repair | 59 (100.0%) | 0 (0.0%) |
| Total (Category) | 102 (100.0%) | 0 (0.0%) |
| Total (Overall) | 719 (47.6%) | 791 (52.4%) |
Production, Transportation and Moving Occupations
The most common Production, Transportation and Moving occupations in Palmer Lake are Material Moving (79 | 5.2%), Transportation (39 | 2.6%), and Production (6 | 0.4%).
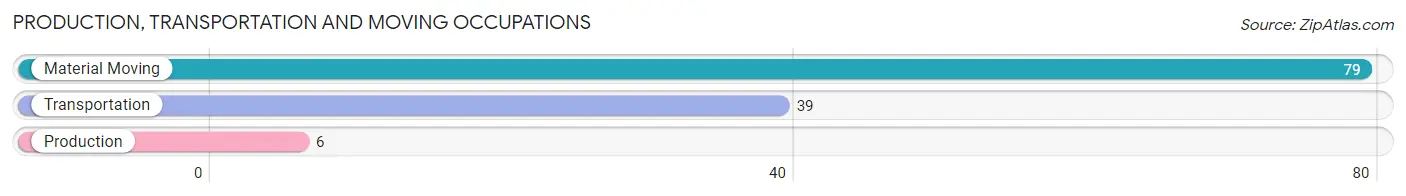
Production, Transportation and Moving Occupations by Sex
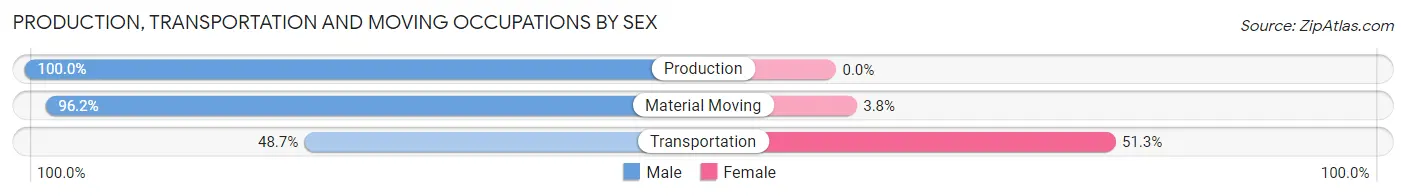
| Occupation | Male | Female |
| Production | 6 (100.0%) | 0 (0.0%) |
| Transportation | 19 (48.7%) | 20 (51.3%) |
| Material Moving | 76 (96.2%) | 3 (3.8%) |
| Total (Category) | 101 (81.5%) | 23 (18.5%) |
| Total (Overall) | 719 (47.6%) | 791 (52.4%) |
Employment Industries by Sex in Palmer Lake
Employment Industries in Palmer Lake
The major employment industries in Palmer Lake include Educational Services (168 | 11.1%), Health Care & Social Assistance (151 | 10.0%), Accommodation & Food Services (144 | 9.5%), Retail Trade (122 | 8.1%), and Arts, Entertainment & Recreation (107 | 7.1%).
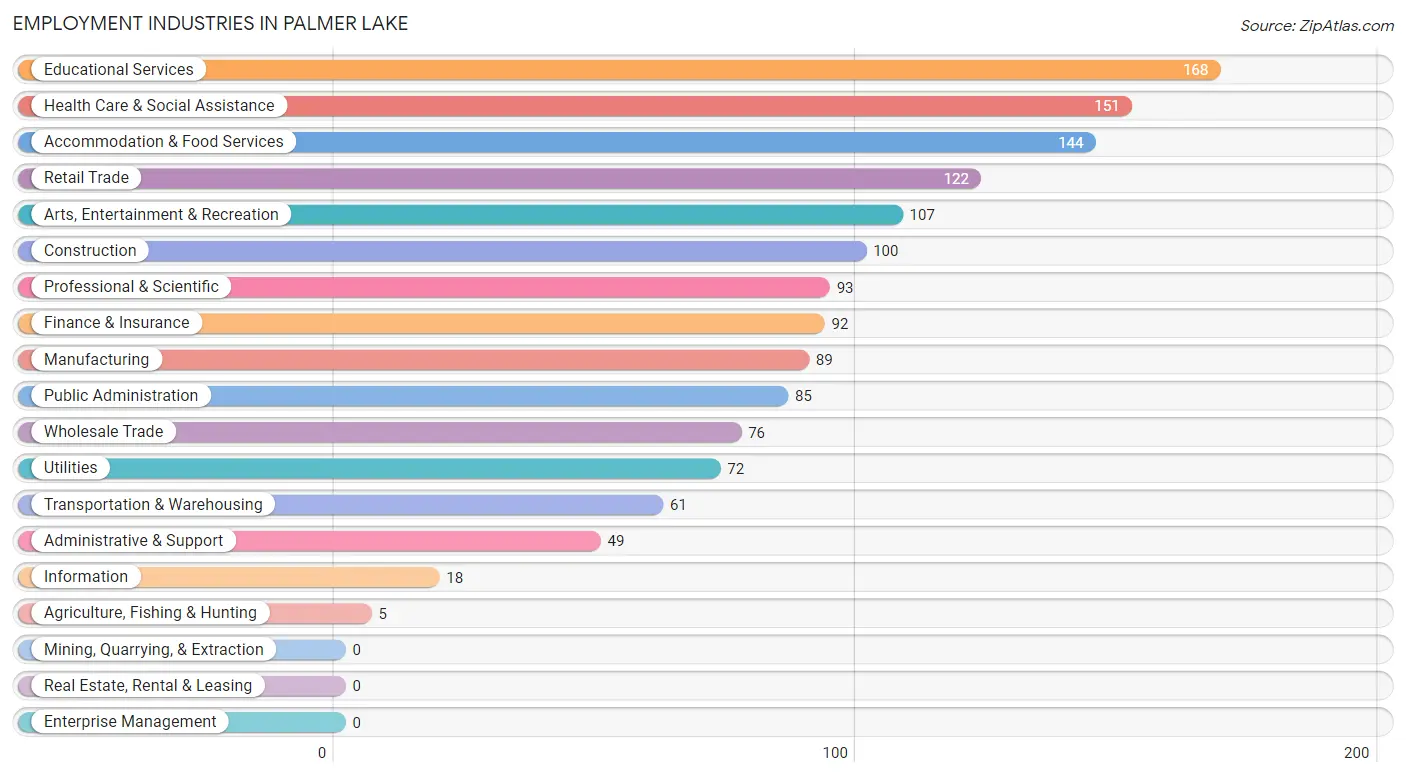
Employment Industries by Sex in Palmer Lake
The Palmer Lake industries that see more men than women are Agriculture, Fishing & Hunting (100.0%), Wholesale Trade (100.0%), and Construction (81.0%), whereas the industries that tend to have a higher number of women are Administrative & Support (100.0%), Health Care & Social Assistance (78.1%), and Accommodation & Food Services (77.8%).
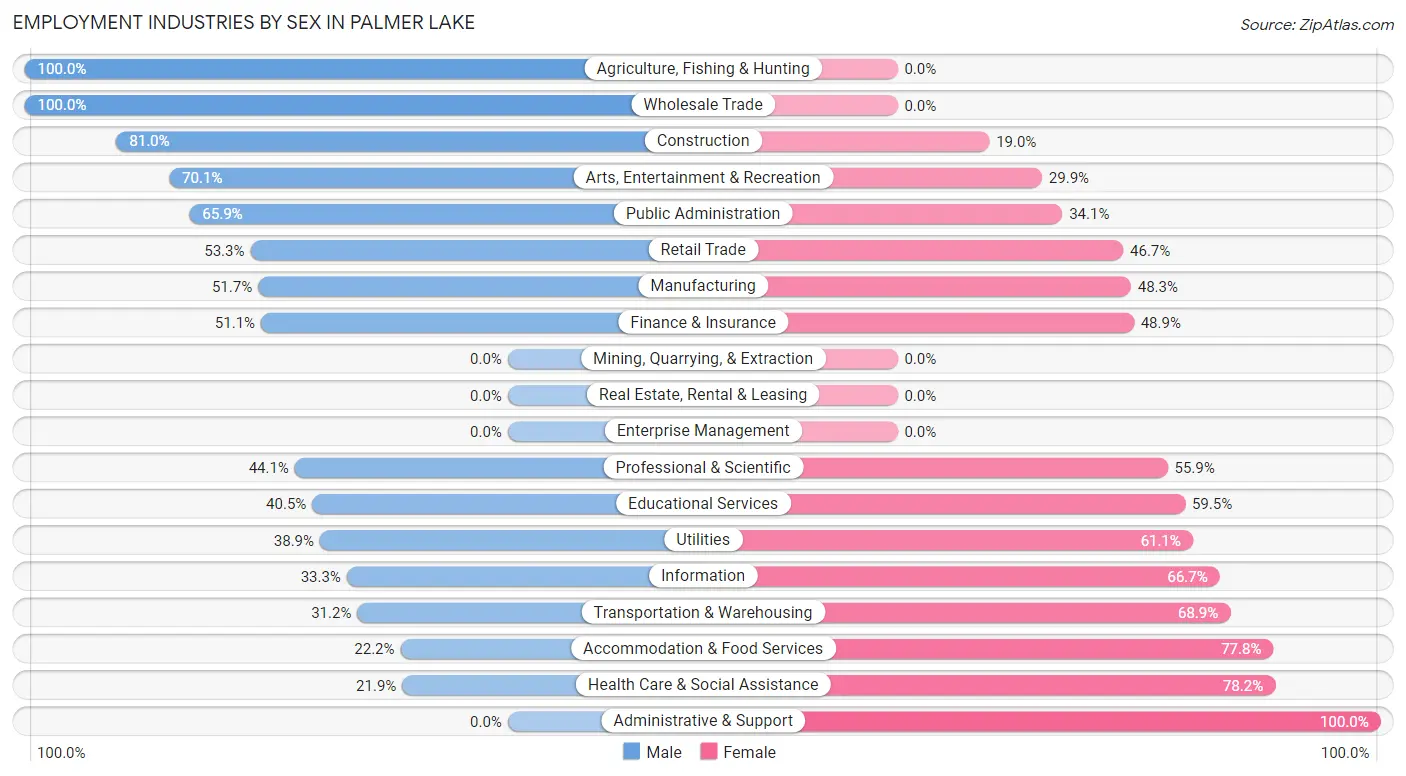
| Industry | Male | Female |
| Agriculture, Fishing & Hunting | 5 (100.0%) | 0 (0.0%) |
| Mining, Quarrying, & Extraction | 0 (0.0%) | 0 (0.0%) |
| Construction | 81 (81.0%) | 19 (19.0%) |
| Manufacturing | 46 (51.7%) | 43 (48.3%) |
| Wholesale Trade | 76 (100.0%) | 0 (0.0%) |
| Retail Trade | 65 (53.3%) | 57 (46.7%) |
| Transportation & Warehousing | 19 (31.1%) | 42 (68.9%) |
| Utilities | 28 (38.9%) | 44 (61.1%) |
| Information | 6 (33.3%) | 12 (66.7%) |
| Finance & Insurance | 47 (51.1%) | 45 (48.9%) |
| Real Estate, Rental & Leasing | 0 (0.0%) | 0 (0.0%) |
| Professional & Scientific | 41 (44.1%) | 52 (55.9%) |
| Enterprise Management | 0 (0.0%) | 0 (0.0%) |
| Administrative & Support | 0 (0.0%) | 49 (100.0%) |
| Educational Services | 68 (40.5%) | 100 (59.5%) |
| Health Care & Social Assistance | 33 (21.8%) | 118 (78.1%) |
| Arts, Entertainment & Recreation | 75 (70.1%) | 32 (29.9%) |
| Accommodation & Food Services | 32 (22.2%) | 112 (77.8%) |
| Public Administration | 56 (65.9%) | 29 (34.1%) |
| Total | 719 (47.6%) | 791 (52.4%) |
Education in Palmer Lake
School Enrollment in Palmer Lake
The most common levels of schooling among the 356 students in Palmer Lake are middle school (83 | 23.3%), high school (77 | 21.6%), and elementary school (61 | 17.1%).
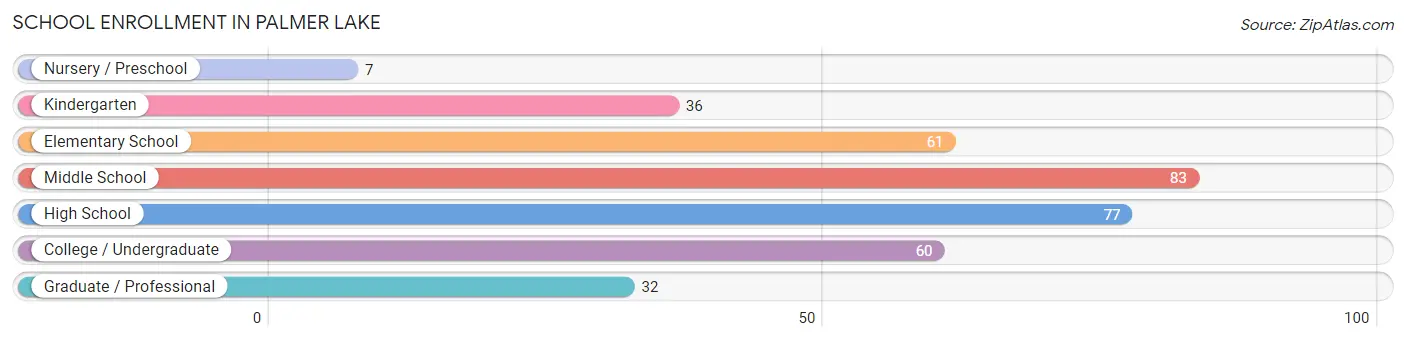
| School Level | # Students | % Students |
| Nursery / Preschool | 7 | 2.0% |
| Kindergarten | 36 | 10.1% |
| Elementary School | 61 | 17.1% |
| Middle School | 83 | 23.3% |
| High School | 77 | 21.6% |
| College / Undergraduate | 60 | 16.9% |
| Graduate / Professional | 32 | 9.0% |
| Total | 356 | 100.0% |
School Enrollment by Age by Funding Source in Palmer Lake
Out of a total of 356 students who are enrolled in schools in Palmer Lake, 34 (9.6%) attend a private institution, while the remaining 322 (90.4%) are enrolled in public schools. The age group of 35 years and over has the highest likelihood of being enrolled in private schools, with 10 (45.5% in the age bracket) enrolled. Conversely, the age group of 3 to 4 year olds has the lowest likelihood of being enrolled in a private school, with 7 (100.0% in the age bracket) attending a public institution.
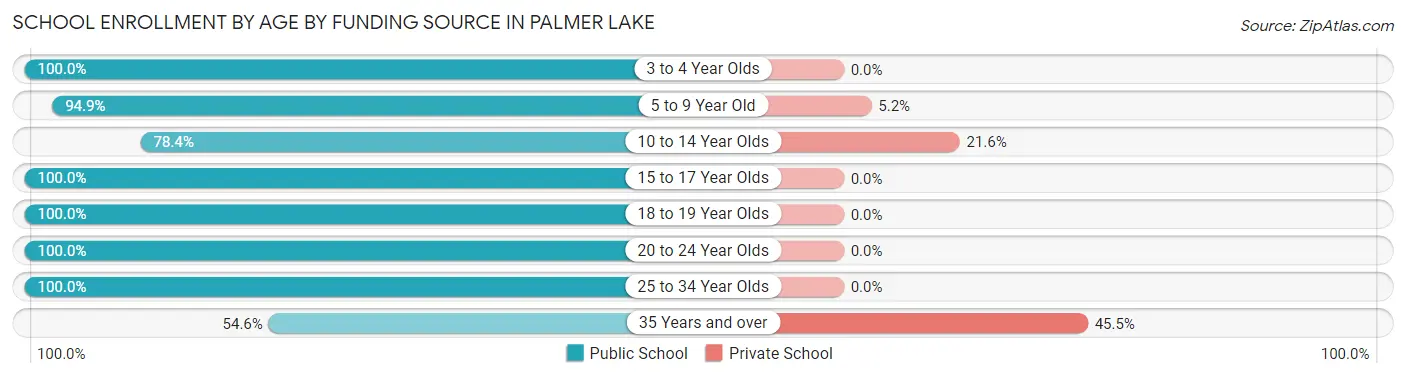
| Age Bracket | Public School | Private School |
| 3 to 4 Year Olds | 7 (100.0%) | 0 (0.0%) |
| 5 to 9 Year Old | 92 (94.9%) | 5 (5.1%) |
| 10 to 14 Year Olds | 69 (78.4%) | 19 (21.6%) |
| 15 to 17 Year Olds | 54 (100.0%) | 0 (0.0%) |
| 18 to 19 Year Olds | 18 (100.0%) | 0 (0.0%) |
| 20 to 24 Year Olds | 9 (100.0%) | 0 (0.0%) |
| 25 to 34 Year Olds | 61 (100.0%) | 0 (0.0%) |
| 35 Years and over | 12 (54.5%) | 10 (45.5%) |
| Total | 322 (90.4%) | 34 (9.6%) |
Educational Attainment by Field of Study in Palmer Lake
Education (197 | 22.6%), business (163 | 18.7%), social sciences (88 | 10.1%), liberal arts & history (82 | 9.4%), and engineering (78 | 9.0%) are the most common fields of study among 870 individuals in Palmer Lake who have obtained a bachelor's degree or higher.
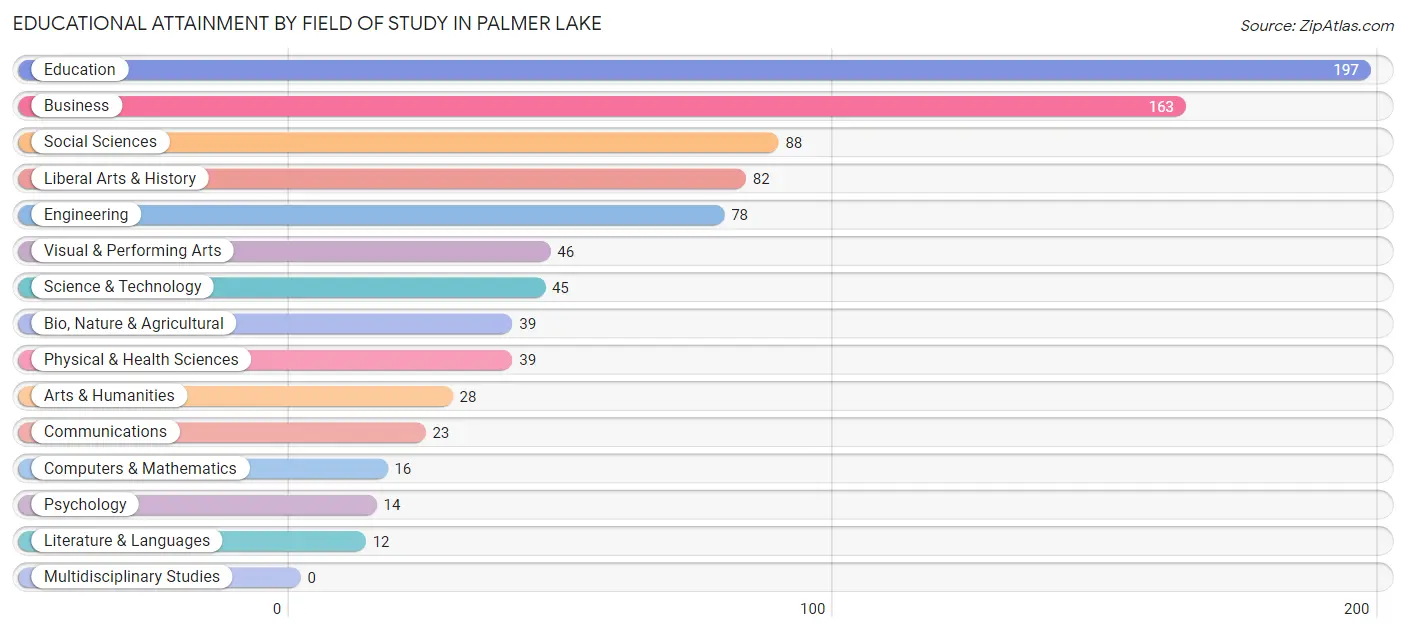
| Field of Study | # Graduates | % Graduates |
| Computers & Mathematics | 16 | 1.8% |
| Bio, Nature & Agricultural | 39 | 4.5% |
| Physical & Health Sciences | 39 | 4.5% |
| Psychology | 14 | 1.6% |
| Social Sciences | 88 | 10.1% |
| Engineering | 78 | 9.0% |
| Multidisciplinary Studies | 0 | 0.0% |
| Science & Technology | 45 | 5.2% |
| Business | 163 | 18.7% |
| Education | 197 | 22.6% |
| Literature & Languages | 12 | 1.4% |
| Liberal Arts & History | 82 | 9.4% |
| Visual & Performing Arts | 46 | 5.3% |
| Communications | 23 | 2.6% |
| Arts & Humanities | 28 | 3.2% |
| Total | 870 | 100.0% |
Transportation & Commute in Palmer Lake
Vehicle Availability by Sex in Palmer Lake
The most prevalent vehicle ownership categories in Palmer Lake are males with 3 vehicles (258, accounting for 35.9%) and females with 3 vehicles (317, making up 32.8%).
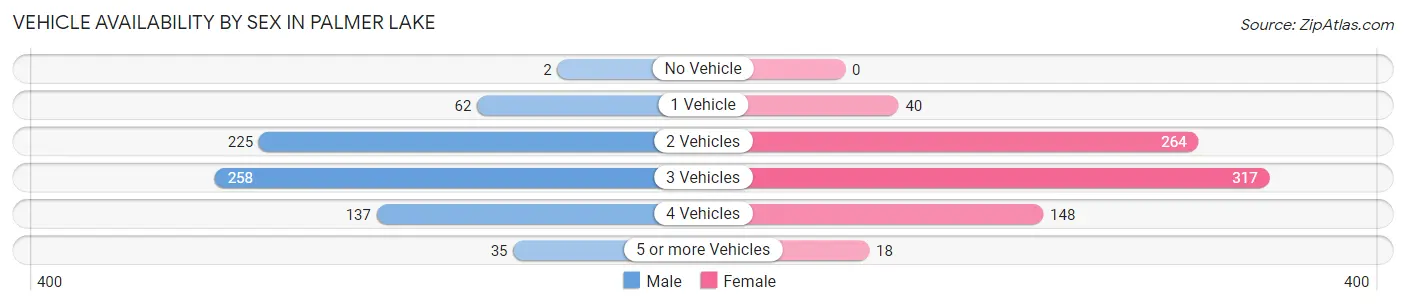
| Vehicles Available | Male | Female |
| No Vehicle | 2 (0.3%) | 0 (0.0%) |
| 1 Vehicle | 62 (8.6%) | 40 (5.1%) |
| 2 Vehicles | 225 (31.3%) | 264 (33.6%) |
| 3 Vehicles | 258 (35.9%) | 317 (40.3%) |
| 4 Vehicles | 137 (19.1%) | 148 (18.8%) |
| 5 or more Vehicles | 35 (4.9%) | 18 (2.3%) |
| Total | 719 (100.0%) | 787 (100.0%) |
Commute Time in Palmer Lake
The most frequently occuring commute durations in Palmer Lake are 10 to 14 minutes (197 commuters, 14.7%), 5 to 9 minutes (180 commuters, 13.5%), and 30 to 34 minutes (179 commuters, 13.4%).
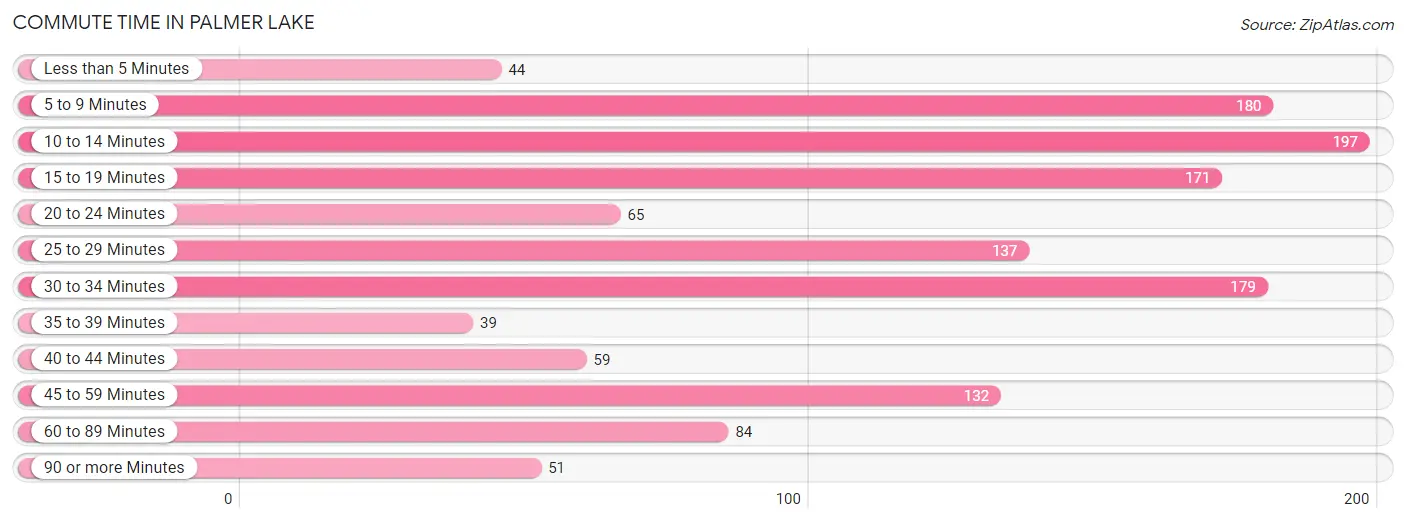
| Commute Time | # Commuters | % Commuters |
| Less than 5 Minutes | 44 | 3.3% |
| 5 to 9 Minutes | 180 | 13.5% |
| 10 to 14 Minutes | 197 | 14.7% |
| 15 to 19 Minutes | 171 | 12.8% |
| 20 to 24 Minutes | 65 | 4.9% |
| 25 to 29 Minutes | 137 | 10.2% |
| 30 to 34 Minutes | 179 | 13.4% |
| 35 to 39 Minutes | 39 | 2.9% |
| 40 to 44 Minutes | 59 | 4.4% |
| 45 to 59 Minutes | 132 | 9.9% |
| 60 to 89 Minutes | 84 | 6.3% |
| 90 or more Minutes | 51 | 3.8% |
Commute Time by Sex in Palmer Lake
The most common commute times in Palmer Lake are 45 to 59 minutes (113 commuters, 17.6%) for males and 30 to 34 minutes (122 commuters, 17.5%) for females.
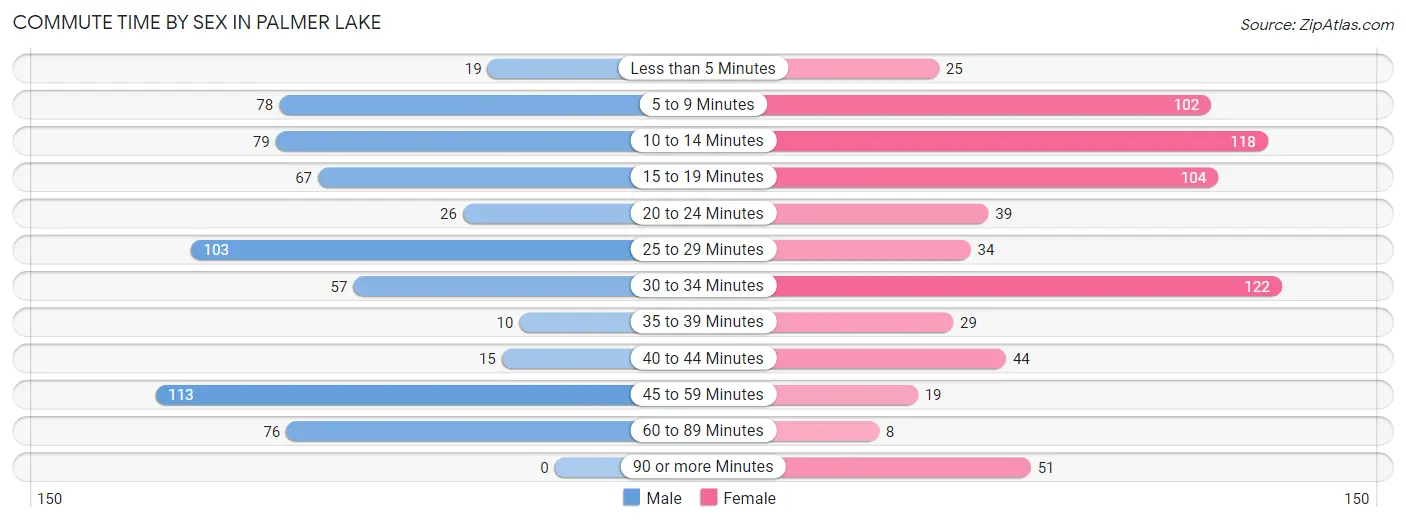
| Commute Time | Male | Female |
| Less than 5 Minutes | 19 (2.9%) | 25 (3.6%) |
| 5 to 9 Minutes | 78 (12.1%) | 102 (14.7%) |
| 10 to 14 Minutes | 79 (12.3%) | 118 (17.0%) |
| 15 to 19 Minutes | 67 (10.4%) | 104 (15.0%) |
| 20 to 24 Minutes | 26 (4.0%) | 39 (5.6%) |
| 25 to 29 Minutes | 103 (16.0%) | 34 (4.9%) |
| 30 to 34 Minutes | 57 (8.9%) | 122 (17.5%) |
| 35 to 39 Minutes | 10 (1.6%) | 29 (4.2%) |
| 40 to 44 Minutes | 15 (2.3%) | 44 (6.3%) |
| 45 to 59 Minutes | 113 (17.6%) | 19 (2.7%) |
| 60 to 89 Minutes | 76 (11.8%) | 8 (1.1%) |
| 90 or more Minutes | 0 (0.0%) | 51 (7.3%) |
Time of Departure to Work by Sex in Palmer Lake
The most frequent times of departure to work in Palmer Lake are 8:00 AM to 8:29 AM (208, 32.4%) for males and 12:00 PM to 3:59 PM (111, 16.0%) for females.
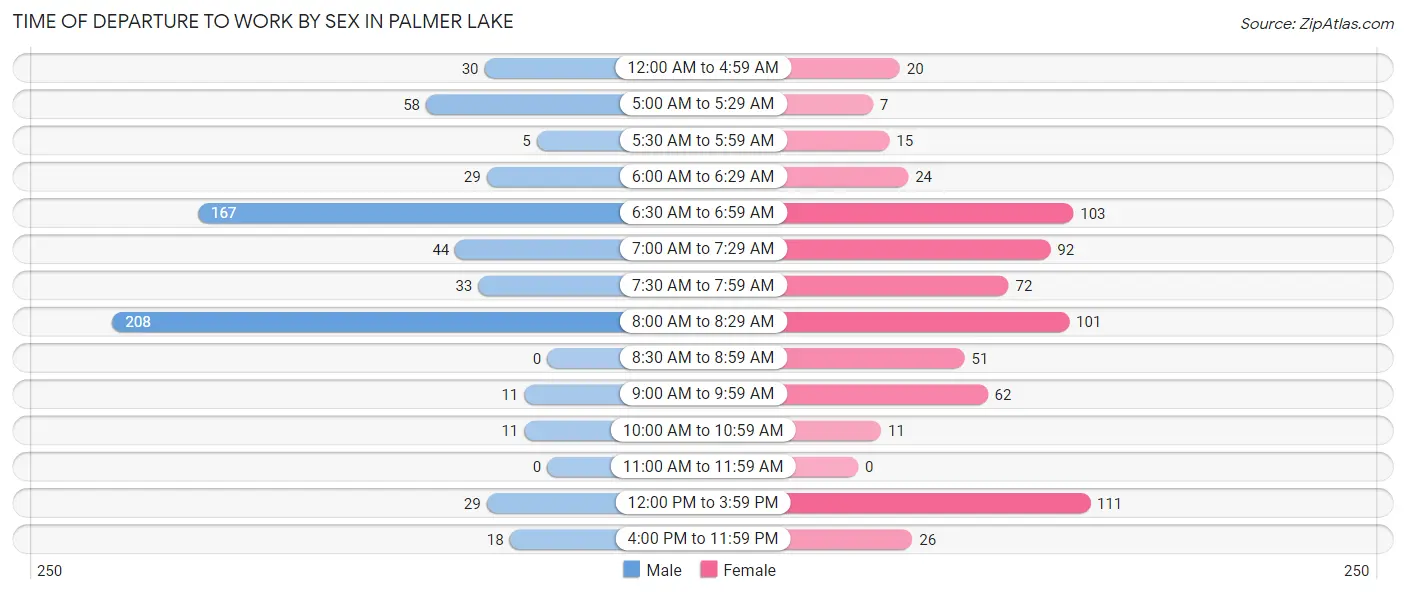
| Time of Departure | Male | Female |
| 12:00 AM to 4:59 AM | 30 (4.7%) | 20 (2.9%) |
| 5:00 AM to 5:29 AM | 58 (9.0%) | 7 (1.0%) |
| 5:30 AM to 5:59 AM | 5 (0.8%) | 15 (2.2%) |
| 6:00 AM to 6:29 AM | 29 (4.5%) | 24 (3.5%) |
| 6:30 AM to 6:59 AM | 167 (26.0%) | 103 (14.8%) |
| 7:00 AM to 7:29 AM | 44 (6.8%) | 92 (13.2%) |
| 7:30 AM to 7:59 AM | 33 (5.1%) | 72 (10.4%) |
| 8:00 AM to 8:29 AM | 208 (32.4%) | 101 (14.5%) |
| 8:30 AM to 8:59 AM | 0 (0.0%) | 51 (7.3%) |
| 9:00 AM to 9:59 AM | 11 (1.7%) | 62 (8.9%) |
| 10:00 AM to 10:59 AM | 11 (1.7%) | 11 (1.6%) |
| 11:00 AM to 11:59 AM | 0 (0.0%) | 0 (0.0%) |
| 12:00 PM to 3:59 PM | 29 (4.5%) | 111 (16.0%) |
| 4:00 PM to 11:59 PM | 18 (2.8%) | 26 (3.7%) |
| Total | 643 (100.0%) | 695 (100.0%) |
Housing Occupancy in Palmer Lake
Occupancy by Ownership in Palmer Lake
Of the total 1,107 dwellings in Palmer Lake, owner-occupied units account for 1,020 (92.1%), while renter-occupied units make up 87 (7.9%).
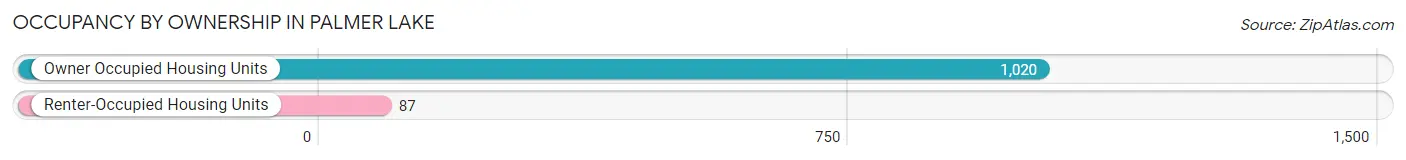
| Occupancy | # Housing Units | % Housing Units |
| Owner Occupied Housing Units | 1,020 | 92.1% |
| Renter-Occupied Housing Units | 87 | 7.9% |
| Total Occupied Housing Units | 1,107 | 100.0% |
Occupancy by Household Size in Palmer Lake
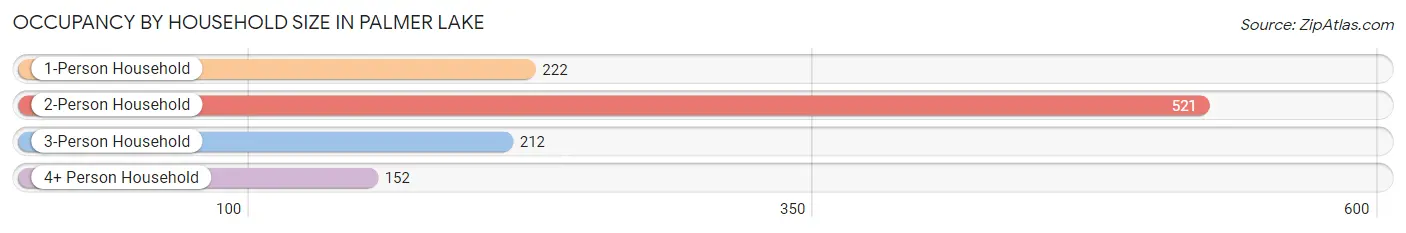
| Household Size | # Housing Units | % Housing Units |
| 1-Person Household | 222 | 20.1% |
| 2-Person Household | 521 | 47.1% |
| 3-Person Household | 212 | 19.2% |
| 4+ Person Household | 152 | 13.7% |
| Total Housing Units | 1,107 | 100.0% |
Occupancy by Ownership by Household Size in Palmer Lake
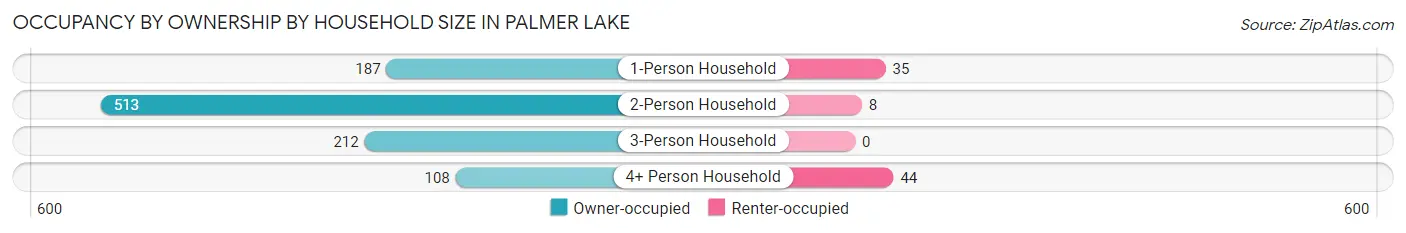
| Household Size | Owner-occupied | Renter-occupied |
| 1-Person Household | 187 (84.2%) | 35 (15.8%) |
| 2-Person Household | 513 (98.5%) | 8 (1.5%) |
| 3-Person Household | 212 (100.0%) | 0 (0.0%) |
| 4+ Person Household | 108 (71.1%) | 44 (28.9%) |
| Total Housing Units | 1,020 (92.1%) | 87 (7.9%) |
Occupancy by Educational Attainment in Palmer Lake
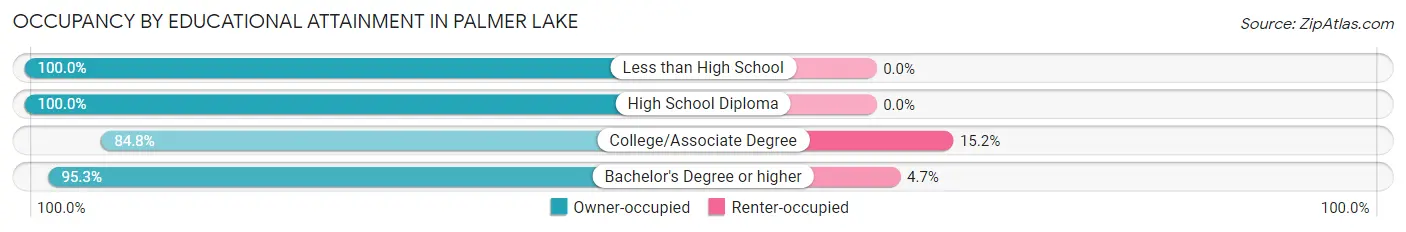
| Household Size | Owner-occupied | Renter-occupied |
| Less than High School | 17 (100.0%) | 0 (0.0%) |
| High School Diploma | 156 (100.0%) | 0 (0.0%) |
| College/Associate Degree | 345 (84.8%) | 62 (15.2%) |
| Bachelor's Degree or higher | 502 (95.3%) | 25 (4.7%) |
Occupancy by Age of Householder in Palmer Lake
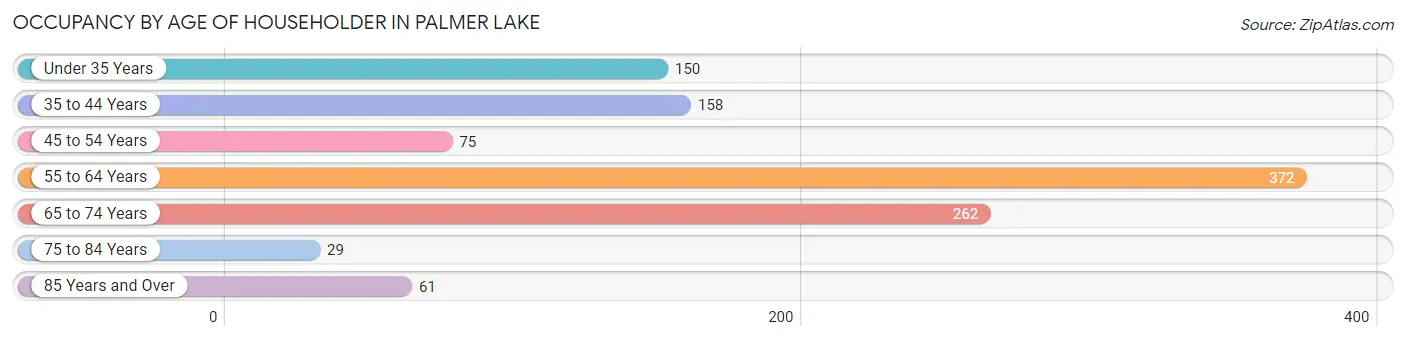
| Age Bracket | # Households | % Households |
| Under 35 Years | 150 | 13.6% |
| 35 to 44 Years | 158 | 14.3% |
| 45 to 54 Years | 75 | 6.8% |
| 55 to 64 Years | 372 | 33.6% |
| 65 to 74 Years | 262 | 23.7% |
| 75 to 84 Years | 29 | 2.6% |
| 85 Years and Over | 61 | 5.5% |
| Total | 1,107 | 100.0% |
Housing Finances in Palmer Lake
Median Income by Occupancy in Palmer Lake
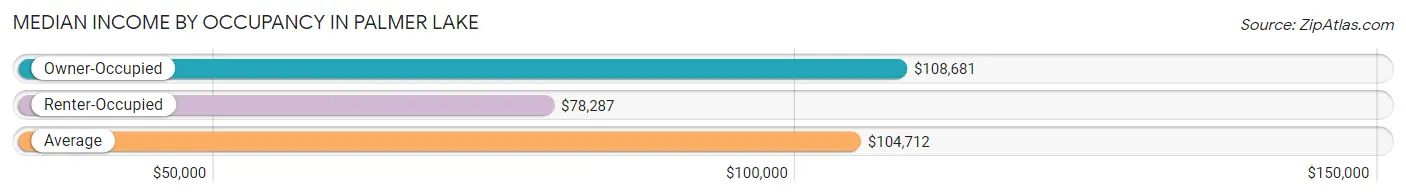
| Occupancy Type | # Households | Median Income |
| Owner-Occupied | 1,020 (92.1%) | $108,681 |
| Renter-Occupied | 87 (7.9%) | $78,287 |
| Average | 1,107 (100.0%) | $104,712 |
Occupancy by Householder Income Bracket in Palmer Lake
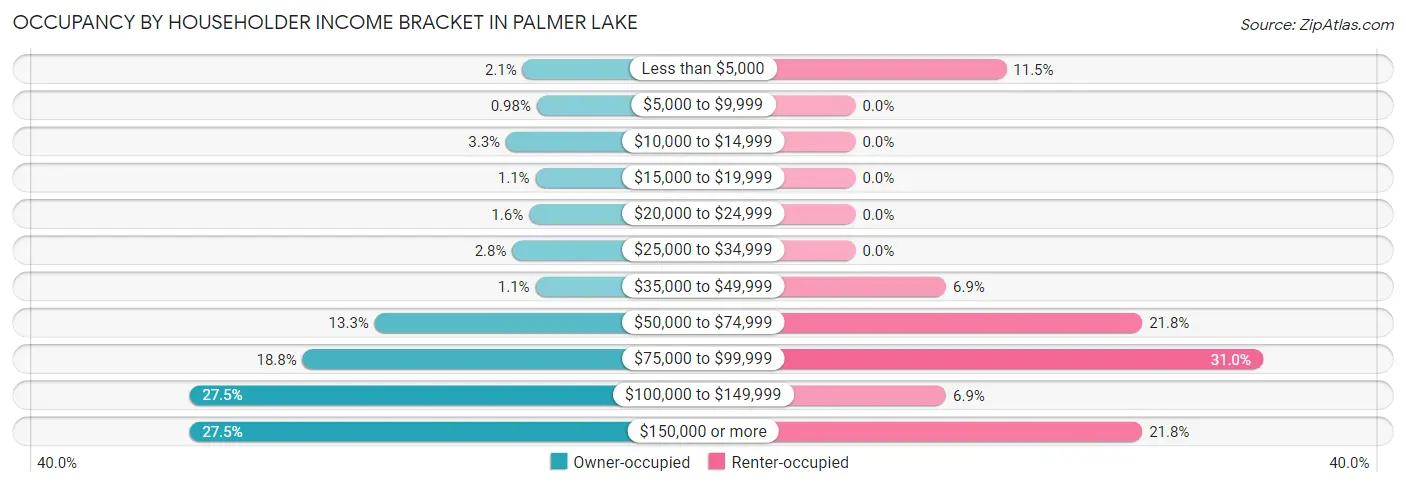
| Income Bracket | Owner-occupied | Renter-occupied |
| Less than $5,000 | 21 (2.1%) | 10 (11.5%) |
| $5,000 to $9,999 | 10 (1.0%) | 0 (0.0%) |
| $10,000 to $14,999 | 34 (3.3%) | 0 (0.0%) |
| $15,000 to $19,999 | 11 (1.1%) | 0 (0.0%) |
| $20,000 to $24,999 | 16 (1.6%) | 0 (0.0%) |
| $25,000 to $34,999 | 29 (2.8%) | 0 (0.0%) |
| $35,000 to $49,999 | 11 (1.1%) | 6 (6.9%) |
| $50,000 to $74,999 | 136 (13.3%) | 19 (21.8%) |
| $75,000 to $99,999 | 192 (18.8%) | 27 (31.0%) |
| $100,000 to $149,999 | 280 (27.5%) | 6 (6.9%) |
| $150,000 or more | 280 (27.5%) | 19 (21.8%) |
| Total | 1,020 (100.0%) | 87 (100.0%) |
Monthly Housing Cost Tiers in Palmer Lake
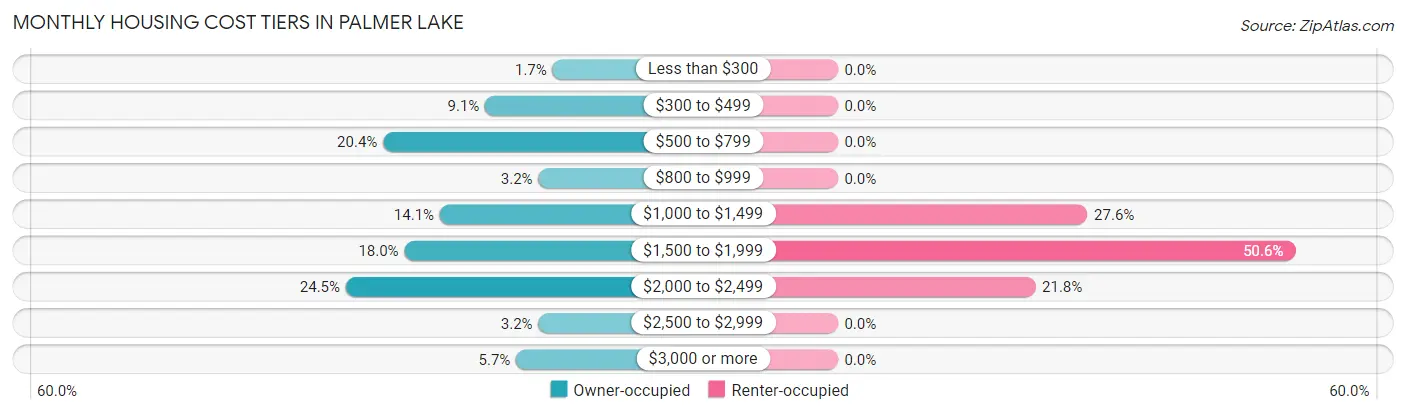
| Monthly Cost | Owner-occupied | Renter-occupied |
| Less than $300 | 17 (1.7%) | 0 (0.0%) |
| $300 to $499 | 93 (9.1%) | 0 (0.0%) |
| $500 to $799 | 208 (20.4%) | 0 (0.0%) |
| $800 to $999 | 33 (3.2%) | 0 (0.0%) |
| $1,000 to $1,499 | 144 (14.1%) | 24 (27.6%) |
| $1,500 to $1,999 | 184 (18.0%) | 44 (50.6%) |
| $2,000 to $2,499 | 250 (24.5%) | 19 (21.8%) |
| $2,500 to $2,999 | 33 (3.2%) | 0 (0.0%) |
| $3,000 or more | 58 (5.7%) | 0 (0.0%) |
| Total | 1,020 (100.0%) | 87 (100.0%) |
Physical Housing Characteristics in Palmer Lake
Housing Structures in Palmer Lake
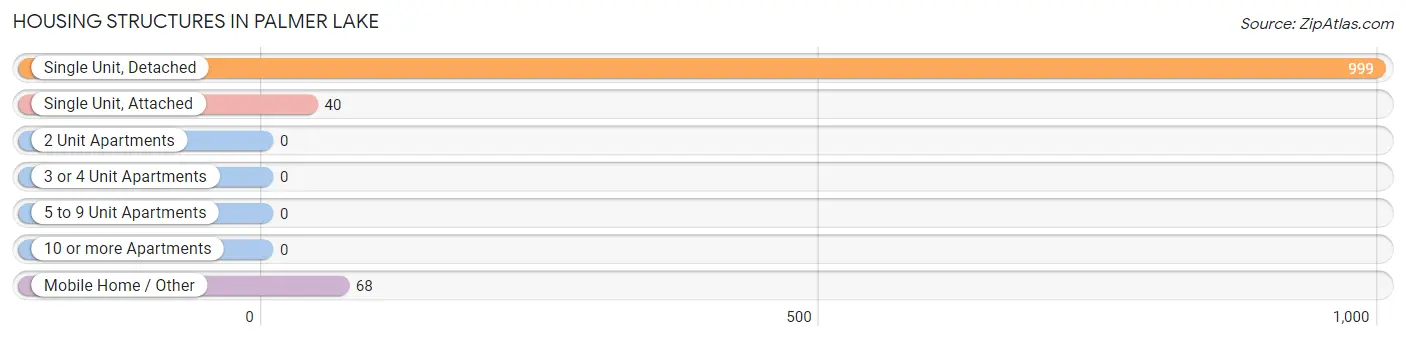
| Structure Type | # Housing Units | % Housing Units |
| Single Unit, Detached | 999 | 90.2% |
| Single Unit, Attached | 40 | 3.6% |
| 2 Unit Apartments | 0 | 0.0% |
| 3 or 4 Unit Apartments | 0 | 0.0% |
| 5 to 9 Unit Apartments | 0 | 0.0% |
| 10 or more Apartments | 0 | 0.0% |
| Mobile Home / Other | 68 | 6.1% |
| Total | 1,107 | 100.0% |
Housing Structures by Occupancy in Palmer Lake
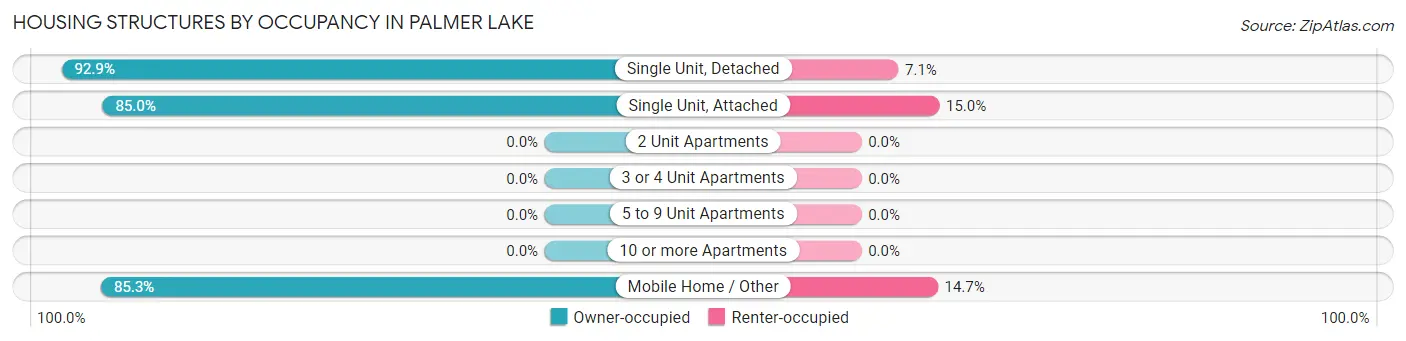
| Structure Type | Owner-occupied | Renter-occupied |
| Single Unit, Detached | 928 (92.9%) | 71 (7.1%) |
| Single Unit, Attached | 34 (85.0%) | 6 (15.0%) |
| 2 Unit Apartments | 0 (0.0%) | 0 (0.0%) |
| 3 or 4 Unit Apartments | 0 (0.0%) | 0 (0.0%) |
| 5 to 9 Unit Apartments | 0 (0.0%) | 0 (0.0%) |
| 10 or more Apartments | 0 (0.0%) | 0 (0.0%) |
| Mobile Home / Other | 58 (85.3%) | 10 (14.7%) |
| Total | 1,020 (92.1%) | 87 (7.9%) |
Housing Structures by Number of Rooms in Palmer Lake
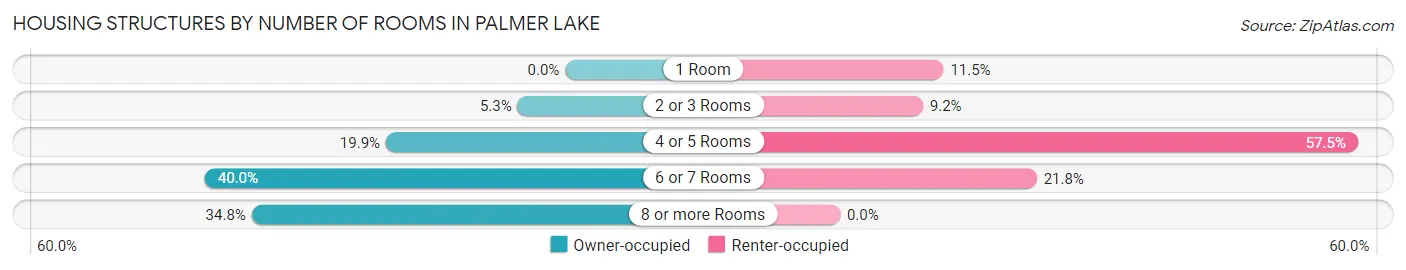
| Number of Rooms | Owner-occupied | Renter-occupied |
| 1 Room | 0 (0.0%) | 10 (11.5%) |
| 2 or 3 Rooms | 54 (5.3%) | 8 (9.2%) |
| 4 or 5 Rooms | 203 (19.9%) | 50 (57.5%) |
| 6 or 7 Rooms | 408 (40.0%) | 19 (21.8%) |
| 8 or more Rooms | 355 (34.8%) | 0 (0.0%) |
| Total | 1,020 (100.0%) | 87 (100.0%) |
Housing Structure by Heating Type in Palmer Lake
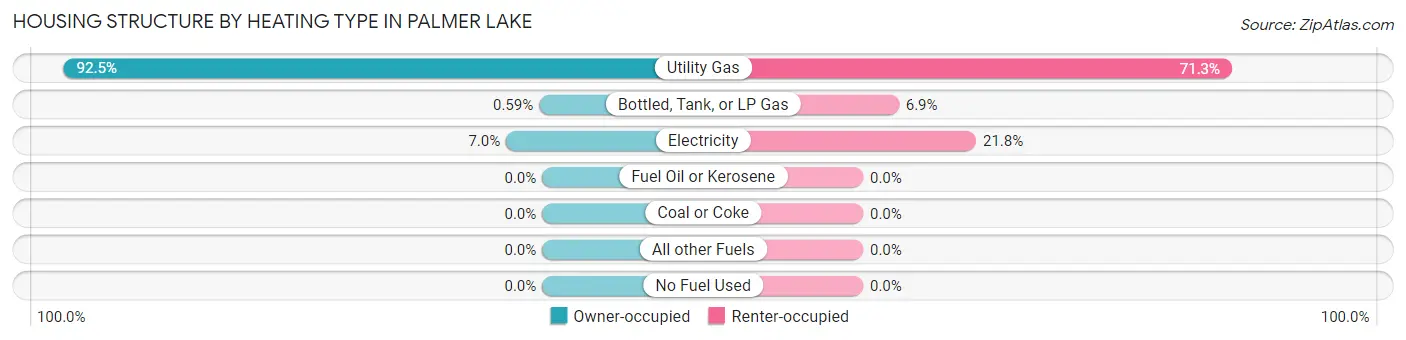
| Heating Type | Owner-occupied | Renter-occupied |
| Utility Gas | 943 (92.4%) | 62 (71.3%) |
| Bottled, Tank, or LP Gas | 6 (0.6%) | 6 (6.9%) |
| Electricity | 71 (7.0%) | 19 (21.8%) |
| Fuel Oil or Kerosene | 0 (0.0%) | 0 (0.0%) |
| Coal or Coke | 0 (0.0%) | 0 (0.0%) |
| All other Fuels | 0 (0.0%) | 0 (0.0%) |
| No Fuel Used | 0 (0.0%) | 0 (0.0%) |
| Total | 1,020 (100.0%) | 87 (100.0%) |
Household Vehicle Usage in Palmer Lake
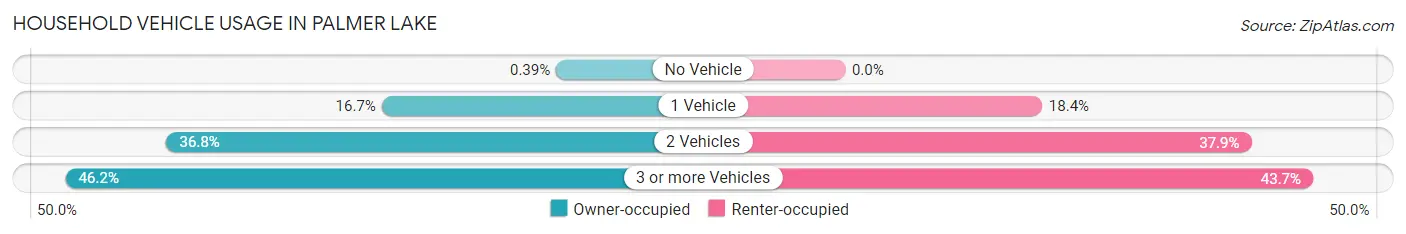
| Vehicles per Household | Owner-occupied | Renter-occupied |
| No Vehicle | 4 (0.4%) | 0 (0.0%) |
| 1 Vehicle | 170 (16.7%) | 16 (18.4%) |
| 2 Vehicles | 375 (36.8%) | 33 (37.9%) |
| 3 or more Vehicles | 471 (46.2%) | 38 (43.7%) |
| Total | 1,020 (100.0%) | 87 (100.0%) |
Real Estate & Mortgages in Palmer Lake
Real Estate and Mortgage Overview in Palmer Lake
| Characteristic | Without Mortgage | With Mortgage |
| Housing Units | 317 | 703 |
| Median Property Value | $382,700 | $401,700 |
| Median Household Income | $79,122 | $200 |
| Monthly Housing Costs | $603 | $58 |
| Real Estate Taxes | $1,349 | $0 |
Property Value by Mortgage Status in Palmer Lake
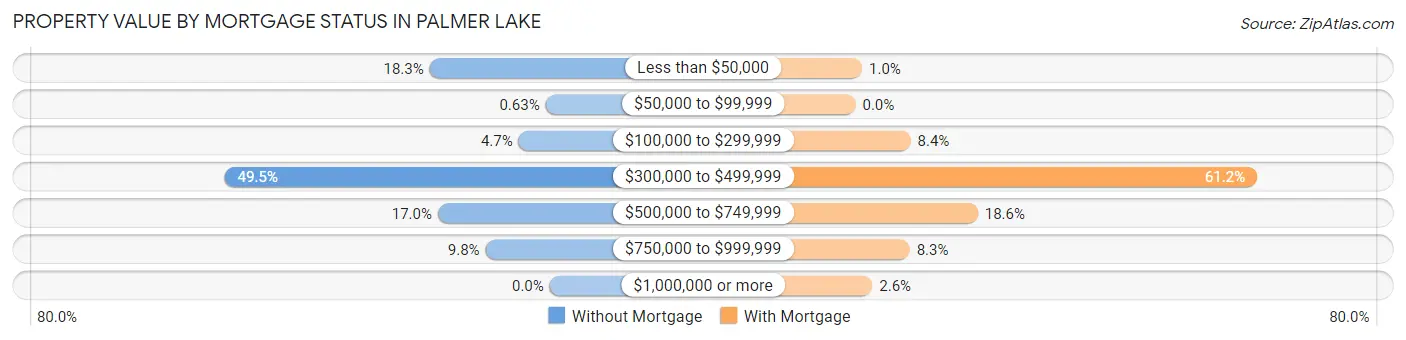
| Property Value | Without Mortgage | With Mortgage |
| Less than $50,000 | 58 (18.3%) | 7 (1.0%) |
| $50,000 to $99,999 | 2 (0.6%) | 0 (0.0%) |
| $100,000 to $299,999 | 15 (4.7%) | 59 (8.4%) |
| $300,000 to $499,999 | 157 (49.5%) | 430 (61.2%) |
| $500,000 to $749,999 | 54 (17.0%) | 131 (18.6%) |
| $750,000 to $999,999 | 31 (9.8%) | 58 (8.3%) |
| $1,000,000 or more | 0 (0.0%) | 18 (2.6%) |
| Total | 317 (100.0%) | 703 (100.0%) |
Household Income by Mortgage Status in Palmer Lake
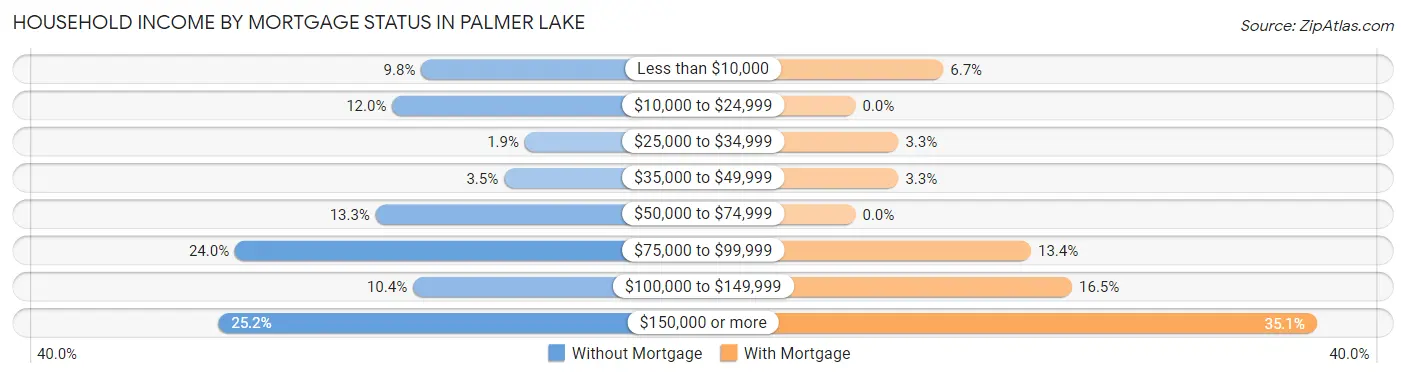
| Household Income | Without Mortgage | With Mortgage |
| Less than $10,000 | 31 (9.8%) | 47 (6.7%) |
| $10,000 to $24,999 | 38 (12.0%) | 0 (0.0%) |
| $25,000 to $34,999 | 6 (1.9%) | 23 (3.3%) |
| $35,000 to $49,999 | 11 (3.5%) | 23 (3.3%) |
| $50,000 to $74,999 | 42 (13.3%) | 0 (0.0%) |
| $75,000 to $99,999 | 76 (24.0%) | 94 (13.4%) |
| $100,000 to $149,999 | 33 (10.4%) | 116 (16.5%) |
| $150,000 or more | 80 (25.2%) | 247 (35.1%) |
| Total | 317 (100.0%) | 703 (100.0%) |
Property Value to Household Income Ratio in Palmer Lake
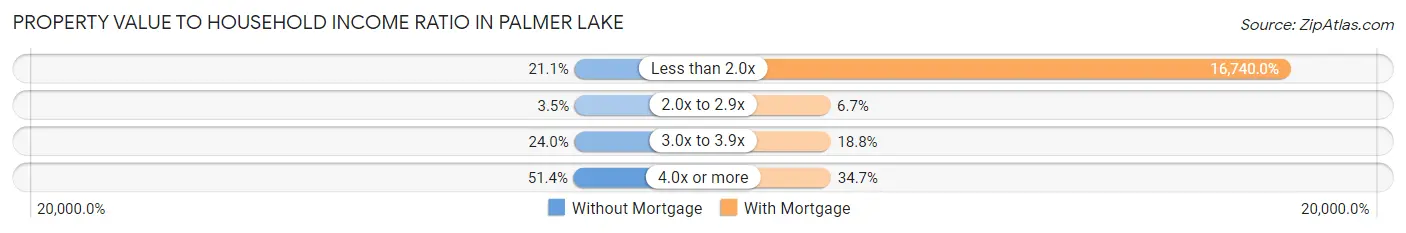
| Value-to-Income Ratio | Without Mortgage | With Mortgage |
| Less than 2.0x | 67 (21.1%) | 117,682 (16,740.0%) |
| 2.0x to 2.9x | 11 (3.5%) | 47 (6.7%) |
| 3.0x to 3.9x | 76 (24.0%) | 132 (18.8%) |
| 4.0x or more | 163 (51.4%) | 244 (34.7%) |
| Total | 317 (100.0%) | 703 (100.0%) |
Real Estate Taxes by Mortgage Status in Palmer Lake
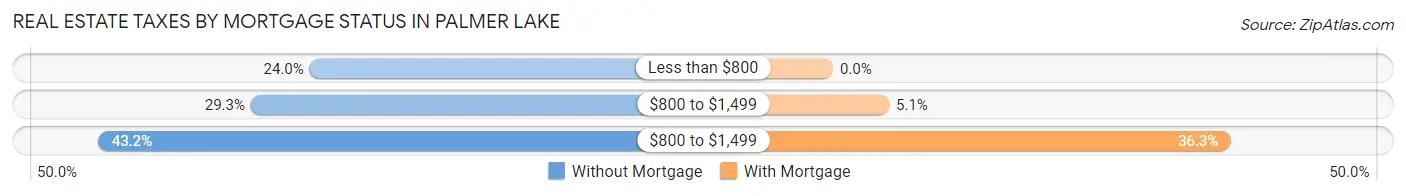
| Property Taxes | Without Mortgage | With Mortgage |
| Less than $800 | 76 (24.0%) | 0 (0.0%) |
| $800 to $1,499 | 93 (29.3%) | 36 (5.1%) |
| $800 to $1,499 | 137 (43.2%) | 255 (36.3%) |
| Total | 317 (100.0%) | 703 (100.0%) |
Health & Disability in Palmer Lake
Health Insurance Coverage by Age in Palmer Lake
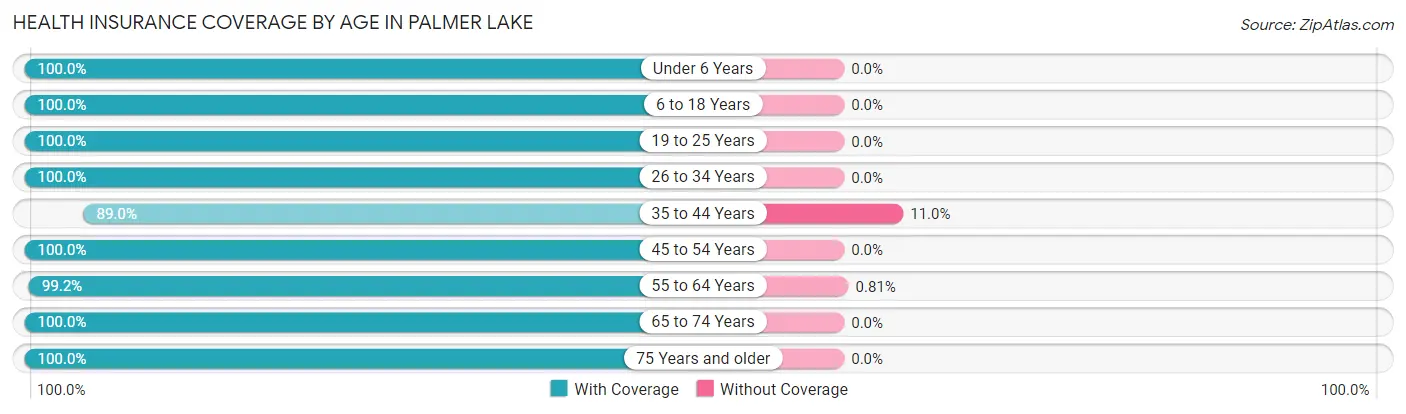
| Age Bracket | With Coverage | Without Coverage |
| Under 6 Years | 76 (100.0%) | 0 (0.0%) |
| 6 to 18 Years | 250 (100.0%) | 0 (0.0%) |
| 19 to 25 Years | 188 (100.0%) | 0 (0.0%) |
| 26 to 34 Years | 352 (100.0%) | 0 (0.0%) |
| 35 to 44 Years | 267 (89.0%) | 33 (11.0%) |
| 45 to 54 Years | 156 (100.0%) | 0 (0.0%) |
| 55 to 64 Years | 737 (99.2%) | 6 (0.8%) |
| 65 to 74 Years | 403 (100.0%) | 0 (0.0%) |
| 75 Years and older | 167 (100.0%) | 0 (0.0%) |
| Total | 2,596 (98.5%) | 39 (1.5%) |
Health Insurance Coverage by Citizenship Status in Palmer Lake
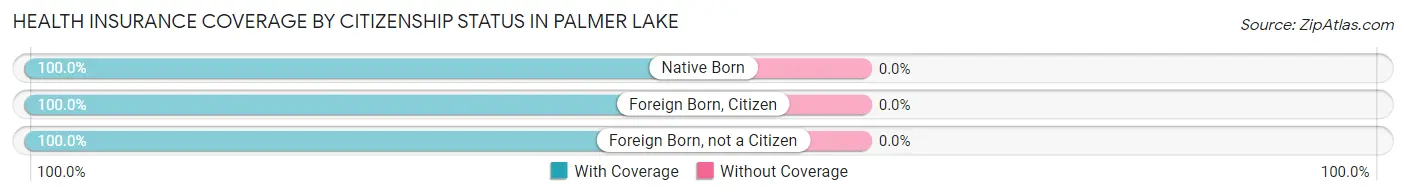
| Citizenship Status | With Coverage | Without Coverage |
| Native Born | 76 (100.0%) | 0 (0.0%) |
| Foreign Born, Citizen | 250 (100.0%) | 0 (0.0%) |
| Foreign Born, not a Citizen | 188 (100.0%) | 0 (0.0%) |
Health Insurance Coverage by Household Income in Palmer Lake
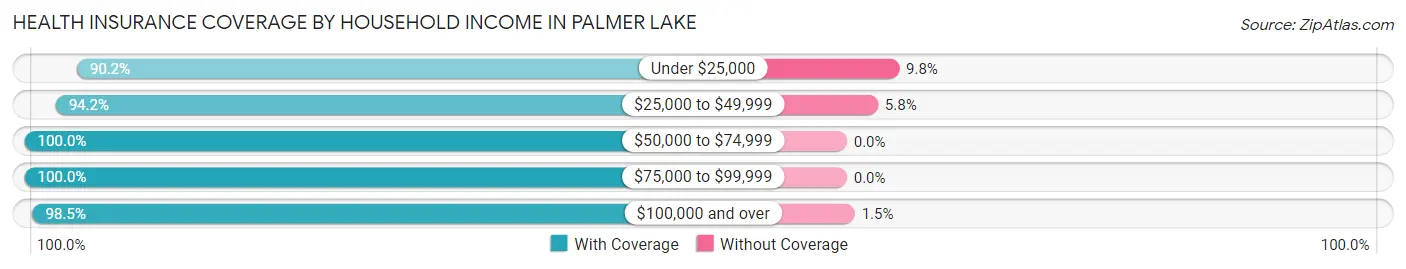
| Household Income | With Coverage | Without Coverage |
| Under $25,000 | 92 (90.2%) | 10 (9.8%) |
| $25,000 to $49,999 | 97 (94.2%) | 6 (5.8%) |
| $50,000 to $74,999 | 454 (100.0%) | 0 (0.0%) |
| $75,000 to $99,999 | 414 (100.0%) | 0 (0.0%) |
| $100,000 and over | 1,535 (98.5%) | 23 (1.5%) |
Public vs Private Health Insurance Coverage by Age in Palmer Lake
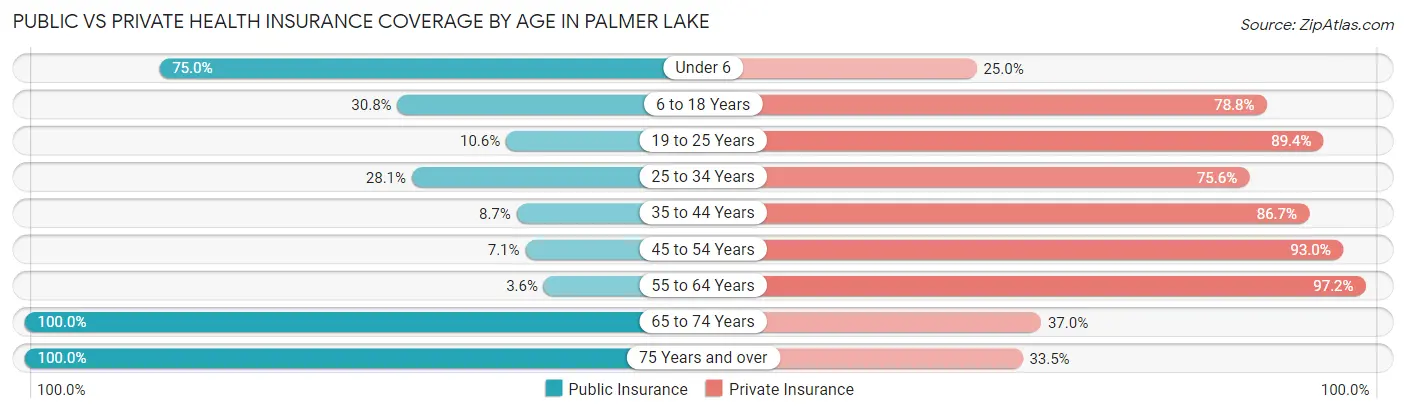
| Age Bracket | Public Insurance | Private Insurance |
| Under 6 | 57 (75.0%) | 19 (25.0%) |
| 6 to 18 Years | 77 (30.8%) | 197 (78.8%) |
| 19 to 25 Years | 20 (10.6%) | 168 (89.4%) |
| 25 to 34 Years | 99 (28.1%) | 266 (75.6%) |
| 35 to 44 Years | 26 (8.7%) | 260 (86.7%) |
| 45 to 54 Years | 11 (7.0%) | 145 (92.9%) |
| 55 to 64 Years | 27 (3.6%) | 722 (97.2%) |
| 65 to 74 Years | 403 (100.0%) | 149 (37.0%) |
| 75 Years and over | 167 (100.0%) | 56 (33.5%) |
| Total | 887 (33.7%) | 1,982 (75.2%) |
Disability Status by Sex by Age in Palmer Lake
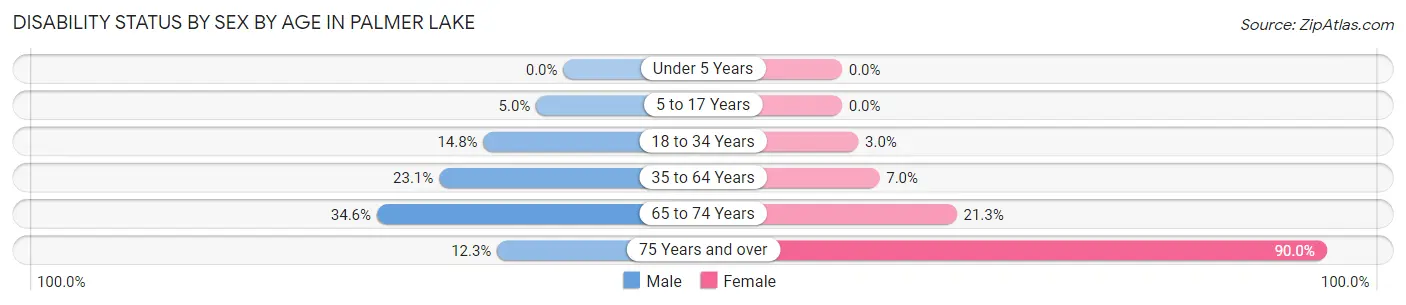
| Age Bracket | Male | Female |
| Under 5 Years | 0 (0.0%) | 0 (0.0%) |
| 5 to 17 Years | 6 (5.0%) | 0 (0.0%) |
| 18 to 34 Years | 47 (14.8%) | 8 (3.0%) |
| 35 to 64 Years | 134 (23.1%) | 43 (7.0%) |
| 65 to 74 Years | 81 (34.6%) | 36 (21.3%) |
| 75 Years and over | 7 (12.3%) | 99 (90.0%) |
Disability Class by Sex by Age in Palmer Lake
Disability Class: Hearing Difficulty
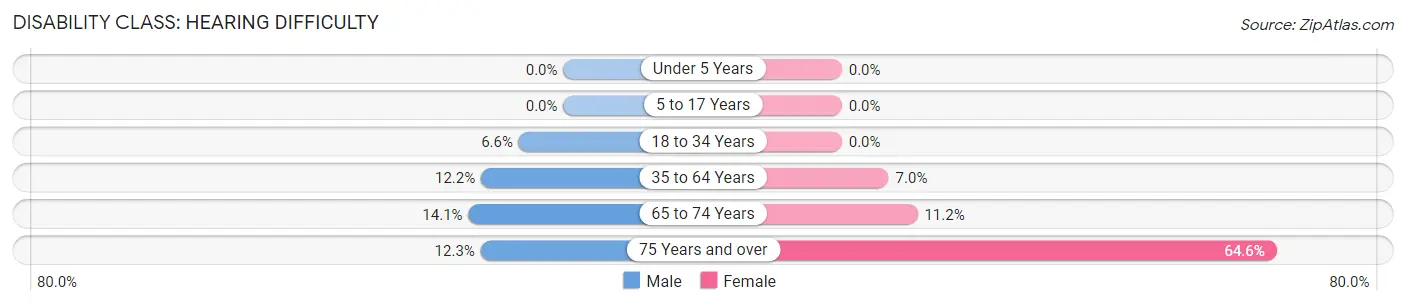
| Age Bracket | Male | Female |
| Under 5 Years | 0 (0.0%) | 0 (0.0%) |
| 5 to 17 Years | 0 (0.0%) | 0 (0.0%) |
| 18 to 34 Years | 21 (6.6%) | 0 (0.0%) |
| 35 to 64 Years | 71 (12.2%) | 43 (7.0%) |
| 65 to 74 Years | 33 (14.1%) | 19 (11.2%) |
| 75 Years and over | 7 (12.3%) | 71 (64.5%) |
Disability Class: Vision Difficulty
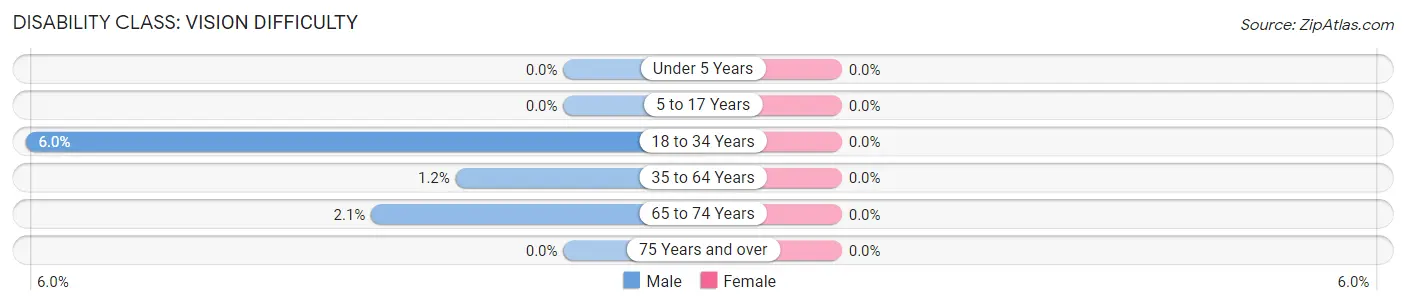
| Age Bracket | Male | Female |
| Under 5 Years | 0 (0.0%) | 0 (0.0%) |
| 5 to 17 Years | 0 (0.0%) | 0 (0.0%) |
| 18 to 34 Years | 19 (6.0%) | 0 (0.0%) |
| 35 to 64 Years | 7 (1.2%) | 0 (0.0%) |
| 65 to 74 Years | 5 (2.1%) | 0 (0.0%) |
| 75 Years and over | 0 (0.0%) | 0 (0.0%) |
Disability Class: Cognitive Difficulty
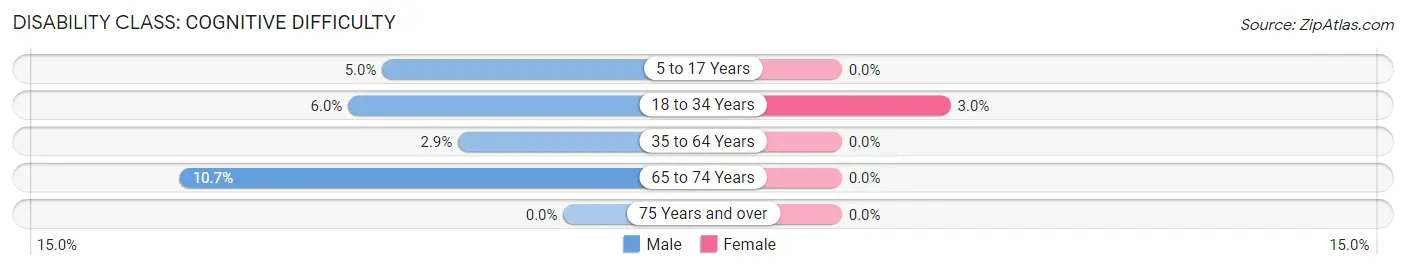
| Age Bracket | Male | Female |
| 5 to 17 Years | 6 (5.0%) | 0 (0.0%) |
| 18 to 34 Years | 19 (6.0%) | 8 (3.0%) |
| 35 to 64 Years | 17 (2.9%) | 0 (0.0%) |
| 65 to 74 Years | 25 (10.7%) | 0 (0.0%) |
| 75 Years and over | 0 (0.0%) | 0 (0.0%) |
Disability Class: Ambulatory Difficulty
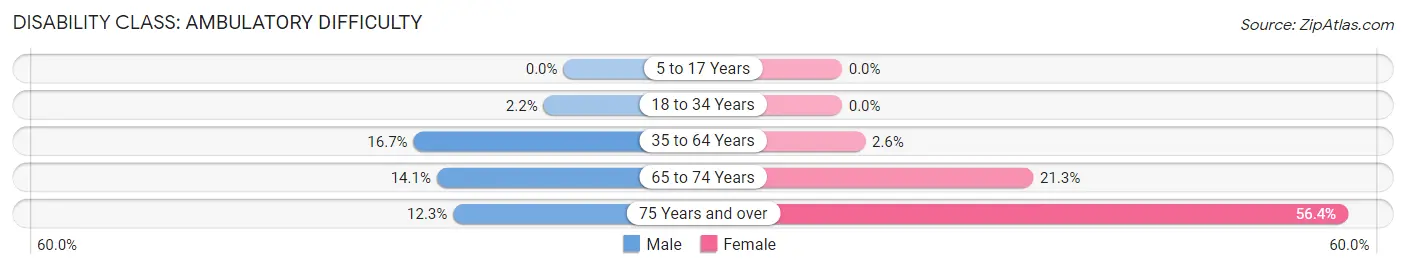
| Age Bracket | Male | Female |
| 5 to 17 Years | 0 (0.0%) | 0 (0.0%) |
| 18 to 34 Years | 7 (2.2%) | 0 (0.0%) |
| 35 to 64 Years | 97 (16.7%) | 16 (2.6%) |
| 65 to 74 Years | 33 (14.1%) | 36 (21.3%) |
| 75 Years and over | 7 (12.3%) | 62 (56.4%) |
Disability Class: Self-Care Difficulty
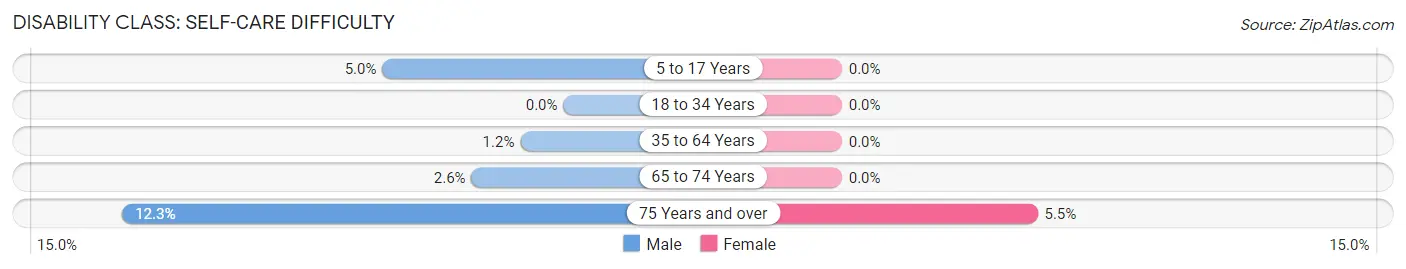
| Age Bracket | Male | Female |
| 5 to 17 Years | 6 (5.0%) | 0 (0.0%) |
| 18 to 34 Years | 0 (0.0%) | 0 (0.0%) |
| 35 to 64 Years | 7 (1.2%) | 0 (0.0%) |
| 65 to 74 Years | 6 (2.6%) | 0 (0.0%) |
| 75 Years and over | 7 (12.3%) | 6 (5.4%) |
Technology Access in Palmer Lake
Computing Device Access in Palmer Lake
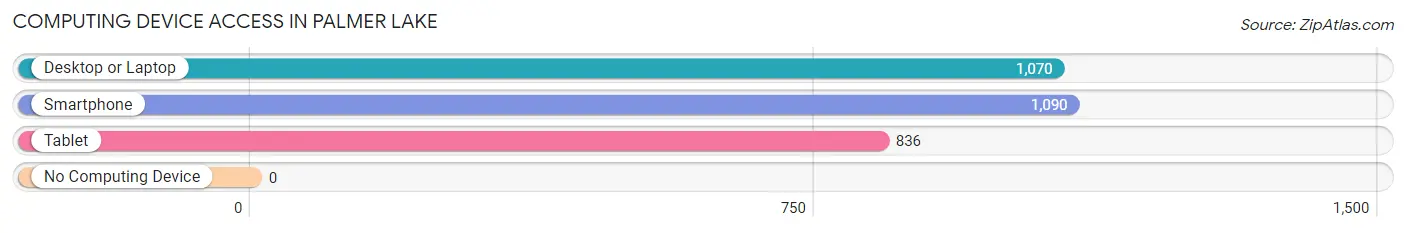
| Device Type | # Households | % Households |
| Desktop or Laptop | 1,070 | 96.7% |
| Smartphone | 1,090 | 98.5% |
| Tablet | 836 | 75.5% |
| No Computing Device | 0 | 0.0% |
| Total | 1,107 | 100.0% |
Internet Access in Palmer Lake
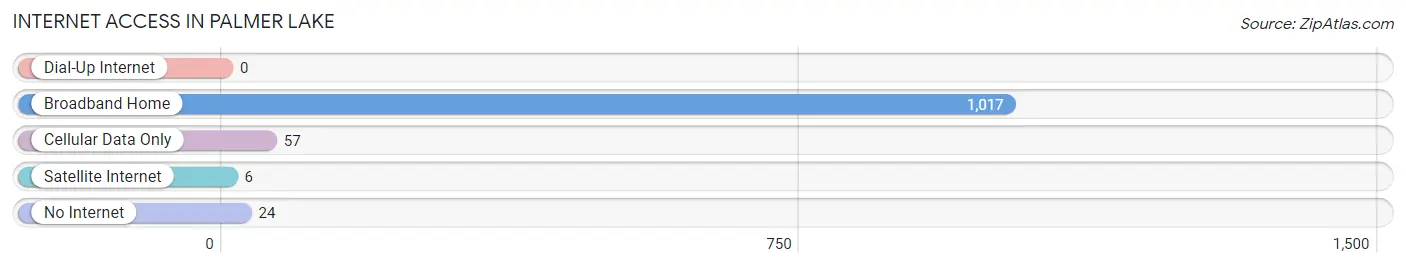
| Internet Type | # Households | % Households |
| Dial-Up Internet | 0 | 0.0% |
| Broadband Home | 1,017 | 91.9% |
| Cellular Data Only | 57 | 5.1% |
| Satellite Internet | 6 | 0.5% |
| No Internet | 24 | 2.2% |
| Total | 1,107 | 100.0% |
Palmer Lake Summary
Palmer Lake is a small town located in El Paso County, Colorado, United States. It is situated at the base of the Rocky Mountains, approximately 20 miles north of Colorado Springs. The town was founded in 1871 by General William Jackson Palmer, a Civil War veteran and founder of the Denver and Rio Grande Railroad. The town was named after Palmer, who had a summer home in the area.
History
The area around Palmer Lake was originally inhabited by the Ute Indians. In 1871, General William Jackson Palmer founded the town of Palmer Lake. He had a summer home in the area and named the town after himself. The town was incorporated in 1891 and was a popular summer resort for wealthy Denverites.
In the early 1900s, the town was a popular destination for tourists. The Denver and Rio Grande Railroad ran a line to the town, and the Palmer Lake Hotel was built in 1906. The hotel was a popular destination for visitors, and the town was known for its mineral springs.
In the 1920s, the town began to decline as a tourist destination. The Great Depression hit the town hard, and many of the businesses closed. The town was revitalized in the 1950s when the Air Force Academy was built nearby. The town experienced a population boom, and many new businesses opened.
Geography
Palmer Lake is located in El Paso County, Colorado, at the base of the Rocky Mountains. The town is situated at an elevation of 6,845 feet above sea level. The town is surrounded by mountains, including Mount Herman, Mount Muscoco, and Mount Garfield. The town is located approximately 20 miles north of Colorado Springs.
The town is located in a semi-arid climate, with hot summers and cold winters. The average annual temperature is 52 degrees Fahrenheit, and the average annual precipitation is 16 inches.
Economy
The economy of Palmer Lake is largely based on tourism. The town is a popular destination for outdoor activities, such as hiking, camping, fishing, and skiing. The town is also home to several businesses, including restaurants, shops, and galleries.
The town is also home to several manufacturing companies, including a plastics manufacturer and a metal fabrication company. The town is also home to a number of technology companies, including a software development company and a web design firm.
Demographics
As of the 2010 census, the population of Palmer Lake was 1,717. The population is predominantly white, with a small Hispanic population. The median household income is $60,000, and the median home value is $250,000.
The town is served by the Palmer Lake School District, which includes two elementary schools, a middle school, and a high school. The town is also home to a branch of the University of Colorado Colorado Springs.
Conclusion
Palmer Lake is a small town located in El Paso County, Colorado, at the base of the Rocky Mountains. The town was founded in 1871 by General William Jackson Palmer, and was a popular summer resort for wealthy Denverites in the early 1900s. The town experienced a population boom in the 1950s when the Air Force Academy was built nearby. The economy of Palmer Lake is largely based on tourism, and the town is home to several businesses, manufacturing companies, and technology companies. The population of Palmer Lake is predominantly white, with a small Hispanic population. The town is served by the Palmer Lake School District, and is home to a branch of the University of Colorado Colorado Springs.
Common Questions
What is Per Capita Income in Palmer Lake?
Per Capita income in Palmer Lake is $48,290.
What is the Median Family Income in Palmer Lake?
Median Family Income in Palmer Lake is $113,229.
What is the Median Household income in Palmer Lake?
Median Household Income in Palmer Lake is $104,712.
What is Income or Wage Gap in Palmer Lake?
Income or Wage Gap in Palmer Lake is 20.4%.
Women in Palmer Lake earn 79.6 cents for every dollar earned by a man.
What is Inequality or Gini Index in Palmer Lake?
Inequality or Gini Index in Palmer Lake is 0.34.
What is the Total Population of Palmer Lake?
Total Population of Palmer Lake is 2,642.
What is the Total Male Population of Palmer Lake?
Total Male Population of Palmer Lake is 1,349.
What is the Total Female Population of Palmer Lake?
Total Female Population of Palmer Lake is 1,293.
What is the Ratio of Males per 100 Females in Palmer Lake?
There are 104.33 Males per 100 Females in Palmer Lake.
What is the Ratio of Females per 100 Males in Palmer Lake?
There are 95.85 Females per 100 Males in Palmer Lake.
What is the Median Population Age in Palmer Lake?
Median Population Age in Palmer Lake is 54.5 Years.
What is the Average Family Size in Palmer Lake
Average Family Size in Palmer Lake is 2.7 People.
What is the Average Household Size in Palmer Lake
Average Household Size in Palmer Lake is 2.4 People.
How Large is the Labor Force in Palmer Lake?
There are 1,631 People in the Labor Forcein in Palmer Lake.
What is the Percentage of People in the Labor Force in Palmer Lake?
68.0% of People are in the Labor Force in Palmer Lake.
What is the Unemployment Rate in Palmer Lake?
Unemployment Rate in Palmer Lake is 7.0%.