Monument, CO Map & Demographics
Monument Map
Monument Overview
$44,556
PER CAPITA INCOME
$126,866
AVG FAMILY INCOME
$102,969
AVG HOUSEHOLD INCOME
37.8%
WAGE / INCOME GAP [ % ]
62.2¢/ $1
WAGE / INCOME GAP [ $ ]
$9,704
FAMILY INCOME DEFICIT
0.40
INEQUALITY / GINI INDEX
10,548
TOTAL POPULATION
5,250
MALE POPULATION
5,298
FEMALE POPULATION
99.09
MALES / 100 FEMALES
100.91
FEMALES / 100 MALES
38.3
MEDIAN AGE
3.3
AVG FAMILY SIZE
2.8
AVG HOUSEHOLD SIZE
5,535
LABOR FORCE [ PEOPLE ]
69.9%
PERCENT IN LABOR FORCE
4.9%
UNEMPLOYMENT RATE
Monument Zip Codes
Monument Area Codes
Income in Monument
Income Overview in Monument
Per Capita Income in Monument is $44,556, while median incomes of families and households are $126,866 and $102,969 respectively.
| Characteristic | Number | Measure |
| Per Capita Income | 10,548 | $44,556 |
| Median Family Income | 2,816 | $126,866 |
| Mean Family Income | 2,816 | $148,225 |
| Median Household Income | 3,798 | $102,969 |
| Mean Household Income | 3,798 | $122,357 |
| Income Deficit | 2,816 | $9,704 |
| Wage / Income Gap (%) | 10,548 | 37.84% |
| Wage / Income Gap ($) | 10,548 | 62.16¢ per $1 |
| Gini / Inequality Index | 10,548 | 0.40 |
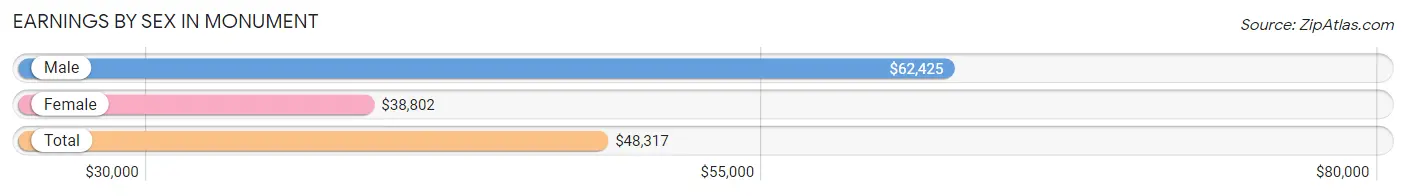
Earnings by Sex in Monument
Average Earnings in Monument are $48,317, $62,425 for men and $38,802 for women, a difference of 37.8%.
| Sex | Number | Average Earnings |
| Male | 2,904 (51.5%) | $62,425 |
| Female | 2,730 (48.5%) | $38,802 |
| Total | 5,634 (100.0%) | $48,317 |
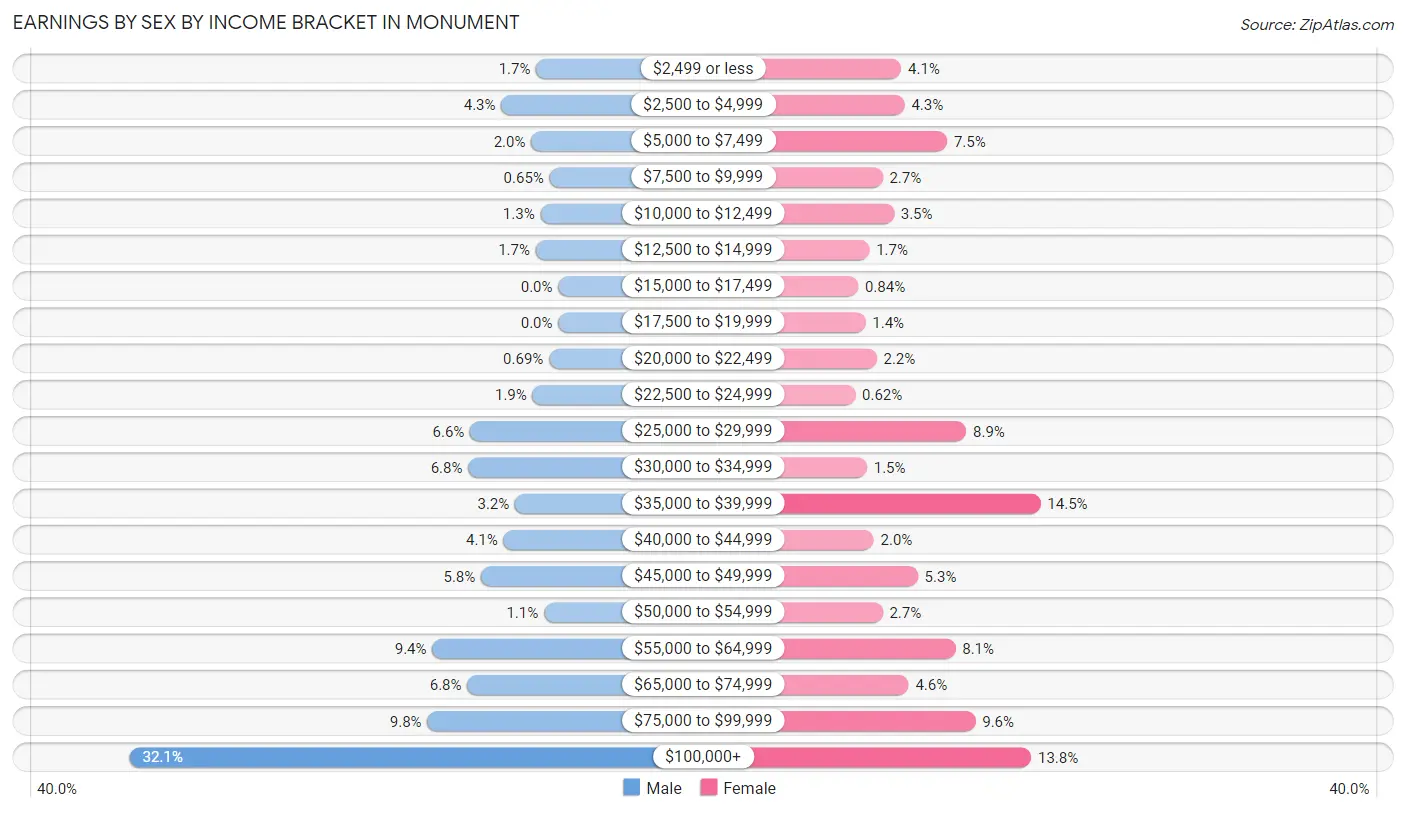
Earnings by Sex by Income Bracket in Monument
The most common earnings brackets in Monument are $100,000+ for men (933 | 32.1%) and $35,000 to $39,999 for women (396 | 14.5%).
| Income | Male | Female |
| $2,499 or less | 48 (1.7%) | 111 (4.1%) |
| $2,500 to $4,999 | 124 (4.3%) | 118 (4.3%) |
| $5,000 to $7,499 | 59 (2.0%) | 205 (7.5%) |
| $7,500 to $9,999 | 19 (0.6%) | 73 (2.7%) |
| $10,000 to $12,499 | 39 (1.3%) | 96 (3.5%) |
| $12,500 to $14,999 | 49 (1.7%) | 46 (1.7%) |
| $15,000 to $17,499 | 0 (0.0%) | 23 (0.8%) |
| $17,500 to $19,999 | 0 (0.0%) | 38 (1.4%) |
| $20,000 to $22,499 | 20 (0.7%) | 61 (2.2%) |
| $22,500 to $24,999 | 56 (1.9%) | 17 (0.6%) |
| $25,000 to $29,999 | 192 (6.6%) | 244 (8.9%) |
| $30,000 to $34,999 | 196 (6.8%) | 41 (1.5%) |
| $35,000 to $39,999 | 94 (3.2%) | 396 (14.5%) |
| $40,000 to $44,999 | 119 (4.1%) | 55 (2.0%) |
| $45,000 to $49,999 | 168 (5.8%) | 145 (5.3%) |
| $50,000 to $54,999 | 31 (1.1%) | 73 (2.7%) |
| $55,000 to $64,999 | 274 (9.4%) | 222 (8.1%) |
| $65,000 to $74,999 | 198 (6.8%) | 126 (4.6%) |
| $75,000 to $99,999 | 285 (9.8%) | 263 (9.6%) |
| $100,000+ | 933 (32.1%) | 377 (13.8%) |
| Total | 2,904 (100.0%) | 2,730 (100.0%) |
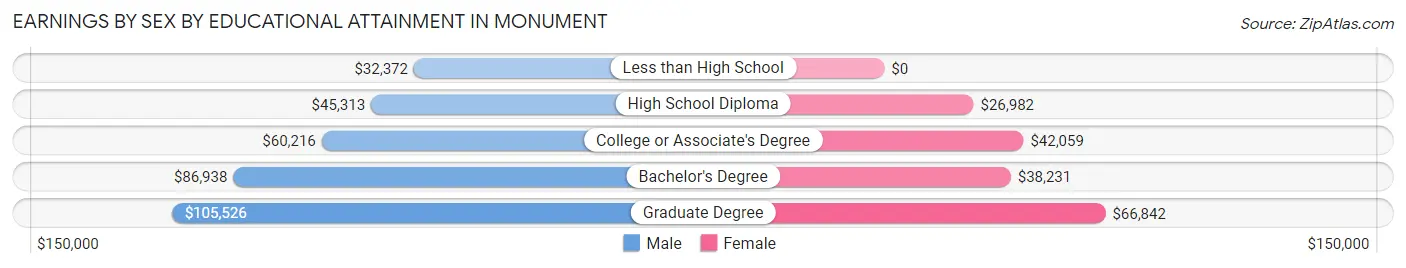
Earnings by Sex by Educational Attainment in Monument
Average earnings in Monument are $73,611 for men and $42,661 for women, a difference of 42.0%. Men with an educational attainment of graduate degree enjoy the highest average annual earnings of $105,526, while those with less than high school education earn the least with $32,372. Women with an educational attainment of graduate degree earn the most with the average annual earnings of $66,842, while those with high school diploma education have the smallest earnings of $26,982.
| Educational Attainment | Male Income | Female Income |
| Less than High School | $32,372 | $0 |
| High School Diploma | $45,313 | $26,982 |
| College or Associate's Degree | $60,216 | $42,059 |
| Bachelor's Degree | $86,938 | $38,231 |
| Graduate Degree | $105,526 | $66,842 |
| Total | $73,611 | $42,661 |
Family Income in Monument
Family Income Brackets in Monument
According to the Monument family income data, there are 749 families falling into the $100,000 to $149,999 income range, which is the most common income bracket and makes up 26.6% of all families.
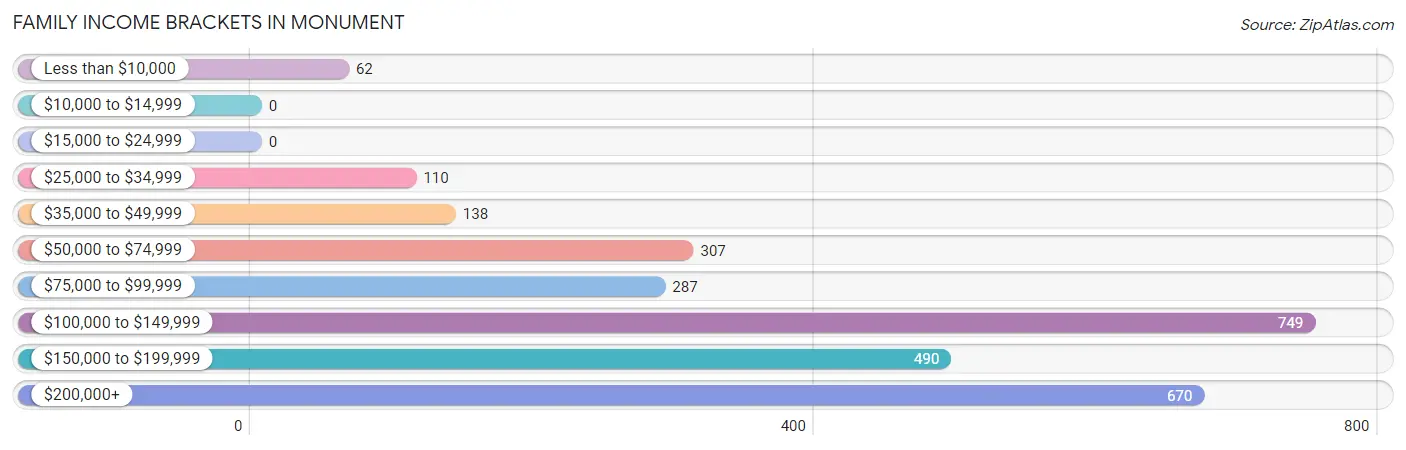
| Income Bracket | # Families | % Families |
| Less than $10,000 | 62 | 2.2% |
| $10,000 to $14,999 | 0 | 0.0% |
| $15,000 to $24,999 | 0 | 0.0% |
| $25,000 to $34,999 | 110 | 3.9% |
| $35,000 to $49,999 | 138 | 4.9% |
| $50,000 to $74,999 | 307 | 10.9% |
| $75,000 to $99,999 | 287 | 10.2% |
| $100,000 to $149,999 | 749 | 26.6% |
| $150,000 to $199,999 | 490 | 17.4% |
| $200,000+ | 670 | 23.8% |
Family Income by Famaliy Size in Monument
5-person families (293 | 10.4%) account for the highest median family income in Monument with $198,958 per family, while 2-person families (1,111 | 39.5%) have the highest median income of $60,922 per family member.
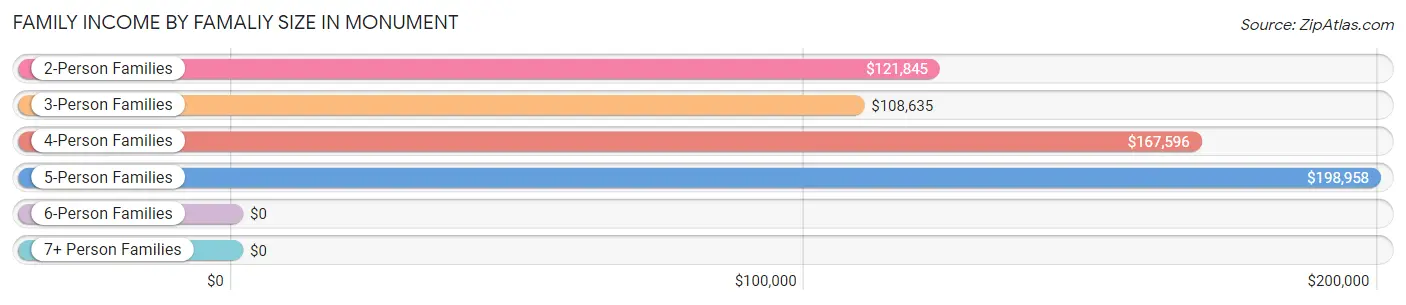
| Income Bracket | # Families | Median Income |
| 2-Person Families | 1,111 (39.5%) | $121,845 |
| 3-Person Families | 659 (23.4%) | $108,635 |
| 4-Person Families | 579 (20.6%) | $167,596 |
| 5-Person Families | 293 (10.4%) | $198,958 |
| 6-Person Families | 98 (3.5%) | $0 |
| 7+ Person Families | 76 (2.7%) | $0 |
| Total | 2,816 (100.0%) | $126,866 |
Family Income by Number of Earners in Monument
The median family income in Monument is $126,866, with families comprising 3+ earners (438) having the highest median family income of $177,923, while families with no earners (351) have the lowest median family income of $67,232, accounting for 15.5% and 12.5% of families, respectively.
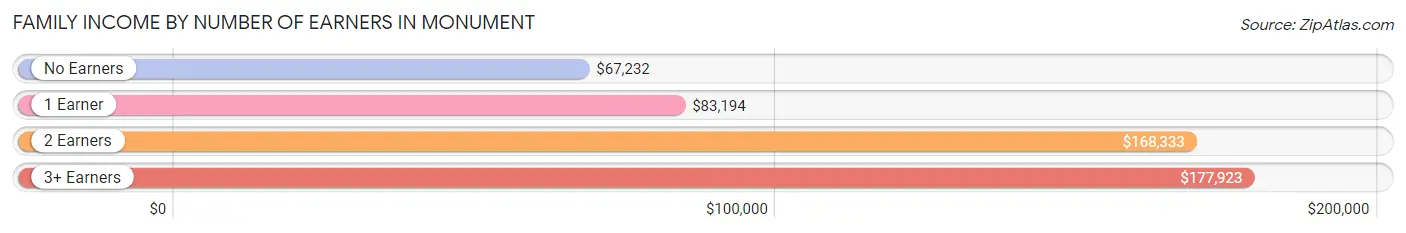
| Number of Earners | # Families | Median Income |
| No Earners | 351 (12.5%) | $67,232 |
| 1 Earner | 725 (25.8%) | $83,194 |
| 2 Earners | 1,302 (46.2%) | $168,333 |
| 3+ Earners | 438 (15.5%) | $177,923 |
| Total | 2,816 (100.0%) | $126,866 |
Household Income in Monument
Household Income Brackets in Monument
With 851 households falling in the category, the $100,000 to $149,999 income range is the most frequent in Monument, accounting for 22.4% of all households.
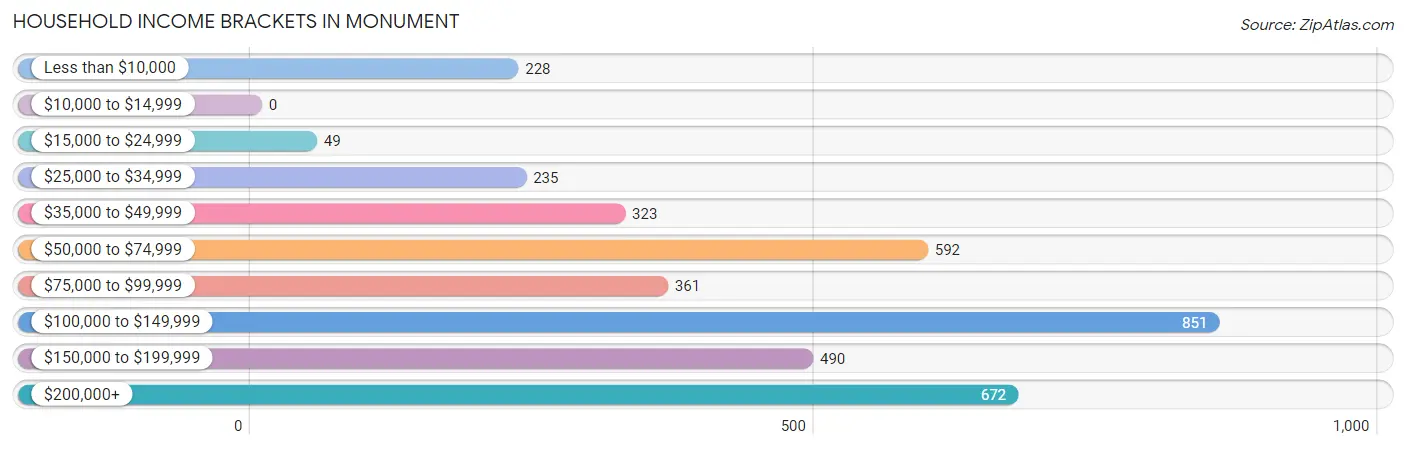
| Income Bracket | # Households | % Households |
| Less than $10,000 | 228 | 6.0% |
| $10,000 to $14,999 | 0 | 0.0% |
| $15,000 to $24,999 | 49 | 1.3% |
| $25,000 to $34,999 | 235 | 6.2% |
| $35,000 to $49,999 | 323 | 8.5% |
| $50,000 to $74,999 | 592 | 15.6% |
| $75,000 to $99,999 | 361 | 9.5% |
| $100,000 to $149,999 | 851 | 22.4% |
| $150,000 to $199,999 | 490 | 12.9% |
| $200,000+ | 672 | 17.7% |
Household Income by Householder Age in Monument
The median household income in Monument is $102,969, with the highest median household income of $119,359 found in the 25 to 44 years age bracket for the primary householder. A total of 1,228 households (32.3%) fall into this category. Meanwhile, the 65+ years age bracket for the primary householder has the lowest median household income of $57,639, with 856 households (22.5%) in this group.
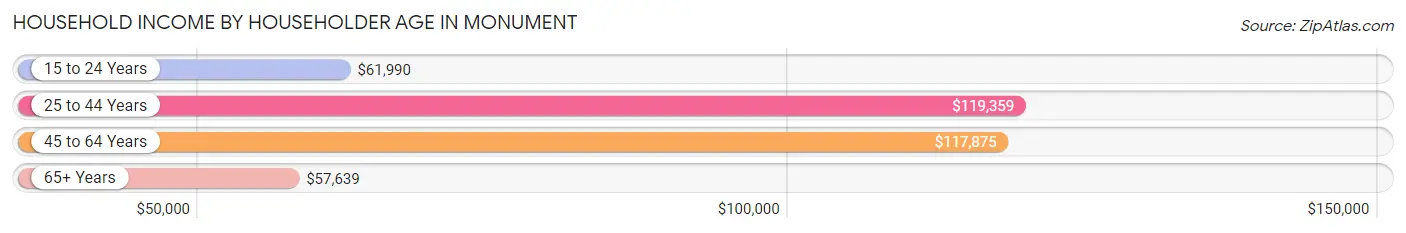
| Income Bracket | # Households | Median Income |
| 15 to 24 Years | 121 (3.2%) | $61,990 |
| 25 to 44 Years | 1,228 (32.3%) | $119,359 |
| 45 to 64 Years | 1,593 (41.9%) | $117,875 |
| 65+ Years | 856 (22.5%) | $57,639 |
| Total | 3,798 (100.0%) | $102,969 |
Poverty in Monument
Income Below Poverty by Sex and Age in Monument
With 8.8% poverty level for males and 3.6% for females among the residents of Monument, 16 and 17 year old males and 35 to 44 year old females are the most vulnerable to poverty, with 53 males (19.6%) and 140 females (16.8%) in their respective age groups living below the poverty level.
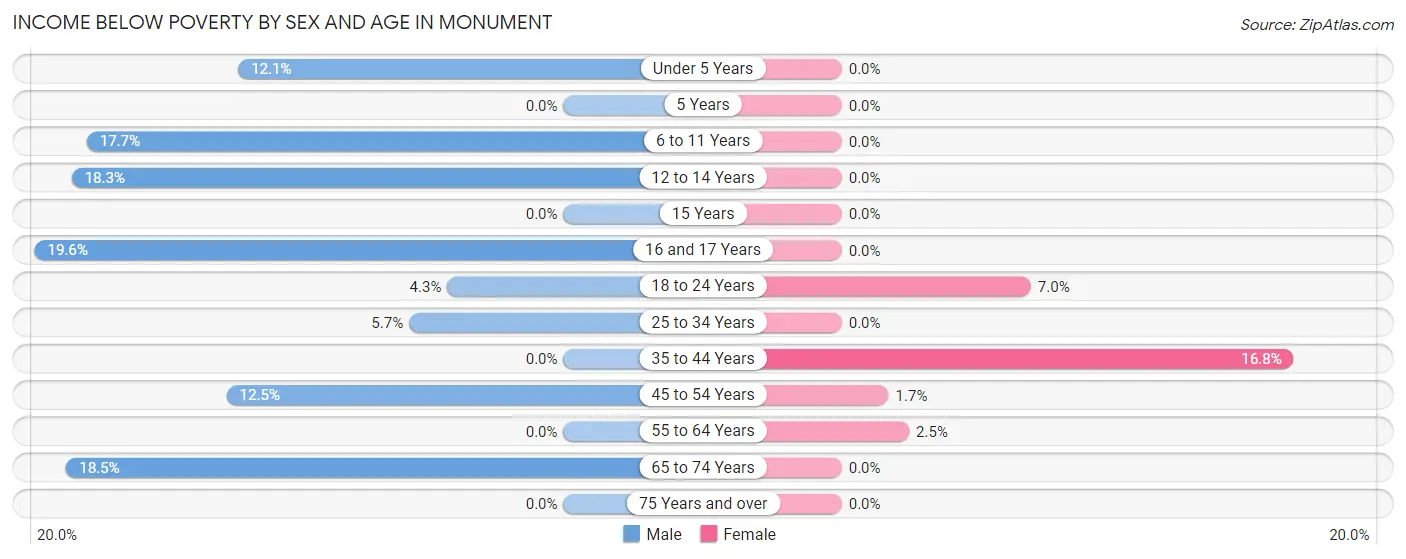
| Age Bracket | Male | Female |
| Under 5 Years | 53 (12.1%) | 0 (0.0%) |
| 5 Years | 0 (0.0%) | 0 (0.0%) |
| 6 to 11 Years | 101 (17.7%) | 0 (0.0%) |
| 12 to 14 Years | 52 (18.2%) | 0 (0.0%) |
| 15 Years | 0 (0.0%) | 0 (0.0%) |
| 16 and 17 Years | 53 (19.6%) | 0 (0.0%) |
| 18 to 24 Years | 19 (4.3%) | 20 (7.0%) |
| 25 to 34 Years | 29 (5.7%) | 0 (0.0%) |
| 35 to 44 Years | 0 (0.0%) | 140 (16.8%) |
| 45 to 54 Years | 93 (12.5%) | 15 (1.7%) |
| 55 to 64 Years | 0 (0.0%) | 15 (2.5%) |
| 65 to 74 Years | 62 (18.4%) | 0 (0.0%) |
| 75 Years and over | 0 (0.0%) | 0 (0.0%) |
| Total | 462 (8.8%) | 190 (3.6%) |
Income Above Poverty by Sex and Age in Monument
According to the poverty statistics in Monument, males aged 5 years and females aged under 5 years are the age groups that are most secure financially, with 100.0% of males and 100.0% of females in these age groups living above the poverty line.
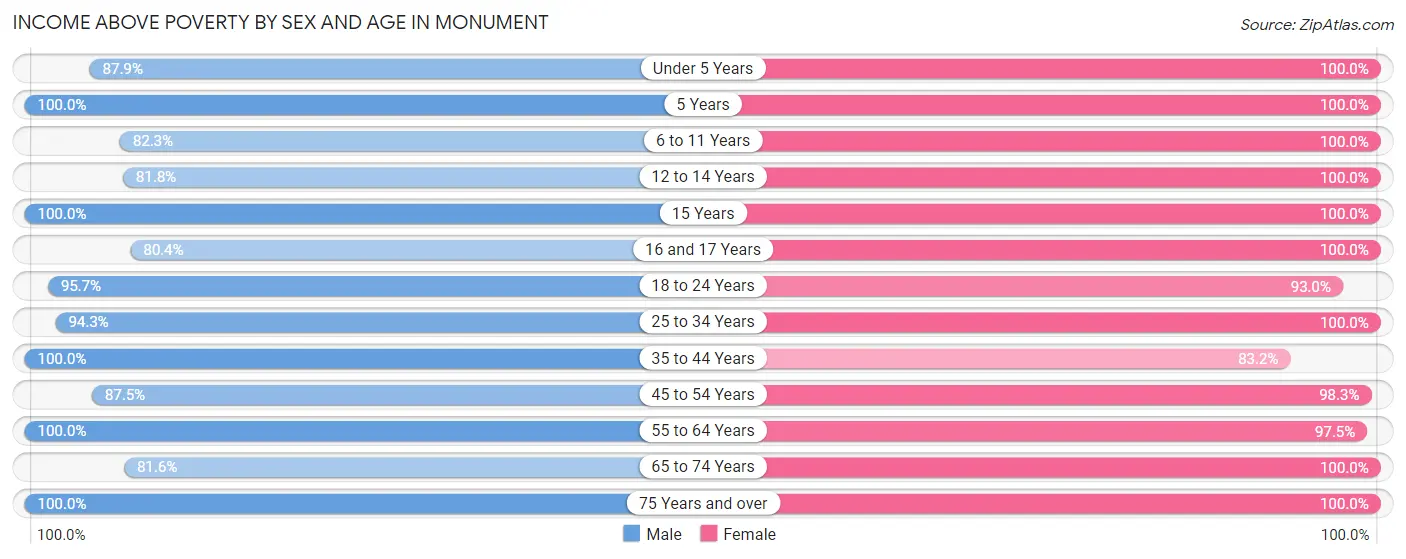
| Age Bracket | Male | Female |
| Under 5 Years | 386 (87.9%) | 269 (100.0%) |
| 5 Years | 29 (100.0%) | 40 (100.0%) |
| 6 to 11 Years | 470 (82.3%) | 590 (100.0%) |
| 12 to 14 Years | 233 (81.8%) | 209 (100.0%) |
| 15 Years | 52 (100.0%) | 145 (100.0%) |
| 16 and 17 Years | 217 (80.4%) | 187 (100.0%) |
| 18 to 24 Years | 422 (95.7%) | 265 (93.0%) |
| 25 to 34 Years | 477 (94.3%) | 433 (100.0%) |
| 35 to 44 Years | 680 (100.0%) | 695 (83.2%) |
| 45 to 54 Years | 651 (87.5%) | 847 (98.3%) |
| 55 to 64 Years | 615 (100.0%) | 584 (97.5%) |
| 65 to 74 Years | 274 (81.6%) | 610 (100.0%) |
| 75 Years and over | 282 (100.0%) | 234 (100.0%) |
| Total | 4,788 (91.2%) | 5,108 (96.4%) |
Income Below Poverty Among Married-Couple Families in Monument
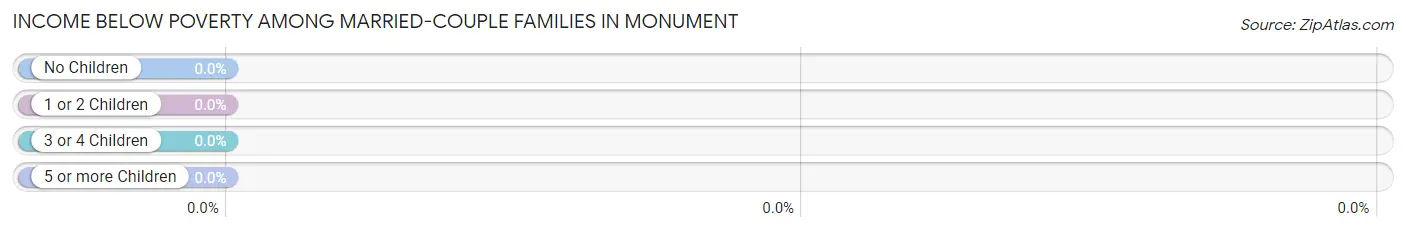
| Children | Above Poverty | Below Poverty |
| No Children | 1,264 (100.0%) | 0 (0.0%) |
| 1 or 2 Children | 824 (100.0%) | 0 (0.0%) |
| 3 or 4 Children | 305 (100.0%) | 0 (0.0%) |
| 5 or more Children | 0 (0.0%) | 0 (0.0%) |
| Total | 2,393 (100.0%) | 0 (0.0%) |
Income Below Poverty Among Single-Parent Households in Monument
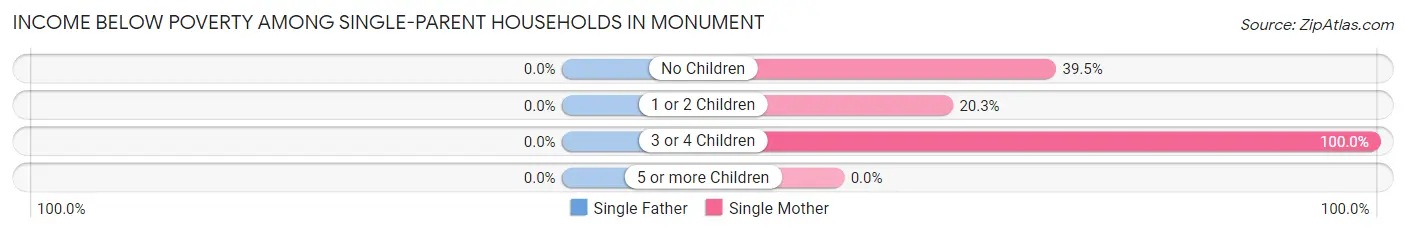
| Children | Single Father | Single Mother |
| No Children | 0 (0.0%) | 15 (39.5%) |
| 1 or 2 Children | 0 (0.0%) | 47 (20.3%) |
| 3 or 4 Children | 0 (0.0%) | 50 (100.0%) |
| 5 or more Children | 0 (0.0%) | 0 (0.0%) |
| Total | 0 (0.0%) | 112 (35.0%) |
Income Below Poverty Among Married-Couple vs Single-Parent Households in Monument
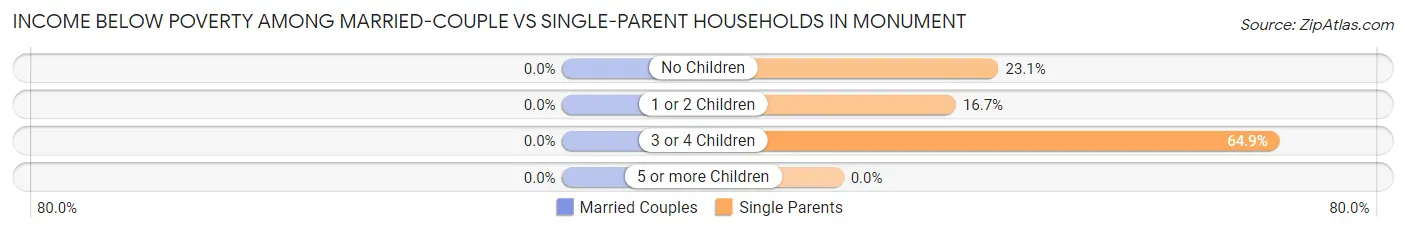
| Children | Married-Couple Families | Single-Parent Households |
| No Children | 0 (0.0%) | 15 (23.1%) |
| 1 or 2 Children | 0 (0.0%) | 47 (16.7%) |
| 3 or 4 Children | 0 (0.0%) | 50 (64.9%) |
| 5 or more Children | 0 (0.0%) | 0 (0.0%) |
| Total | 0 (0.0%) | 112 (26.5%) |
Race in Monument
The most populous races in Monument are White / Caucasian (9,203 | 87.3%), Two or more Races (1,007 | 9.6%), and Hispanic or Latino (774 | 7.3%).
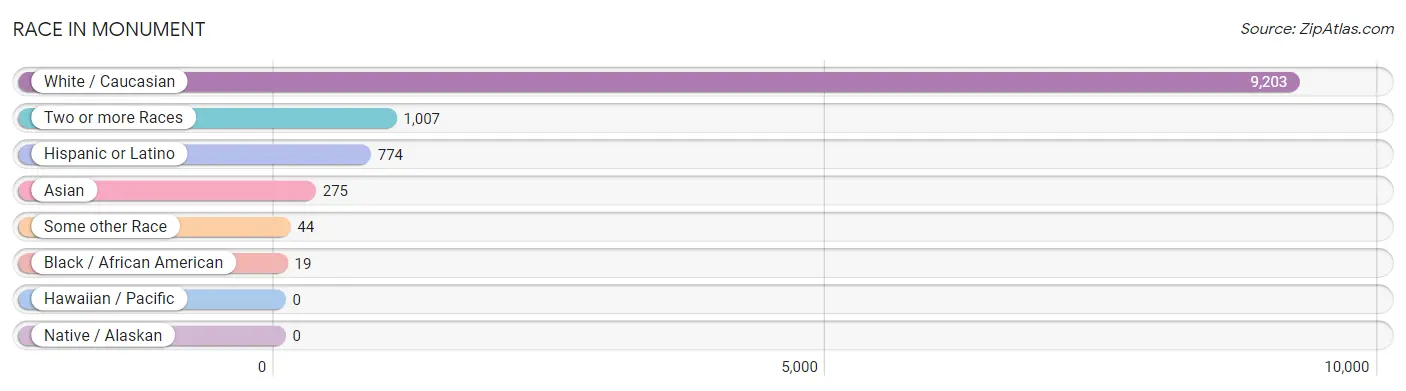
| Race | # Population | % Population |
| Asian | 275 | 2.6% |
| Black / African American | 19 | 0.2% |
| Hawaiian / Pacific | 0 | 0.0% |
| Hispanic or Latino | 774 | 7.3% |
| Native / Alaskan | 0 | 0.0% |
| White / Caucasian | 9,203 | 87.3% |
| Two or more Races | 1,007 | 9.6% |
| Some other Race | 44 | 0.4% |
| Total | 10,548 | 100.0% |
Ancestry in Monument
The most populous ancestries reported in Monument are English (2,249 | 21.3%), German (2,200 | 20.9%), Irish (1,136 | 10.8%), Polish (474 | 4.5%), and Mexican (470 | 4.5%), together accounting for 61.9% of all Monument residents.
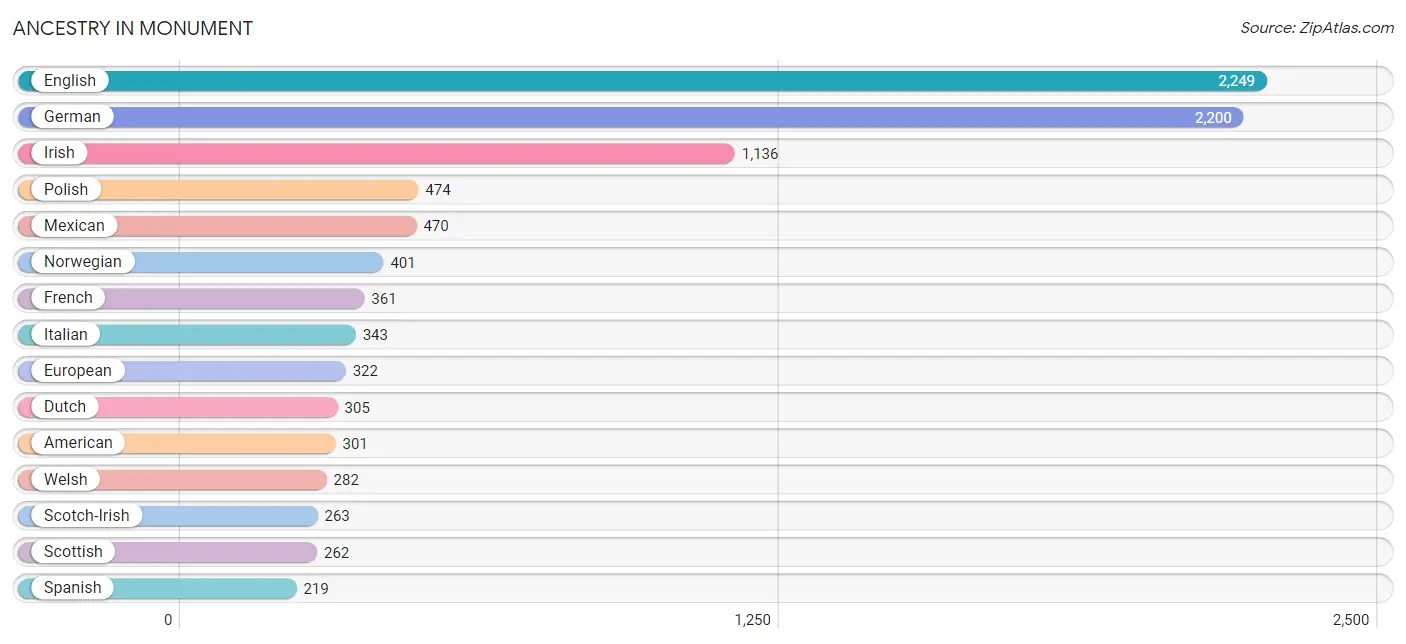
| Ancestry | # Population | % Population |
| American | 301 | 2.9% |
| Belgian | 7 | 0.1% |
| Bhutanese | 83 | 0.8% |
| British | 153 | 1.5% |
| Bulgarian | 16 | 0.2% |
| Central American | 15 | 0.1% |
| Cherokee | 65 | 0.6% |
| Czech | 180 | 1.7% |
| Danish | 5 | 0.1% |
| Dutch | 305 | 2.9% |
| Dutch West Indian | 10 | 0.1% |
| Eastern European | 36 | 0.3% |
| English | 2,249 | 21.3% |
| European | 322 | 3.0% |
| French | 361 | 3.4% |
| French Canadian | 72 | 0.7% |
| German | 2,200 | 20.9% |
| Greek | 18 | 0.2% |
| Irish | 1,136 | 10.8% |
| Italian | 343 | 3.3% |
| Korean | 180 | 1.7% |
| Lithuanian | 38 | 0.4% |
| Mexican | 470 | 4.5% |
| Nigerian | 24 | 0.2% |
| Northern European | 195 | 1.8% |
| Norwegian | 401 | 3.8% |
| Polish | 474 | 4.5% |
| Portuguese | 21 | 0.2% |
| Puerto Rican | 70 | 0.7% |
| Russian | 47 | 0.4% |
| Salvadoran | 15 | 0.1% |
| Scandinavian | 10 | 0.1% |
| Scotch-Irish | 263 | 2.5% |
| Scottish | 262 | 2.5% |
| Slovak | 18 | 0.2% |
| Spanish | 219 | 2.1% |
| Subsaharan African | 24 | 0.2% |
| Swedish | 202 | 1.9% |
| Swiss | 42 | 0.4% |
| Welsh | 282 | 2.7% | View All 40 Rows |
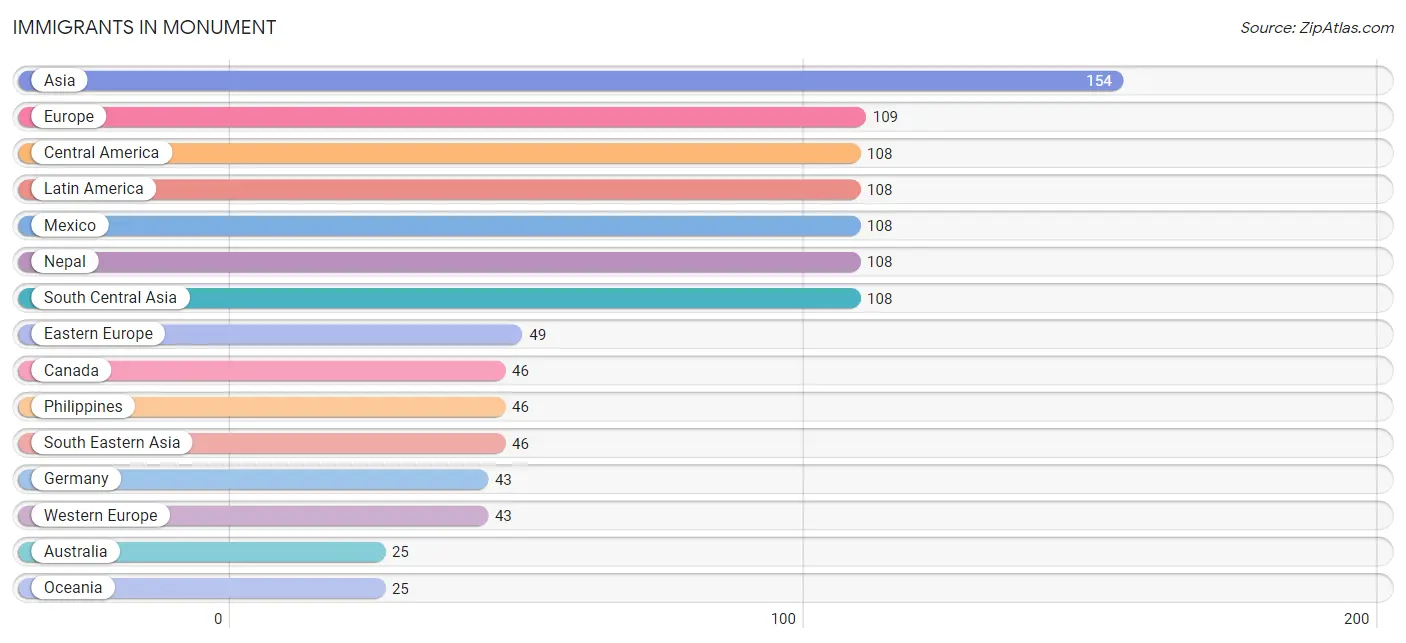
Immigrants in Monument
The most numerous immigrant groups reported in Monument came from Asia (154 | 1.5%), Europe (109 | 1.0%), Central America (108 | 1.0%), Latin America (108 | 1.0%), and Mexico (108 | 1.0%), together accounting for 5.6% of all Monument residents.
| Immigration Origin | # Population | % Population |
| Asia | 154 | 1.5% |
| Australia | 25 | 0.2% |
| Belarus | 24 | 0.2% |
| Bulgaria | 16 | 0.2% |
| Canada | 46 | 0.4% |
| Central America | 108 | 1.0% |
| Eastern Europe | 49 | 0.5% |
| England | 17 | 0.2% |
| Europe | 109 | 1.0% |
| Germany | 43 | 0.4% |
| Latin America | 108 | 1.0% |
| Mexico | 108 | 1.0% |
| Nepal | 108 | 1.0% |
| Northern Europe | 17 | 0.2% |
| Oceania | 25 | 0.2% |
| Philippines | 46 | 0.4% |
| South Central Asia | 108 | 1.0% |
| South Eastern Asia | 46 | 0.4% |
| Ukraine | 9 | 0.1% |
| Western Europe | 43 | 0.4% | View All 20 Rows |
Sex and Age in Monument
Sex and Age in Monument
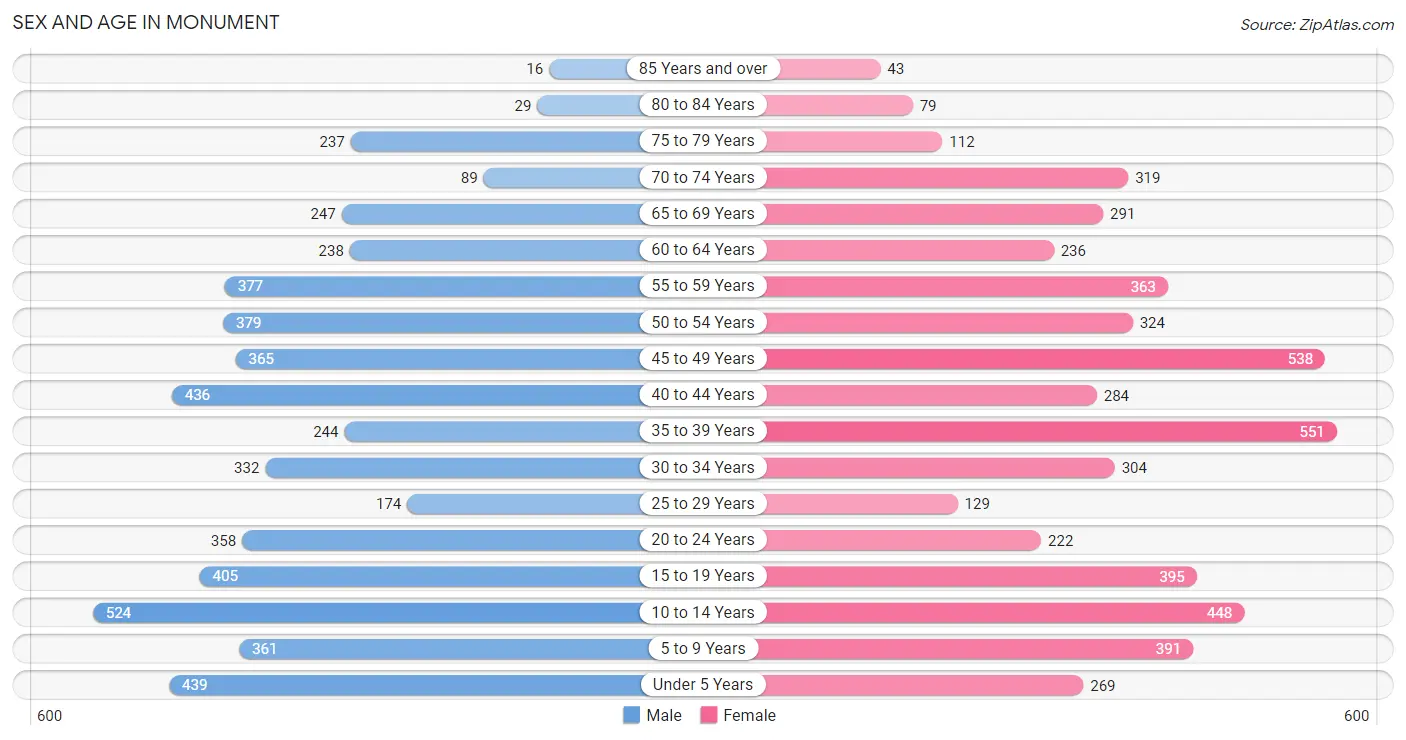
The most populous age groups in Monument are 10 to 14 Years (524 | 10.0%) for men and 35 to 39 Years (551 | 10.4%) for women.
| Age Bracket | Male | Female |
| Under 5 Years | 439 (8.4%) | 269 (5.1%) |
| 5 to 9 Years | 361 (6.9%) | 391 (7.4%) |
| 10 to 14 Years | 524 (10.0%) | 448 (8.5%) |
| 15 to 19 Years | 405 (7.7%) | 395 (7.5%) |
| 20 to 24 Years | 358 (6.8%) | 222 (4.2%) |
| 25 to 29 Years | 174 (3.3%) | 129 (2.4%) |
| 30 to 34 Years | 332 (6.3%) | 304 (5.7%) |
| 35 to 39 Years | 244 (4.6%) | 551 (10.4%) |
| 40 to 44 Years | 436 (8.3%) | 284 (5.4%) |
| 45 to 49 Years | 365 (7.0%) | 538 (10.2%) |
| 50 to 54 Years | 379 (7.2%) | 324 (6.1%) |
| 55 to 59 Years | 377 (7.2%) | 363 (6.9%) |
| 60 to 64 Years | 238 (4.5%) | 236 (4.4%) |
| 65 to 69 Years | 247 (4.7%) | 291 (5.5%) |
| 70 to 74 Years | 89 (1.7%) | 319 (6.0%) |
| 75 to 79 Years | 237 (4.5%) | 112 (2.1%) |
| 80 to 84 Years | 29 (0.5%) | 79 (1.5%) |
| 85 Years and over | 16 (0.3%) | 43 (0.8%) |
| Total | 5,250 (100.0%) | 5,298 (100.0%) |
Families and Households in Monument
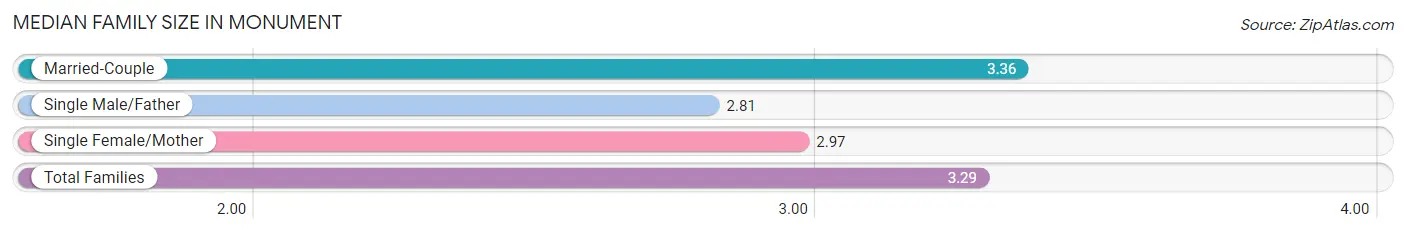
Median Family Size in Monument
The median family size in Monument is 3.29 persons per family, with married-couple families (2,393 | 85.0%) accounting for the largest median family size of 3.36 persons per family. On the other hand, single male/father families (103 | 3.7%) represent the smallest median family size with 2.81 persons per family.
| Family Type | # Families | Family Size |
| Married-Couple | 2,393 (85.0%) | 3.36 |
| Single Male/Father | 103 (3.7%) | 2.81 |
| Single Female/Mother | 320 (11.4%) | 2.97 |
| Total Families | 2,816 (100.0%) | 3.29 |
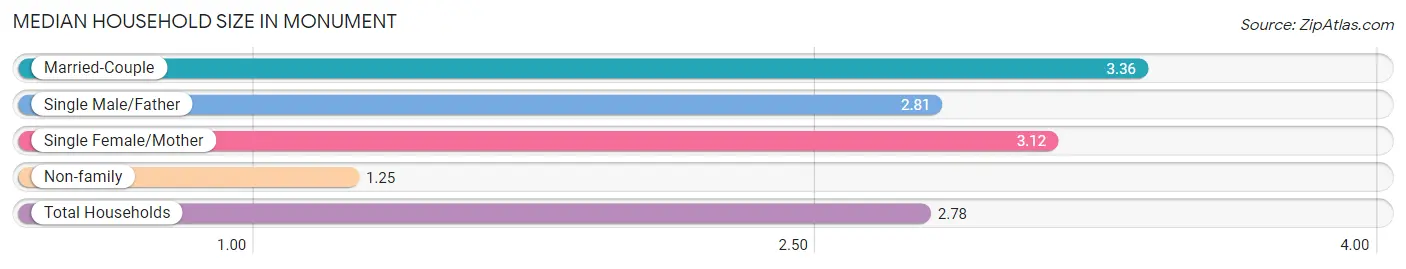
Median Household Size in Monument
The median household size in Monument is 2.78 persons per household, with married-couple households (2,393 | 63.0%) accounting for the largest median household size of 3.36 persons per household. non-family households (982 | 25.9%) represent the smallest median household size with 1.25 persons per household.
| Household Type | # Households | Household Size |
| Married-Couple | 2,393 (63.0%) | 3.36 |
| Single Male/Father | 103 (2.7%) | 2.81 |
| Single Female/Mother | 320 (8.4%) | 3.12 |
| Non-family | 982 (25.9%) | 1.25 |
| Total Households | 3,798 (100.0%) | 2.78 |
Household Size by Marriage Status in Monument
Out of a total of 3,798 households in Monument, 2,816 (74.1%) are family households, while 982 (25.9%) are nonfamily households. The most numerous type of family households are 2-person households, comprising 1,111, and the most common type of nonfamily households are 1-person households, comprising 775.
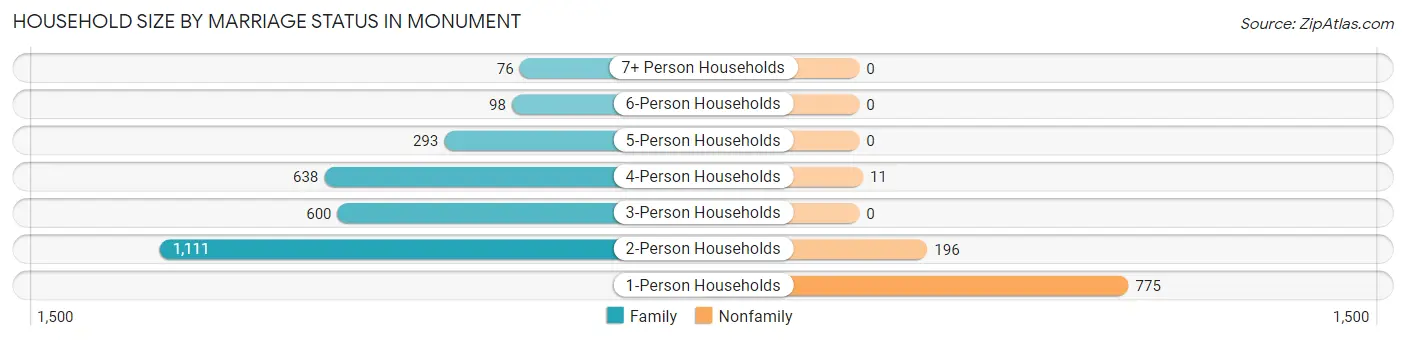
| Household Size | Family Households | Nonfamily Households |
| 1-Person Households | - | 775 (20.4%) |
| 2-Person Households | 1,111 (29.2%) | 196 (5.2%) |
| 3-Person Households | 600 (15.8%) | 0 (0.0%) |
| 4-Person Households | 638 (16.8%) | 11 (0.3%) |
| 5-Person Households | 293 (7.7%) | 0 (0.0%) |
| 6-Person Households | 98 (2.6%) | 0 (0.0%) |
| 7+ Person Households | 76 (2.0%) | 0 (0.0%) |
| Total | 2,816 (74.1%) | 982 (25.9%) |
Female Fertility in Monument
Fertility by Age in Monument
Average fertility rate in Monument is 137.0 births per 1,000 women. Women in the age bracket of 20 to 34 years have the highest fertility rate with 275.0 births per 1,000 women. Women in the age bracket of 20 to 34 years acount for 51.7% of all women with births.
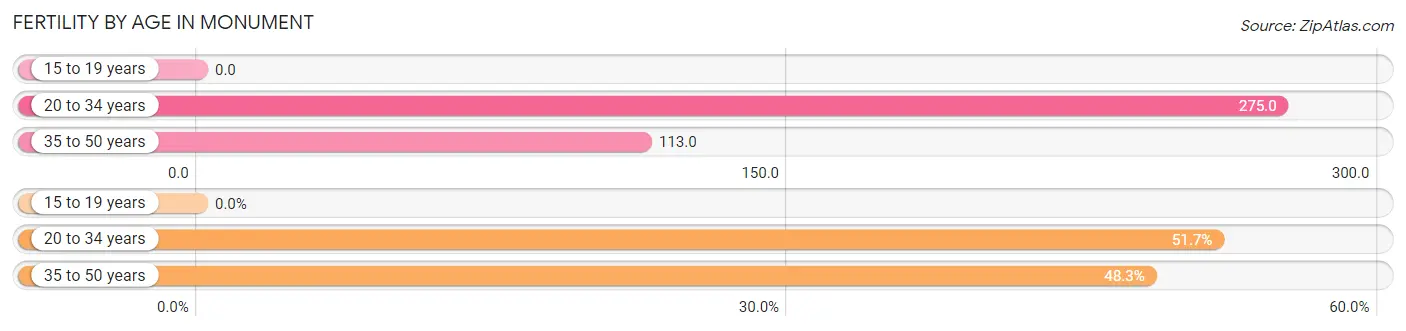
| Age Bracket | Women with Births | Births / 1,000 Women |
| 15 to 19 years | 0 (0.0%) | 0.0 |
| 20 to 34 years | 180 (51.7%) | 275.0 |
| 35 to 50 years | 168 (48.3%) | 113.0 |
| Total | 348 (100.0%) | 137.0 |
Fertility by Age by Marriage Status in Monument
60.9% of women with births (348) in Monument are married. The highest percentage of unmarried women with births falls into 20 to 34 years age bracket with 42.2% of them unmarried at the time of birth, while the lowest percentage of unmarried women with births belong to 35 to 50 years age bracket with 35.7% of them unmarried.
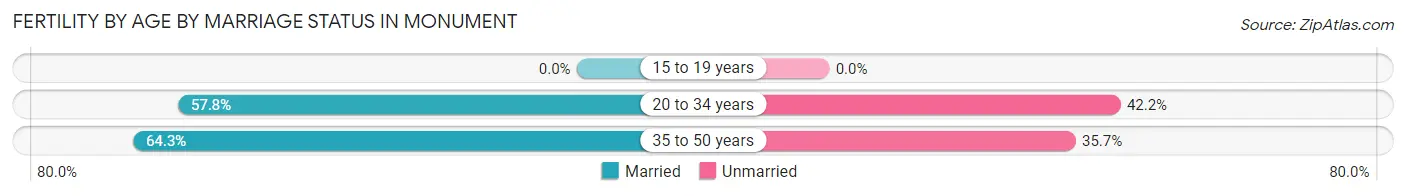
| Age Bracket | Married | Unmarried |
| 15 to 19 years | 0 (0.0%) | 0 (0.0%) |
| 20 to 34 years | 104 (57.8%) | 76 (42.2%) |
| 35 to 50 years | 108 (64.3%) | 60 (35.7%) |
| Total | 212 (60.9%) | 136 (39.1%) |
Fertility by Education in Monument
Average fertility rate in Monument is 137.0 births per 1,000 women. Women with the education attainment of college or associate's degree have the highest fertility rate of 283.0 births per 1,000 women, while women with the education attainment of bachelor's degree have the lowest fertility at 34.0 births per 1,000 women. Women with the education attainment of college or associate's degree represent 44.8% of all women with births.
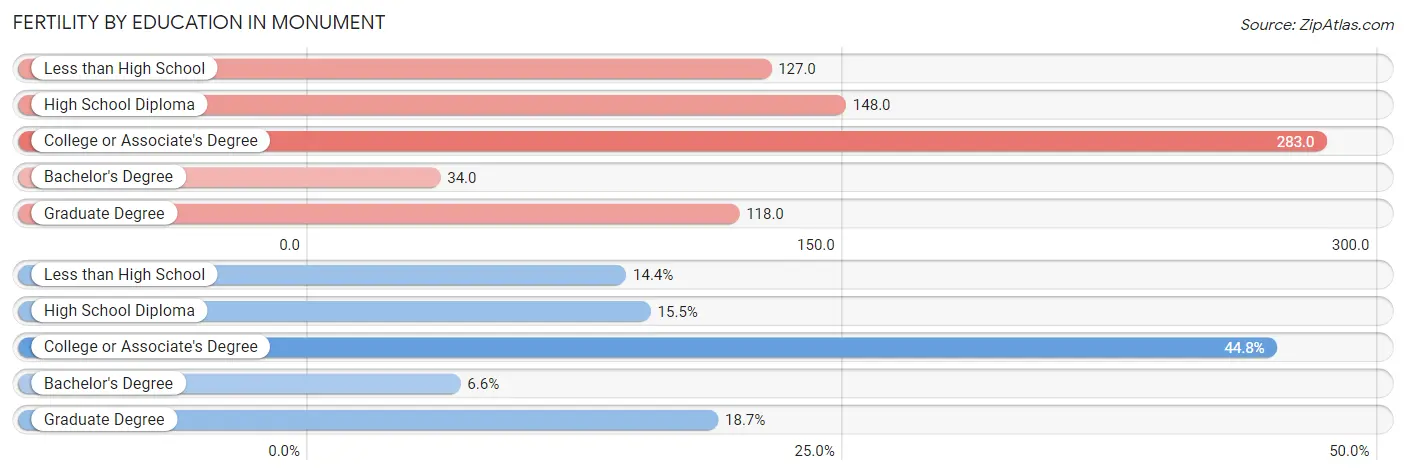
| Educational Attainment | Women with Births | Births / 1,000 Women |
| Less than High School | 50 (14.4%) | 127.0 |
| High School Diploma | 54 (15.5%) | 148.0 |
| College or Associate's Degree | 156 (44.8%) | 283.0 |
| Bachelor's Degree | 23 (6.6%) | 34.0 |
| Graduate Degree | 65 (18.7%) | 118.0 |
| Total | 348 (100.0%) | 137.0 |
Fertility by Education by Marriage Status in Monument
39.1% of women with births in Monument are unmarried. Women with the educational attainment of high school diploma are most likely to be married with 100.0% of them married at childbirth, while women with the educational attainment of less than high school are least likely to be married with 100.0% of them unmarried at childbirth.
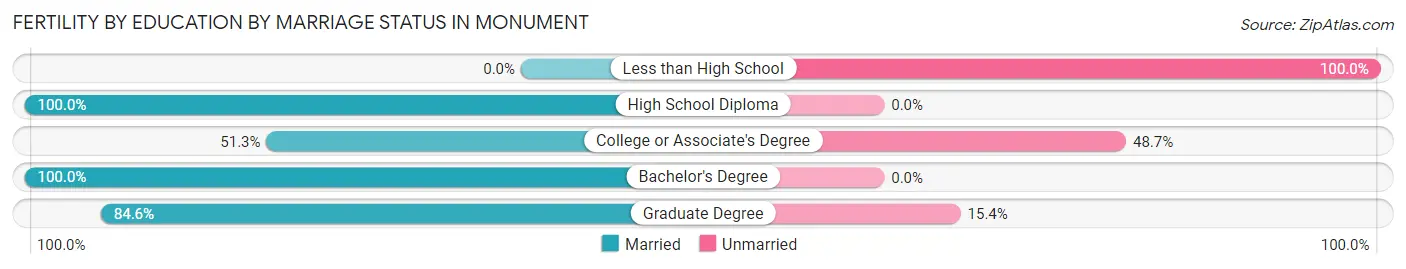
| Educational Attainment | Married | Unmarried |
| Less than High School | 0 (0.0%) | 50 (100.0%) |
| High School Diploma | 54 (100.0%) | 0 (0.0%) |
| College or Associate's Degree | 80 (51.3%) | 76 (48.7%) |
| Bachelor's Degree | 23 (100.0%) | 0 (0.0%) |
| Graduate Degree | 55 (84.6%) | 10 (15.4%) |
| Total | 212 (60.9%) | 136 (39.1%) |
Employment Characteristics in Monument
Employment by Class of Employer in Monument
Among the 5,046 employed individuals in Monument, private company employees (2,834 | 56.2%), not-for-profit organizations (737 | 14.6%), and local government employees (423 | 8.4%) make up the most common classes of employment.
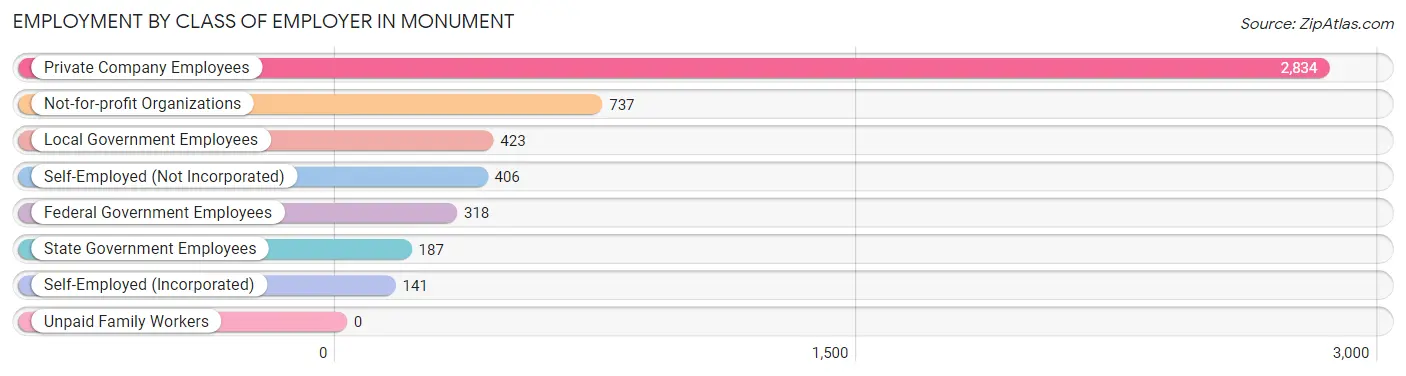
| Employer Class | # Employees | % Employees |
| Private Company Employees | 2,834 | 56.2% |
| Self-Employed (Incorporated) | 141 | 2.8% |
| Self-Employed (Not Incorporated) | 406 | 8.1% |
| Not-for-profit Organizations | 737 | 14.6% |
| Local Government Employees | 423 | 8.4% |
| State Government Employees | 187 | 3.7% |
| Federal Government Employees | 318 | 6.3% |
| Unpaid Family Workers | 0 | 0.0% |
| Total | 5,046 | 100.0% |
Employment Status by Age in Monument
According to the labor force statistics for Monument, out of the total population over 16 years of age (7,919), 69.9% or 5,535 individuals are in the labor force, with 4.9% or 271 of them unemployed. The age group with the highest labor force participation rate is 30 to 34 years, with 99.2% or 631 individuals in the labor force. Within the labor force, the 16 to 19 years age range has the highest percentage of unemployed individuals, with 15.4% or 43 of them being unemployed.
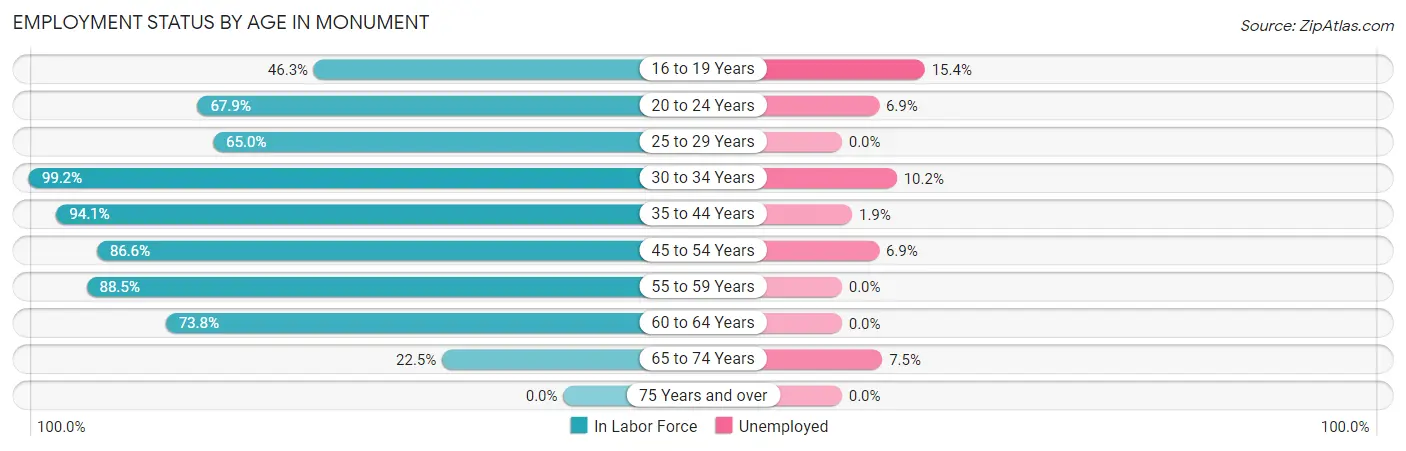
| Age Bracket | In Labor Force | Unemployed |
| 16 to 19 Years | 279 (46.3%) | 43 (15.4%) |
| 20 to 24 Years | 394 (67.9%) | 27 (6.9%) |
| 25 to 29 Years | 197 (65.0%) | 0 (0.0%) |
| 30 to 34 Years | 631 (99.2%) | 64 (10.2%) |
| 35 to 44 Years | 1,426 (94.1%) | 27 (1.9%) |
| 45 to 54 Years | 1,391 (86.6%) | 96 (6.9%) |
| 55 to 59 Years | 655 (88.5%) | 0 (0.0%) |
| 60 to 64 Years | 350 (73.8%) | 0 (0.0%) |
| 65 to 74 Years | 213 (22.5%) | 16 (7.5%) |
| 75 Years and over | 0 (0.0%) | 0 (0.0%) |
| Total | 5,535 (69.9%) | 271 (4.9%) |
Employment Status by Educational Attainment in Monument
According to labor force statistics for Monument, 88.1% of individuals (4,646) out of the total population between 25 and 64 years of age (5,274) are in the labor force, with 4.0% or 186 of them being unemployed. The group with the highest labor force participation rate are those with the educational attainment of less than high school, with 100.0% or 143 individuals in the labor force. Within the labor force, individuals with college / associate degree education have the highest percentage of unemployment, with 8.6% or 94 of them being unemployed.
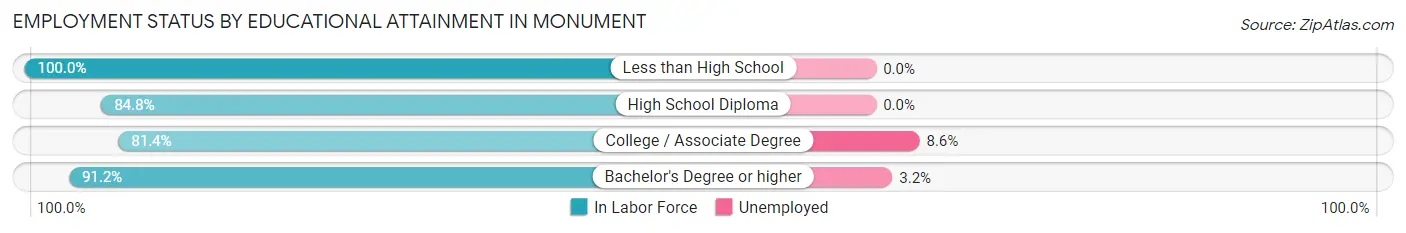
| Educational Attainment | In Labor Force | Unemployed |
| Less than High School | 143 (100.0%) | 0 (0.0%) |
| High School Diploma | 587 (84.8%) | 0 (0.0%) |
| College / Associate Degree | 1,088 (81.4%) | 115 (8.6%) |
| Bachelor's Degree or higher | 2,830 (91.2%) | 99 (3.2%) |
| Total | 4,646 (88.1%) | 211 (4.0%) |
Employment Occupations by Sex in Monument
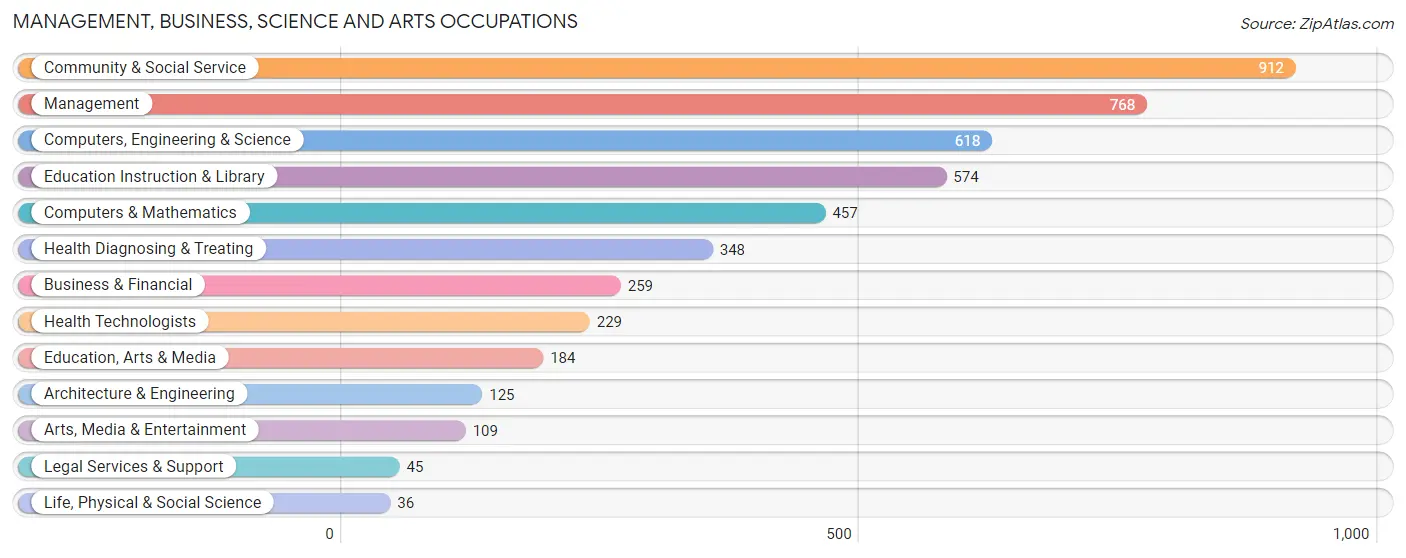
Management, Business, Science and Arts Occupations
The most common Management, Business, Science and Arts occupations in Monument are Community & Social Service (912 | 17.6%), Management (768 | 14.9%), Computers, Engineering & Science (618 | 12.0%), Education Instruction & Library (574 | 11.1%), and Computers & Mathematics (457 | 8.8%).
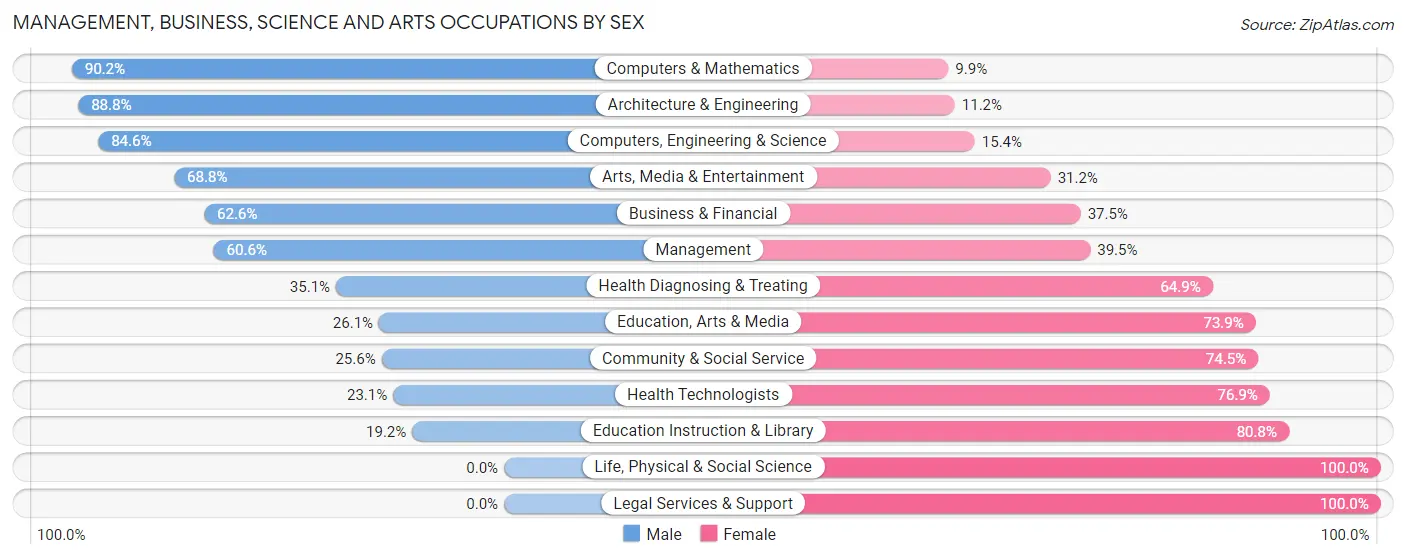
Management, Business, Science and Arts Occupations by Sex
Within the Management, Business, Science and Arts occupations in Monument, the most male-oriented occupations are Computers & Mathematics (90.1%), Architecture & Engineering (88.8%), and Computers, Engineering & Science (84.6%), while the most female-oriented occupations are Life, Physical & Social Science (100.0%), Legal Services & Support (100.0%), and Education Instruction & Library (80.8%).
| Occupation | Male | Female |
| Management | 465 (60.6%) | 303 (39.5%) |
| Business & Financial | 162 (62.5%) | 97 (37.4%) |
| Computers, Engineering & Science | 523 (84.6%) | 95 (15.4%) |
| Computers & Mathematics | 412 (90.1%) | 45 (9.9%) |
| Architecture & Engineering | 111 (88.8%) | 14 (11.2%) |
| Life, Physical & Social Science | 0 (0.0%) | 36 (100.0%) |
| Community & Social Service | 233 (25.6%) | 679 (74.5%) |
| Education, Arts & Media | 48 (26.1%) | 136 (73.9%) |
| Legal Services & Support | 0 (0.0%) | 45 (100.0%) |
| Education Instruction & Library | 110 (19.2%) | 464 (80.8%) |
| Arts, Media & Entertainment | 75 (68.8%) | 34 (31.2%) |
| Health Diagnosing & Treating | 122 (35.1%) | 226 (64.9%) |
| Health Technologists | 53 (23.1%) | 176 (76.9%) |
| Total (Category) | 1,505 (51.8%) | 1,400 (48.2%) |
| Total (Overall) | 2,637 (51.0%) | 2,531 (49.0%) |
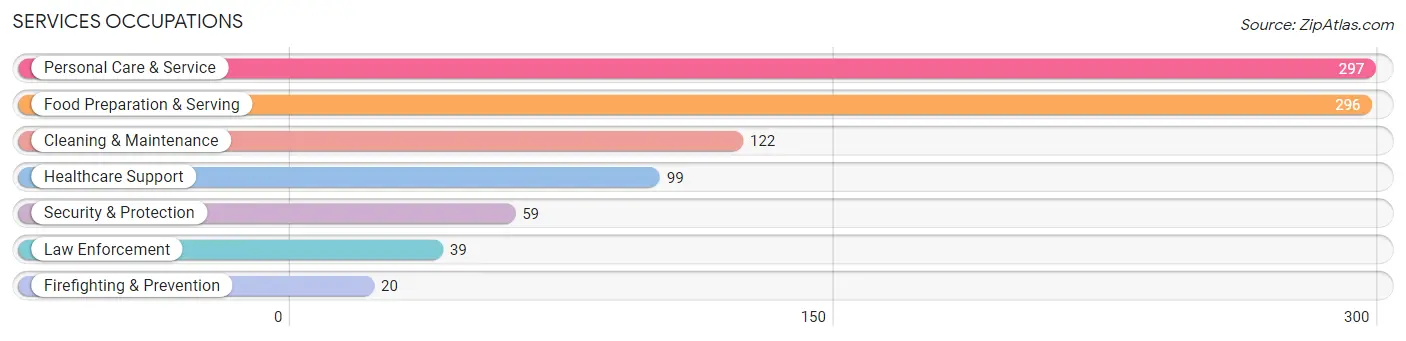
Services Occupations
The most common Services occupations in Monument are Personal Care & Service (297 | 5.8%), Food Preparation & Serving (296 | 5.7%), Cleaning & Maintenance (122 | 2.4%), Healthcare Support (99 | 1.9%), and Security & Protection (59 | 1.1%).
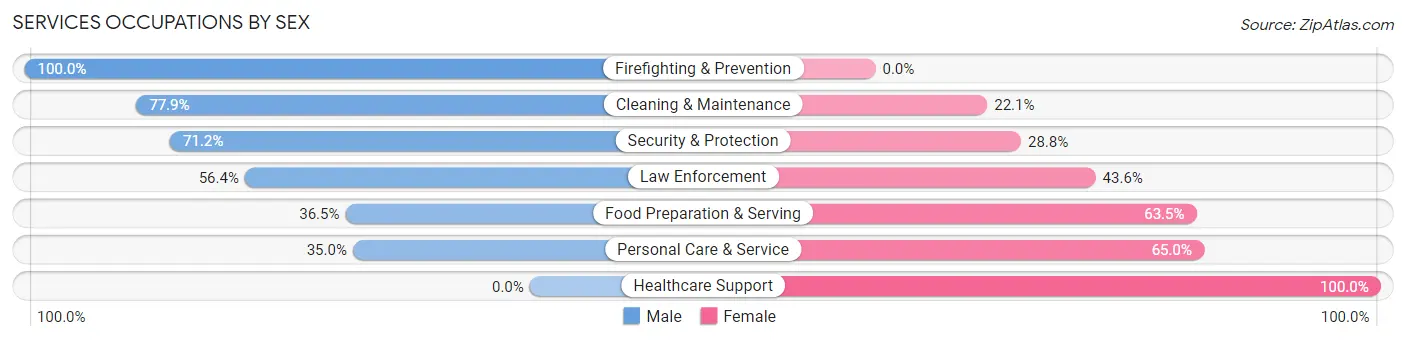
Services Occupations by Sex
Within the Services occupations in Monument, the most male-oriented occupations are Firefighting & Prevention (100.0%), Cleaning & Maintenance (77.9%), and Security & Protection (71.2%), while the most female-oriented occupations are Healthcare Support (100.0%), Personal Care & Service (65.0%), and Food Preparation & Serving (63.5%).
| Occupation | Male | Female |
| Healthcare Support | 0 (0.0%) | 99 (100.0%) |
| Security & Protection | 42 (71.2%) | 17 (28.8%) |
| Firefighting & Prevention | 20 (100.0%) | 0 (0.0%) |
| Law Enforcement | 22 (56.4%) | 17 (43.6%) |
| Food Preparation & Serving | 108 (36.5%) | 188 (63.5%) |
| Cleaning & Maintenance | 95 (77.9%) | 27 (22.1%) |
| Personal Care & Service | 104 (35.0%) | 193 (65.0%) |
| Total (Category) | 349 (40.0%) | 524 (60.0%) |
| Total (Overall) | 2,637 (51.0%) | 2,531 (49.0%) |
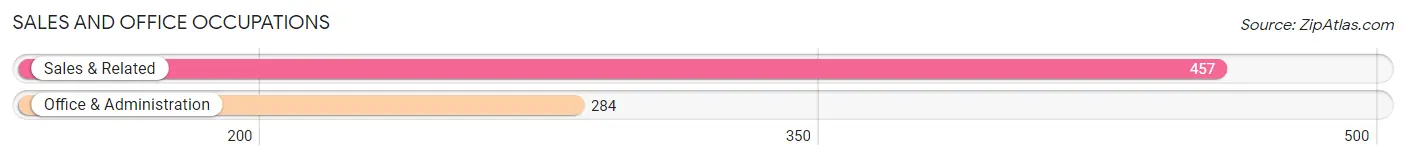
Sales and Office Occupations
The most common Sales and Office occupations in Monument are Sales & Related (457 | 8.8%), and Office & Administration (284 | 5.5%).
Sales and Office Occupations by Sex
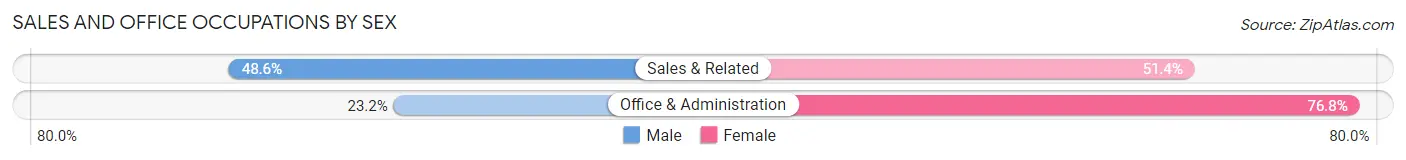
| Occupation | Male | Female |
| Sales & Related | 222 (48.6%) | 235 (51.4%) |
| Office & Administration | 66 (23.2%) | 218 (76.8%) |
| Total (Category) | 288 (38.9%) | 453 (61.1%) |
| Total (Overall) | 2,637 (51.0%) | 2,531 (49.0%) |
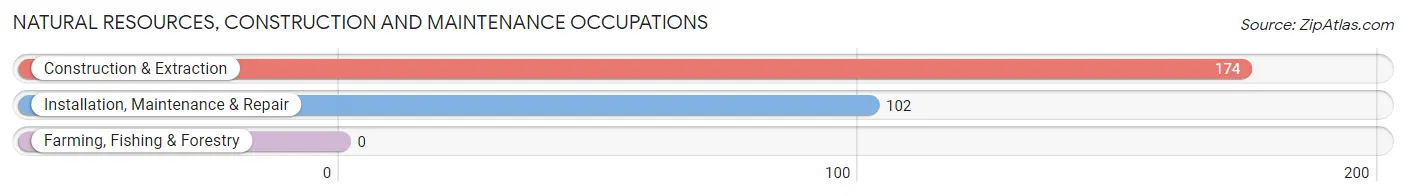
Natural Resources, Construction and Maintenance Occupations
The most common Natural Resources, Construction and Maintenance occupations in Monument are Construction & Extraction (174 | 3.4%), and Installation, Maintenance & Repair (102 | 2.0%).
Natural Resources, Construction and Maintenance Occupations by Sex
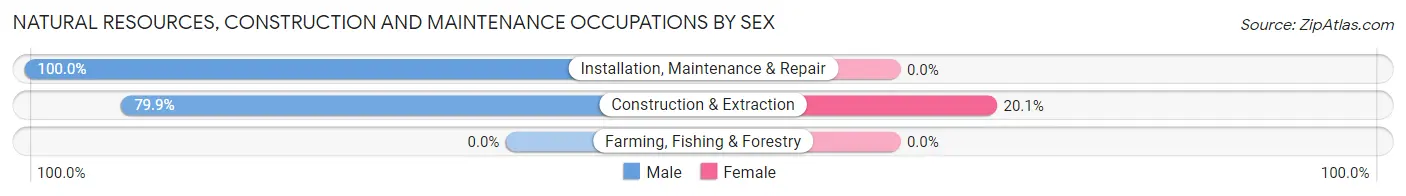
| Occupation | Male | Female |
| Farming, Fishing & Forestry | 0 (0.0%) | 0 (0.0%) |
| Construction & Extraction | 139 (79.9%) | 35 (20.1%) |
| Installation, Maintenance & Repair | 102 (100.0%) | 0 (0.0%) |
| Total (Category) | 241 (87.3%) | 35 (12.7%) |
| Total (Overall) | 2,637 (51.0%) | 2,531 (49.0%) |
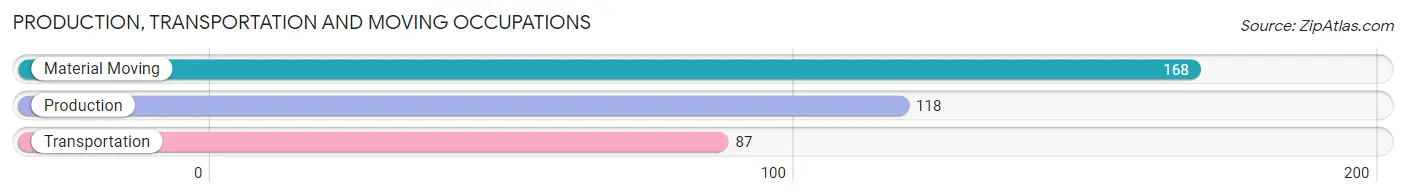
Production, Transportation and Moving Occupations
The most common Production, Transportation and Moving occupations in Monument are Material Moving (168 | 3.3%), Production (118 | 2.3%), and Transportation (87 | 1.7%).
Production, Transportation and Moving Occupations by Sex
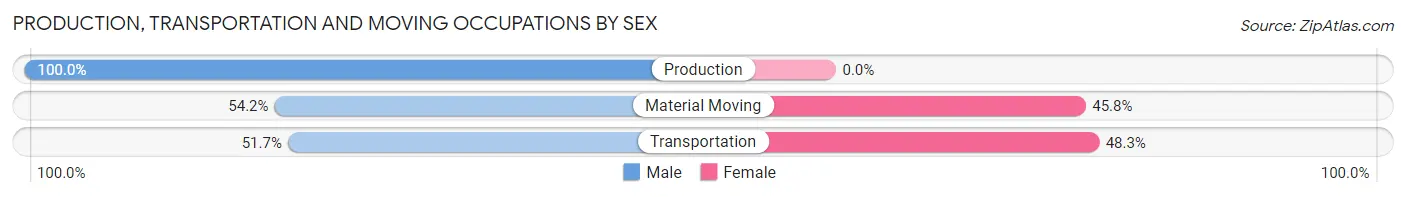
| Occupation | Male | Female |
| Production | 118 (100.0%) | 0 (0.0%) |
| Transportation | 45 (51.7%) | 42 (48.3%) |
| Material Moving | 91 (54.2%) | 77 (45.8%) |
| Total (Category) | 254 (68.1%) | 119 (31.9%) |
| Total (Overall) | 2,637 (51.0%) | 2,531 (49.0%) |
Employment Industries by Sex in Monument
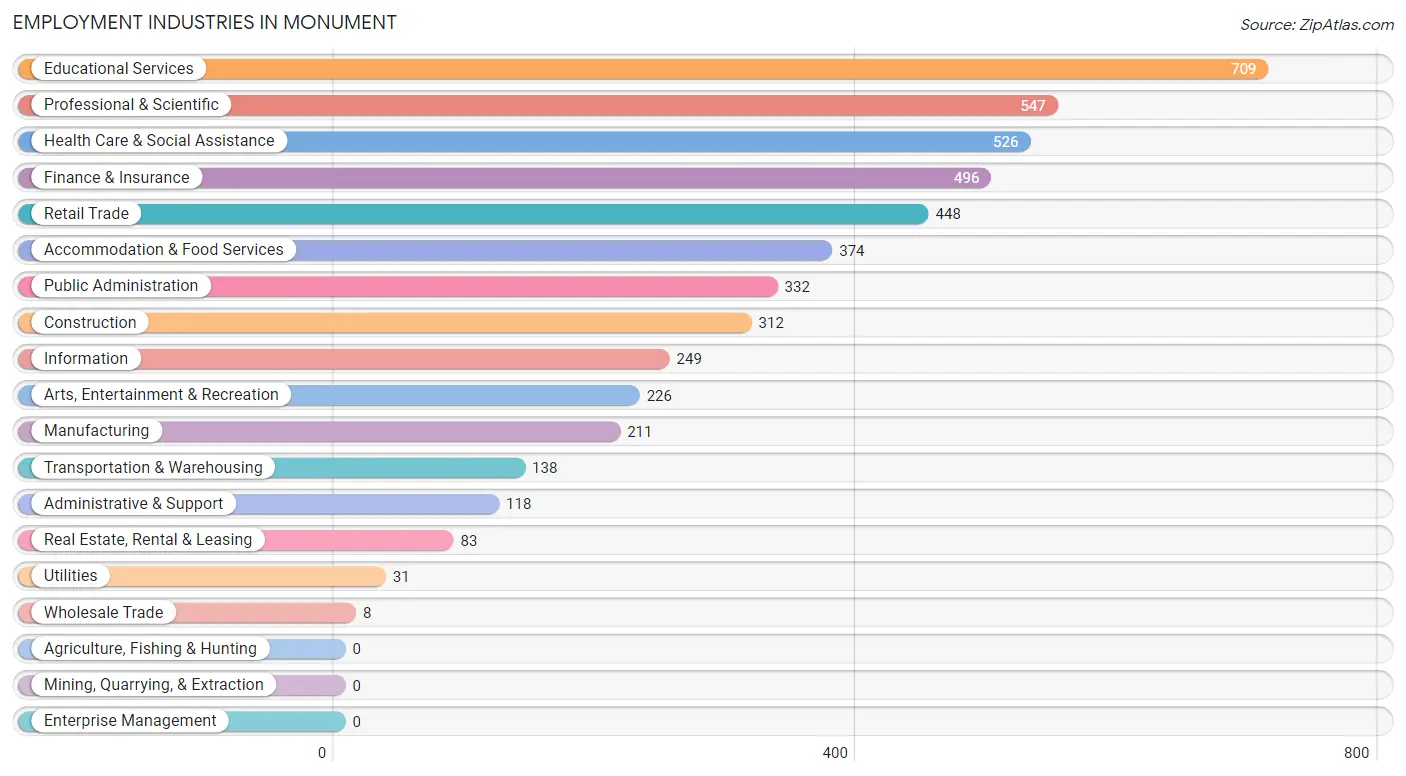
Employment Industries in Monument
The major employment industries in Monument include Educational Services (709 | 13.7%), Professional & Scientific (547 | 10.6%), Health Care & Social Assistance (526 | 10.2%), Finance & Insurance (496 | 9.6%), and Retail Trade (448 | 8.7%).
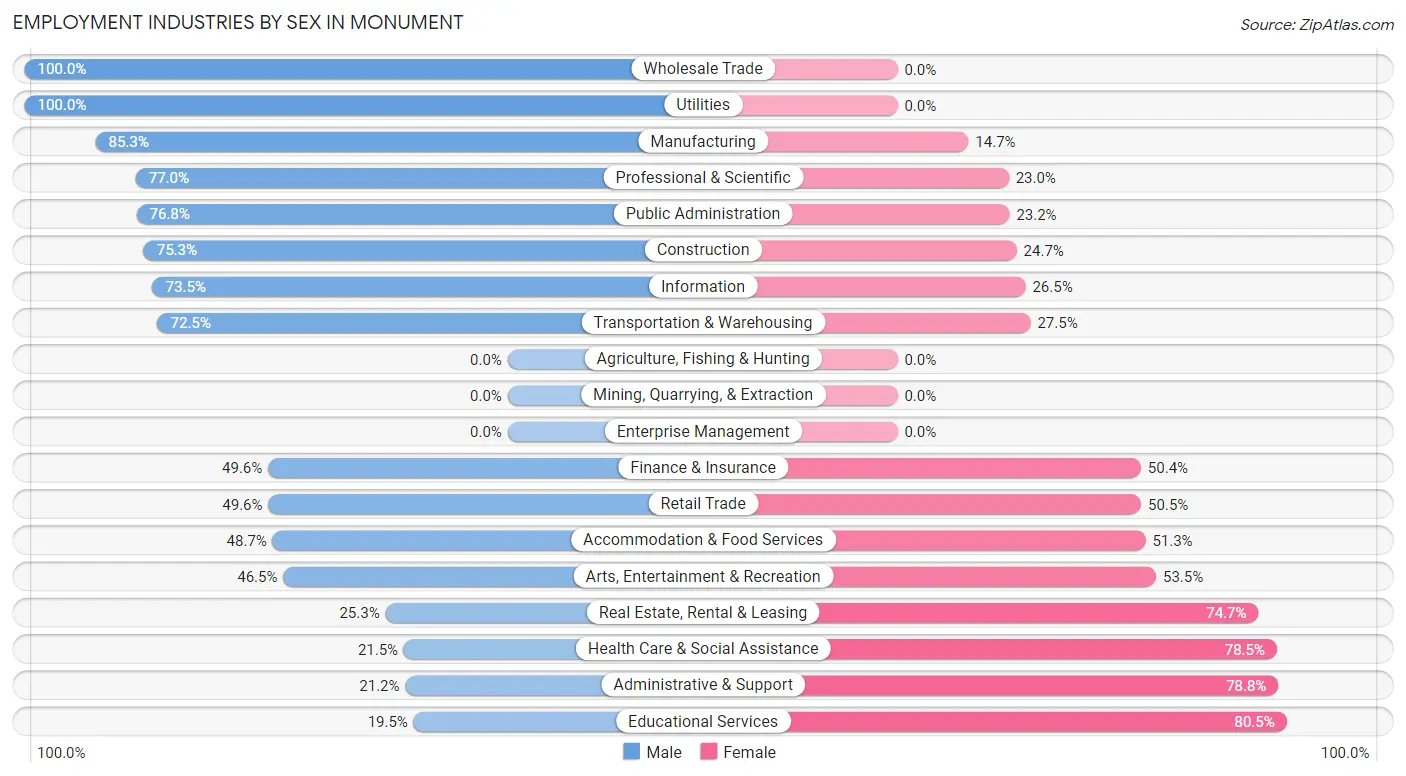
Employment Industries by Sex in Monument
The Monument industries that see more men than women are Wholesale Trade (100.0%), Utilities (100.0%), and Manufacturing (85.3%), whereas the industries that tend to have a higher number of women are Educational Services (80.5%), Administrative & Support (78.8%), and Health Care & Social Assistance (78.5%).
| Industry | Male | Female |
| Agriculture, Fishing & Hunting | 0 (0.0%) | 0 (0.0%) |
| Mining, Quarrying, & Extraction | 0 (0.0%) | 0 (0.0%) |
| Construction | 235 (75.3%) | 77 (24.7%) |
| Manufacturing | 180 (85.3%) | 31 (14.7%) |
| Wholesale Trade | 8 (100.0%) | 0 (0.0%) |
| Retail Trade | 222 (49.5%) | 226 (50.4%) |
| Transportation & Warehousing | 100 (72.5%) | 38 (27.5%) |
| Utilities | 31 (100.0%) | 0 (0.0%) |
| Information | 183 (73.5%) | 66 (26.5%) |
| Finance & Insurance | 246 (49.6%) | 250 (50.4%) |
| Real Estate, Rental & Leasing | 21 (25.3%) | 62 (74.7%) |
| Professional & Scientific | 421 (77.0%) | 126 (23.0%) |
| Enterprise Management | 0 (0.0%) | 0 (0.0%) |
| Administrative & Support | 25 (21.2%) | 93 (78.8%) |
| Educational Services | 138 (19.5%) | 571 (80.5%) |
| Health Care & Social Assistance | 113 (21.5%) | 413 (78.5%) |
| Arts, Entertainment & Recreation | 105 (46.5%) | 121 (53.5%) |
| Accommodation & Food Services | 182 (48.7%) | 192 (51.3%) |
| Public Administration | 255 (76.8%) | 77 (23.2%) |
| Total | 2,637 (51.0%) | 2,531 (49.0%) |
Education in Monument
School Enrollment in Monument
The most common levels of schooling among the 3,010 students in Monument are high school (774 | 25.7%), middle school (744 | 24.7%), and elementary school (673 | 22.4%).
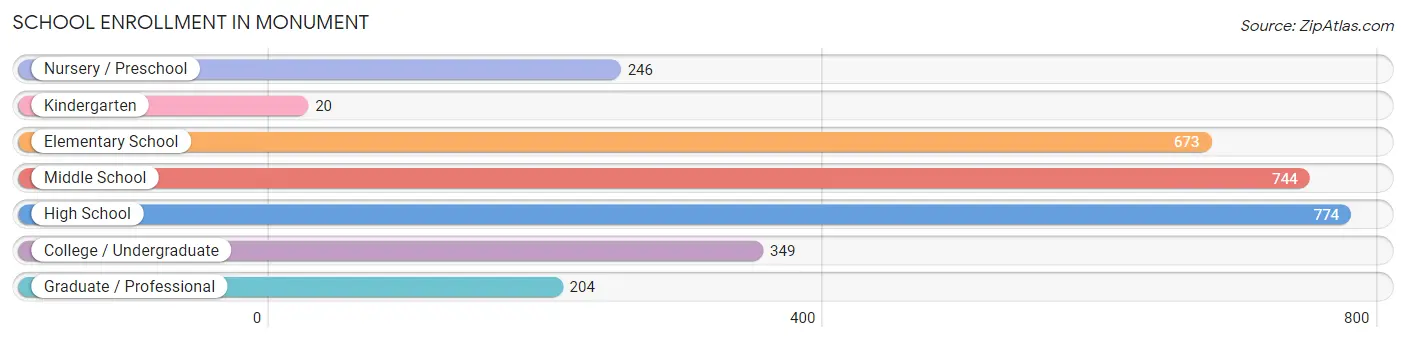
| School Level | # Students | % Students |
| Nursery / Preschool | 246 | 8.2% |
| Kindergarten | 20 | 0.7% |
| Elementary School | 673 | 22.4% |
| Middle School | 744 | 24.7% |
| High School | 774 | 25.7% |
| College / Undergraduate | 349 | 11.6% |
| Graduate / Professional | 204 | 6.8% |
| Total | 3,010 | 100.0% |
School Enrollment by Age by Funding Source in Monument
Out of a total of 3,010 students who are enrolled in schools in Monument, 412 (13.7%) attend a private institution, while the remaining 2,598 (86.3%) are enrolled in public schools. The age group of 3 to 4 year olds has the highest likelihood of being enrolled in private schools, with 96 (49.2% in the age bracket) enrolled. Conversely, the age group of 15 to 17 year olds has the lowest likelihood of being enrolled in a private school, with 580 (98.5% in the age bracket) attending a public institution.
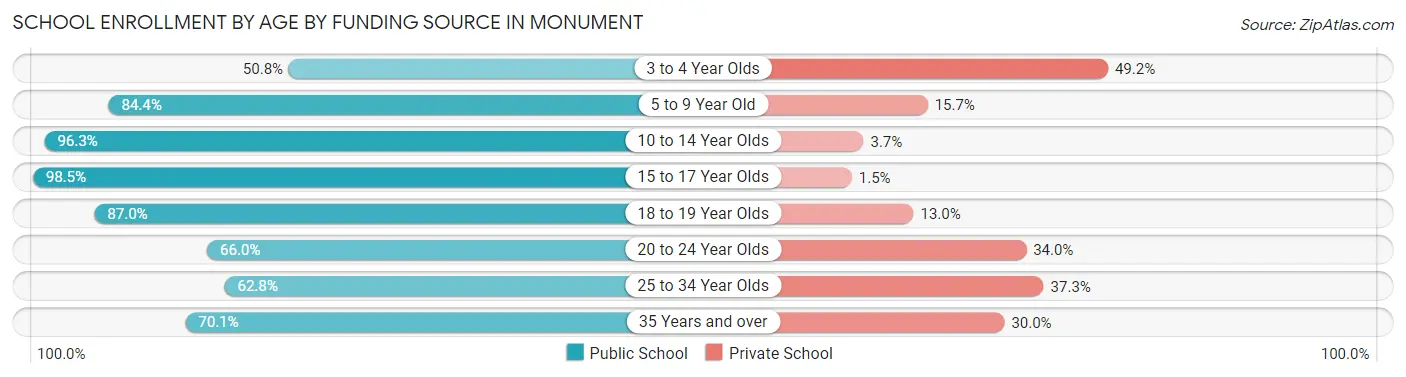
| Age Bracket | Public School | Private School |
| 3 to 4 Year Olds | 99 (50.8%) | 96 (49.2%) |
| 5 to 9 Year Old | 555 (84.4%) | 103 (15.7%) |
| 10 to 14 Year Olds | 936 (96.3%) | 36 (3.7%) |
| 15 to 17 Year Olds | 580 (98.5%) | 9 (1.5%) |
| 18 to 19 Year Olds | 127 (87.0%) | 19 (13.0%) |
| 20 to 24 Year Olds | 66 (66.0%) | 34 (34.0%) |
| 25 to 34 Year Olds | 96 (62.7%) | 57 (37.2%) |
| 35 Years and over | 138 (70.1%) | 59 (29.9%) |
| Total | 2,598 (86.3%) | 412 (13.7%) |
Educational Attainment by Field of Study in Monument
Business (828 | 20.8%), education (441 | 11.1%), psychology (387 | 9.7%), literature & languages (322 | 8.1%), and science & technology (293 | 7.3%) are the most common fields of study among 3,984 individuals in Monument who have obtained a bachelor's degree or higher.
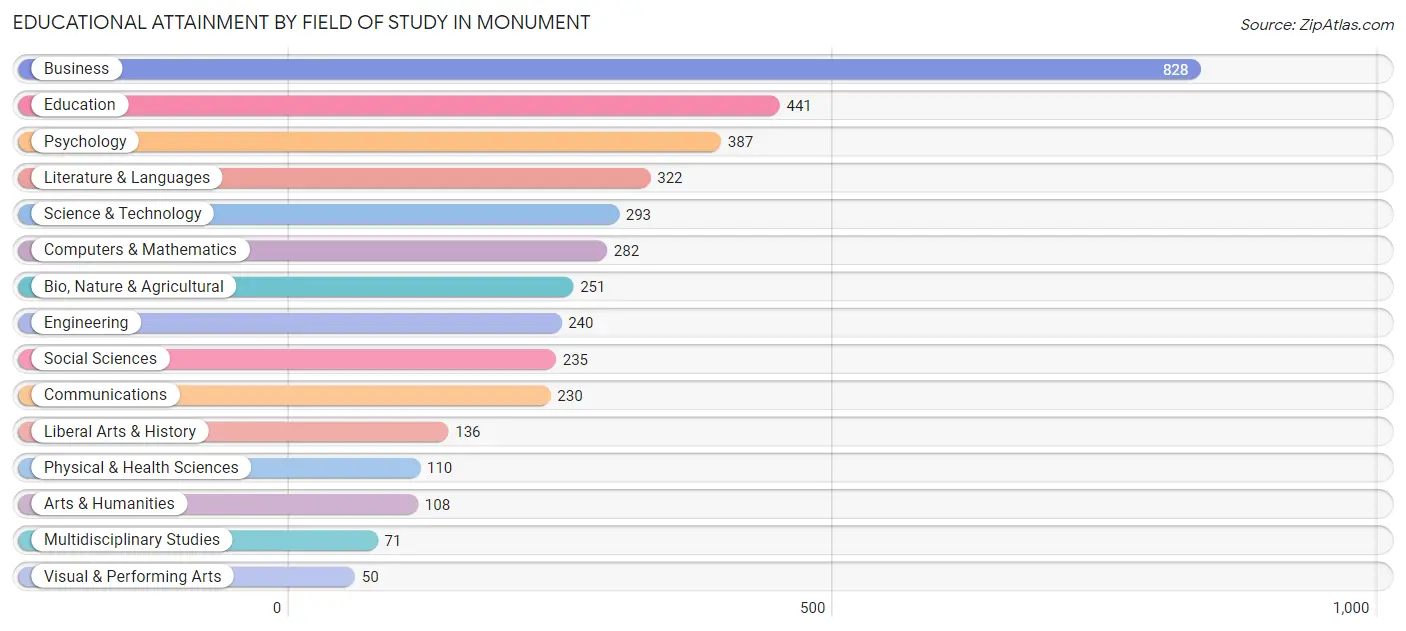
| Field of Study | # Graduates | % Graduates |
| Computers & Mathematics | 282 | 7.1% |
| Bio, Nature & Agricultural | 251 | 6.3% |
| Physical & Health Sciences | 110 | 2.8% |
| Psychology | 387 | 9.7% |
| Social Sciences | 235 | 5.9% |
| Engineering | 240 | 6.0% |
| Multidisciplinary Studies | 71 | 1.8% |
| Science & Technology | 293 | 7.3% |
| Business | 828 | 20.8% |
| Education | 441 | 11.1% |
| Literature & Languages | 322 | 8.1% |
| Liberal Arts & History | 136 | 3.4% |
| Visual & Performing Arts | 50 | 1.3% |
| Communications | 230 | 5.8% |
| Arts & Humanities | 108 | 2.7% |
| Total | 3,984 | 100.0% |
Transportation & Commute in Monument
Vehicle Availability by Sex in Monument
The most prevalent vehicle ownership categories in Monument are males with 2 vehicles (1,278, accounting for 47.2%) and females with 2 vehicles (1,156, making up 54.6%).
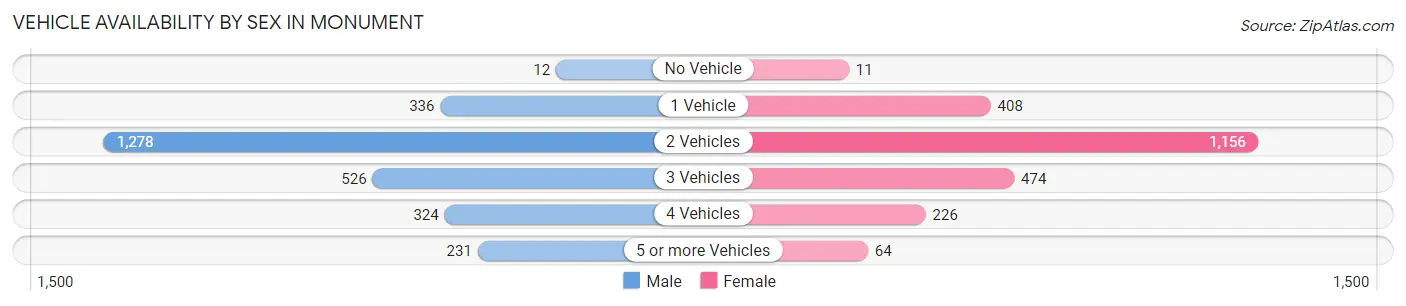
| Vehicles Available | Male | Female |
| No Vehicle | 12 (0.4%) | 11 (0.5%) |
| 1 Vehicle | 336 (12.4%) | 408 (17.4%) |
| 2 Vehicles | 1,278 (47.2%) | 1,156 (49.4%) |
| 3 Vehicles | 526 (19.4%) | 474 (20.3%) |
| 4 Vehicles | 324 (12.0%) | 226 (9.7%) |
| 5 or more Vehicles | 231 (8.5%) | 64 (2.7%) |
| Total | 2,707 (100.0%) | 2,339 (100.0%) |
Commute Time in Monument
The most frequently occuring commute durations in Monument are 20 to 24 minutes (677 commuters, 17.2%), 30 to 34 minutes (478 commuters, 12.1%), and 25 to 29 minutes (446 commuters, 11.3%).
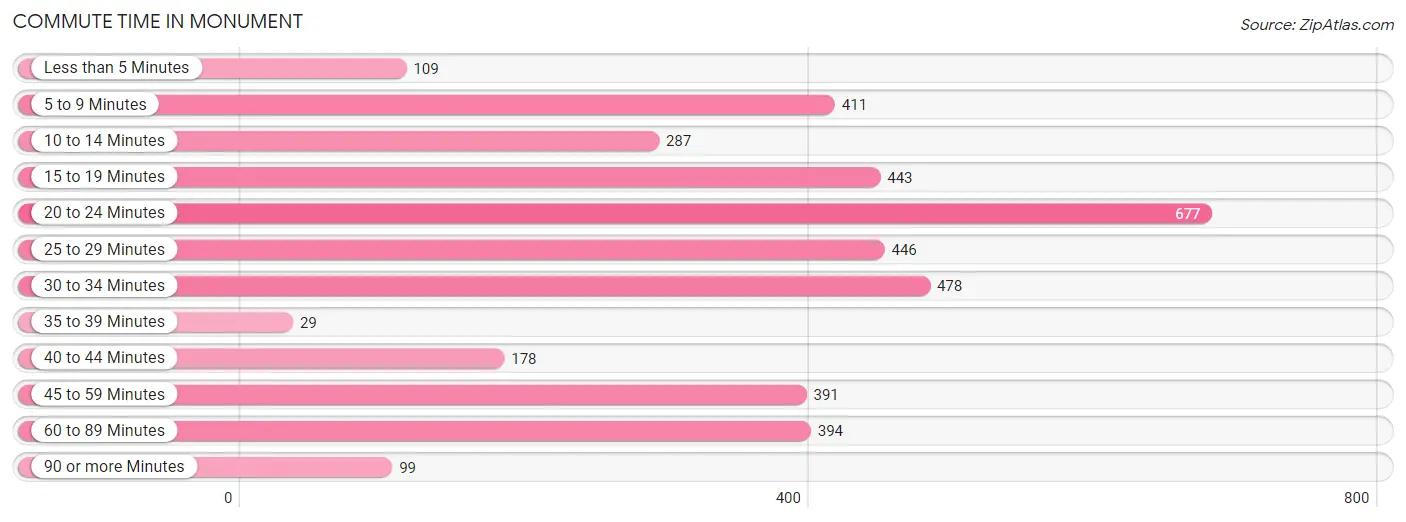
| Commute Time | # Commuters | % Commuters |
| Less than 5 Minutes | 109 | 2.8% |
| 5 to 9 Minutes | 411 | 10.4% |
| 10 to 14 Minutes | 287 | 7.3% |
| 15 to 19 Minutes | 443 | 11.2% |
| 20 to 24 Minutes | 677 | 17.2% |
| 25 to 29 Minutes | 446 | 11.3% |
| 30 to 34 Minutes | 478 | 12.1% |
| 35 to 39 Minutes | 29 | 0.7% |
| 40 to 44 Minutes | 178 | 4.5% |
| 45 to 59 Minutes | 391 | 9.9% |
| 60 to 89 Minutes | 394 | 10.0% |
| 90 or more Minutes | 99 | 2.5% |
Commute Time by Sex in Monument
The most common commute times in Monument are 20 to 24 minutes (366 commuters, 17.2%) for males and 30 to 34 minutes (319 commuters, 17.6%) for females.
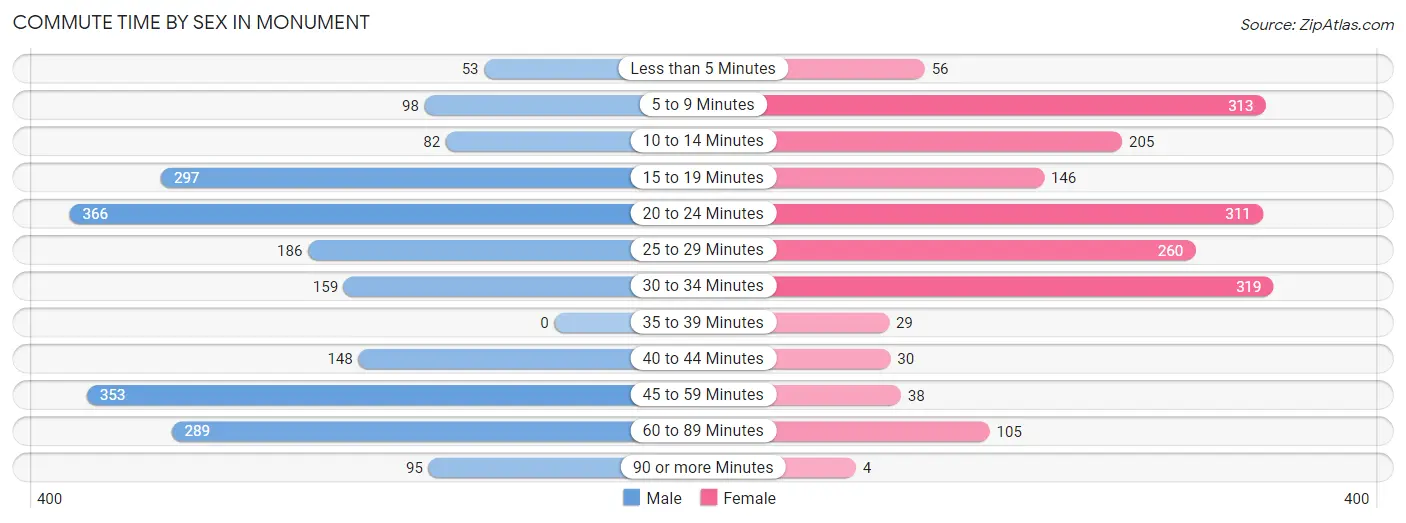
| Commute Time | Male | Female |
| Less than 5 Minutes | 53 (2.5%) | 56 (3.1%) |
| 5 to 9 Minutes | 98 (4.6%) | 313 (17.2%) |
| 10 to 14 Minutes | 82 (3.9%) | 205 (11.3%) |
| 15 to 19 Minutes | 297 (14.0%) | 146 (8.0%) |
| 20 to 24 Minutes | 366 (17.2%) | 311 (17.1%) |
| 25 to 29 Minutes | 186 (8.7%) | 260 (14.3%) |
| 30 to 34 Minutes | 159 (7.5%) | 319 (17.6%) |
| 35 to 39 Minutes | 0 (0.0%) | 29 (1.6%) |
| 40 to 44 Minutes | 148 (7.0%) | 30 (1.7%) |
| 45 to 59 Minutes | 353 (16.6%) | 38 (2.1%) |
| 60 to 89 Minutes | 289 (13.6%) | 105 (5.8%) |
| 90 or more Minutes | 95 (4.5%) | 4 (0.2%) |
Time of Departure to Work by Sex in Monument
The most frequent times of departure to work in Monument are 7:00 AM to 7:29 AM (326, 15.3%) for males and 7:00 AM to 7:29 AM (494, 27.2%) for females.
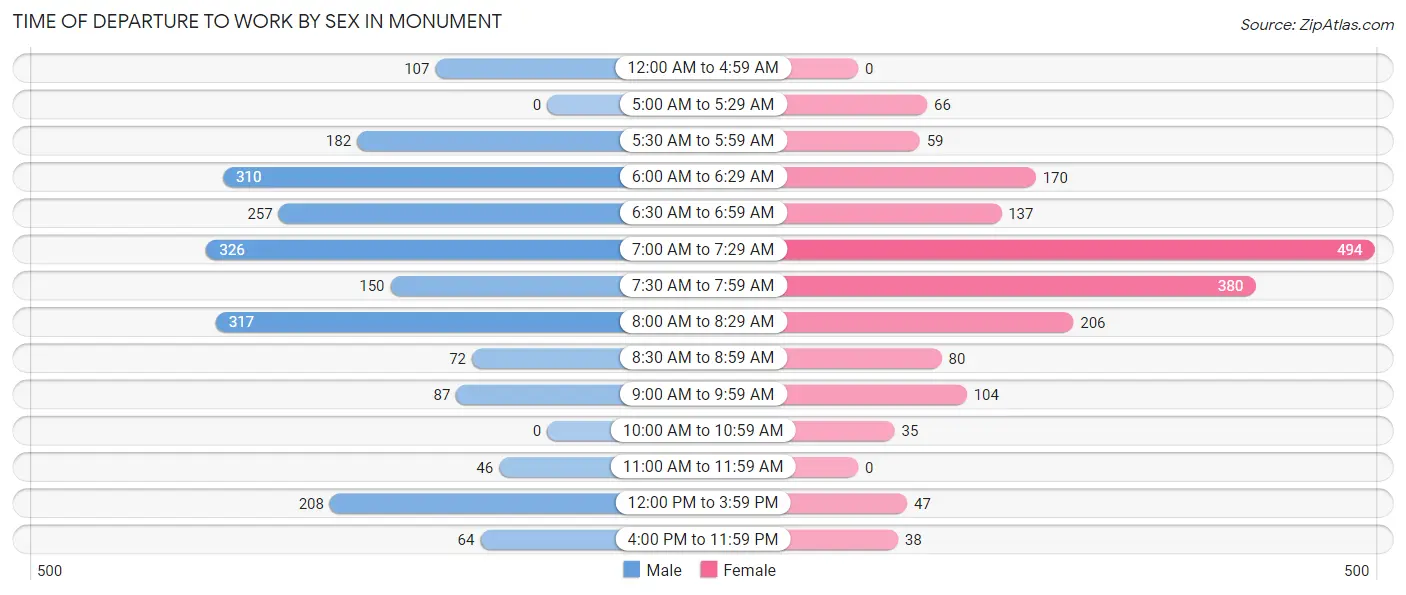
| Time of Departure | Male | Female |
| 12:00 AM to 4:59 AM | 107 (5.0%) | 0 (0.0%) |
| 5:00 AM to 5:29 AM | 0 (0.0%) | 66 (3.6%) |
| 5:30 AM to 5:59 AM | 182 (8.6%) | 59 (3.3%) |
| 6:00 AM to 6:29 AM | 310 (14.6%) | 170 (9.4%) |
| 6:30 AM to 6:59 AM | 257 (12.1%) | 137 (7.5%) |
| 7:00 AM to 7:29 AM | 326 (15.3%) | 494 (27.2%) |
| 7:30 AM to 7:59 AM | 150 (7.1%) | 380 (20.9%) |
| 8:00 AM to 8:29 AM | 317 (14.9%) | 206 (11.3%) |
| 8:30 AM to 8:59 AM | 72 (3.4%) | 80 (4.4%) |
| 9:00 AM to 9:59 AM | 87 (4.1%) | 104 (5.7%) |
| 10:00 AM to 10:59 AM | 0 (0.0%) | 35 (1.9%) |
| 11:00 AM to 11:59 AM | 46 (2.2%) | 0 (0.0%) |
| 12:00 PM to 3:59 PM | 208 (9.8%) | 47 (2.6%) |
| 4:00 PM to 11:59 PM | 64 (3.0%) | 38 (2.1%) |
| Total | 2,126 (100.0%) | 1,816 (100.0%) |
Housing Occupancy in Monument
Occupancy by Ownership in Monument
Of the total 3,798 dwellings in Monument, owner-occupied units account for 3,083 (81.2%), while renter-occupied units make up 715 (18.8%).
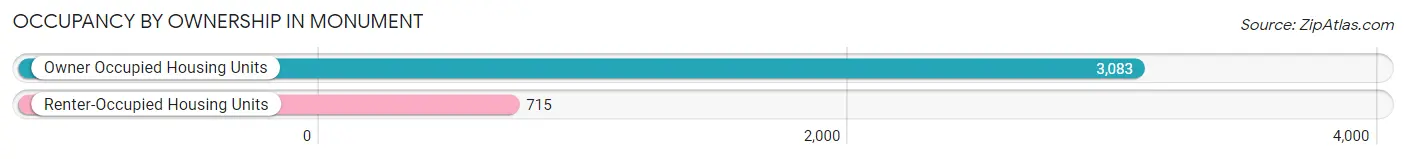
| Occupancy | # Housing Units | % Housing Units |
| Owner Occupied Housing Units | 3,083 | 81.2% |
| Renter-Occupied Housing Units | 715 | 18.8% |
| Total Occupied Housing Units | 3,798 | 100.0% |
Occupancy by Household Size in Monument
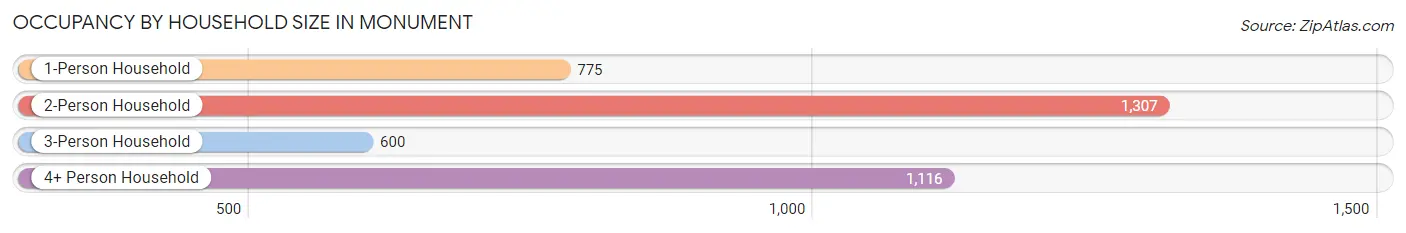
| Household Size | # Housing Units | % Housing Units |
| 1-Person Household | 775 | 20.4% |
| 2-Person Household | 1,307 | 34.4% |
| 3-Person Household | 600 | 15.8% |
| 4+ Person Household | 1,116 | 29.4% |
| Total Housing Units | 3,798 | 100.0% |
Occupancy by Ownership by Household Size in Monument
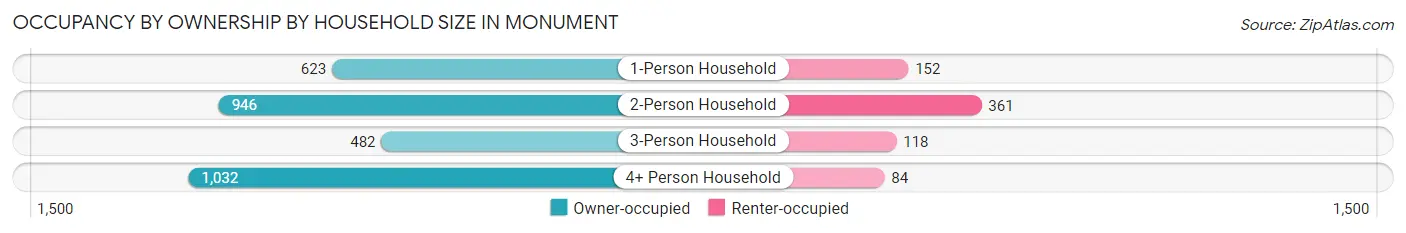
| Household Size | Owner-occupied | Renter-occupied |
| 1-Person Household | 623 (80.4%) | 152 (19.6%) |
| 2-Person Household | 946 (72.4%) | 361 (27.6%) |
| 3-Person Household | 482 (80.3%) | 118 (19.7%) |
| 4+ Person Household | 1,032 (92.5%) | 84 (7.5%) |
| Total Housing Units | 3,083 (81.2%) | 715 (18.8%) |
Occupancy by Educational Attainment in Monument
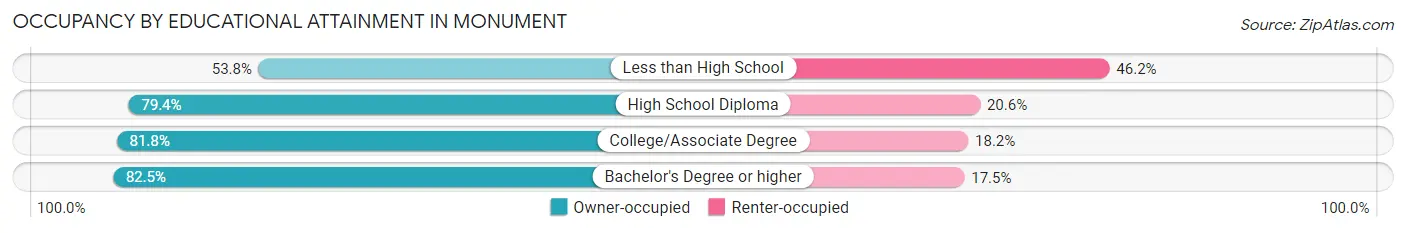
| Household Size | Owner-occupied | Renter-occupied |
| Less than High School | 50 (53.8%) | 43 (46.2%) |
| High School Diploma | 413 (79.4%) | 107 (20.6%) |
| College/Associate Degree | 924 (81.8%) | 206 (18.2%) |
| Bachelor's Degree or higher | 1,696 (82.5%) | 359 (17.5%) |
Occupancy by Age of Householder in Monument
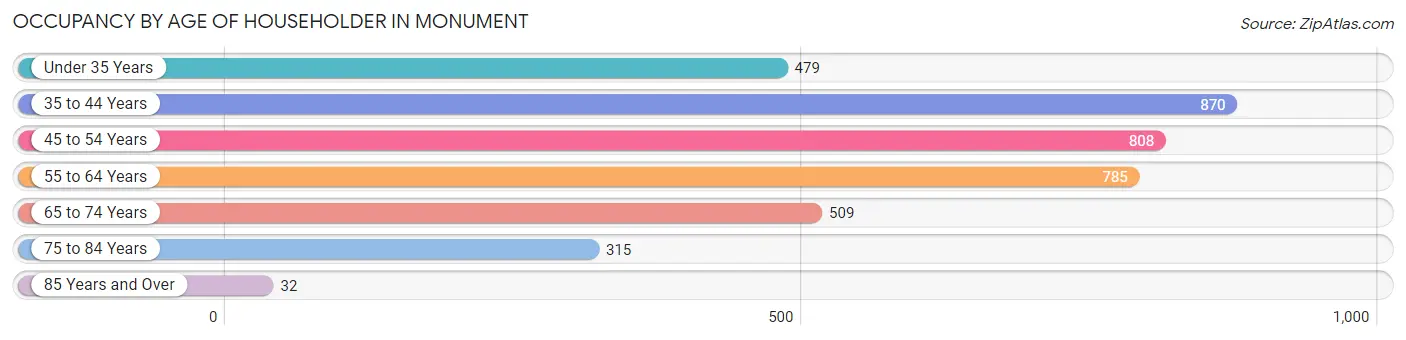
| Age Bracket | # Households | % Households |
| Under 35 Years | 479 | 12.6% |
| 35 to 44 Years | 870 | 22.9% |
| 45 to 54 Years | 808 | 21.3% |
| 55 to 64 Years | 785 | 20.7% |
| 65 to 74 Years | 509 | 13.4% |
| 75 to 84 Years | 315 | 8.3% |
| 85 Years and Over | 32 | 0.8% |
| Total | 3,798 | 100.0% |
Housing Finances in Monument
Median Income by Occupancy in Monument
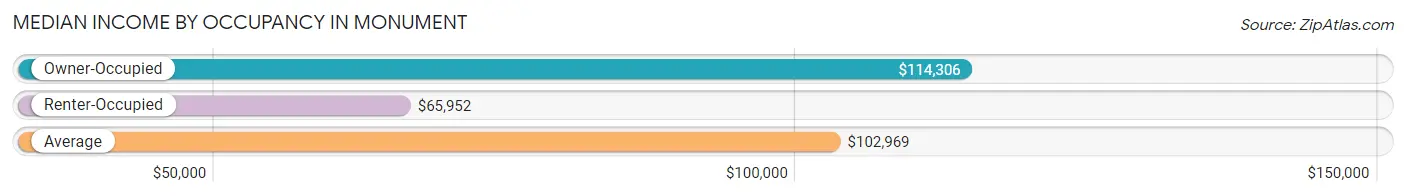
| Occupancy Type | # Households | Median Income |
| Owner-Occupied | 3,083 (81.2%) | $114,306 |
| Renter-Occupied | 715 (18.8%) | $65,952 |
| Average | 3,798 (100.0%) | $102,969 |
Occupancy by Householder Income Bracket in Monument
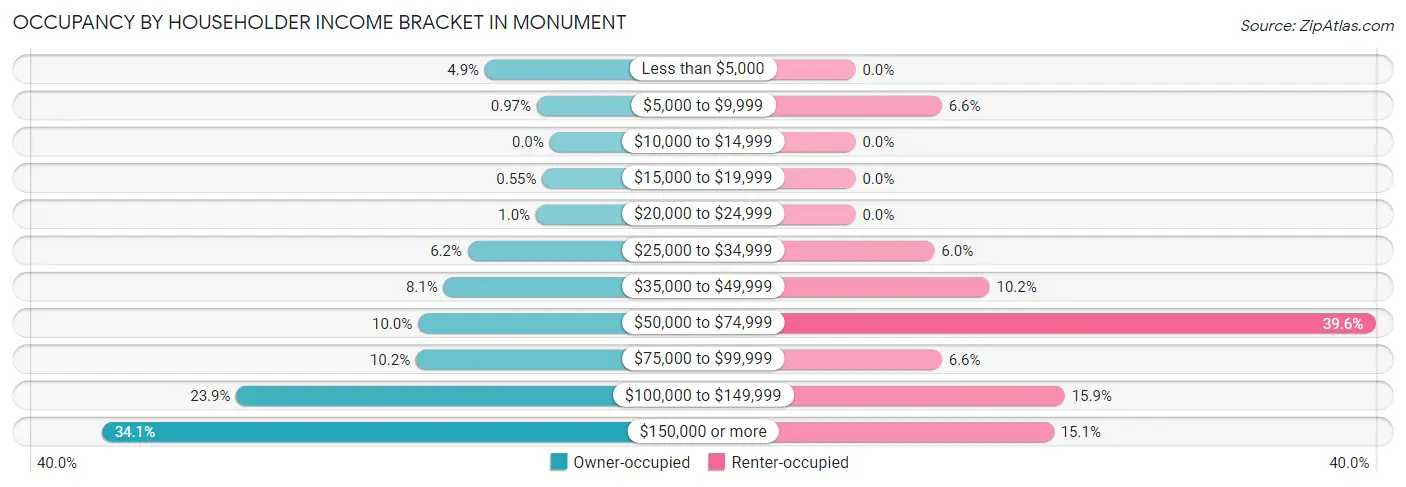
| Income Bracket | Owner-occupied | Renter-occupied |
| Less than $5,000 | 152 (4.9%) | 0 (0.0%) |
| $5,000 to $9,999 | 30 (1.0%) | 47 (6.6%) |
| $10,000 to $14,999 | 0 (0.0%) | 0 (0.0%) |
| $15,000 to $19,999 | 17 (0.5%) | 0 (0.0%) |
| $20,000 to $24,999 | 32 (1.0%) | 0 (0.0%) |
| $25,000 to $34,999 | 192 (6.2%) | 43 (6.0%) |
| $35,000 to $49,999 | 249 (8.1%) | 73 (10.2%) |
| $50,000 to $74,999 | 309 (10.0%) | 283 (39.6%) |
| $75,000 to $99,999 | 314 (10.2%) | 47 (6.6%) |
| $100,000 to $149,999 | 736 (23.9%) | 114 (15.9%) |
| $150,000 or more | 1,052 (34.1%) | 108 (15.1%) |
| Total | 3,083 (100.0%) | 715 (100.0%) |
Monthly Housing Cost Tiers in Monument
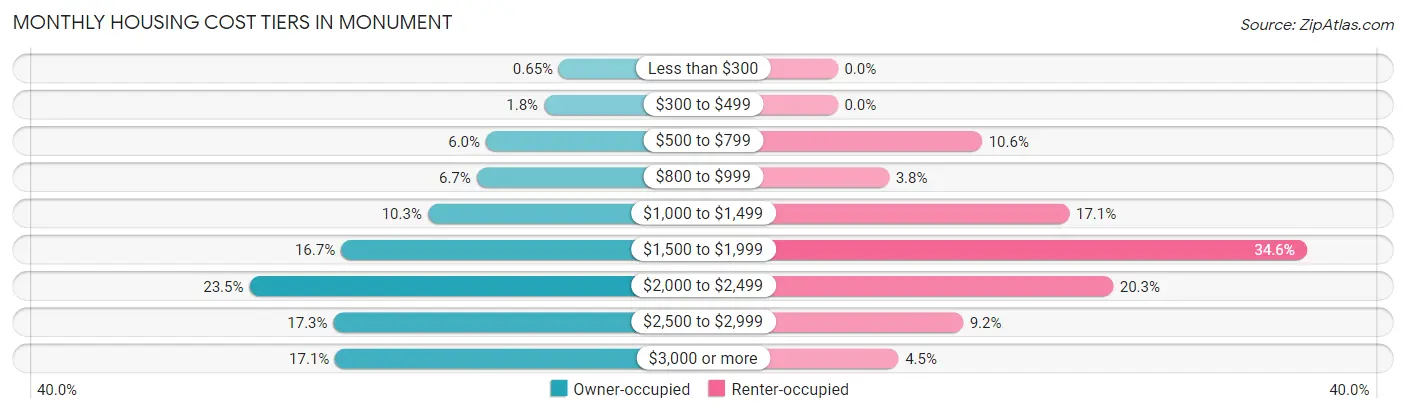
| Monthly Cost | Owner-occupied | Renter-occupied |
| Less than $300 | 20 (0.6%) | 0 (0.0%) |
| $300 to $499 | 54 (1.8%) | 0 (0.0%) |
| $500 to $799 | 186 (6.0%) | 76 (10.6%) |
| $800 to $999 | 207 (6.7%) | 27 (3.8%) |
| $1,000 to $1,499 | 318 (10.3%) | 122 (17.1%) |
| $1,500 to $1,999 | 515 (16.7%) | 247 (34.5%) |
| $2,000 to $2,499 | 723 (23.4%) | 145 (20.3%) |
| $2,500 to $2,999 | 532 (17.3%) | 66 (9.2%) |
| $3,000 or more | 528 (17.1%) | 32 (4.5%) |
| Total | 3,083 (100.0%) | 715 (100.0%) |
Physical Housing Characteristics in Monument
Housing Structures in Monument
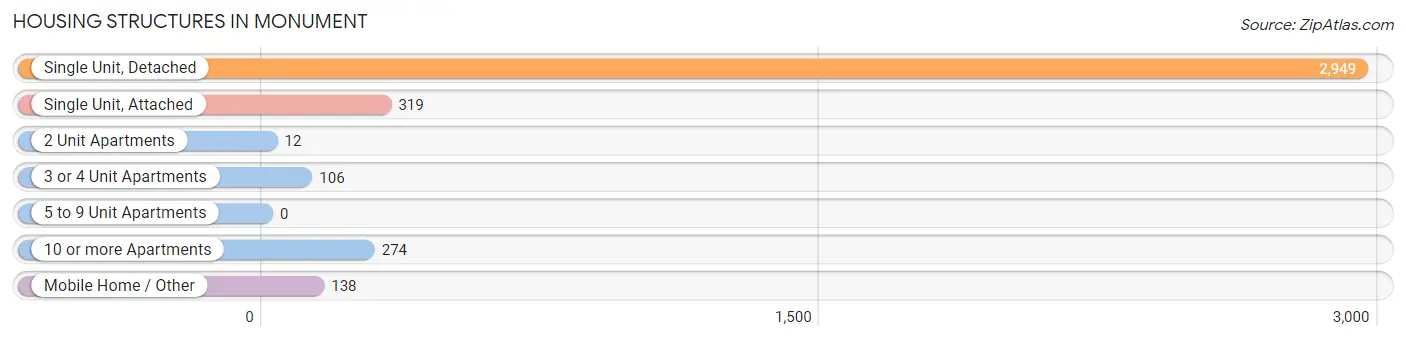
| Structure Type | # Housing Units | % Housing Units |
| Single Unit, Detached | 2,949 | 77.6% |
| Single Unit, Attached | 319 | 8.4% |
| 2 Unit Apartments | 12 | 0.3% |
| 3 or 4 Unit Apartments | 106 | 2.8% |
| 5 to 9 Unit Apartments | 0 | 0.0% |
| 10 or more Apartments | 274 | 7.2% |
| Mobile Home / Other | 138 | 3.6% |
| Total | 3,798 | 100.0% |
Housing Structures by Occupancy in Monument
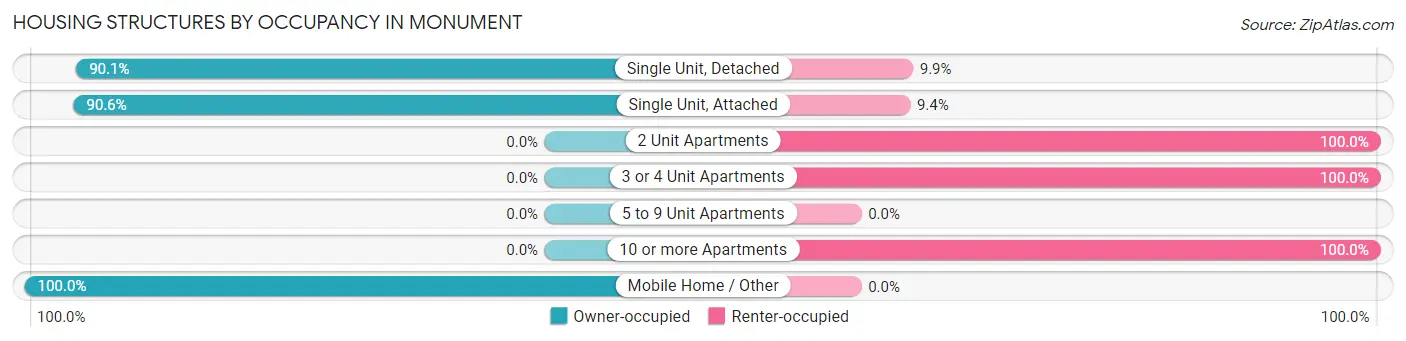
| Structure Type | Owner-occupied | Renter-occupied |
| Single Unit, Detached | 2,656 (90.1%) | 293 (9.9%) |
| Single Unit, Attached | 289 (90.6%) | 30 (9.4%) |
| 2 Unit Apartments | 0 (0.0%) | 12 (100.0%) |
| 3 or 4 Unit Apartments | 0 (0.0%) | 106 (100.0%) |
| 5 to 9 Unit Apartments | 0 (0.0%) | 0 (0.0%) |
| 10 or more Apartments | 0 (0.0%) | 274 (100.0%) |
| Mobile Home / Other | 138 (100.0%) | 0 (0.0%) |
| Total | 3,083 (81.2%) | 715 (18.8%) |
Housing Structures by Number of Rooms in Monument
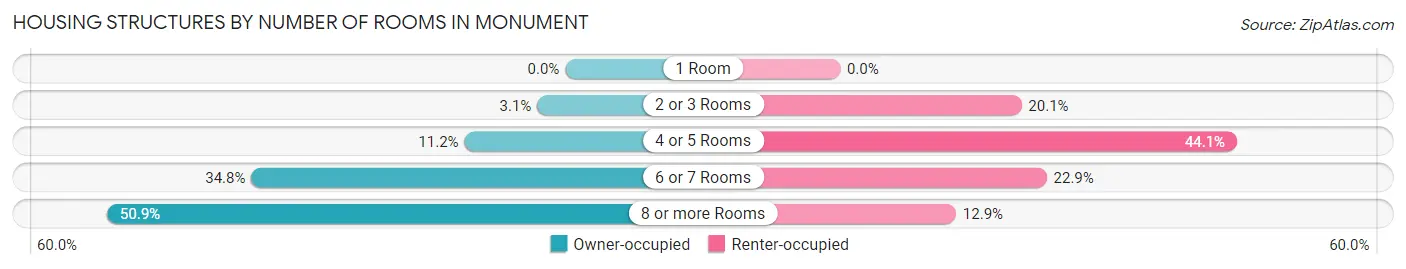
| Number of Rooms | Owner-occupied | Renter-occupied |
| 1 Room | 0 (0.0%) | 0 (0.0%) |
| 2 or 3 Rooms | 96 (3.1%) | 144 (20.1%) |
| 4 or 5 Rooms | 345 (11.2%) | 315 (44.1%) |
| 6 or 7 Rooms | 1,074 (34.8%) | 164 (22.9%) |
| 8 or more Rooms | 1,568 (50.9%) | 92 (12.9%) |
| Total | 3,083 (100.0%) | 715 (100.0%) |
Housing Structure by Heating Type in Monument
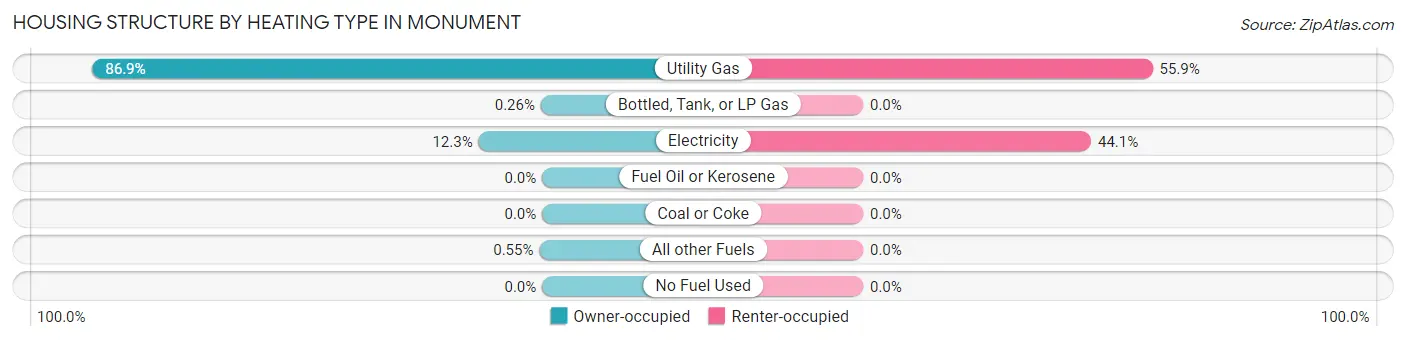
| Heating Type | Owner-occupied | Renter-occupied |
| Utility Gas | 2,679 (86.9%) | 400 (55.9%) |
| Bottled, Tank, or LP Gas | 8 (0.3%) | 0 (0.0%) |
| Electricity | 379 (12.3%) | 315 (44.1%) |
| Fuel Oil or Kerosene | 0 (0.0%) | 0 (0.0%) |
| Coal or Coke | 0 (0.0%) | 0 (0.0%) |
| All other Fuels | 17 (0.5%) | 0 (0.0%) |
| No Fuel Used | 0 (0.0%) | 0 (0.0%) |
| Total | 3,083 (100.0%) | 715 (100.0%) |
Household Vehicle Usage in Monument
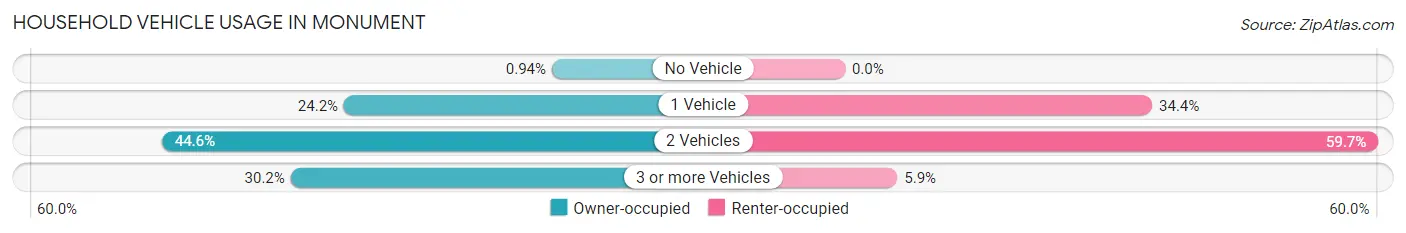
| Vehicles per Household | Owner-occupied | Renter-occupied |
| No Vehicle | 29 (0.9%) | 0 (0.0%) |
| 1 Vehicle | 747 (24.2%) | 246 (34.4%) |
| 2 Vehicles | 1,376 (44.6%) | 427 (59.7%) |
| 3 or more Vehicles | 931 (30.2%) | 42 (5.9%) |
| Total | 3,083 (100.0%) | 715 (100.0%) |
Real Estate & Mortgages in Monument
Real Estate and Mortgage Overview in Monument
| Characteristic | Without Mortgage | With Mortgage |
| Housing Units | 557 | 2,526 |
| Median Property Value | $501,000 | $497,700 |
| Median Household Income | $52,263 | $1,009 |
| Monthly Housing Costs | $839 | $528 |
| Real Estate Taxes | $2,371 | $11 |
Property Value by Mortgage Status in Monument
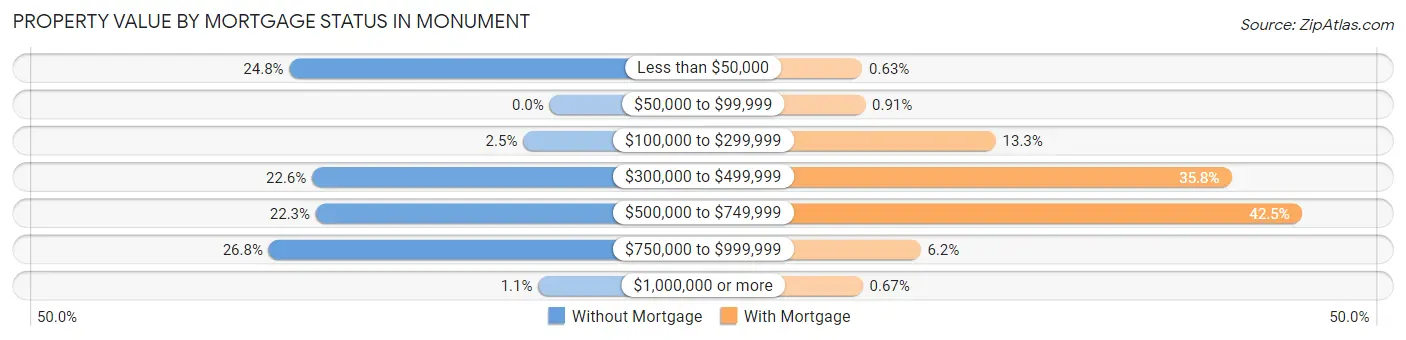
| Property Value | Without Mortgage | With Mortgage |
| Less than $50,000 | 138 (24.8%) | 16 (0.6%) |
| $50,000 to $99,999 | 0 (0.0%) | 23 (0.9%) |
| $100,000 to $299,999 | 14 (2.5%) | 337 (13.3%) |
| $300,000 to $499,999 | 126 (22.6%) | 904 (35.8%) |
| $500,000 to $749,999 | 124 (22.3%) | 1,073 (42.5%) |
| $750,000 to $999,999 | 149 (26.8%) | 156 (6.2%) |
| $1,000,000 or more | 6 (1.1%) | 17 (0.7%) |
| Total | 557 (100.0%) | 2,526 (100.0%) |
Household Income by Mortgage Status in Monument
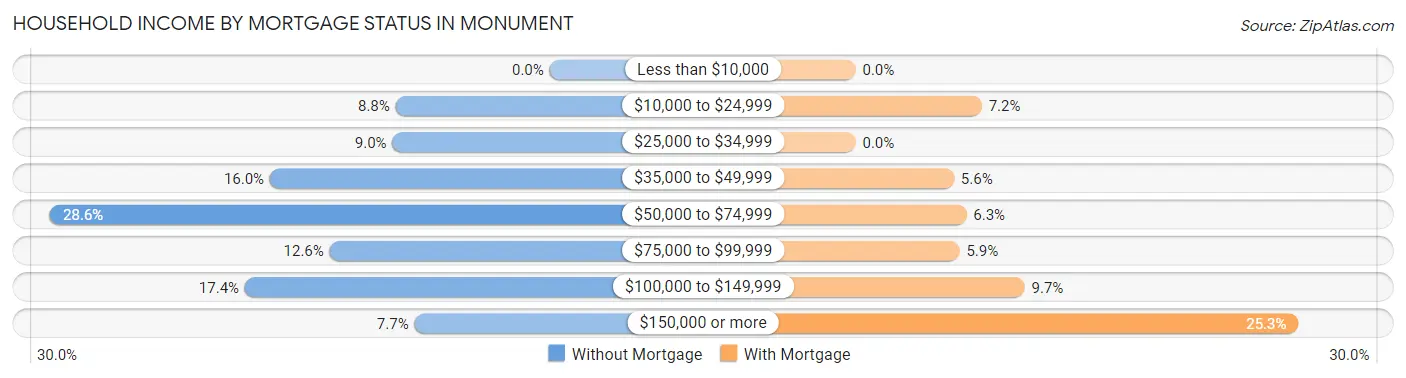
| Household Income | Without Mortgage | With Mortgage |
| Less than $10,000 | 0 (0.0%) | 0 (0.0%) |
| $10,000 to $24,999 | 49 (8.8%) | 182 (7.2%) |
| $25,000 to $34,999 | 50 (9.0%) | 0 (0.0%) |
| $35,000 to $49,999 | 89 (16.0%) | 142 (5.6%) |
| $50,000 to $74,999 | 159 (28.5%) | 160 (6.3%) |
| $75,000 to $99,999 | 70 (12.6%) | 150 (5.9%) |
| $100,000 to $149,999 | 97 (17.4%) | 244 (9.7%) |
| $150,000 or more | 43 (7.7%) | 639 (25.3%) |
| Total | 557 (100.0%) | 2,526 (100.0%) |
Property Value to Household Income Ratio in Monument
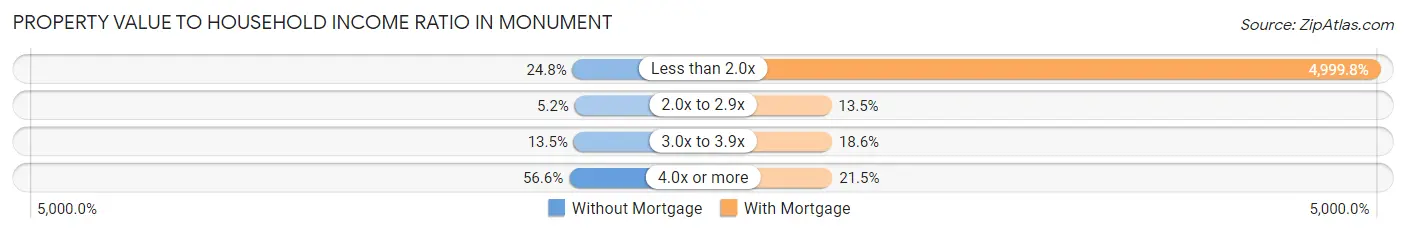
| Value-to-Income Ratio | Without Mortgage | With Mortgage |
| Less than 2.0x | 138 (24.8%) | 126,296 (4,999.8%) |
| 2.0x to 2.9x | 29 (5.2%) | 340 (13.5%) |
| 3.0x to 3.9x | 75 (13.5%) | 469 (18.6%) |
| 4.0x or more | 315 (56.6%) | 544 (21.5%) |
| Total | 557 (100.0%) | 2,526 (100.0%) |
Real Estate Taxes by Mortgage Status in Monument
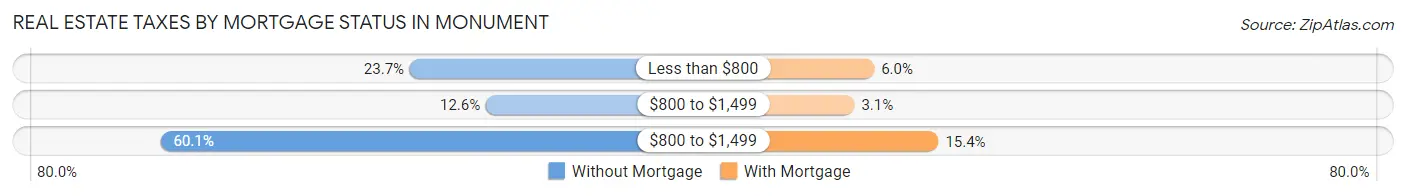
| Property Taxes | Without Mortgage | With Mortgage |
| Less than $800 | 132 (23.7%) | 152 (6.0%) |
| $800 to $1,499 | 70 (12.6%) | 79 (3.1%) |
| $800 to $1,499 | 335 (60.1%) | 389 (15.4%) |
| Total | 557 (100.0%) | 2,526 (100.0%) |
Health & Disability in Monument
Health Insurance Coverage by Age in Monument
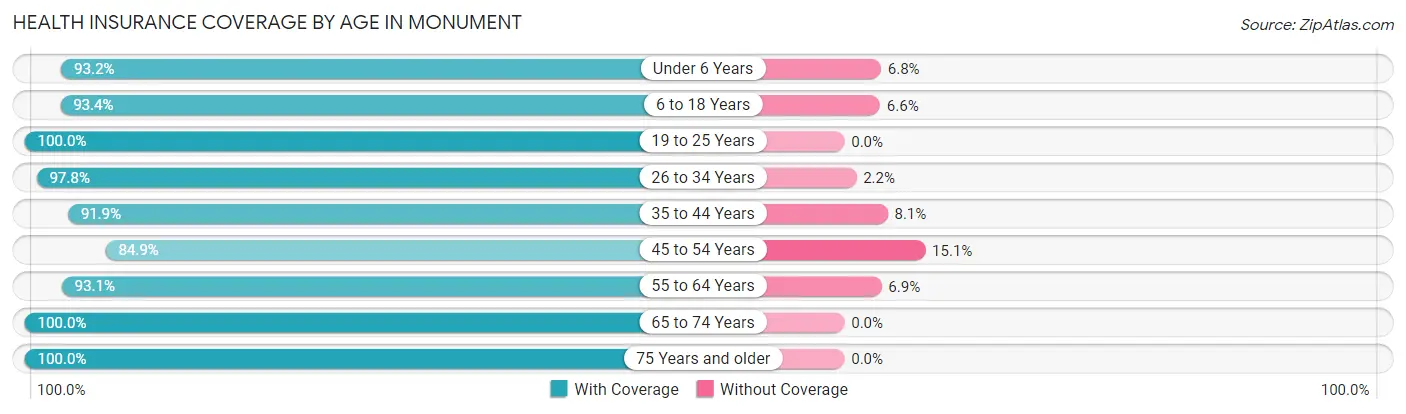
| Age Bracket | With Coverage | Without Coverage |
| Under 6 Years | 724 (93.2%) | 53 (6.8%) |
| 6 to 18 Years | 2,262 (93.4%) | 161 (6.6%) |
| 19 to 25 Years | 730 (100.0%) | 0 (0.0%) |
| 26 to 34 Years | 791 (97.8%) | 18 (2.2%) |
| 35 to 44 Years | 1,358 (91.9%) | 119 (8.1%) |
| 45 to 54 Years | 1,323 (84.9%) | 235 (15.1%) |
| 55 to 64 Years | 1,130 (93.1%) | 84 (6.9%) |
| 65 to 74 Years | 946 (100.0%) | 0 (0.0%) |
| 75 Years and older | 516 (100.0%) | 0 (0.0%) |
| Total | 9,780 (93.6%) | 670 (6.4%) |
Health Insurance Coverage by Citizenship Status in Monument
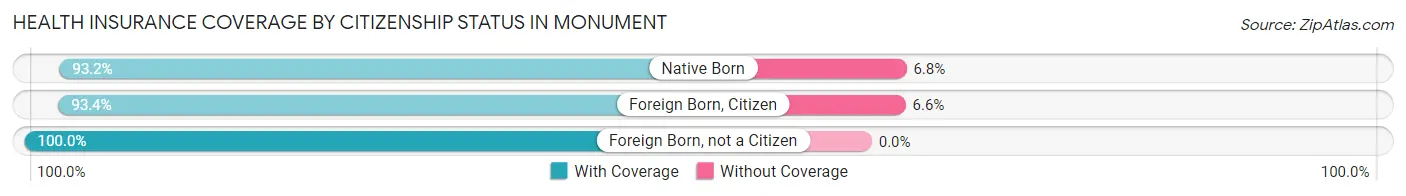
| Citizenship Status | With Coverage | Without Coverage |
| Native Born | 724 (93.2%) | 53 (6.8%) |
| Foreign Born, Citizen | 2,262 (93.4%) | 161 (6.6%) |
| Foreign Born, not a Citizen | 730 (100.0%) | 0 (0.0%) |
Health Insurance Coverage by Household Income in Monument
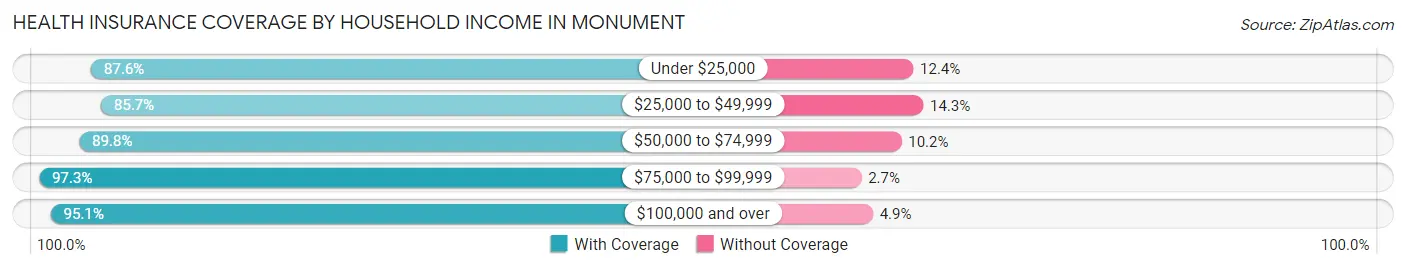
| Household Income | With Coverage | Without Coverage |
| Under $25,000 | 303 (87.6%) | 43 (12.4%) |
| $25,000 to $49,999 | 930 (85.7%) | 155 (14.3%) |
| $50,000 to $74,999 | 1,099 (89.8%) | 125 (10.2%) |
| $75,000 to $99,999 | 1,439 (97.3%) | 40 (2.7%) |
| $100,000 and over | 6,009 (95.1%) | 307 (4.9%) |
Public vs Private Health Insurance Coverage by Age in Monument
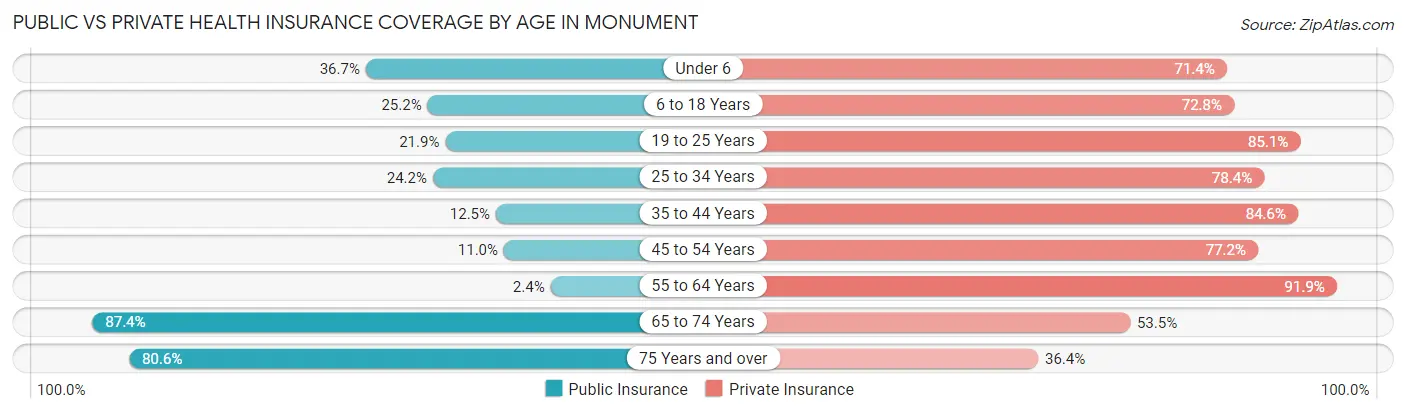
| Age Bracket | Public Insurance | Private Insurance |
| Under 6 | 285 (36.7%) | 555 (71.4%) |
| 6 to 18 Years | 611 (25.2%) | 1,763 (72.8%) |
| 19 to 25 Years | 160 (21.9%) | 621 (85.1%) |
| 25 to 34 Years | 196 (24.2%) | 634 (78.4%) |
| 35 to 44 Years | 185 (12.5%) | 1,250 (84.6%) |
| 45 to 54 Years | 172 (11.0%) | 1,203 (77.2%) |
| 55 to 64 Years | 29 (2.4%) | 1,115 (91.8%) |
| 65 to 74 Years | 827 (87.4%) | 506 (53.5%) |
| 75 Years and over | 416 (80.6%) | 188 (36.4%) |
| Total | 2,881 (27.6%) | 7,835 (75.0%) |
Disability Status by Sex by Age in Monument
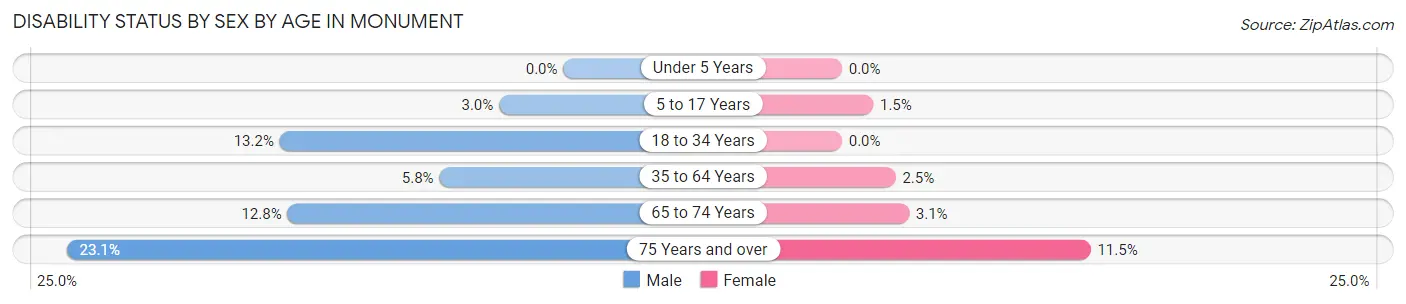
| Age Bracket | Male | Female |
| Under 5 Years | 0 (0.0%) | 0 (0.0%) |
| 5 to 17 Years | 36 (3.0%) | 17 (1.5%) |
| 18 to 34 Years | 123 (13.2%) | 0 (0.0%) |
| 35 to 64 Years | 113 (5.8%) | 57 (2.5%) |
| 65 to 74 Years | 43 (12.8%) | 19 (3.1%) |
| 75 Years and over | 65 (23.1%) | 27 (11.5%) |
Disability Class by Sex by Age in Monument
Disability Class: Hearing Difficulty
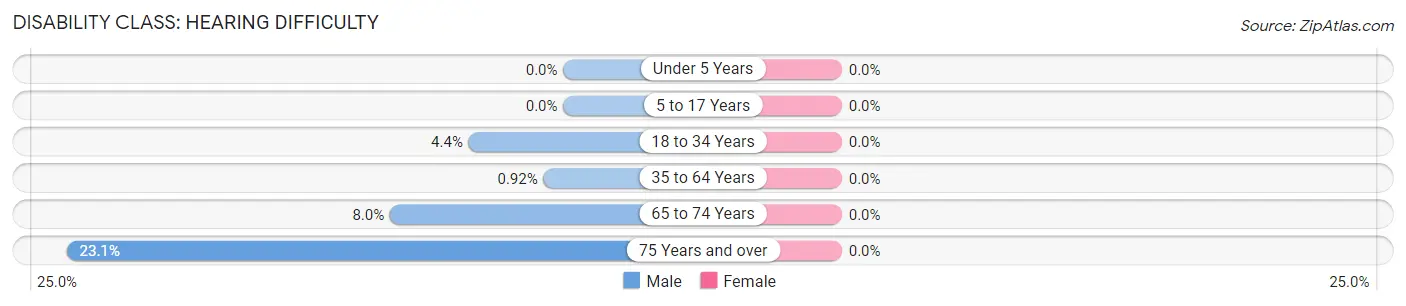
| Age Bracket | Male | Female |
| Under 5 Years | 0 (0.0%) | 0 (0.0%) |
| 5 to 17 Years | 0 (0.0%) | 0 (0.0%) |
| 18 to 34 Years | 41 (4.4%) | 0 (0.0%) |
| 35 to 64 Years | 18 (0.9%) | 0 (0.0%) |
| 65 to 74 Years | 27 (8.0%) | 0 (0.0%) |
| 75 Years and over | 65 (23.1%) | 0 (0.0%) |
Disability Class: Vision Difficulty
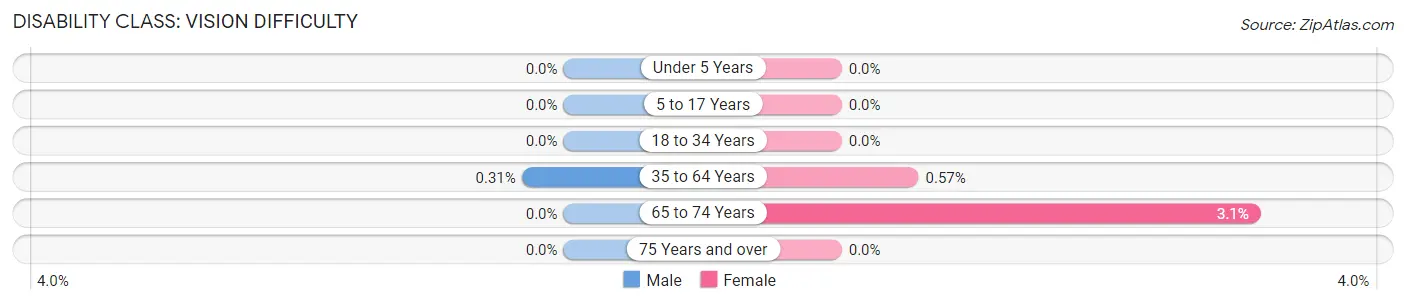
| Age Bracket | Male | Female |
| Under 5 Years | 0 (0.0%) | 0 (0.0%) |
| 5 to 17 Years | 0 (0.0%) | 0 (0.0%) |
| 18 to 34 Years | 0 (0.0%) | 0 (0.0%) |
| 35 to 64 Years | 6 (0.3%) | 13 (0.6%) |
| 65 to 74 Years | 0 (0.0%) | 19 (3.1%) |
| 75 Years and over | 0 (0.0%) | 0 (0.0%) |
Disability Class: Cognitive Difficulty
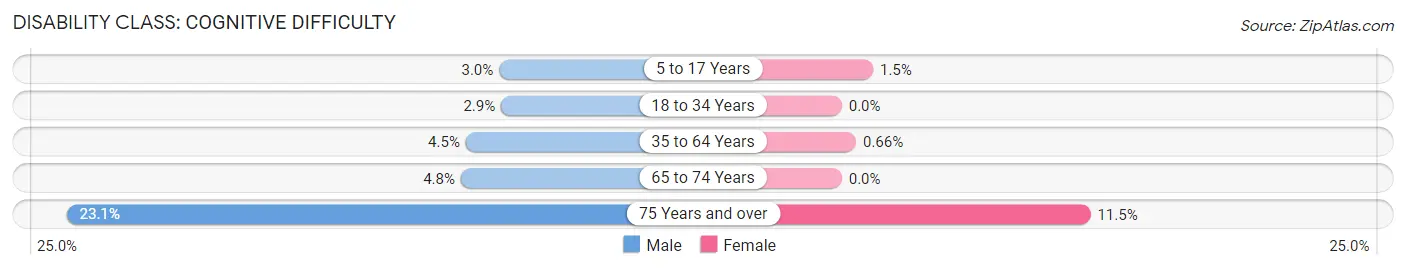
| Age Bracket | Male | Female |
| 5 to 17 Years | 36 (3.0%) | 17 (1.5%) |
| 18 to 34 Years | 27 (2.9%) | 0 (0.0%) |
| 35 to 64 Years | 89 (4.5%) | 15 (0.7%) |
| 65 to 74 Years | 16 (4.8%) | 0 (0.0%) |
| 75 Years and over | 65 (23.1%) | 27 (11.5%) |
Disability Class: Ambulatory Difficulty
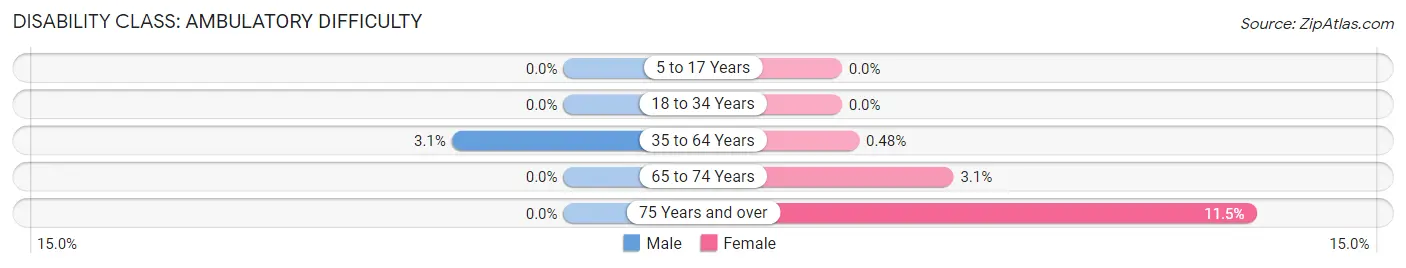
| Age Bracket | Male | Female |
| 5 to 17 Years | 0 (0.0%) | 0 (0.0%) |
| 18 to 34 Years | 0 (0.0%) | 0 (0.0%) |
| 35 to 64 Years | 61 (3.1%) | 11 (0.5%) |
| 65 to 74 Years | 0 (0.0%) | 19 (3.1%) |
| 75 Years and over | 0 (0.0%) | 27 (11.5%) |
Disability Class: Self-Care Difficulty
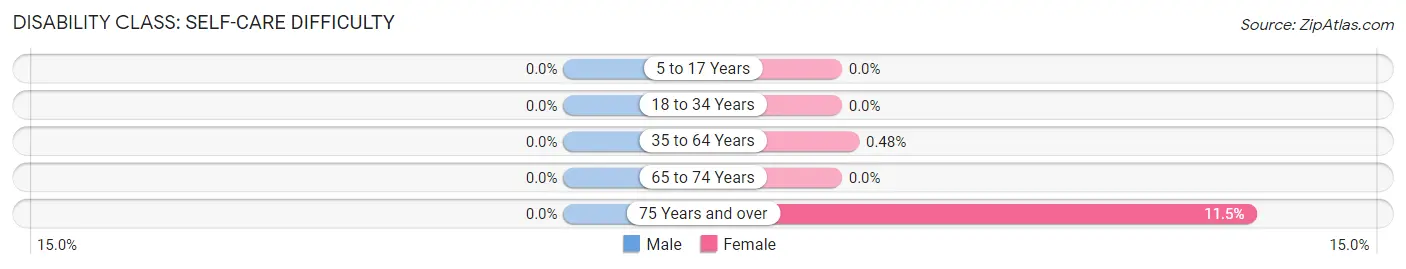
| Age Bracket | Male | Female |
| 5 to 17 Years | 0 (0.0%) | 0 (0.0%) |
| 18 to 34 Years | 0 (0.0%) | 0 (0.0%) |
| 35 to 64 Years | 0 (0.0%) | 11 (0.5%) |
| 65 to 74 Years | 0 (0.0%) | 0 (0.0%) |
| 75 Years and over | 0 (0.0%) | 27 (11.5%) |
Technology Access in Monument
Computing Device Access in Monument
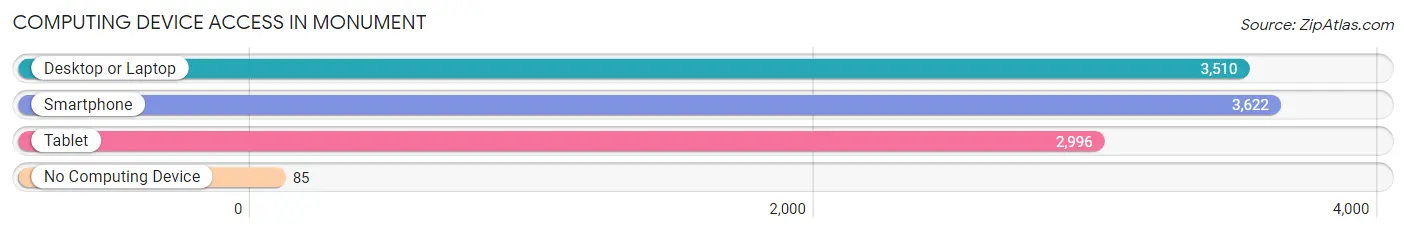
| Device Type | # Households | % Households |
| Desktop or Laptop | 3,510 | 92.4% |
| Smartphone | 3,622 | 95.4% |
| Tablet | 2,996 | 78.9% |
| No Computing Device | 85 | 2.2% |
| Total | 3,798 | 100.0% |
Internet Access in Monument
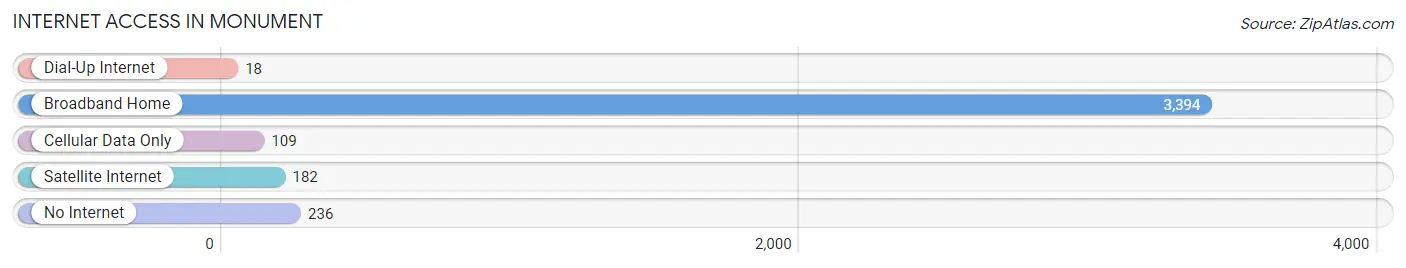
| Internet Type | # Households | % Households |
| Dial-Up Internet | 18 | 0.5% |
| Broadband Home | 3,394 | 89.4% |
| Cellular Data Only | 109 | 2.9% |
| Satellite Internet | 182 | 4.8% |
| No Internet | 236 | 6.2% |
| Total | 3,798 | 100.0% |
Monument Summary
Monument, Colorado is a small town located in El Paso County, Colorado, United States. It is situated at the base of the Rampart Range of the Rocky Mountains, approximately 20 miles north of Colorado Springs. The town was founded in 1879 and incorporated in 1881. As of the 2010 census, the population of Monument was 5,530.
Geography
Monument is located at the base of the Rampart Range of the Rocky Mountains, approximately 20 miles north of Colorado Springs. The town is situated at an elevation of 6,621 feet above sea level. The town is located in the Palmer Divide, a region of the Great Plains that separates the Arkansas and South Platte Rivers. The town is surrounded by rolling hills and open plains, with views of the Rocky Mountains to the west.
Climate
Monument has a semi-arid climate, with hot summers and cold winters. The average high temperature in July is 85°F, and the average low temperature in January is 17°F. The town receives an average of 16 inches of precipitation per year, with most of it falling in the spring and summer months.
Demographics
As of the 2010 census, the population of Monument was 5,530. The racial makeup of the town was 94.3% White, 0.7% African American, 0.7% Native American, 0.9% Asian, 0.1% Pacific Islander, 1.3% from other races, and 2.0% from two or more races. Hispanic or Latino of any race were 4.7% of the population.
Economy
Monument is a small town with a diverse economy. The town is home to a variety of businesses, including retail stores, restaurants, and professional services. The town is also home to several technology companies, including a software development firm and a telecommunications company. The town is also home to a number of small manufacturing companies, including a plastics manufacturer and a metal fabrication company.
The town is also home to a number of tourist attractions, including the Monument Lake Resort, the Monument Valley Park, and the Monument Valley Golf Course. The town is also home to a number of outdoor recreation opportunities, including hiking, biking, and fishing.
History
Monument was founded in 1879 by a group of settlers from Kansas. The town was named after the nearby Monument Rock, a large boulder that was used as a landmark by the settlers. The town was incorporated in 1881 and quickly grew to become a thriving community.
In the early 1900s, Monument was a popular tourist destination, with visitors coming to enjoy the scenic views of the Rocky Mountains. The town was also home to a number of businesses, including a hotel, a bank, and a general store.
In the 1950s, Monument began to experience a period of growth and development. The town was home to a number of new businesses, including a lumber yard, a hardware store, and a grocery store. The town also experienced a population boom, with the population increasing from 1,000 in 1950 to 5,530 in 2010.
Today, Monument is a small town with a diverse economy and a variety of attractions. The town is home to a number of businesses, including retail stores, restaurants, and professional services. The town is also home to a number of tourist attractions, including the Monument Lake Resort, the Monument Valley Park, and the Monument Valley Golf Course. The town is also home to a number of outdoor recreation opportunities, including hiking, biking, and fishing.
Common Questions
What is Per Capita Income in Monument?
Per Capita income in Monument is $44,556.
What is the Median Family Income in Monument?
Median Family Income in Monument is $126,866.
What is the Median Household income in Monument?
Median Household Income in Monument is $102,969.
What is Income or Wage Gap in Monument?
Income or Wage Gap in Monument is 37.8%.
Women in Monument earn 62.2 cents for every dollar earned by a man.
What is Family Income Deficit in Monument?
Family Income Deficit in Monument is $9,704.
Families that are below poverty line in Monument earn $9,704 less on average than the poverty threshold level.
What is Inequality or Gini Index in Monument?
Inequality or Gini Index in Monument is 0.40.
What is the Total Population of Monument?
Total Population of Monument is 10,548.
What is the Total Male Population of Monument?
Total Male Population of Monument is 5,250.
What is the Total Female Population of Monument?
Total Female Population of Monument is 5,298.
What is the Ratio of Males per 100 Females in Monument?
There are 99.09 Males per 100 Females in Monument.
What is the Ratio of Females per 100 Males in Monument?
There are 100.91 Females per 100 Males in Monument.
What is the Median Population Age in Monument?
Median Population Age in Monument is 38.3 Years.
What is the Average Family Size in Monument
Average Family Size in Monument is 3.3 People.
What is the Average Household Size in Monument
Average Household Size in Monument is 2.8 People.
How Large is the Labor Force in Monument?
There are 5,535 People in the Labor Forcein in Monument.
What is the Percentage of People in the Labor Force in Monument?
69.9% of People are in the Labor Force in Monument.
What is the Unemployment Rate in Monument?
Unemployment Rate in Monument is 4.9%.