Manassa, CO Map & Demographics
Manassa Map
Manassa Overview
$30,459
PER CAPITA INCOME
$70,714
AVG FAMILY INCOME
$60,441
AVG HOUSEHOLD INCOME
0.43
INEQUALITY / GINI INDEX
936
TOTAL POPULATION
480
MALE POPULATION
456
FEMALE POPULATION
105.26
MALES / 100 FEMALES
95.00
FEMALES / 100 MALES
37.7
MEDIAN AGE
3.1
AVG FAMILY SIZE
2.5
AVG HOUSEHOLD SIZE
472
LABOR FORCE [ PEOPLE ]
65.7%
PERCENT IN LABOR FORCE
2.8%
UNEMPLOYMENT RATE
Manassa Zip Codes
Manassa Area Codes
Income in Manassa
Income Overview in Manassa
Per Capita Income in Manassa is $30,459, while median incomes of families and households are $70,714 and $60,441 respectively.
| Characteristic | Number | Measure |
| Per Capita Income | 936 | $30,459 |
| Median Family Income | 252 | $70,714 |
| Mean Family Income | 252 | $83,665 |
| Median Household Income | 368 | $60,441 |
| Mean Household Income | 368 | $76,280 |
| Income Deficit | 252 | $0 |
| Wage / Income Gap (%) | 936 | 0.00% |
| Wage / Income Gap ($) | 936 | 100.00¢ per $1 |
| Gini / Inequality Index | 936 | 0.43 |
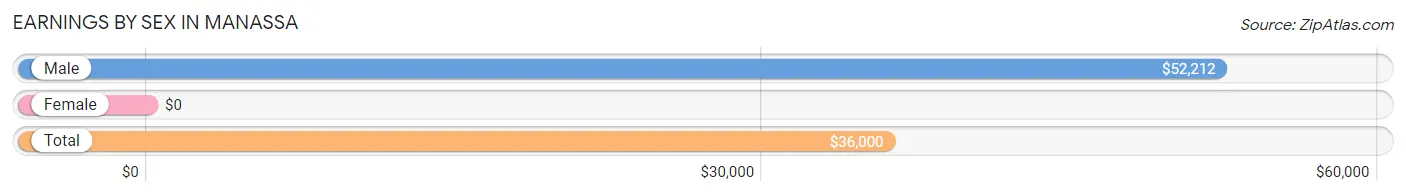
Earnings by Sex in Manassa
| Sex | Number | Average Earnings |
| Male | 261 (50.4%) | $52,212 |
| Female | 257 (49.6%) | $0 |
| Total | 518 (100.0%) | $36,000 |
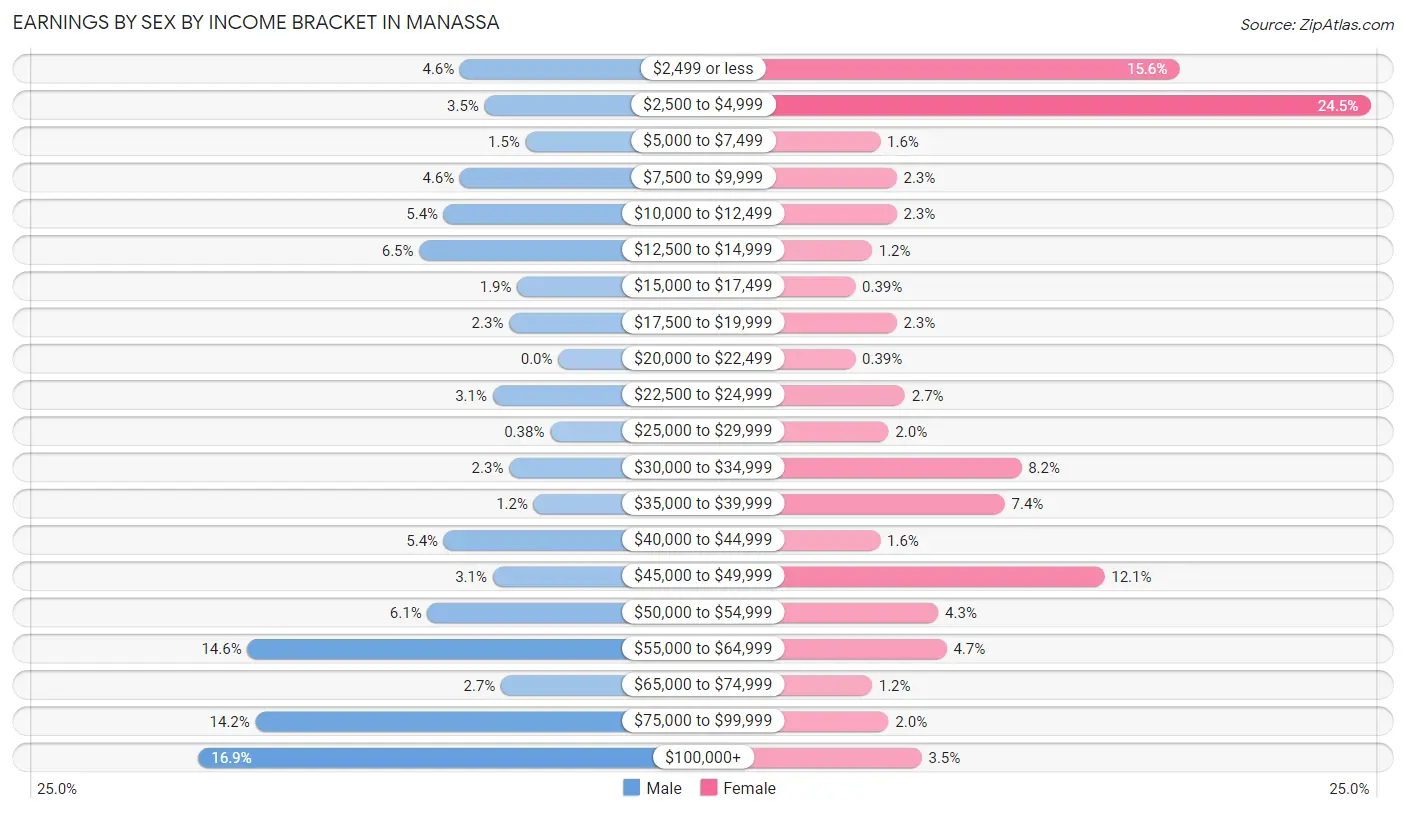
Earnings by Sex by Income Bracket in Manassa
The most common earnings brackets in Manassa are $100,000+ for men (44 | 16.9%) and $2,500 to $4,999 for women (63 | 24.5%).
| Income | Male | Female |
| $2,499 or less | 12 (4.6%) | 40 (15.6%) |
| $2,500 to $4,999 | 9 (3.5%) | 63 (24.5%) |
| $5,000 to $7,499 | 4 (1.5%) | 4 (1.6%) |
| $7,500 to $9,999 | 12 (4.6%) | 6 (2.3%) |
| $10,000 to $12,499 | 14 (5.4%) | 6 (2.3%) |
| $12,500 to $14,999 | 17 (6.5%) | 3 (1.2%) |
| $15,000 to $17,499 | 5 (1.9%) | 1 (0.4%) |
| $17,500 to $19,999 | 6 (2.3%) | 6 (2.3%) |
| $20,000 to $22,499 | 0 (0.0%) | 1 (0.4%) |
| $22,500 to $24,999 | 8 (3.1%) | 7 (2.7%) |
| $25,000 to $29,999 | 1 (0.4%) | 5 (1.9%) |
| $30,000 to $34,999 | 6 (2.3%) | 21 (8.2%) |
| $35,000 to $39,999 | 3 (1.1%) | 19 (7.4%) |
| $40,000 to $44,999 | 14 (5.4%) | 4 (1.6%) |
| $45,000 to $49,999 | 8 (3.1%) | 31 (12.1%) |
| $50,000 to $54,999 | 16 (6.1%) | 11 (4.3%) |
| $55,000 to $64,999 | 38 (14.6%) | 12 (4.7%) |
| $65,000 to $74,999 | 7 (2.7%) | 3 (1.2%) |
| $75,000 to $99,999 | 37 (14.2%) | 5 (1.9%) |
| $100,000+ | 44 (16.9%) | 9 (3.5%) |
| Total | 261 (100.0%) | 257 (100.0%) |
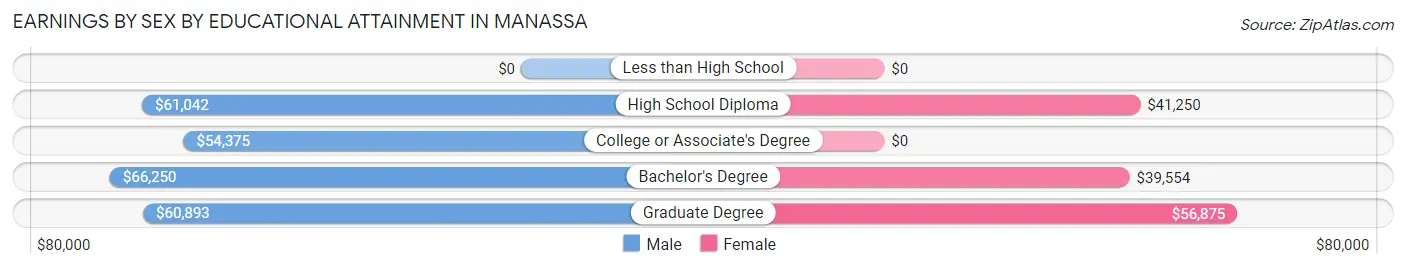
Earnings by Sex by Educational Attainment in Manassa
Average earnings in Manassa are $60,766 for men and $29,250 for women, a difference of 51.9%. Men with an educational attainment of bachelor's degree enjoy the highest average annual earnings of $66,250, while those with college or associate's degree education earn the least with $54,375. Women with an educational attainment of graduate degree earn the most with the average annual earnings of $56,875, while those with bachelor's degree education have the smallest earnings of $39,554.
| Educational Attainment | Male Income | Female Income |
| Less than High School | - | - |
| High School Diploma | $61,042 | $41,250 |
| College or Associate's Degree | $54,375 | $0 |
| Bachelor's Degree | $66,250 | $39,554 |
| Graduate Degree | $60,893 | $56,875 |
| Total | $60,766 | $29,250 |
Family Income in Manassa
Family Income Brackets in Manassa
According to the Manassa family income data, there are 52 families falling into the $75,000 to $99,999 income range, which is the most common income bracket and makes up 20.6% of all families. Conversely, the $10,000 to $14,999 income bracket is the least frequent group with only 4 families (1.6%) belonging to this category.
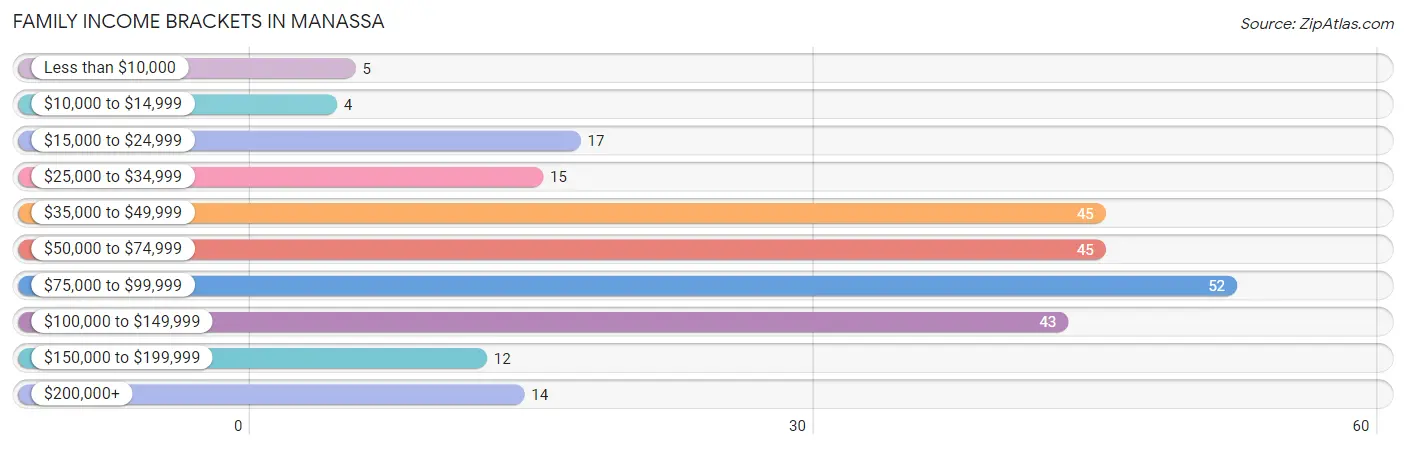
| Income Bracket | # Families | % Families |
| Less than $10,000 | 5 | 2.0% |
| $10,000 to $14,999 | 4 | 1.6% |
| $15,000 to $24,999 | 17 | 6.7% |
| $25,000 to $34,999 | 15 | 6.0% |
| $35,000 to $49,999 | 45 | 17.9% |
| $50,000 to $74,999 | 45 | 17.9% |
| $75,000 to $99,999 | 52 | 20.6% |
| $100,000 to $149,999 | 43 | 17.1% |
| $150,000 to $199,999 | 12 | 4.8% |
| $200,000+ | 14 | 5.6% |
Family Income by Famaliy Size in Manassa
4-person families (37 | 14.7%) account for the highest median family income in Manassa with $104,250 per family, while 2-person families (109 | 43.2%) have the highest median income of $31,562 per family member.
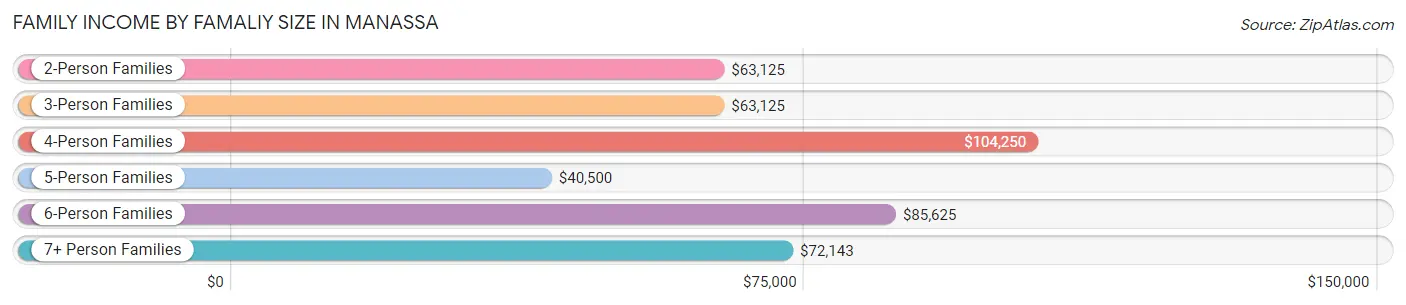
| Income Bracket | # Families | Median Income |
| 2-Person Families | 109 (43.2%) | $63,125 |
| 3-Person Families | 65 (25.8%) | $63,125 |
| 4-Person Families | 37 (14.7%) | $104,250 |
| 5-Person Families | 18 (7.1%) | $40,500 |
| 6-Person Families | 11 (4.4%) | $85,625 |
| 7+ Person Families | 12 (4.8%) | $72,143 |
| Total | 252 (100.0%) | $70,714 |
Family Income by Number of Earners in Manassa
The median family income in Manassa is $70,714, with families comprising 3+ earners (41) having the highest median family income of $128,125, while families with no earners (29) have the lowest median family income of $42,813, accounting for 16.3% and 11.5% of families, respectively.
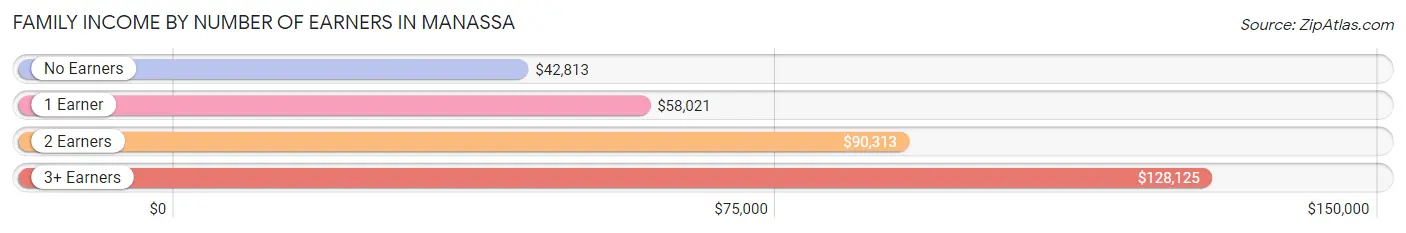
| Number of Earners | # Families | Median Income |
| No Earners | 29 (11.5%) | $42,813 |
| 1 Earner | 69 (27.4%) | $58,021 |
| 2 Earners | 113 (44.8%) | $90,313 |
| 3+ Earners | 41 (16.3%) | $128,125 |
| Total | 252 (100.0%) | $70,714 |
Household Income in Manassa
Household Income Brackets in Manassa
With 70 households falling in the category, the $35,000 to $49,999 income range is the most frequent in Manassa, accounting for 19.0% of all households. In contrast, only 12 households (3.3%) fall into the $150,000 to $199,999 income bracket, making it the least populous group.
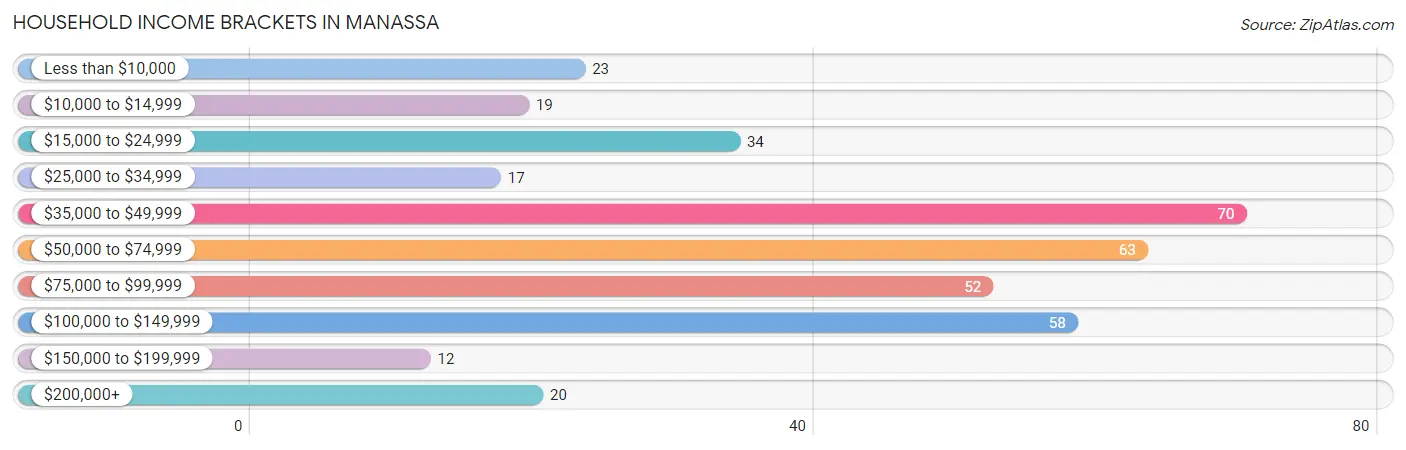
| Income Bracket | # Households | % Households |
| Less than $10,000 | 23 | 6.3% |
| $10,000 to $14,999 | 19 | 5.2% |
| $15,000 to $24,999 | 34 | 9.2% |
| $25,000 to $34,999 | 17 | 4.6% |
| $35,000 to $49,999 | 70 | 19.0% |
| $50,000 to $74,999 | 63 | 17.1% |
| $75,000 to $99,999 | 52 | 14.1% |
| $100,000 to $149,999 | 58 | 15.8% |
| $150,000 to $199,999 | 12 | 3.3% |
| $200,000+ | 20 | 5.4% |
Household Income by Householder Age in Manassa
The median household income in Manassa is $60,441, with the highest median household income of $65,500 found in the 45 to 64 years age bracket for the primary householder. A total of 132 households (35.9%) fall into this category. Meanwhile, the 15 to 24 years age bracket for the primary householder has the lowest median household income of $0, with 2 households (0.5%) in this group.
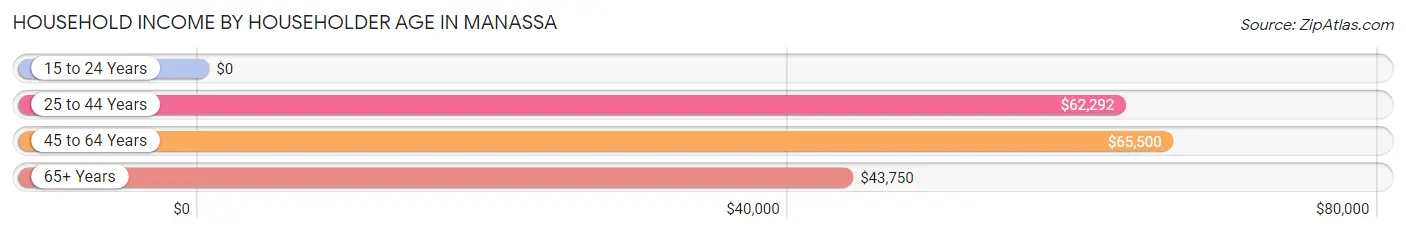
| Income Bracket | # Households | Median Income |
| 15 to 24 Years | 2 (0.5%) | $0 |
| 25 to 44 Years | 127 (34.5%) | $62,292 |
| 45 to 64 Years | 132 (35.9%) | $65,500 |
| 65+ Years | 107 (29.1%) | $43,750 |
| Total | 368 (100.0%) | $60,441 |
Poverty in Manassa
Income Below Poverty by Sex and Age in Manassa
With 17.7% poverty level for males and 13.2% for females among the residents of Manassa, 6 to 11 year old males and under 5 year old females are the most vulnerable to poverty, with 20 males (42.5%) and 8 females (30.8%) in their respective age groups living below the poverty level.
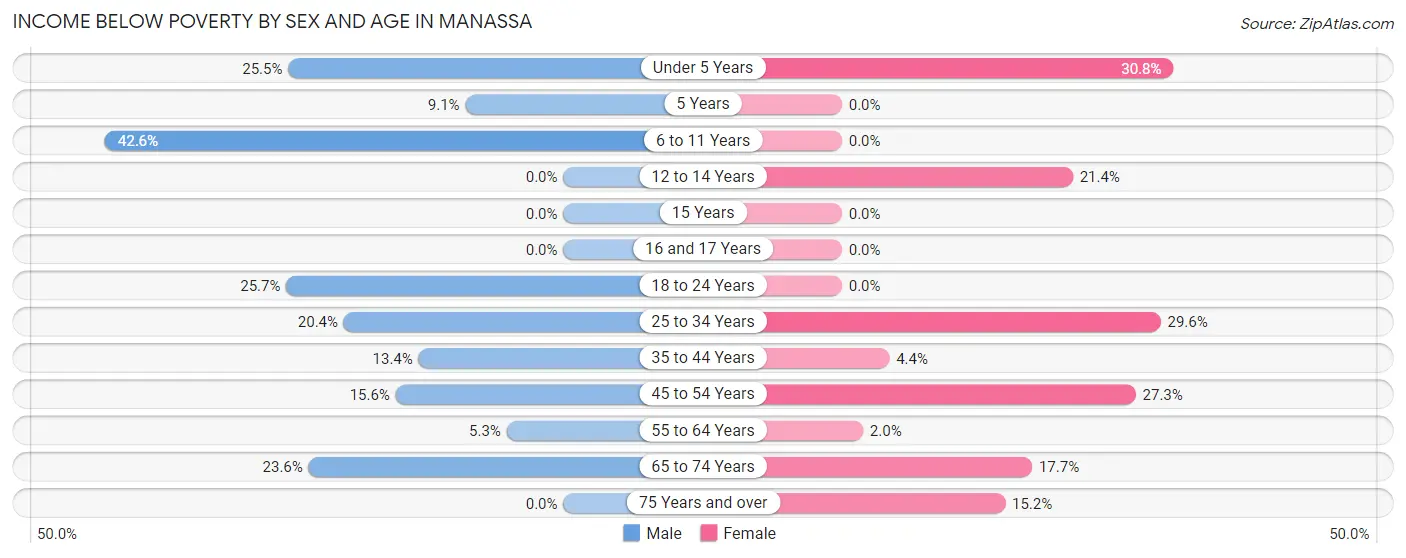
| Age Bracket | Male | Female |
| Under 5 Years | 12 (25.5%) | 8 (30.8%) |
| 5 Years | 1 (9.1%) | 0 (0.0%) |
| 6 to 11 Years | 20 (42.5%) | 0 (0.0%) |
| 12 to 14 Years | 0 (0.0%) | 3 (21.4%) |
| 15 Years | 0 (0.0%) | 0 (0.0%) |
| 16 and 17 Years | 0 (0.0%) | 0 (0.0%) |
| 18 to 24 Years | 9 (25.7%) | 0 (0.0%) |
| 25 to 34 Years | 11 (20.4%) | 21 (29.6%) |
| 35 to 44 Years | 9 (13.4%) | 4 (4.4%) |
| 45 to 54 Years | 7 (15.6%) | 12 (27.3%) |
| 55 to 64 Years | 3 (5.3%) | 1 (2.0%) |
| 65 to 74 Years | 13 (23.6%) | 6 (17.6%) |
| 75 Years and over | 0 (0.0%) | 5 (15.1%) |
| Total | 85 (17.7%) | 60 (13.2%) |
Income Above Poverty by Sex and Age in Manassa
According to the poverty statistics in Manassa, males aged 12 to 14 years and females aged 6 to 11 years are the age groups that are most secure financially, with 100.0% of males and 100.0% of females in these age groups living above the poverty line.
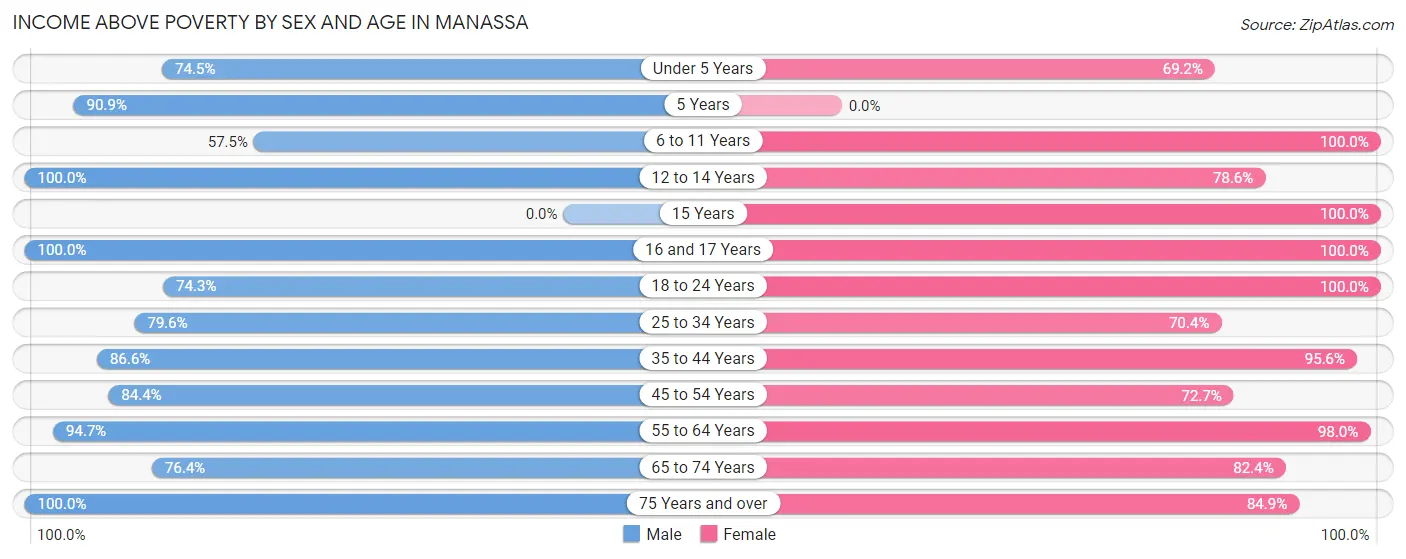
| Age Bracket | Male | Female |
| Under 5 Years | 35 (74.5%) | 18 (69.2%) |
| 5 Years | 10 (90.9%) | 0 (0.0%) |
| 6 to 11 Years | 27 (57.5%) | 52 (100.0%) |
| 12 to 14 Years | 12 (100.0%) | 11 (78.6%) |
| 15 Years | 0 (0.0%) | 9 (100.0%) |
| 16 and 17 Years | 12 (100.0%) | 15 (100.0%) |
| 18 to 24 Years | 26 (74.3%) | 16 (100.0%) |
| 25 to 34 Years | 43 (79.6%) | 50 (70.4%) |
| 35 to 44 Years | 58 (86.6%) | 87 (95.6%) |
| 45 to 54 Years | 38 (84.4%) | 32 (72.7%) |
| 55 to 64 Years | 54 (94.7%) | 50 (98.0%) |
| 65 to 74 Years | 42 (76.4%) | 28 (82.4%) |
| 75 Years and over | 38 (100.0%) | 28 (84.9%) |
| Total | 395 (82.3%) | 396 (86.8%) |
Income Below Poverty Among Married-Couple Families in Manassa
The poverty statistics for married-couple families in Manassa show that 7.6% or 15 of the total 198 families live below the poverty line. Families with 3 or 4 children have the highest poverty rate of 33.3%, comprising of 8 families. On the other hand, families with 5 or more children have the lowest poverty rate of 0.0%, which includes 0 families.
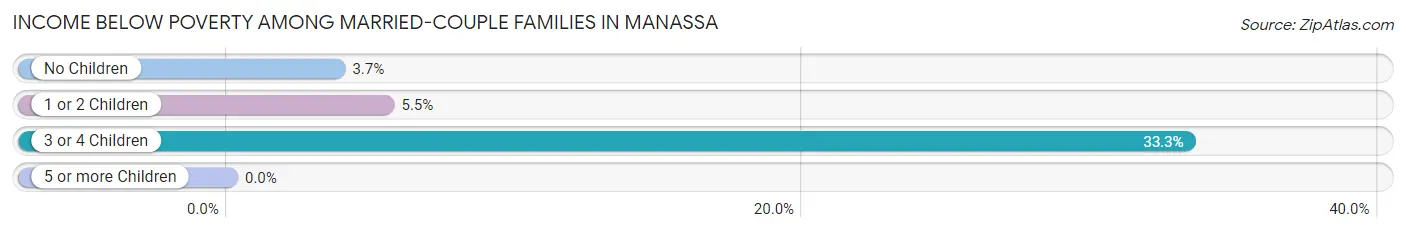
| Children | Above Poverty | Below Poverty |
| No Children | 103 (96.3%) | 4 (3.7%) |
| 1 or 2 Children | 52 (94.6%) | 3 (5.4%) |
| 3 or 4 Children | 16 (66.7%) | 8 (33.3%) |
| 5 or more Children | 12 (100.0%) | 0 (0.0%) |
| Total | 183 (92.4%) | 15 (7.6%) |
Income Below Poverty Among Single-Parent Households in Manassa
According to the poverty data in Manassa, 27.3% or 6 single-father households and 9.4% or 3 single-mother households are living below the poverty line. Among single-father households, those with 1 or 2 children have the highest poverty rate, with 6 households (54.5%) experiencing poverty. Likewise, among single-mother households, those with 1 or 2 children have the highest poverty rate, with 3 households (15.0%) falling below the poverty line.
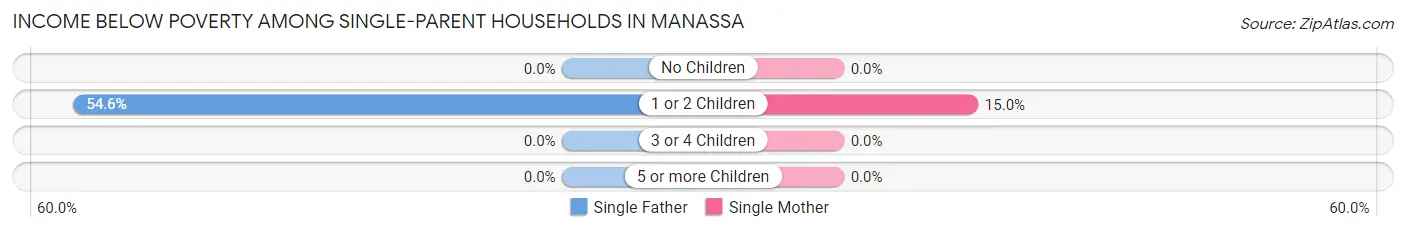
| Children | Single Father | Single Mother |
| No Children | 0 (0.0%) | 0 (0.0%) |
| 1 or 2 Children | 6 (54.5%) | 3 (15.0%) |
| 3 or 4 Children | 0 (0.0%) | 0 (0.0%) |
| 5 or more Children | 0 (0.0%) | 0 (0.0%) |
| Total | 6 (27.3%) | 3 (9.4%) |
Income Below Poverty Among Married-Couple vs Single-Parent Households in Manassa
The poverty data for Manassa shows that 15 of the married-couple family households (7.6%) and 9 of the single-parent households (16.7%) are living below the poverty level. Within the married-couple family households, those with 3 or 4 children have the highest poverty rate, with 8 households (33.3%) falling below the poverty line. Among the single-parent households, those with 1 or 2 children have the highest poverty rate, with 9 household (29.0%) living below poverty.
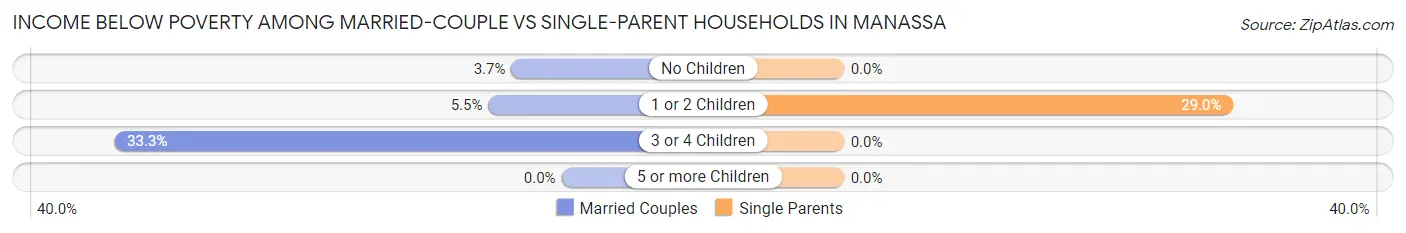
| Children | Married-Couple Families | Single-Parent Households |
| No Children | 4 (3.7%) | 0 (0.0%) |
| 1 or 2 Children | 3 (5.4%) | 9 (29.0%) |
| 3 or 4 Children | 8 (33.3%) | 0 (0.0%) |
| 5 or more Children | 0 (0.0%) | 0 (0.0%) |
| Total | 15 (7.6%) | 9 (16.7%) |
Race in Manassa
The most populous races in Manassa are White / Caucasian (640 | 68.4%), Hispanic or Latino (455 | 48.6%), and Two or more Races (207 | 22.1%).
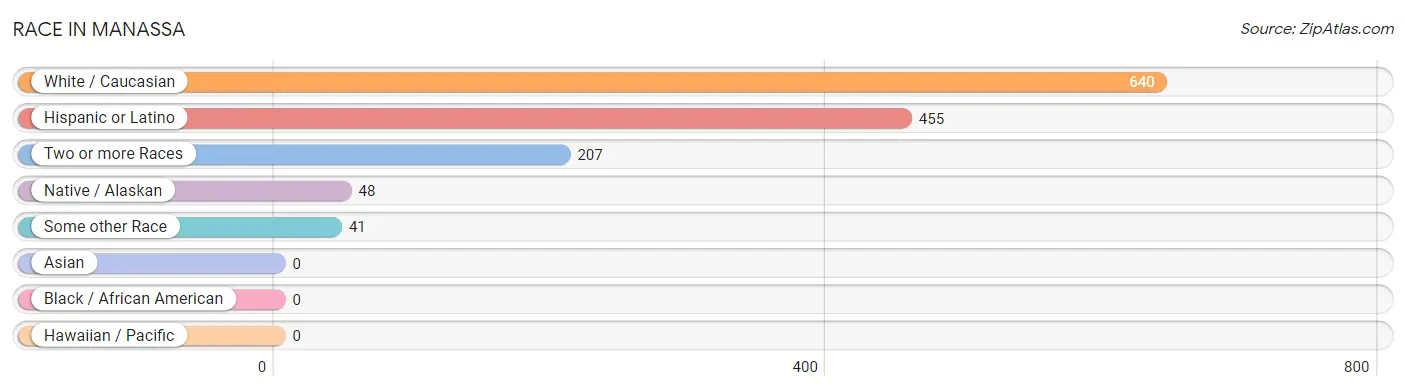
| Race | # Population | % Population |
| Asian | 0 | 0.0% |
| Black / African American | 0 | 0.0% |
| Hawaiian / Pacific | 0 | 0.0% |
| Hispanic or Latino | 455 | 48.6% |
| Native / Alaskan | 48 | 5.1% |
| White / Caucasian | 640 | 68.4% |
| Two or more Races | 207 | 22.1% |
| Some other Race | 41 | 4.4% |
| Total | 936 | 100.0% |
Ancestry in Manassa
The most populous ancestries reported in Manassa are Mexican (182 | 19.4%), English (145 | 15.5%), German (135 | 14.4%), Spaniard (95 | 10.2%), and Spanish (70 | 7.5%), together accounting for 67.0% of all Manassa residents.
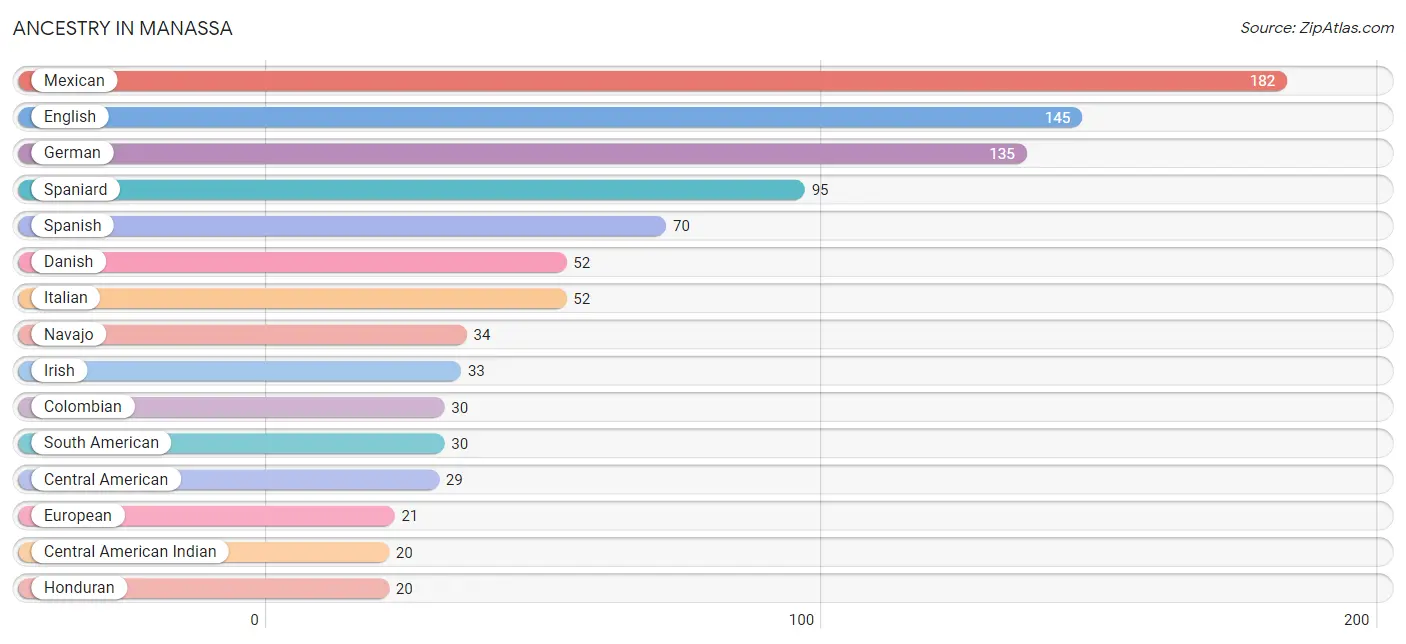
| Ancestry | # Population | % Population |
| American | 10 | 1.1% |
| Austrian | 2 | 0.2% |
| Blackfeet | 10 | 1.1% |
| Burmese | 10 | 1.1% |
| Central American | 29 | 3.1% |
| Central American Indian | 20 | 2.1% |
| Colombian | 30 | 3.2% |
| Danish | 52 | 5.6% |
| Dutch | 7 | 0.7% |
| English | 145 | 15.5% |
| European | 21 | 2.2% |
| French | 9 | 1.0% |
| German | 135 | 14.4% |
| Guatemalan | 9 | 1.0% |
| Honduran | 20 | 2.1% |
| Irish | 33 | 3.5% |
| Italian | 52 | 5.6% |
| Mexican | 182 | 19.4% |
| Navajo | 34 | 3.6% |
| Norwegian | 11 | 1.2% |
| Scandinavian | 7 | 0.7% |
| Scottish | 4 | 0.4% |
| South American | 30 | 3.2% |
| Spaniard | 95 | 10.2% |
| Spanish | 70 | 7.5% |
| Spanish American | 11 | 1.2% |
| Swedish | 8 | 0.9% |
| Welsh | 3 | 0.3% | View All 28 Rows |
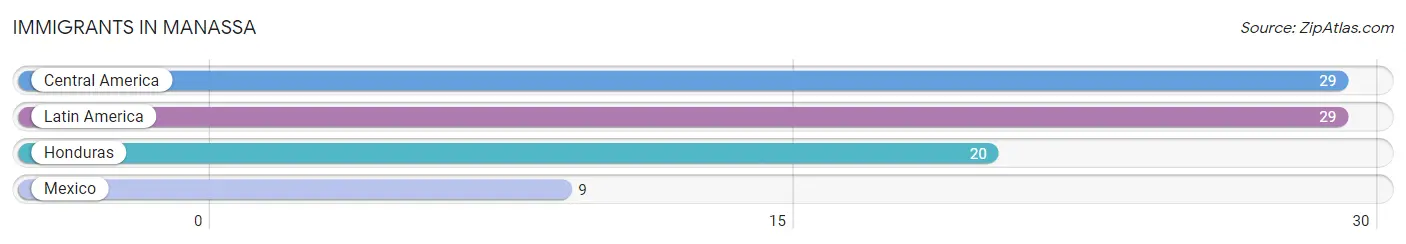
Immigrants in Manassa
The most numerous immigrant groups reported in Manassa came from Central America (29 | 3.1%), Latin America (29 | 3.1%), Honduras (20 | 2.1%), and Mexico (9 | 1.0%), together accounting for 9.3% of all Manassa residents.
| Immigration Origin | # Population | % Population |
| Central America | 29 | 3.1% |
| Honduras | 20 | 2.1% |
| Latin America | 29 | 3.1% |
| Mexico | 9 | 1.0% | View All 4 Rows |
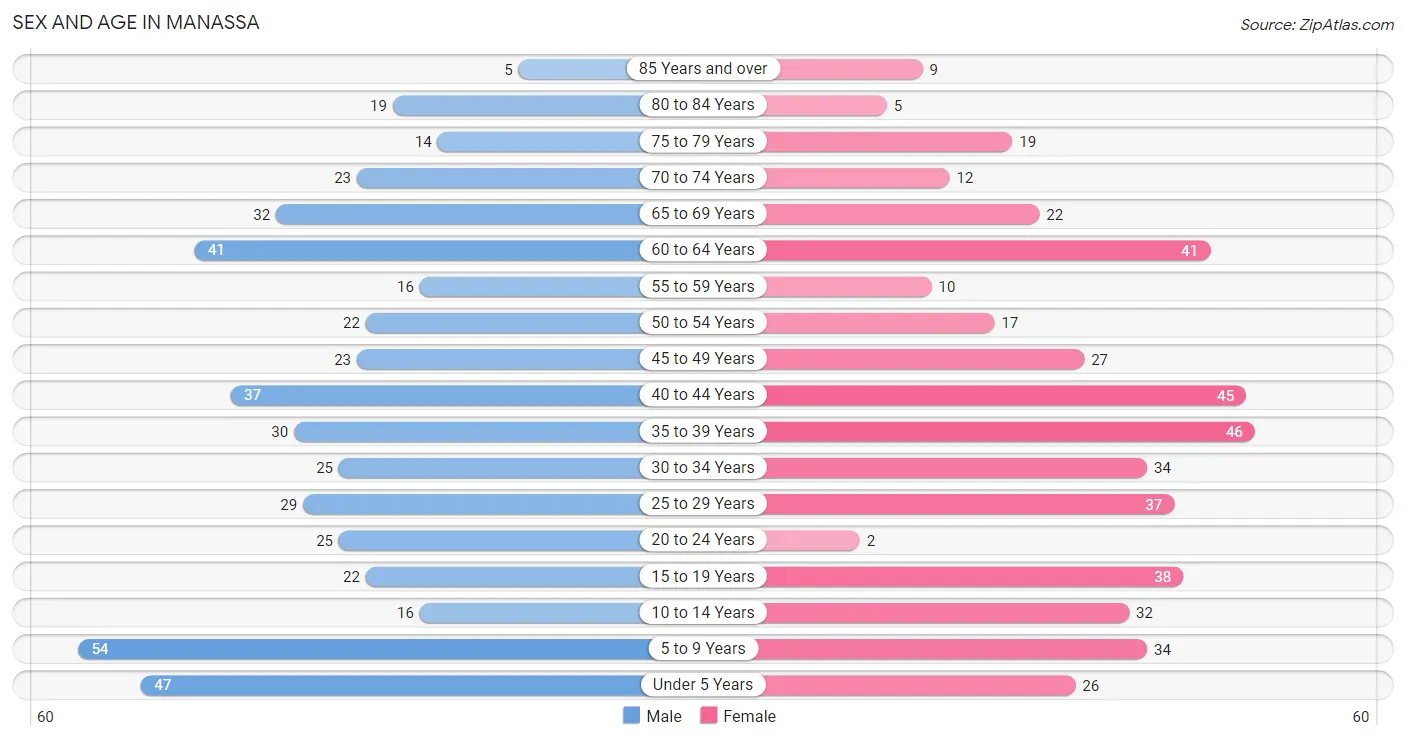
Sex and Age in Manassa
Sex and Age in Manassa
The most populous age groups in Manassa are 5 to 9 Years (54 | 11.3%) for men and 35 to 39 Years (46 | 10.1%) for women.
| Age Bracket | Male | Female |
| Under 5 Years | 47 (9.8%) | 26 (5.7%) |
| 5 to 9 Years | 54 (11.3%) | 34 (7.5%) |
| 10 to 14 Years | 16 (3.3%) | 32 (7.0%) |
| 15 to 19 Years | 22 (4.6%) | 38 (8.3%) |
| 20 to 24 Years | 25 (5.2%) | 2 (0.4%) |
| 25 to 29 Years | 29 (6.0%) | 37 (8.1%) |
| 30 to 34 Years | 25 (5.2%) | 34 (7.5%) |
| 35 to 39 Years | 30 (6.2%) | 46 (10.1%) |
| 40 to 44 Years | 37 (7.7%) | 45 (9.9%) |
| 45 to 49 Years | 23 (4.8%) | 27 (5.9%) |
| 50 to 54 Years | 22 (4.6%) | 17 (3.7%) |
| 55 to 59 Years | 16 (3.3%) | 10 (2.2%) |
| 60 to 64 Years | 41 (8.5%) | 41 (9.0%) |
| 65 to 69 Years | 32 (6.7%) | 22 (4.8%) |
| 70 to 74 Years | 23 (4.8%) | 12 (2.6%) |
| 75 to 79 Years | 14 (2.9%) | 19 (4.2%) |
| 80 to 84 Years | 19 (4.0%) | 5 (1.1%) |
| 85 Years and over | 5 (1.0%) | 9 (2.0%) |
| Total | 480 (100.0%) | 456 (100.0%) |
Families and Households in Manassa
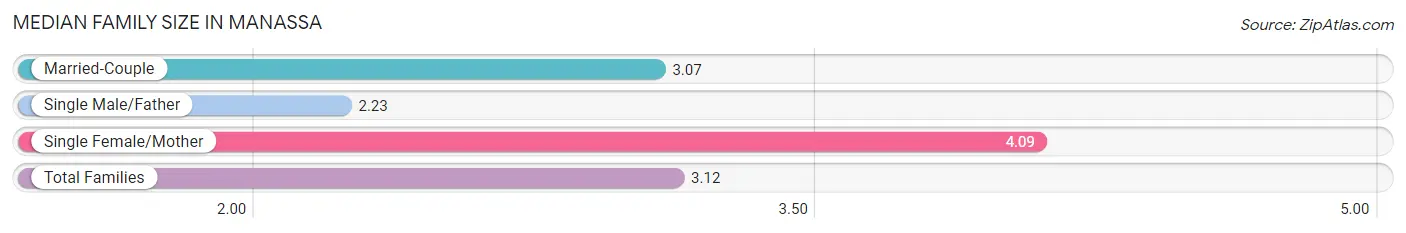
Median Family Size in Manassa
The median family size in Manassa is 3.12 persons per family, with single female/mother families (32 | 12.7%) accounting for the largest median family size of 4.09 persons per family. On the other hand, single male/father families (22 | 8.7%) represent the smallest median family size with 2.23 persons per family.
| Family Type | # Families | Family Size |
| Married-Couple | 198 (78.6%) | 3.07 |
| Single Male/Father | 22 (8.7%) | 2.23 |
| Single Female/Mother | 32 (12.7%) | 4.09 |
| Total Families | 252 (100.0%) | 3.12 |
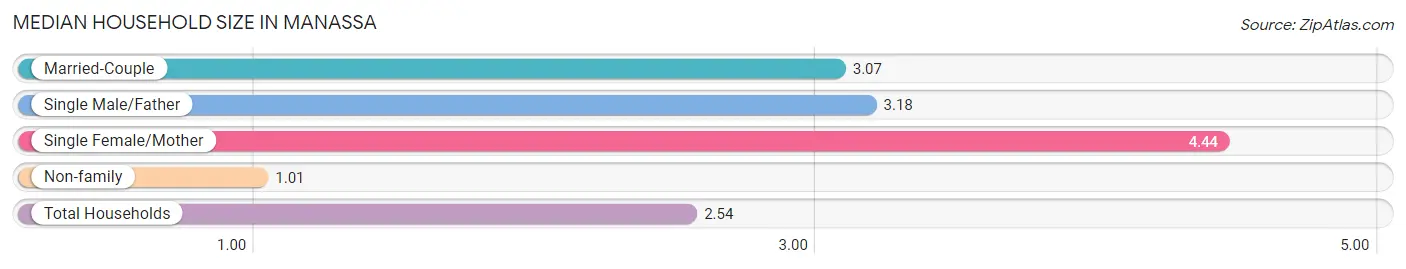
Median Household Size in Manassa
The median household size in Manassa is 2.54 persons per household, with single female/mother households (32 | 8.7%) accounting for the largest median household size of 4.44 persons per household. non-family households (116 | 31.5%) represent the smallest median household size with 1.01 persons per household.
| Household Type | # Households | Household Size |
| Married-Couple | 198 (53.8%) | 3.07 |
| Single Male/Father | 22 (6.0%) | 3.18 |
| Single Female/Mother | 32 (8.7%) | 4.44 |
| Non-family | 116 (31.5%) | 1.01 |
| Total Households | 368 (100.0%) | 2.54 |
Household Size by Marriage Status in Manassa
Out of a total of 368 households in Manassa, 252 (68.5%) are family households, while 116 (31.5%) are nonfamily households. The most numerous type of family households are 2-person households, comprising 103, and the most common type of nonfamily households are 1-person households, comprising 112.
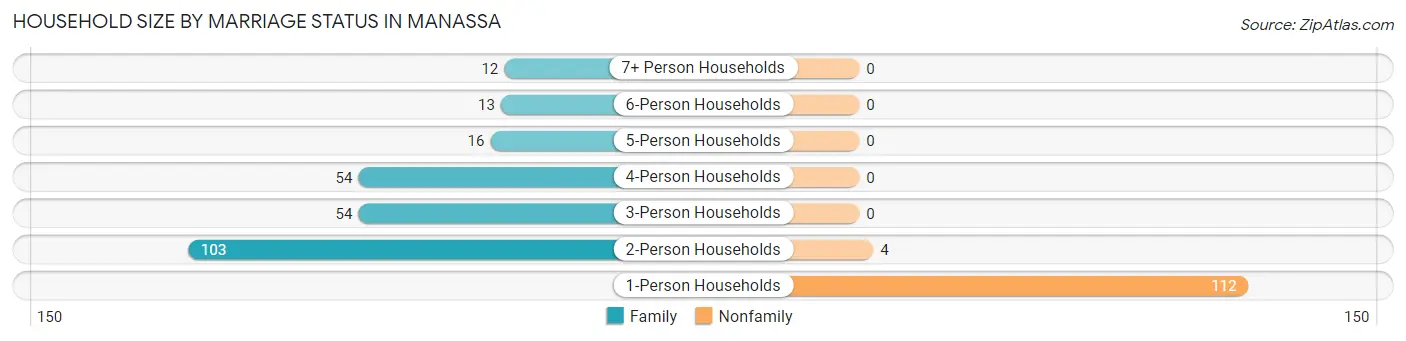
| Household Size | Family Households | Nonfamily Households |
| 1-Person Households | - | 112 (30.4%) |
| 2-Person Households | 103 (28.0%) | 4 (1.1%) |
| 3-Person Households | 54 (14.7%) | 0 (0.0%) |
| 4-Person Households | 54 (14.7%) | 0 (0.0%) |
| 5-Person Households | 16 (4.3%) | 0 (0.0%) |
| 6-Person Households | 13 (3.5%) | 0 (0.0%) |
| 7+ Person Households | 12 (3.3%) | 0 (0.0%) |
| Total | 252 (68.5%) | 116 (31.5%) |
Female Fertility in Manassa
Fertility by Age in Manassa
Average fertility rate in Manassa is 90.0 births per 1,000 women. Women in the age bracket of 20 to 34 years have the highest fertility rate with 274.0 births per 1,000 women. Women in the age bracket of 20 to 34 years acount for 95.2% of all women with births.
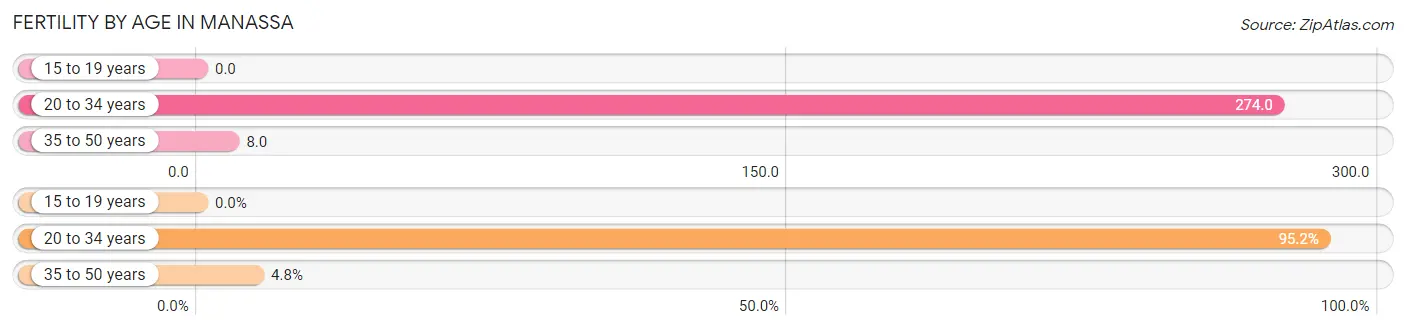
| Age Bracket | Women with Births | Births / 1,000 Women |
| 15 to 19 years | 0 (0.0%) | 0.0 |
| 20 to 34 years | 20 (95.2%) | 274.0 |
| 35 to 50 years | 1 (4.8%) | 8.0 |
| Total | 21 (100.0%) | 90.0 |
Fertility by Age by Marriage Status in Manassa
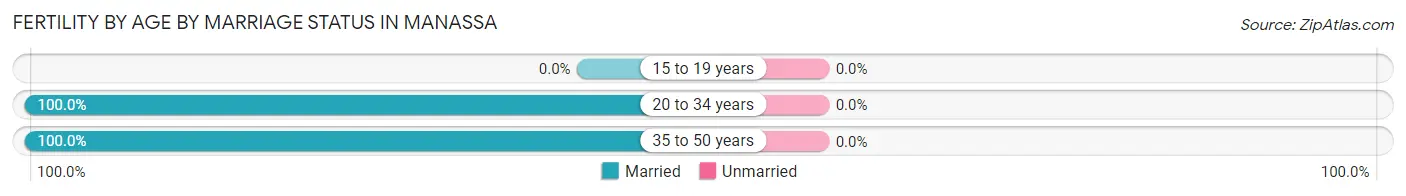
| Age Bracket | Married | Unmarried |
| 15 to 19 years | 0 (0.0%) | 0 (0.0%) |
| 20 to 34 years | 20 (100.0%) | 0 (0.0%) |
| 35 to 50 years | 1 (100.0%) | 0 (0.0%) |
| Total | 21 (100.0%) | 0 (0.0%) |
Fertility by Education in Manassa
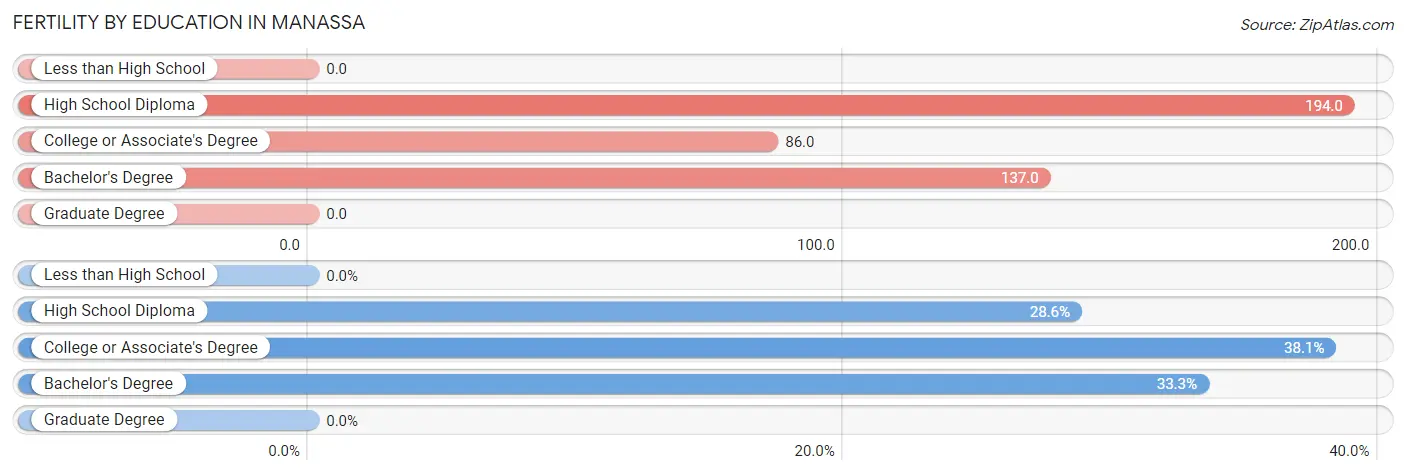
| Educational Attainment | Women with Births | Births / 1,000 Women |
| Less than High School | 0 (0.0%) | 0.0 |
| High School Diploma | 6 (28.6%) | 194.0 |
| College or Associate's Degree | 8 (38.1%) | 86.0 |
| Bachelor's Degree | 7 (33.3%) | 137.0 |
| Graduate Degree | 0 (0.0%) | 0.0 |
| Total | 21 (100.0%) | 90.0 |
Fertility by Education by Marriage Status in Manassa
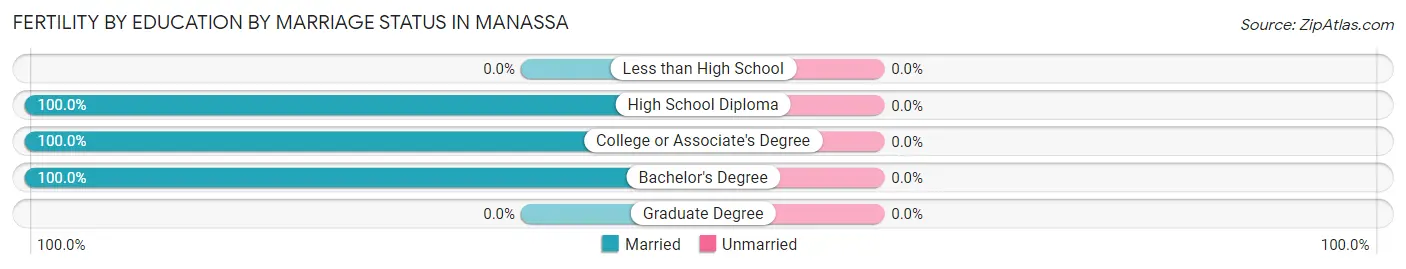
| Educational Attainment | Married | Unmarried |
| Less than High School | 0 (0.0%) | 0 (0.0%) |
| High School Diploma | 6 (100.0%) | 0 (0.0%) |
| College or Associate's Degree | 8 (100.0%) | 0 (0.0%) |
| Bachelor's Degree | 7 (100.0%) | 0 (0.0%) |
| Graduate Degree | 0 (0.0%) | 0 (0.0%) |
| Total | 21 (100.0%) | 0 (0.0%) |
Employment Characteristics in Manassa
Employment by Class of Employer in Manassa
Among the 441 employed individuals in Manassa, private company employees (198 | 44.9%), local government employees (79 | 17.9%), and self-employed (not incorporated) (56 | 12.7%) make up the most common classes of employment.
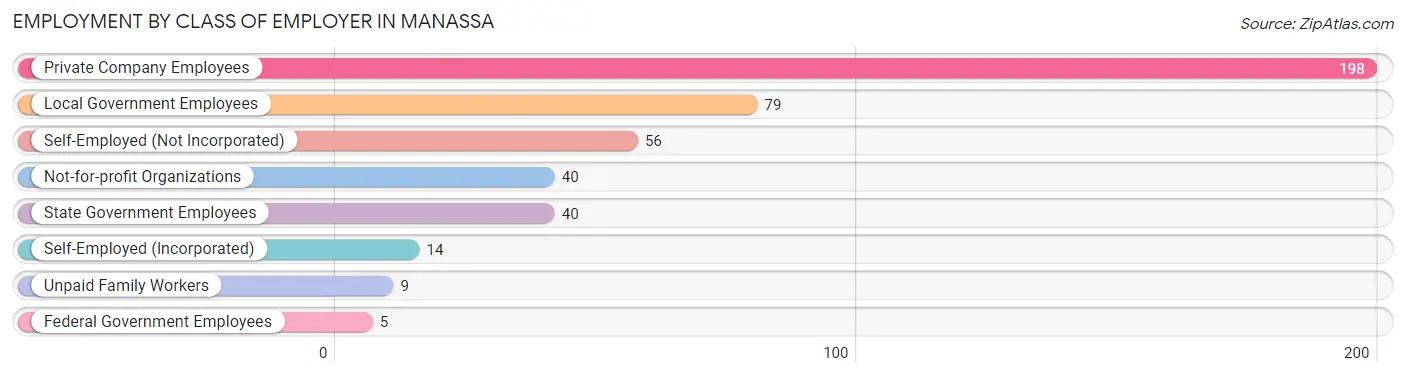
| Employer Class | # Employees | % Employees |
| Private Company Employees | 198 | 44.9% |
| Self-Employed (Incorporated) | 14 | 3.2% |
| Self-Employed (Not Incorporated) | 56 | 12.7% |
| Not-for-profit Organizations | 40 | 9.1% |
| Local Government Employees | 79 | 17.9% |
| State Government Employees | 40 | 9.1% |
| Federal Government Employees | 5 | 1.1% |
| Unpaid Family Workers | 9 | 2.0% |
| Total | 441 | 100.0% |
Employment Status by Age in Manassa
According to the labor force statistics for Manassa, out of the total population over 16 years of age (718), 65.7% or 472 individuals are in the labor force, with 2.8% or 13 of them unemployed. The age group with the highest labor force participation rate is 20 to 24 years, with 100.0% or 27 individuals in the labor force. Within the labor force, the 16 to 19 years age range has the highest percentage of unemployed individuals, with 23.3% or 7 of them being unemployed.
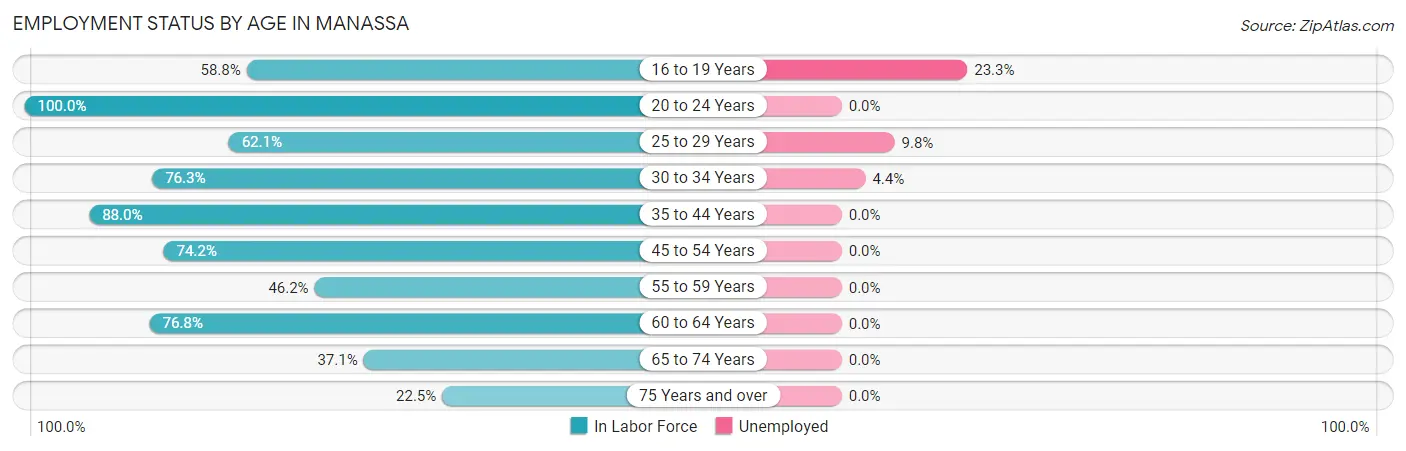
| Age Bracket | In Labor Force | Unemployed |
| 16 to 19 Years | 30 (58.8%) | 7 (23.3%) |
| 20 to 24 Years | 27 (100.0%) | 0 (0.0%) |
| 25 to 29 Years | 41 (62.1%) | 4 (9.8%) |
| 30 to 34 Years | 45 (76.3%) | 2 (4.4%) |
| 35 to 44 Years | 139 (88.0%) | 0 (0.0%) |
| 45 to 54 Years | 66 (74.2%) | 0 (0.0%) |
| 55 to 59 Years | 12 (46.2%) | 0 (0.0%) |
| 60 to 64 Years | 63 (76.8%) | 0 (0.0%) |
| 65 to 74 Years | 33 (37.1%) | 0 (0.0%) |
| 75 Years and over | 16 (22.5%) | 0 (0.0%) |
| Total | 472 (65.7%) | 13 (2.8%) |
Employment Status by Educational Attainment in Manassa
According to labor force statistics for Manassa, 76.3% of individuals (366) out of the total population between 25 and 64 years of age (480) are in the labor force, with 1.6% or 6 of them being unemployed. The group with the highest labor force participation rate are those with the educational attainment of bachelor's degree or higher, with 90.5% or 95 individuals in the labor force. Within the labor force, individuals with high school diploma education have the highest percentage of unemployment, with 3.1% or 4 of them being unemployed.
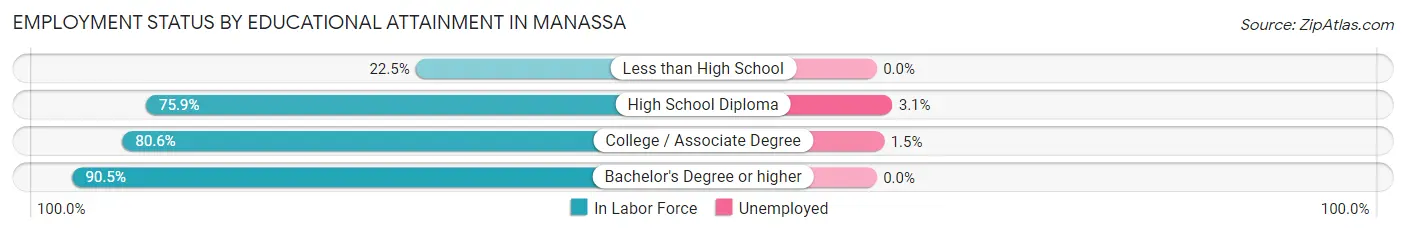
| Educational Attainment | In Labor Force | Unemployed |
| Less than High School | 9 (22.5%) | 0 (0.0%) |
| High School Diploma | 129 (75.9%) | 5 (3.1%) |
| College / Associate Degree | 133 (80.6%) | 2 (1.5%) |
| Bachelor's Degree or higher | 95 (90.5%) | 0 (0.0%) |
| Total | 366 (76.3%) | 8 (1.6%) |
Employment Occupations by Sex in Manassa
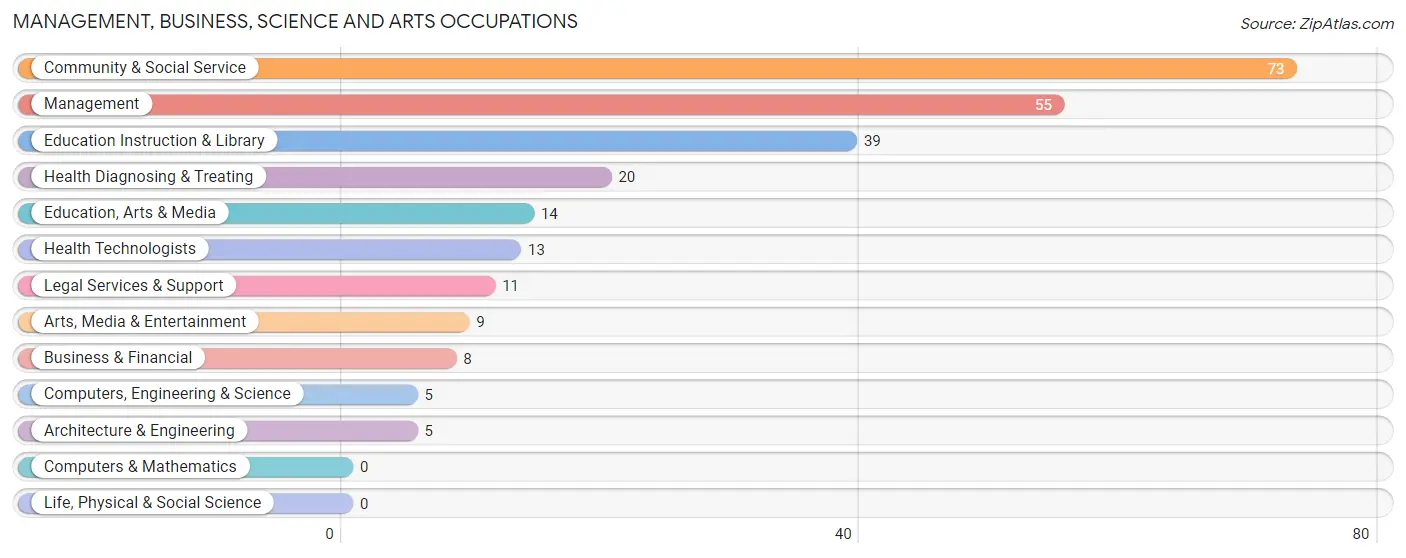
Management, Business, Science and Arts Occupations
The most common Management, Business, Science and Arts occupations in Manassa are Community & Social Service (73 | 15.9%), Management (55 | 12.0%), Education Instruction & Library (39 | 8.5%), Health Diagnosing & Treating (20 | 4.4%), and Education, Arts & Media (14 | 3.0%).
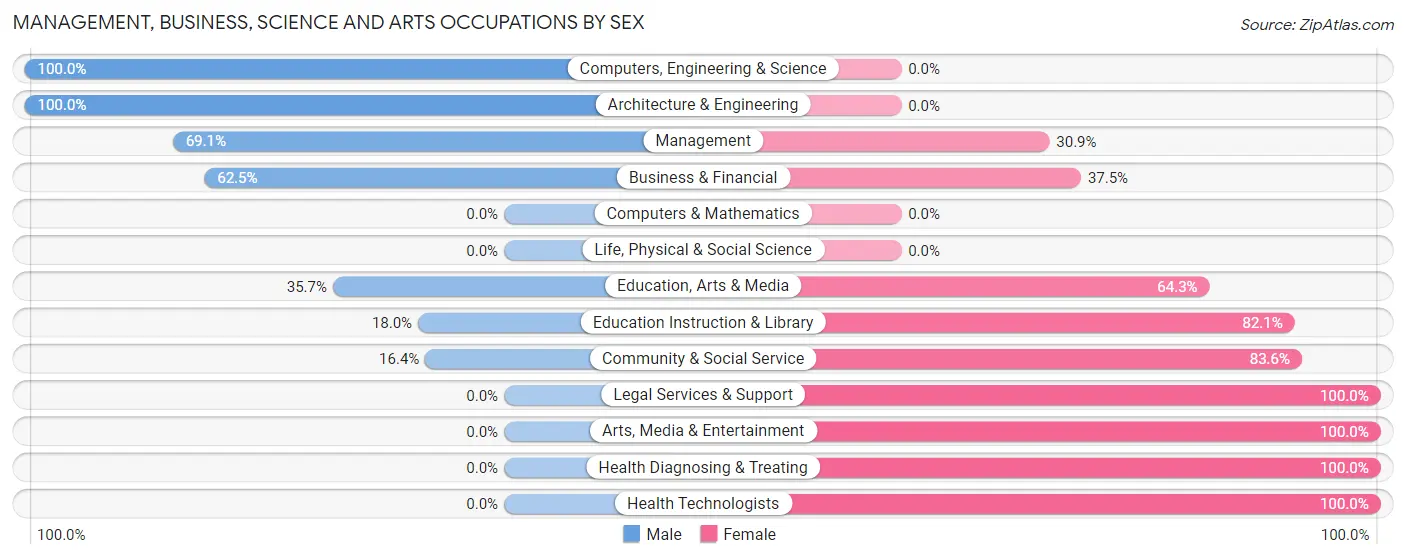
Management, Business, Science and Arts Occupations by Sex
Within the Management, Business, Science and Arts occupations in Manassa, the most male-oriented occupations are Computers, Engineering & Science (100.0%), Architecture & Engineering (100.0%), and Management (69.1%), while the most female-oriented occupations are Legal Services & Support (100.0%), Arts, Media & Entertainment (100.0%), and Health Diagnosing & Treating (100.0%).
| Occupation | Male | Female |
| Management | 38 (69.1%) | 17 (30.9%) |
| Business & Financial | 5 (62.5%) | 3 (37.5%) |
| Computers, Engineering & Science | 5 (100.0%) | 0 (0.0%) |
| Computers & Mathematics | 0 (0.0%) | 0 (0.0%) |
| Architecture & Engineering | 5 (100.0%) | 0 (0.0%) |
| Life, Physical & Social Science | 0 (0.0%) | 0 (0.0%) |
| Community & Social Service | 12 (16.4%) | 61 (83.6%) |
| Education, Arts & Media | 5 (35.7%) | 9 (64.3%) |
| Legal Services & Support | 0 (0.0%) | 11 (100.0%) |
| Education Instruction & Library | 7 (17.9%) | 32 (82.1%) |
| Arts, Media & Entertainment | 0 (0.0%) | 9 (100.0%) |
| Health Diagnosing & Treating | 0 (0.0%) | 20 (100.0%) |
| Health Technologists | 0 (0.0%) | 13 (100.0%) |
| Total (Category) | 60 (37.3%) | 101 (62.7%) |
| Total (Overall) | 243 (52.9%) | 216 (47.1%) |
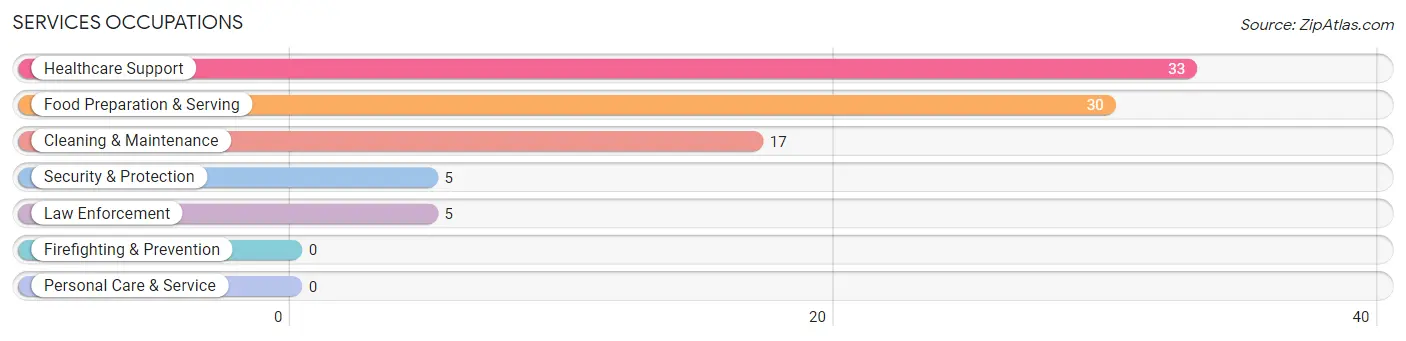
Services Occupations
The most common Services occupations in Manassa are Healthcare Support (33 | 7.2%), Food Preparation & Serving (30 | 6.5%), Cleaning & Maintenance (17 | 3.7%), Security & Protection (5 | 1.1%), and Law Enforcement (5 | 1.1%).
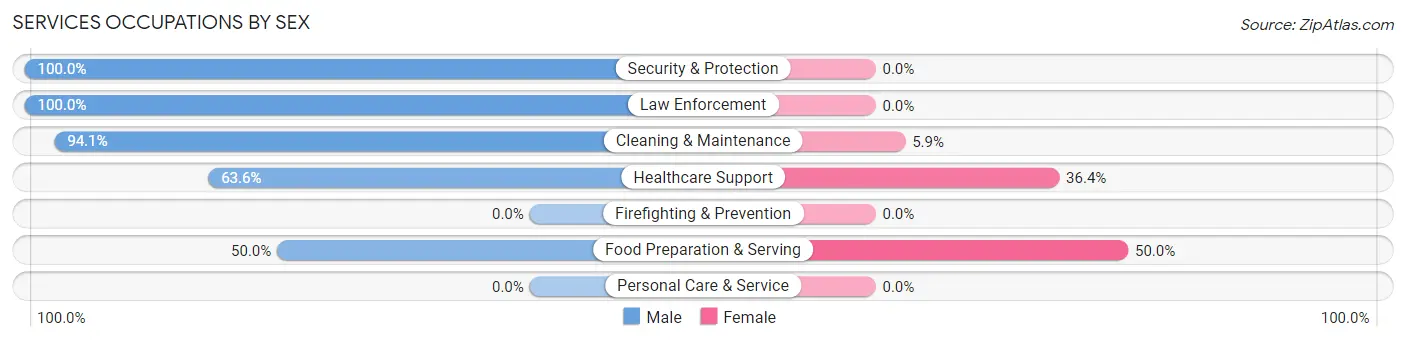
Services Occupations by Sex
Within the Services occupations in Manassa, the most male-oriented occupations are Security & Protection (100.0%), Law Enforcement (100.0%), and Cleaning & Maintenance (94.1%), while the most female-oriented occupations are Food Preparation & Serving (50.0%), Healthcare Support (36.4%), and Cleaning & Maintenance (5.9%).
| Occupation | Male | Female |
| Healthcare Support | 21 (63.6%) | 12 (36.4%) |
| Security & Protection | 5 (100.0%) | 0 (0.0%) |
| Firefighting & Prevention | 0 (0.0%) | 0 (0.0%) |
| Law Enforcement | 5 (100.0%) | 0 (0.0%) |
| Food Preparation & Serving | 15 (50.0%) | 15 (50.0%) |
| Cleaning & Maintenance | 16 (94.1%) | 1 (5.9%) |
| Personal Care & Service | 0 (0.0%) | 0 (0.0%) |
| Total (Category) | 57 (67.1%) | 28 (32.9%) |
| Total (Overall) | 243 (52.9%) | 216 (47.1%) |
Sales and Office Occupations
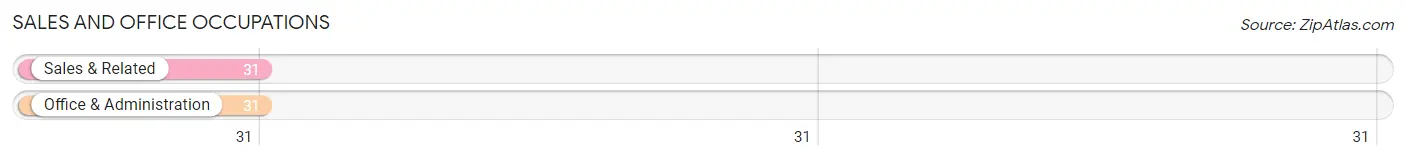
The most common Sales and Office occupations in Manassa are Sales & Related (31 | 6.8%), and Office & Administration (31 | 6.8%).
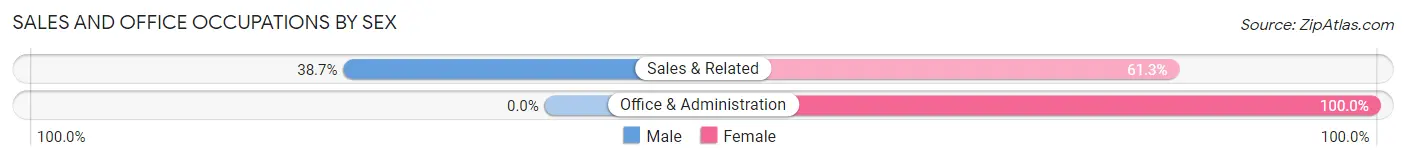
Sales and Office Occupations by Sex
| Occupation | Male | Female |
| Sales & Related | 12 (38.7%) | 19 (61.3%) |
| Office & Administration | 0 (0.0%) | 31 (100.0%) |
| Total (Category) | 12 (19.4%) | 50 (80.6%) |
| Total (Overall) | 243 (52.9%) | 216 (47.1%) |
Natural Resources, Construction and Maintenance Occupations
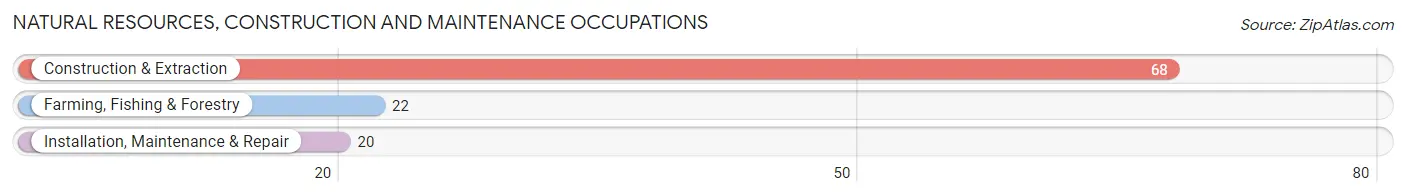
The most common Natural Resources, Construction and Maintenance occupations in Manassa are Construction & Extraction (68 | 14.8%), Farming, Fishing & Forestry (22 | 4.8%), and Installation, Maintenance & Repair (20 | 4.4%).
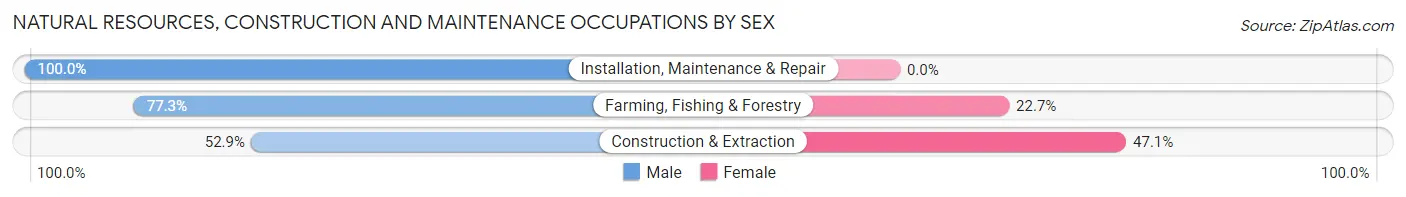
Natural Resources, Construction and Maintenance Occupations by Sex
| Occupation | Male | Female |
| Farming, Fishing & Forestry | 17 (77.3%) | 5 (22.7%) |
| Construction & Extraction | 36 (52.9%) | 32 (47.1%) |
| Installation, Maintenance & Repair | 20 (100.0%) | 0 (0.0%) |
| Total (Category) | 73 (66.4%) | 37 (33.6%) |
| Total (Overall) | 243 (52.9%) | 216 (47.1%) |
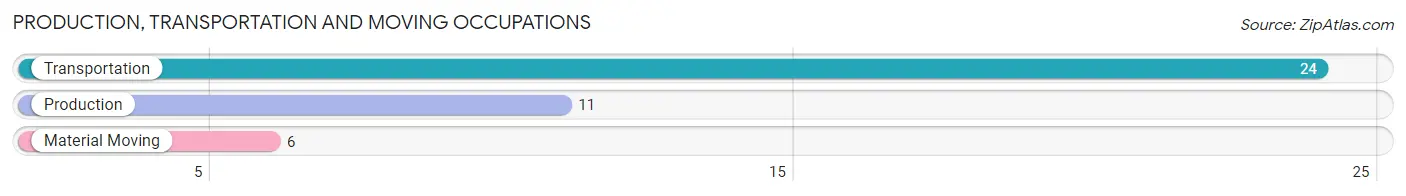
Production, Transportation and Moving Occupations
The most common Production, Transportation and Moving occupations in Manassa are Transportation (24 | 5.2%), Production (11 | 2.4%), and Material Moving (6 | 1.3%).
Production, Transportation and Moving Occupations by Sex
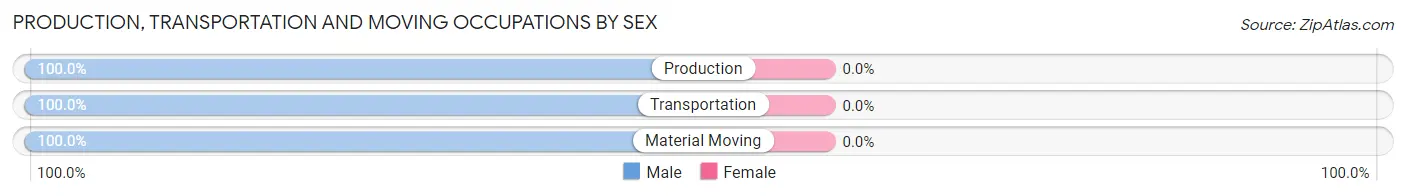
| Occupation | Male | Female |
| Production | 11 (100.0%) | 0 (0.0%) |
| Transportation | 24 (100.0%) | 0 (0.0%) |
| Material Moving | 6 (100.0%) | 0 (0.0%) |
| Total (Category) | 41 (100.0%) | 0 (0.0%) |
| Total (Overall) | 243 (52.9%) | 216 (47.1%) |
Employment Industries by Sex in Manassa
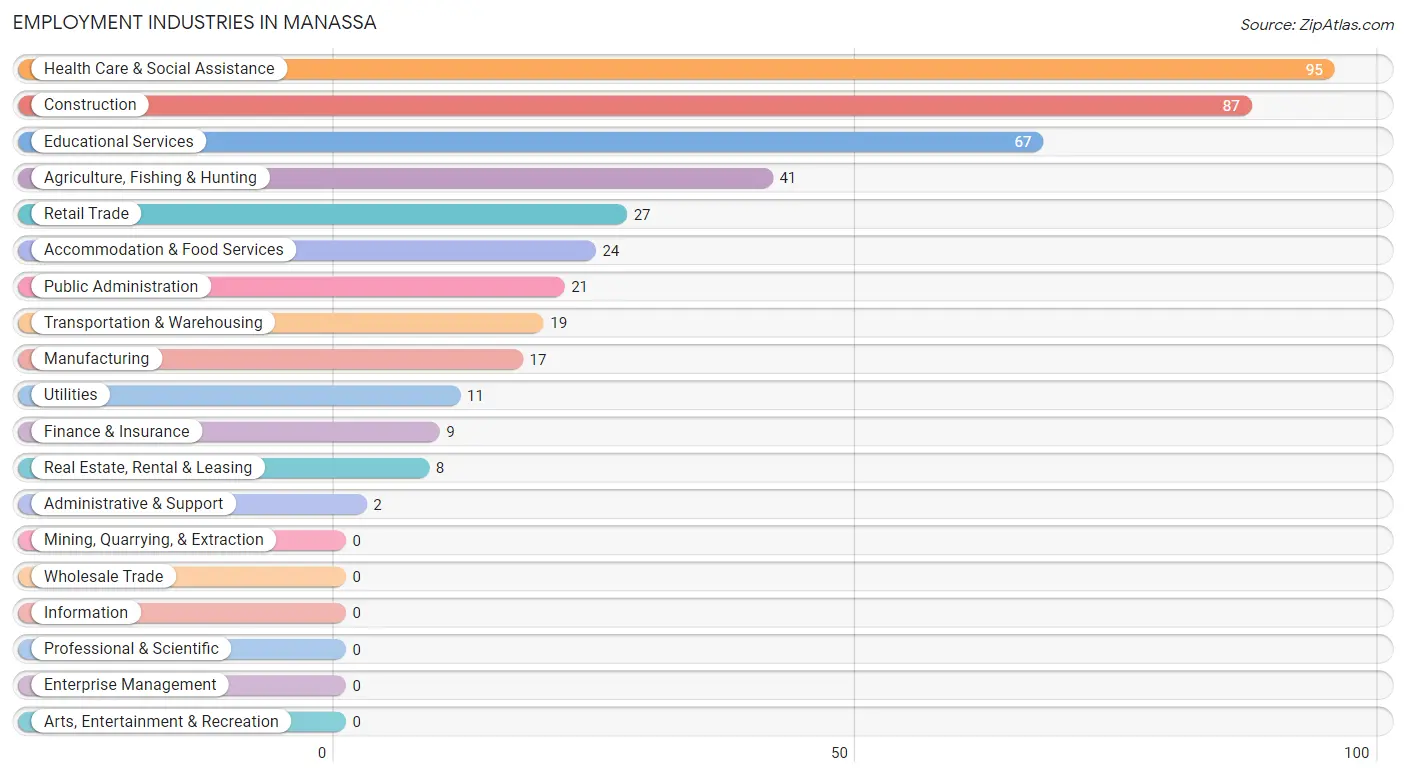
Employment Industries in Manassa
The major employment industries in Manassa include Health Care & Social Assistance (95 | 20.7%), Construction (87 | 19.0%), Educational Services (67 | 14.6%), Agriculture, Fishing & Hunting (41 | 8.9%), and Retail Trade (27 | 5.9%).
Employment Industries by Sex in Manassa
The Manassa industries that see more men than women are Manufacturing (100.0%), Agriculture, Fishing & Hunting (87.8%), and Transportation & Warehousing (73.7%), whereas the industries that tend to have a higher number of women are Administrative & Support (100.0%), Health Care & Social Assistance (75.8%), and Educational Services (65.7%).
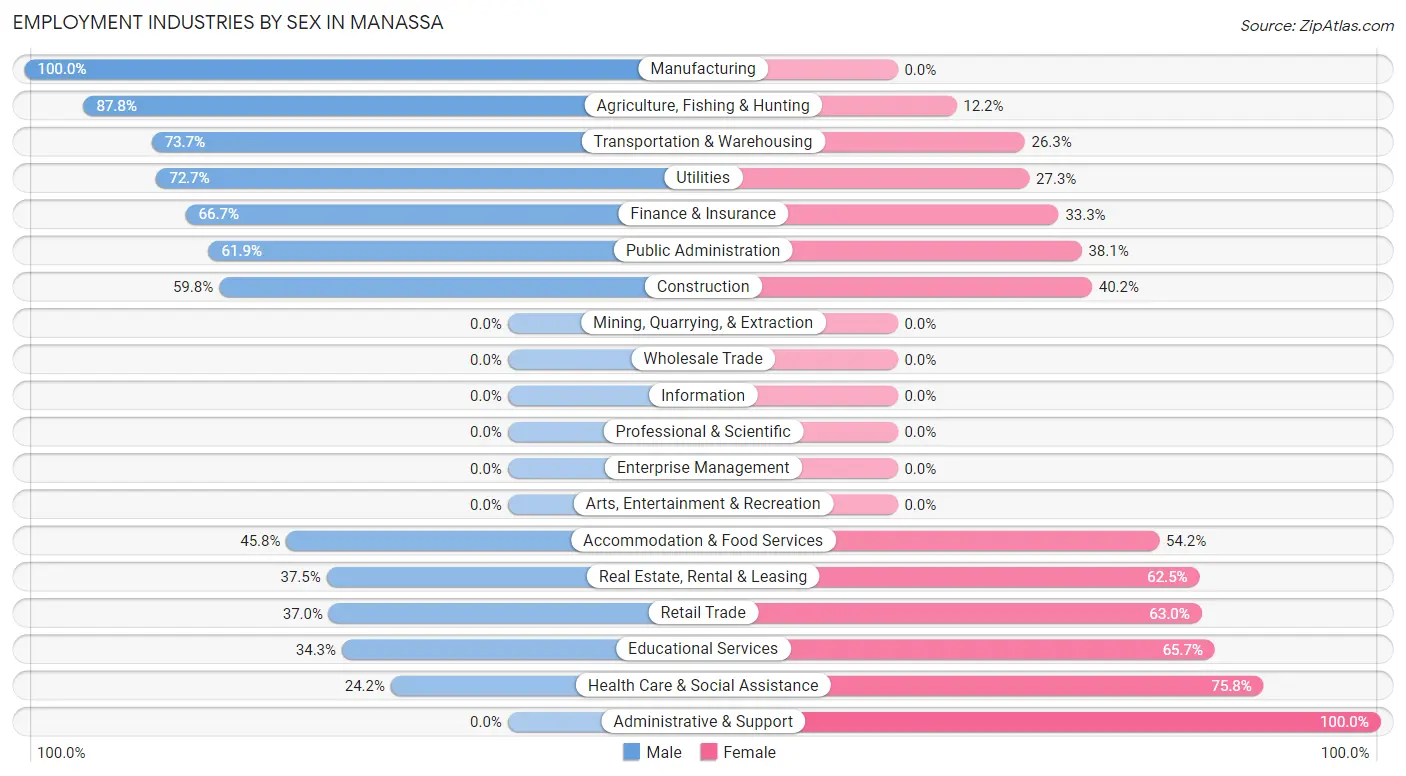
| Industry | Male | Female |
| Agriculture, Fishing & Hunting | 36 (87.8%) | 5 (12.2%) |
| Mining, Quarrying, & Extraction | 0 (0.0%) | 0 (0.0%) |
| Construction | 52 (59.8%) | 35 (40.2%) |
| Manufacturing | 17 (100.0%) | 0 (0.0%) |
| Wholesale Trade | 0 (0.0%) | 0 (0.0%) |
| Retail Trade | 10 (37.0%) | 17 (63.0%) |
| Transportation & Warehousing | 14 (73.7%) | 5 (26.3%) |
| Utilities | 8 (72.7%) | 3 (27.3%) |
| Information | 0 (0.0%) | 0 (0.0%) |
| Finance & Insurance | 6 (66.7%) | 3 (33.3%) |
| Real Estate, Rental & Leasing | 3 (37.5%) | 5 (62.5%) |
| Professional & Scientific | 0 (0.0%) | 0 (0.0%) |
| Enterprise Management | 0 (0.0%) | 0 (0.0%) |
| Administrative & Support | 0 (0.0%) | 2 (100.0%) |
| Educational Services | 23 (34.3%) | 44 (65.7%) |
| Health Care & Social Assistance | 23 (24.2%) | 72 (75.8%) |
| Arts, Entertainment & Recreation | 0 (0.0%) | 0 (0.0%) |
| Accommodation & Food Services | 11 (45.8%) | 13 (54.2%) |
| Public Administration | 13 (61.9%) | 8 (38.1%) |
| Total | 243 (52.9%) | 216 (47.1%) |
Education in Manassa
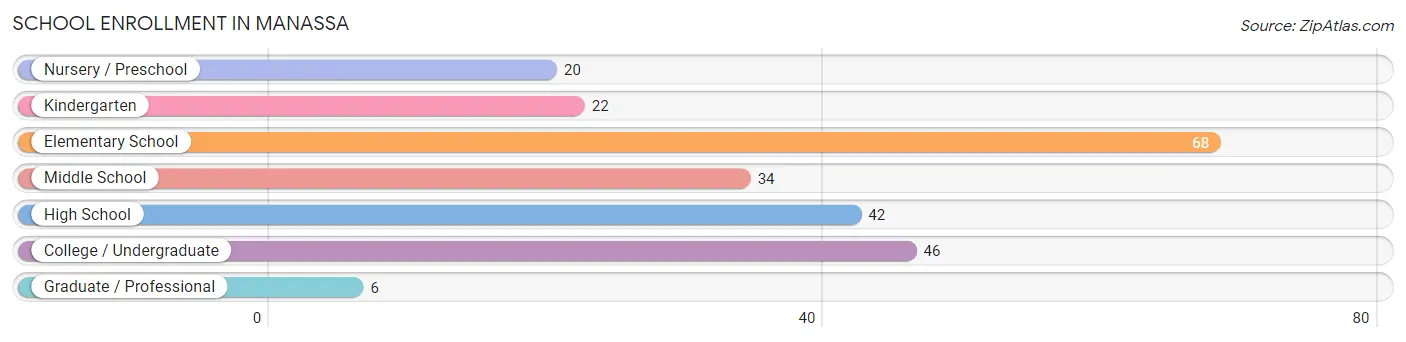
School Enrollment in Manassa
The most common levels of schooling among the 238 students in Manassa are elementary school (68 | 28.6%), college / undergraduate (46 | 19.3%), and high school (42 | 17.6%).
| School Level | # Students | % Students |
| Nursery / Preschool | 20 | 8.4% |
| Kindergarten | 22 | 9.2% |
| Elementary School | 68 | 28.6% |
| Middle School | 34 | 14.3% |
| High School | 42 | 17.6% |
| College / Undergraduate | 46 | 19.3% |
| Graduate / Professional | 6 | 2.5% |
| Total | 238 | 100.0% |
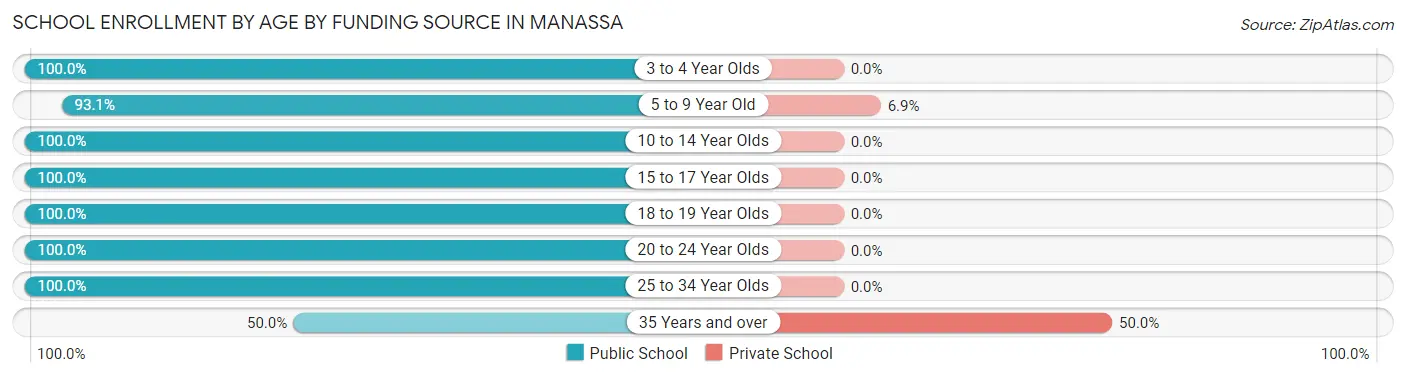
School Enrollment by Age by Funding Source in Manassa
Out of a total of 238 students who are enrolled in schools in Manassa, 11 (4.6%) attend a private institution, while the remaining 227 (95.4%) are enrolled in public schools. The age group of 35 years and over has the highest likelihood of being enrolled in private schools, with 5 (50.0% in the age bracket) enrolled. Conversely, the age group of 3 to 4 year olds has the lowest likelihood of being enrolled in a private school, with 10 (100.0% in the age bracket) attending a public institution.
| Age Bracket | Public School | Private School |
| 3 to 4 Year Olds | 10 (100.0%) | 0 (0.0%) |
| 5 to 9 Year Old | 81 (93.1%) | 6 (6.9%) |
| 10 to 14 Year Olds | 48 (100.0%) | 0 (0.0%) |
| 15 to 17 Year Olds | 36 (100.0%) | 0 (0.0%) |
| 18 to 19 Year Olds | 23 (100.0%) | 0 (0.0%) |
| 20 to 24 Year Olds | 7 (100.0%) | 0 (0.0%) |
| 25 to 34 Year Olds | 17 (100.0%) | 0 (0.0%) |
| 35 Years and over | 5 (50.0%) | 5 (50.0%) |
| Total | 227 (95.4%) | 11 (4.6%) |
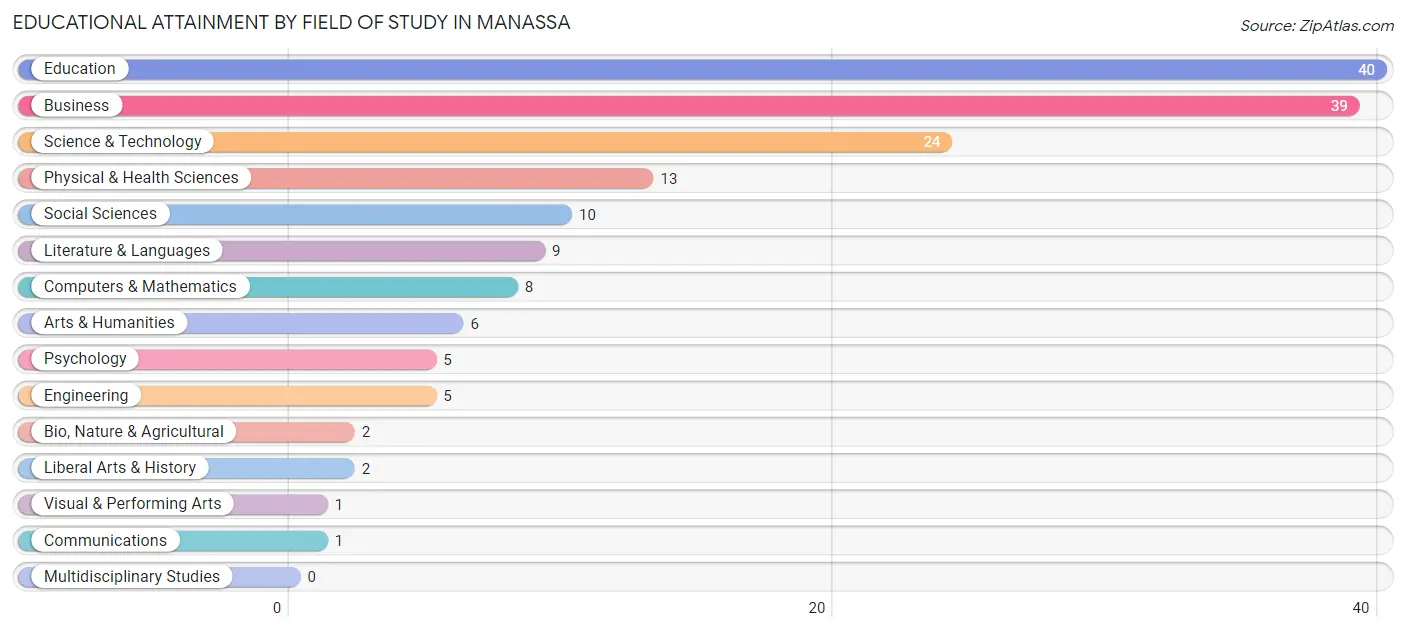
Educational Attainment by Field of Study in Manassa
Education (40 | 24.2%), business (39 | 23.6%), science & technology (24 | 14.5%), physical & health sciences (13 | 7.9%), and social sciences (10 | 6.1%) are the most common fields of study among 165 individuals in Manassa who have obtained a bachelor's degree or higher.
| Field of Study | # Graduates | % Graduates |
| Computers & Mathematics | 8 | 4.9% |
| Bio, Nature & Agricultural | 2 | 1.2% |
| Physical & Health Sciences | 13 | 7.9% |
| Psychology | 5 | 3.0% |
| Social Sciences | 10 | 6.1% |
| Engineering | 5 | 3.0% |
| Multidisciplinary Studies | 0 | 0.0% |
| Science & Technology | 24 | 14.5% |
| Business | 39 | 23.6% |
| Education | 40 | 24.2% |
| Literature & Languages | 9 | 5.4% |
| Liberal Arts & History | 2 | 1.2% |
| Visual & Performing Arts | 1 | 0.6% |
| Communications | 1 | 0.6% |
| Arts & Humanities | 6 | 3.6% |
| Total | 165 | 100.0% |
Transportation & Commute in Manassa
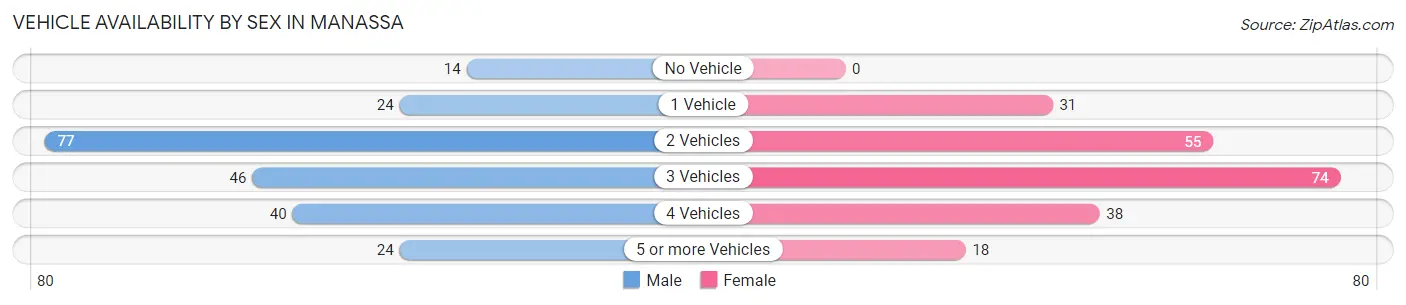
Vehicle Availability by Sex in Manassa
The most prevalent vehicle ownership categories in Manassa are males with 2 vehicles (77, accounting for 34.2%) and females with 2 vehicles (55, making up 35.6%).
| Vehicles Available | Male | Female |
| No Vehicle | 14 (6.2%) | 0 (0.0%) |
| 1 Vehicle | 24 (10.7%) | 31 (14.3%) |
| 2 Vehicles | 77 (34.2%) | 55 (25.5%) |
| 3 Vehicles | 46 (20.4%) | 74 (34.3%) |
| 4 Vehicles | 40 (17.8%) | 38 (17.6%) |
| 5 or more Vehicles | 24 (10.7%) | 18 (8.3%) |
| Total | 225 (100.0%) | 216 (100.0%) |
Commute Time in Manassa
The most frequently occuring commute durations in Manassa are 30 to 34 minutes (153 commuters, 35.5%), 15 to 19 minutes (71 commuters, 16.5%), and 20 to 24 minutes (34 commuters, 7.9%).
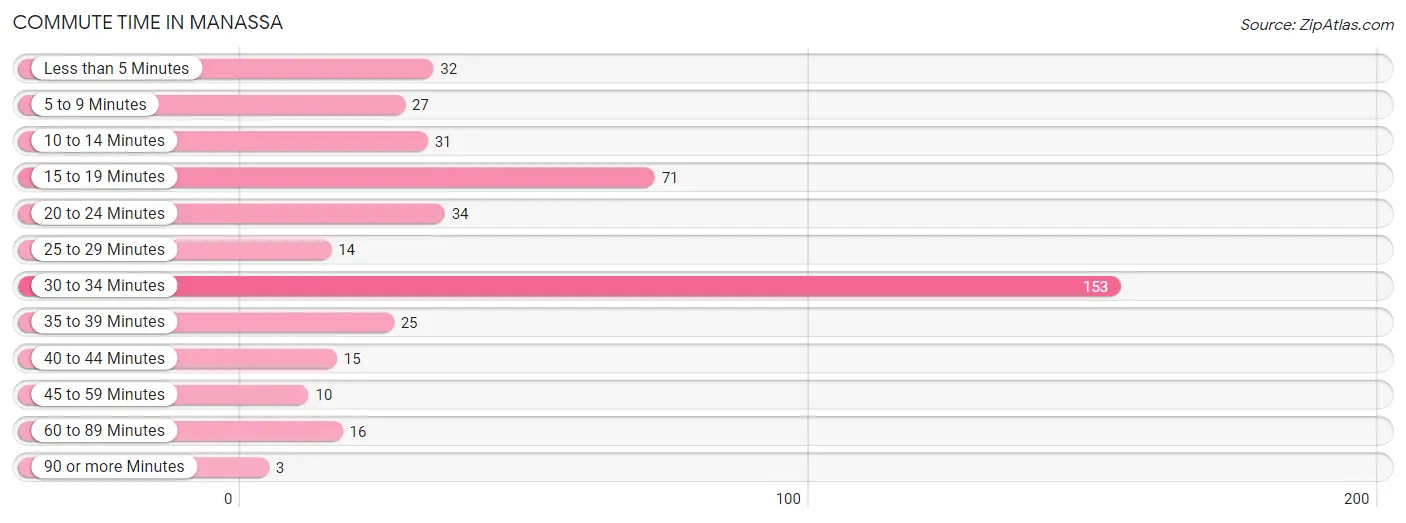
| Commute Time | # Commuters | % Commuters |
| Less than 5 Minutes | 32 | 7.4% |
| 5 to 9 Minutes | 27 | 6.3% |
| 10 to 14 Minutes | 31 | 7.2% |
| 15 to 19 Minutes | 71 | 16.5% |
| 20 to 24 Minutes | 34 | 7.9% |
| 25 to 29 Minutes | 14 | 3.3% |
| 30 to 34 Minutes | 153 | 35.5% |
| 35 to 39 Minutes | 25 | 5.8% |
| 40 to 44 Minutes | 15 | 3.5% |
| 45 to 59 Minutes | 10 | 2.3% |
| 60 to 89 Minutes | 16 | 3.7% |
| 90 or more Minutes | 3 | 0.7% |
Commute Time by Sex in Manassa
The most common commute times in Manassa are 30 to 34 minutes (59 commuters, 26.6%) for males and 30 to 34 minutes (94 commuters, 45.0%) for females.
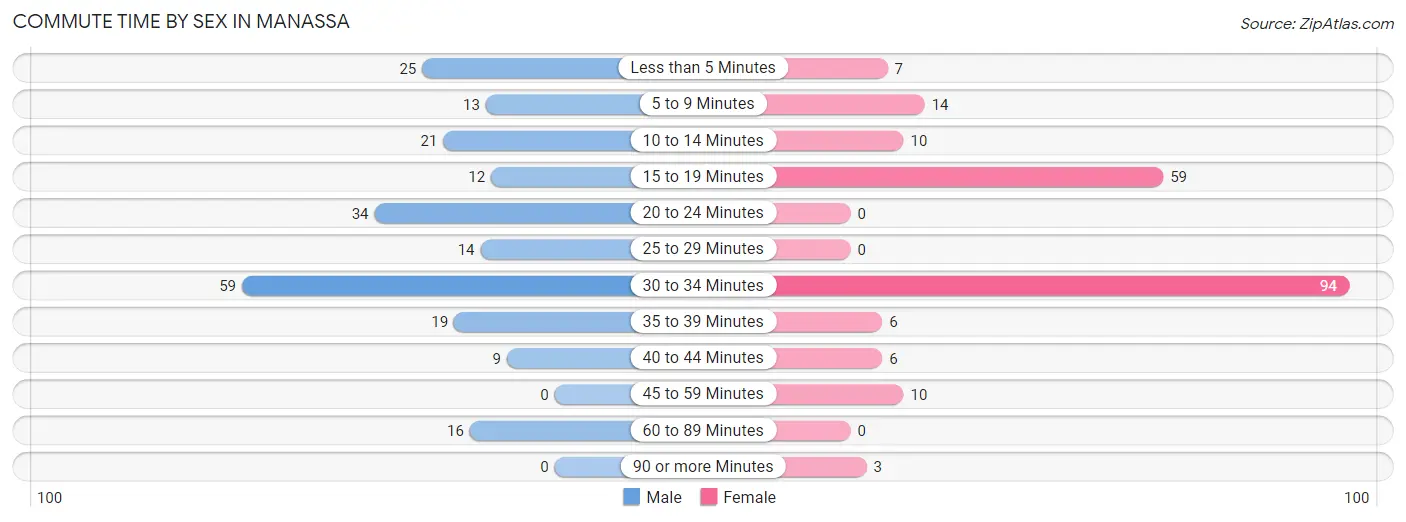
| Commute Time | Male | Female |
| Less than 5 Minutes | 25 (11.3%) | 7 (3.4%) |
| 5 to 9 Minutes | 13 (5.9%) | 14 (6.7%) |
| 10 to 14 Minutes | 21 (9.5%) | 10 (4.8%) |
| 15 to 19 Minutes | 12 (5.4%) | 59 (28.2%) |
| 20 to 24 Minutes | 34 (15.3%) | 0 (0.0%) |
| 25 to 29 Minutes | 14 (6.3%) | 0 (0.0%) |
| 30 to 34 Minutes | 59 (26.6%) | 94 (45.0%) |
| 35 to 39 Minutes | 19 (8.6%) | 6 (2.9%) |
| 40 to 44 Minutes | 9 (4.1%) | 6 (2.9%) |
| 45 to 59 Minutes | 0 (0.0%) | 10 (4.8%) |
| 60 to 89 Minutes | 16 (7.2%) | 0 (0.0%) |
| 90 or more Minutes | 0 (0.0%) | 3 (1.4%) |
Time of Departure to Work by Sex in Manassa
The most frequent times of departure to work in Manassa are 7:00 AM to 7:29 AM (42, 18.9%) for males and 7:00 AM to 7:29 AM (62, 29.7%) for females.
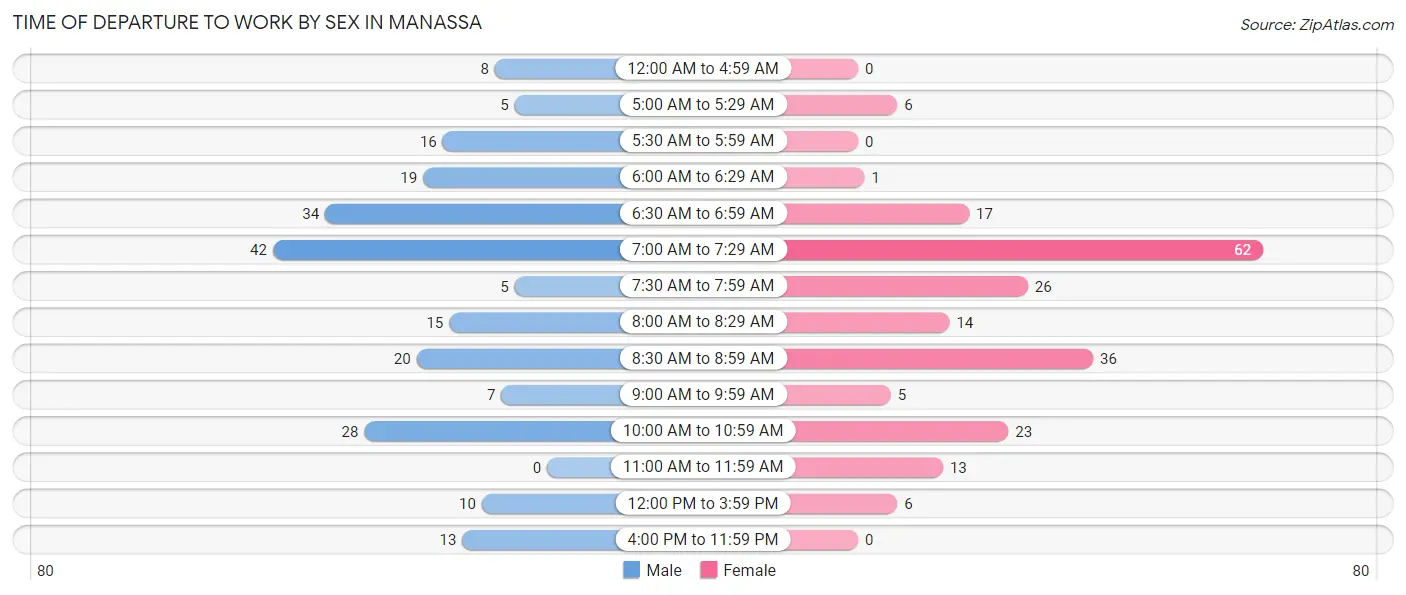
| Time of Departure | Male | Female |
| 12:00 AM to 4:59 AM | 8 (3.6%) | 0 (0.0%) |
| 5:00 AM to 5:29 AM | 5 (2.2%) | 6 (2.9%) |
| 5:30 AM to 5:59 AM | 16 (7.2%) | 0 (0.0%) |
| 6:00 AM to 6:29 AM | 19 (8.6%) | 1 (0.5%) |
| 6:30 AM to 6:59 AM | 34 (15.3%) | 17 (8.1%) |
| 7:00 AM to 7:29 AM | 42 (18.9%) | 62 (29.7%) |
| 7:30 AM to 7:59 AM | 5 (2.2%) | 26 (12.4%) |
| 8:00 AM to 8:29 AM | 15 (6.8%) | 14 (6.7%) |
| 8:30 AM to 8:59 AM | 20 (9.0%) | 36 (17.2%) |
| 9:00 AM to 9:59 AM | 7 (3.2%) | 5 (2.4%) |
| 10:00 AM to 10:59 AM | 28 (12.6%) | 23 (11.0%) |
| 11:00 AM to 11:59 AM | 0 (0.0%) | 13 (6.2%) |
| 12:00 PM to 3:59 PM | 10 (4.5%) | 6 (2.9%) |
| 4:00 PM to 11:59 PM | 13 (5.9%) | 0 (0.0%) |
| Total | 222 (100.0%) | 209 (100.0%) |
Housing Occupancy in Manassa
Occupancy by Ownership in Manassa
Of the total 368 dwellings in Manassa, owner-occupied units account for 314 (85.3%), while renter-occupied units make up 54 (14.7%).
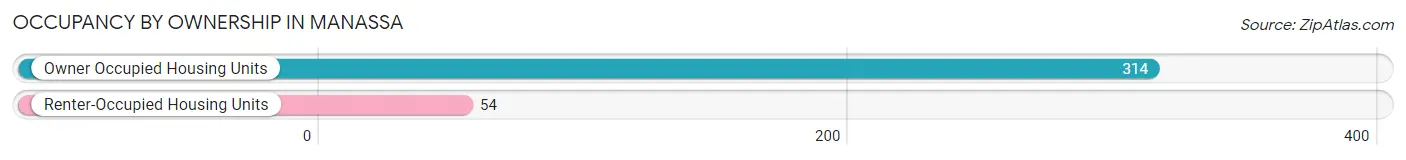
| Occupancy | # Housing Units | % Housing Units |
| Owner Occupied Housing Units | 314 | 85.3% |
| Renter-Occupied Housing Units | 54 | 14.7% |
| Total Occupied Housing Units | 368 | 100.0% |
Occupancy by Household Size in Manassa
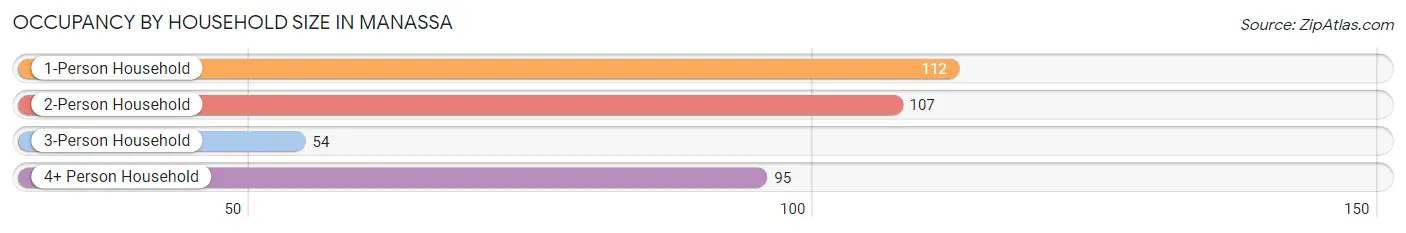
| Household Size | # Housing Units | % Housing Units |
| 1-Person Household | 112 | 30.4% |
| 2-Person Household | 107 | 29.1% |
| 3-Person Household | 54 | 14.7% |
| 4+ Person Household | 95 | 25.8% |
| Total Housing Units | 368 | 100.0% |
Occupancy by Ownership by Household Size in Manassa
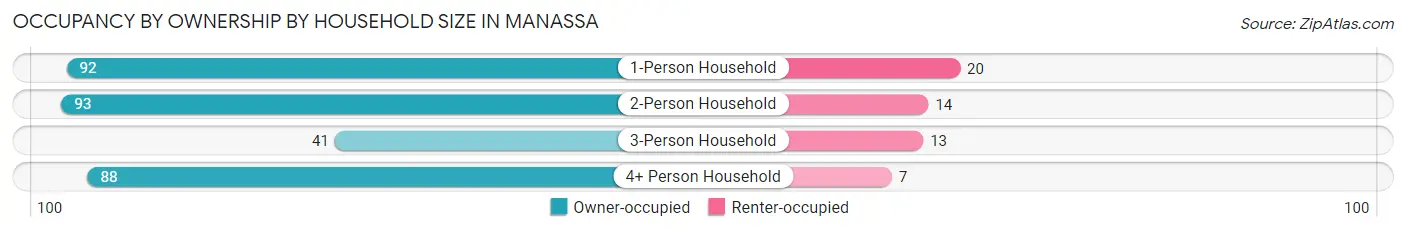
| Household Size | Owner-occupied | Renter-occupied |
| 1-Person Household | 92 (82.1%) | 20 (17.9%) |
| 2-Person Household | 93 (86.9%) | 14 (13.1%) |
| 3-Person Household | 41 (75.9%) | 13 (24.1%) |
| 4+ Person Household | 88 (92.6%) | 7 (7.4%) |
| Total Housing Units | 314 (85.3%) | 54 (14.7%) |
Occupancy by Educational Attainment in Manassa
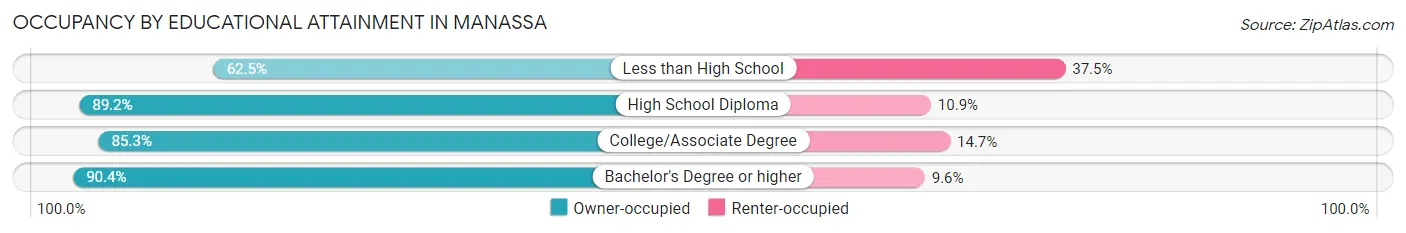
| Household Size | Owner-occupied | Renter-occupied |
| Less than High School | 25 (62.5%) | 15 (37.5%) |
| High School Diploma | 115 (89.1%) | 14 (10.8%) |
| College/Associate Degree | 99 (85.3%) | 17 (14.7%) |
| Bachelor's Degree or higher | 75 (90.4%) | 8 (9.6%) |
Occupancy by Age of Householder in Manassa
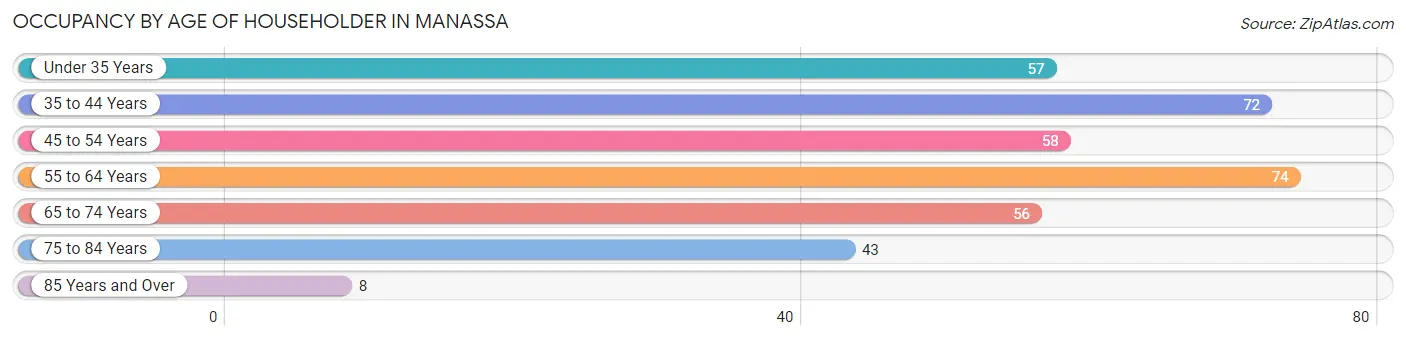
| Age Bracket | # Households | % Households |
| Under 35 Years | 57 | 15.5% |
| 35 to 44 Years | 72 | 19.6% |
| 45 to 54 Years | 58 | 15.8% |
| 55 to 64 Years | 74 | 20.1% |
| 65 to 74 Years | 56 | 15.2% |
| 75 to 84 Years | 43 | 11.7% |
| 85 Years and Over | 8 | 2.2% |
| Total | 368 | 100.0% |
Housing Finances in Manassa
Median Income by Occupancy in Manassa
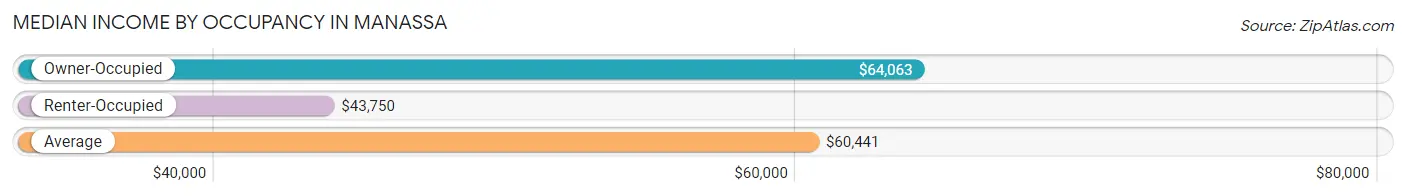
| Occupancy Type | # Households | Median Income |
| Owner-Occupied | 314 (85.3%) | $64,063 |
| Renter-Occupied | 54 (14.7%) | $43,750 |
| Average | 368 (100.0%) | $60,441 |
Occupancy by Householder Income Bracket in Manassa
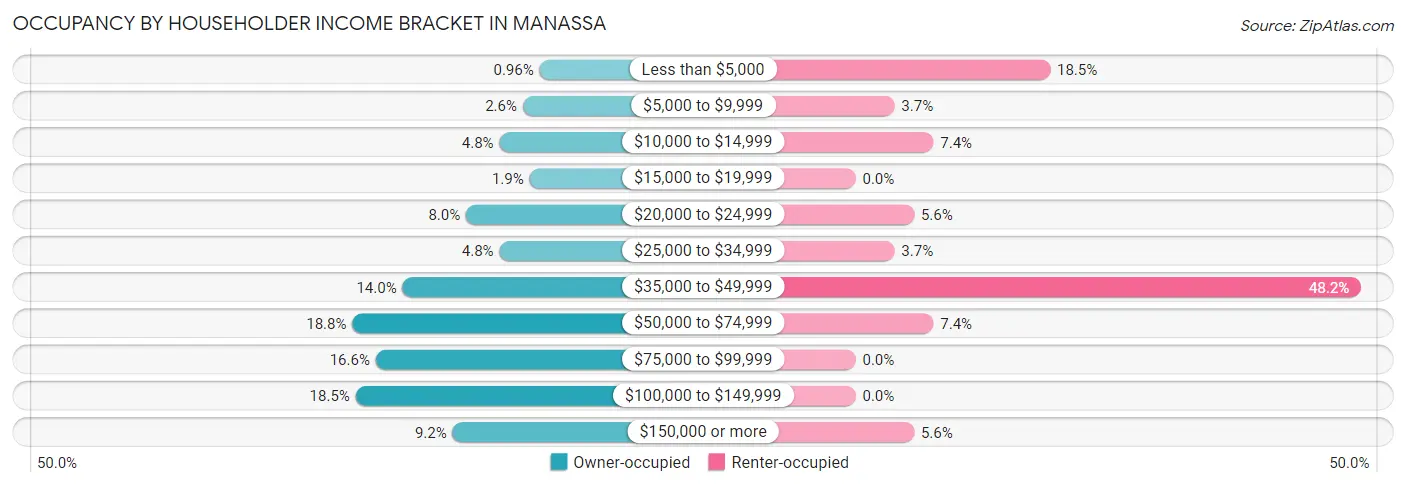
| Income Bracket | Owner-occupied | Renter-occupied |
| Less than $5,000 | 3 (1.0%) | 10 (18.5%) |
| $5,000 to $9,999 | 8 (2.5%) | 2 (3.7%) |
| $10,000 to $14,999 | 15 (4.8%) | 4 (7.4%) |
| $15,000 to $19,999 | 6 (1.9%) | 0 (0.0%) |
| $20,000 to $24,999 | 25 (8.0%) | 3 (5.6%) |
| $25,000 to $34,999 | 15 (4.8%) | 2 (3.7%) |
| $35,000 to $49,999 | 44 (14.0%) | 26 (48.1%) |
| $50,000 to $74,999 | 59 (18.8%) | 4 (7.4%) |
| $75,000 to $99,999 | 52 (16.6%) | 0 (0.0%) |
| $100,000 to $149,999 | 58 (18.5%) | 0 (0.0%) |
| $150,000 or more | 29 (9.2%) | 3 (5.6%) |
| Total | 314 (100.0%) | 54 (100.0%) |
Monthly Housing Cost Tiers in Manassa
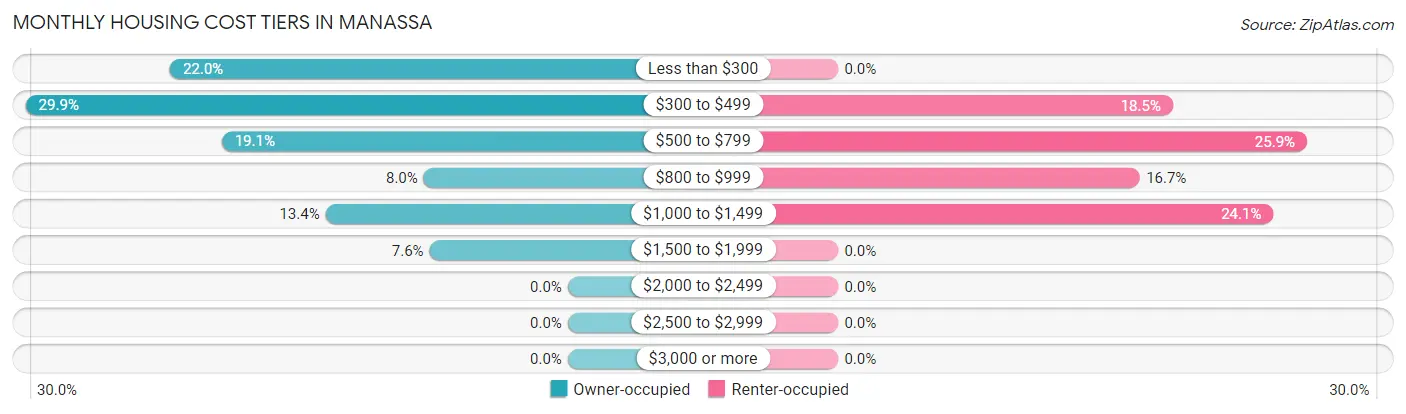
| Monthly Cost | Owner-occupied | Renter-occupied |
| Less than $300 | 69 (22.0%) | 0 (0.0%) |
| $300 to $499 | 94 (29.9%) | 10 (18.5%) |
| $500 to $799 | 60 (19.1%) | 14 (25.9%) |
| $800 to $999 | 25 (8.0%) | 9 (16.7%) |
| $1,000 to $1,499 | 42 (13.4%) | 13 (24.1%) |
| $1,500 to $1,999 | 24 (7.6%) | 0 (0.0%) |
| $2,000 to $2,499 | 0 (0.0%) | 0 (0.0%) |
| $2,500 to $2,999 | 0 (0.0%) | 0 (0.0%) |
| $3,000 or more | 0 (0.0%) | 0 (0.0%) |
| Total | 314 (100.0%) | 54 (100.0%) |
Physical Housing Characteristics in Manassa
Housing Structures in Manassa
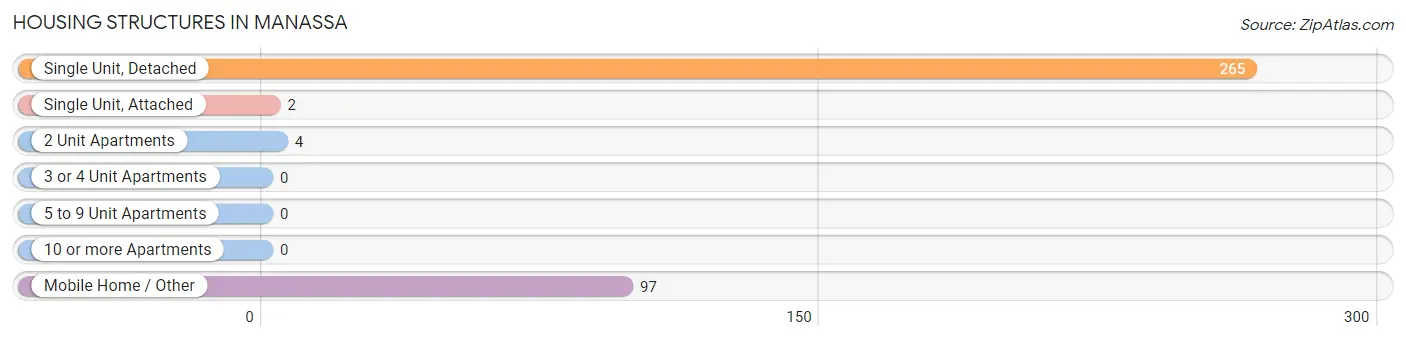
| Structure Type | # Housing Units | % Housing Units |
| Single Unit, Detached | 265 | 72.0% |
| Single Unit, Attached | 2 | 0.5% |
| 2 Unit Apartments | 4 | 1.1% |
| 3 or 4 Unit Apartments | 0 | 0.0% |
| 5 to 9 Unit Apartments | 0 | 0.0% |
| 10 or more Apartments | 0 | 0.0% |
| Mobile Home / Other | 97 | 26.4% |
| Total | 368 | 100.0% |
Housing Structures by Occupancy in Manassa
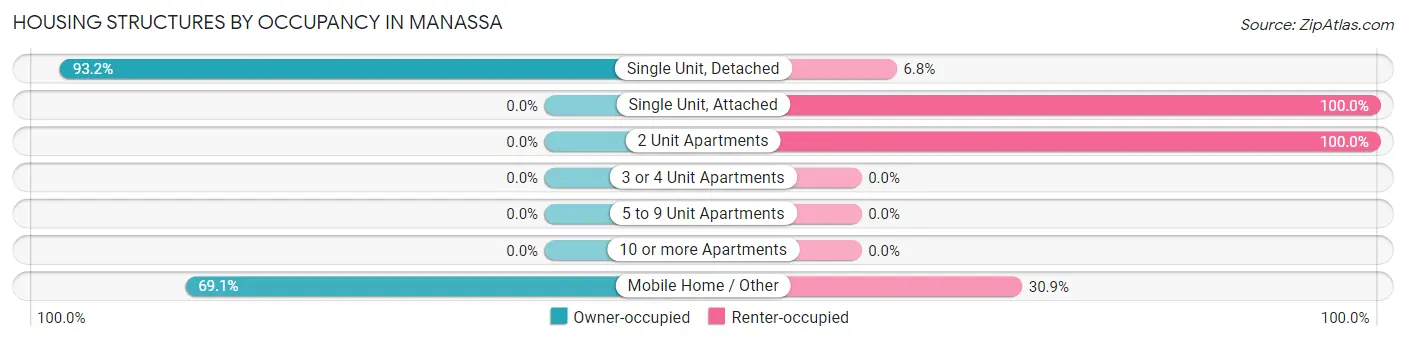
| Structure Type | Owner-occupied | Renter-occupied |
| Single Unit, Detached | 247 (93.2%) | 18 (6.8%) |
| Single Unit, Attached | 0 (0.0%) | 2 (100.0%) |
| 2 Unit Apartments | 0 (0.0%) | 4 (100.0%) |
| 3 or 4 Unit Apartments | 0 (0.0%) | 0 (0.0%) |
| 5 to 9 Unit Apartments | 0 (0.0%) | 0 (0.0%) |
| 10 or more Apartments | 0 (0.0%) | 0 (0.0%) |
| Mobile Home / Other | 67 (69.1%) | 30 (30.9%) |
| Total | 314 (85.3%) | 54 (14.7%) |
Housing Structures by Number of Rooms in Manassa
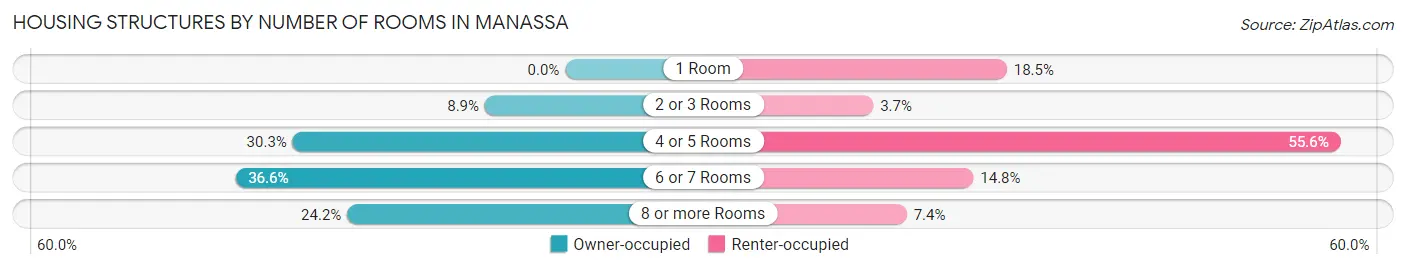
| Number of Rooms | Owner-occupied | Renter-occupied |
| 1 Room | 0 (0.0%) | 10 (18.5%) |
| 2 or 3 Rooms | 28 (8.9%) | 2 (3.7%) |
| 4 or 5 Rooms | 95 (30.2%) | 30 (55.6%) |
| 6 or 7 Rooms | 115 (36.6%) | 8 (14.8%) |
| 8 or more Rooms | 76 (24.2%) | 4 (7.4%) |
| Total | 314 (100.0%) | 54 (100.0%) |
Housing Structure by Heating Type in Manassa
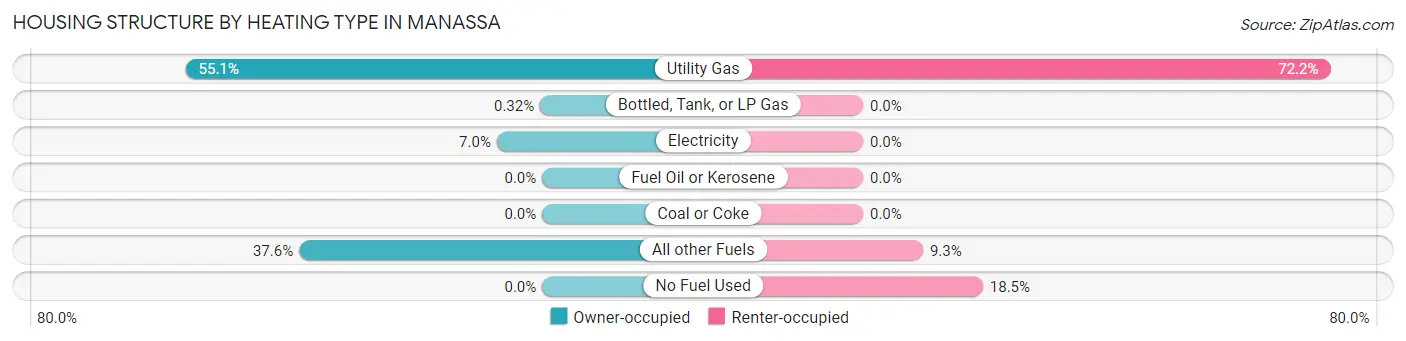
| Heating Type | Owner-occupied | Renter-occupied |
| Utility Gas | 173 (55.1%) | 39 (72.2%) |
| Bottled, Tank, or LP Gas | 1 (0.3%) | 0 (0.0%) |
| Electricity | 22 (7.0%) | 0 (0.0%) |
| Fuel Oil or Kerosene | 0 (0.0%) | 0 (0.0%) |
| Coal or Coke | 0 (0.0%) | 0 (0.0%) |
| All other Fuels | 118 (37.6%) | 5 (9.3%) |
| No Fuel Used | 0 (0.0%) | 10 (18.5%) |
| Total | 314 (100.0%) | 54 (100.0%) |
Household Vehicle Usage in Manassa
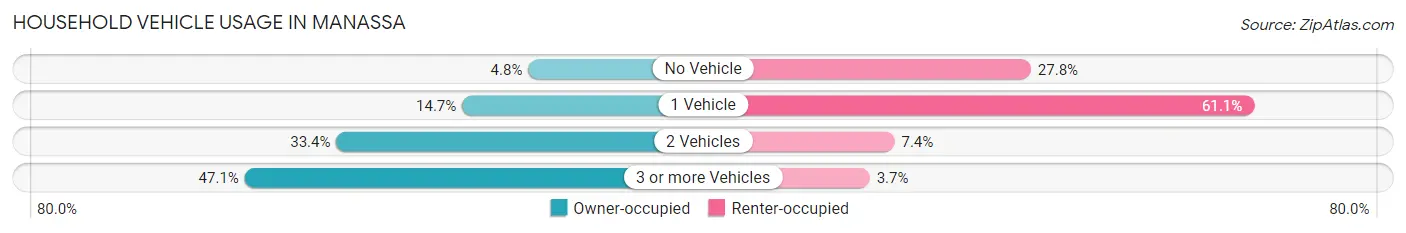
| Vehicles per Household | Owner-occupied | Renter-occupied |
| No Vehicle | 15 (4.8%) | 15 (27.8%) |
| 1 Vehicle | 46 (14.6%) | 33 (61.1%) |
| 2 Vehicles | 105 (33.4%) | 4 (7.4%) |
| 3 or more Vehicles | 148 (47.1%) | 2 (3.7%) |
| Total | 314 (100.0%) | 54 (100.0%) |
Real Estate & Mortgages in Manassa
Real Estate and Mortgage Overview in Manassa
| Characteristic | Without Mortgage | With Mortgage |
| Housing Units | 185 | 129 |
| Median Property Value | $140,300 | $158,600 |
| Median Household Income | $58,281 | $18 |
| Monthly Housing Costs | $332 | $0 |
| Real Estate Taxes | $404 | $0 |
Property Value by Mortgage Status in Manassa
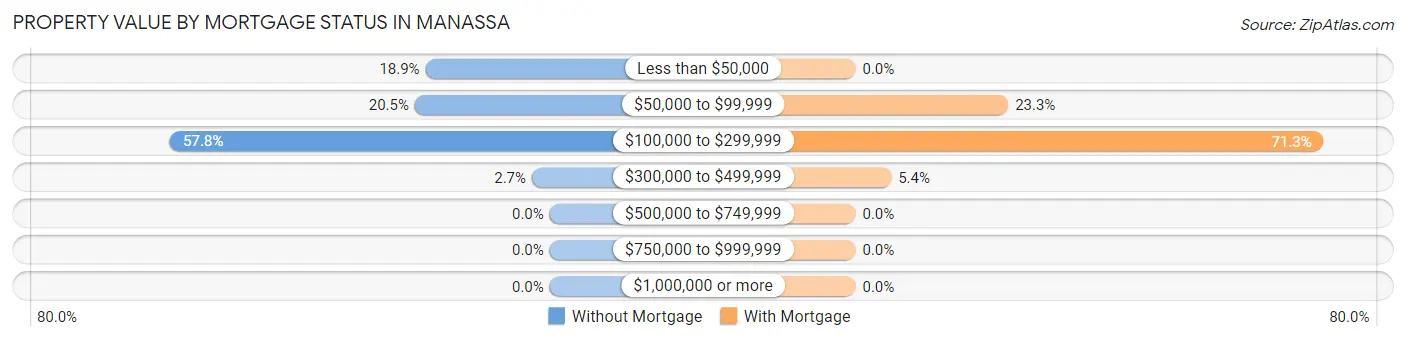
| Property Value | Without Mortgage | With Mortgage |
| Less than $50,000 | 35 (18.9%) | 0 (0.0%) |
| $50,000 to $99,999 | 38 (20.5%) | 30 (23.3%) |
| $100,000 to $299,999 | 107 (57.8%) | 92 (71.3%) |
| $300,000 to $499,999 | 5 (2.7%) | 7 (5.4%) |
| $500,000 to $749,999 | 0 (0.0%) | 0 (0.0%) |
| $750,000 to $999,999 | 0 (0.0%) | 0 (0.0%) |
| $1,000,000 or more | 0 (0.0%) | 0 (0.0%) |
| Total | 185 (100.0%) | 129 (100.0%) |
Household Income by Mortgage Status in Manassa
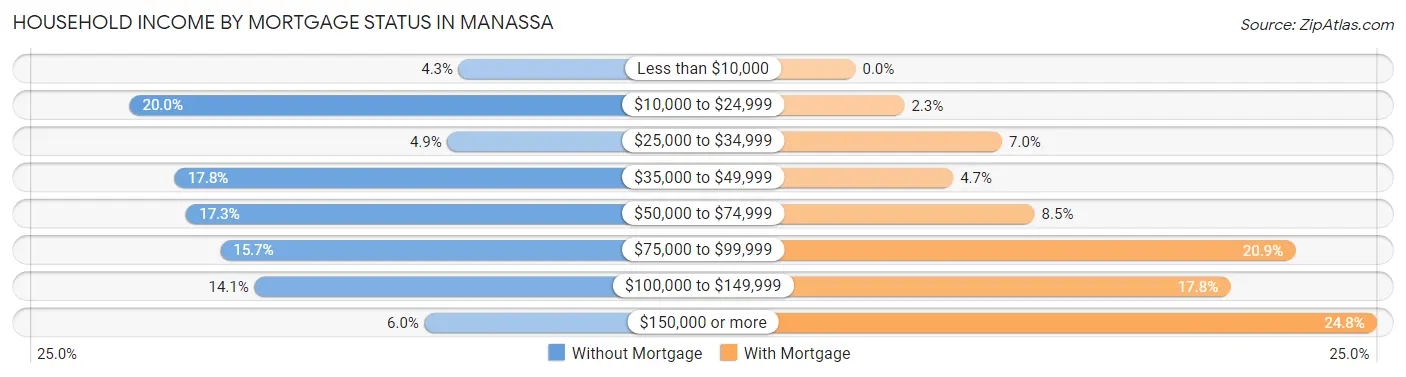
| Household Income | Without Mortgage | With Mortgage |
| Less than $10,000 | 8 (4.3%) | 0 (0.0%) |
| $10,000 to $24,999 | 37 (20.0%) | 3 (2.3%) |
| $25,000 to $34,999 | 9 (4.9%) | 9 (7.0%) |
| $35,000 to $49,999 | 33 (17.8%) | 6 (4.6%) |
| $50,000 to $74,999 | 32 (17.3%) | 11 (8.5%) |
| $75,000 to $99,999 | 29 (15.7%) | 27 (20.9%) |
| $100,000 to $149,999 | 26 (14.1%) | 23 (17.8%) |
| $150,000 or more | 11 (5.9%) | 32 (24.8%) |
| Total | 185 (100.0%) | 129 (100.0%) |
Property Value to Household Income Ratio in Manassa
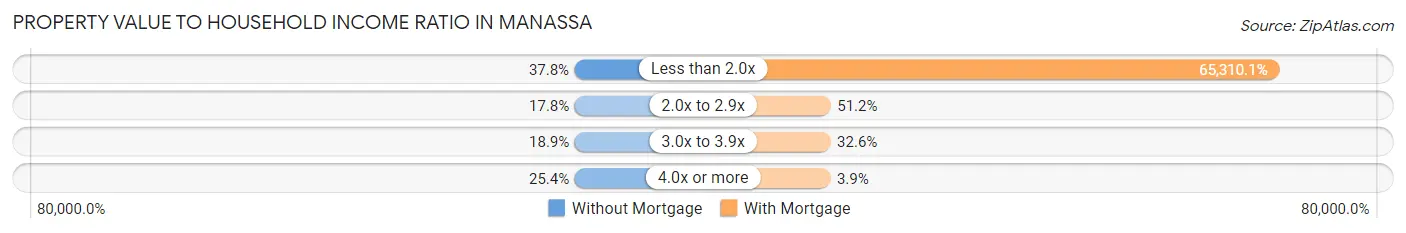
| Value-to-Income Ratio | Without Mortgage | With Mortgage |
| Less than 2.0x | 70 (37.8%) | 84,250 (65,310.1%) |
| 2.0x to 2.9x | 33 (17.8%) | 66 (51.2%) |
| 3.0x to 3.9x | 35 (18.9%) | 42 (32.6%) |
| 4.0x or more | 47 (25.4%) | 5 (3.9%) |
| Total | 185 (100.0%) | 129 (100.0%) |
Real Estate Taxes by Mortgage Status in Manassa
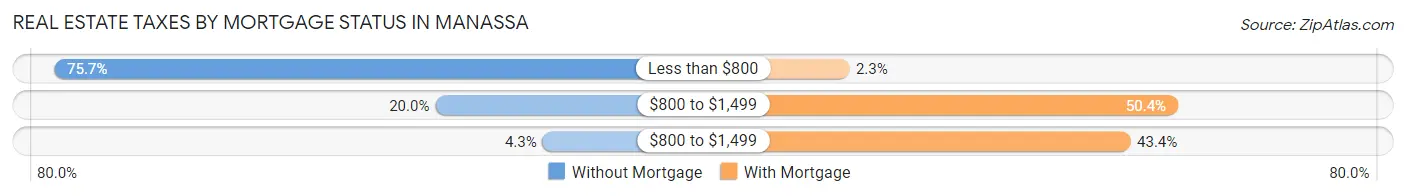
| Property Taxes | Without Mortgage | With Mortgage |
| Less than $800 | 140 (75.7%) | 3 (2.3%) |
| $800 to $1,499 | 37 (20.0%) | 65 (50.4%) |
| $800 to $1,499 | 8 (4.3%) | 56 (43.4%) |
| Total | 185 (100.0%) | 129 (100.0%) |
Health & Disability in Manassa
Health Insurance Coverage by Age in Manassa
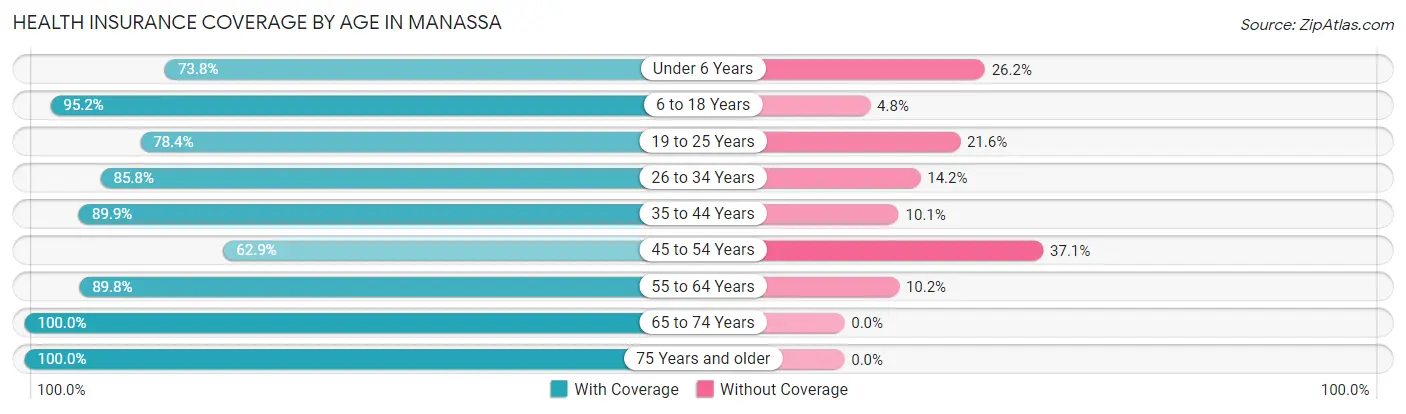
| Age Bracket | With Coverage | Without Coverage |
| Under 6 Years | 62 (73.8%) | 22 (26.2%) |
| 6 to 18 Years | 158 (95.2%) | 8 (4.8%) |
| 19 to 25 Years | 40 (78.4%) | 11 (21.6%) |
| 26 to 34 Years | 103 (85.8%) | 17 (14.2%) |
| 35 to 44 Years | 142 (89.9%) | 16 (10.1%) |
| 45 to 54 Years | 56 (62.9%) | 33 (37.1%) |
| 55 to 64 Years | 97 (89.8%) | 11 (10.2%) |
| 65 to 74 Years | 89 (100.0%) | 0 (0.0%) |
| 75 Years and older | 71 (100.0%) | 0 (0.0%) |
| Total | 818 (87.4%) | 118 (12.6%) |
Health Insurance Coverage by Citizenship Status in Manassa
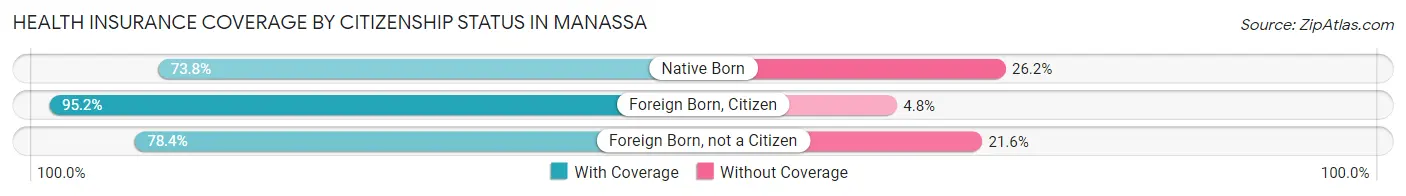
| Citizenship Status | With Coverage | Without Coverage |
| Native Born | 62 (73.8%) | 22 (26.2%) |
| Foreign Born, Citizen | 158 (95.2%) | 8 (4.8%) |
| Foreign Born, not a Citizen | 40 (78.4%) | 11 (21.6%) |
Health Insurance Coverage by Household Income in Manassa
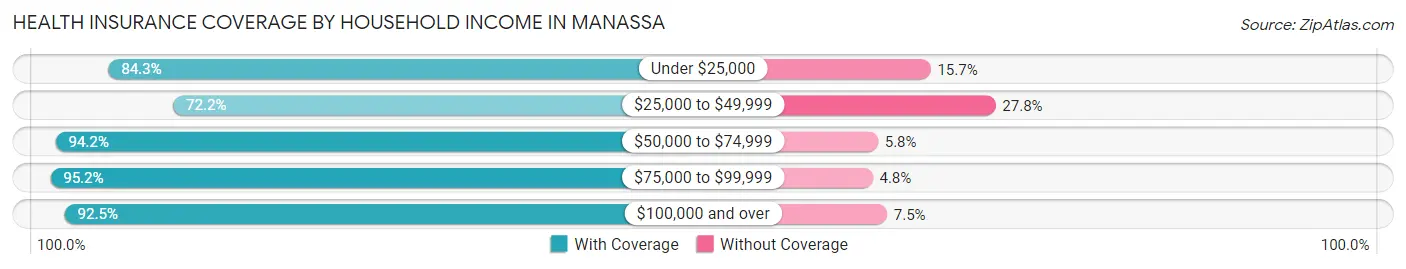
| Household Income | With Coverage | Without Coverage |
| Under $25,000 | 156 (84.3%) | 29 (15.7%) |
| $25,000 to $49,999 | 140 (72.2%) | 54 (27.8%) |
| $50,000 to $74,999 | 130 (94.2%) | 8 (5.8%) |
| $75,000 to $99,999 | 158 (95.2%) | 8 (4.8%) |
| $100,000 and over | 234 (92.5%) | 19 (7.5%) |
Public vs Private Health Insurance Coverage by Age in Manassa
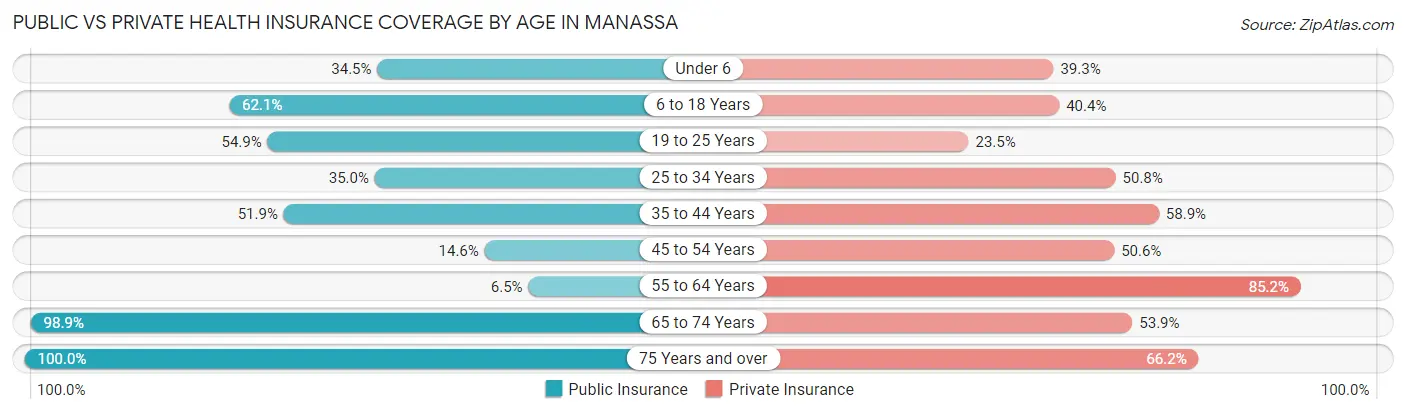
| Age Bracket | Public Insurance | Private Insurance |
| Under 6 | 29 (34.5%) | 33 (39.3%) |
| 6 to 18 Years | 103 (62.1%) | 67 (40.4%) |
| 19 to 25 Years | 28 (54.9%) | 12 (23.5%) |
| 25 to 34 Years | 42 (35.0%) | 61 (50.8%) |
| 35 to 44 Years | 82 (51.9%) | 93 (58.9%) |
| 45 to 54 Years | 13 (14.6%) | 45 (50.6%) |
| 55 to 64 Years | 7 (6.5%) | 92 (85.2%) |
| 65 to 74 Years | 88 (98.9%) | 48 (53.9%) |
| 75 Years and over | 71 (100.0%) | 47 (66.2%) |
| Total | 463 (49.5%) | 498 (53.2%) |
Disability Status by Sex by Age in Manassa
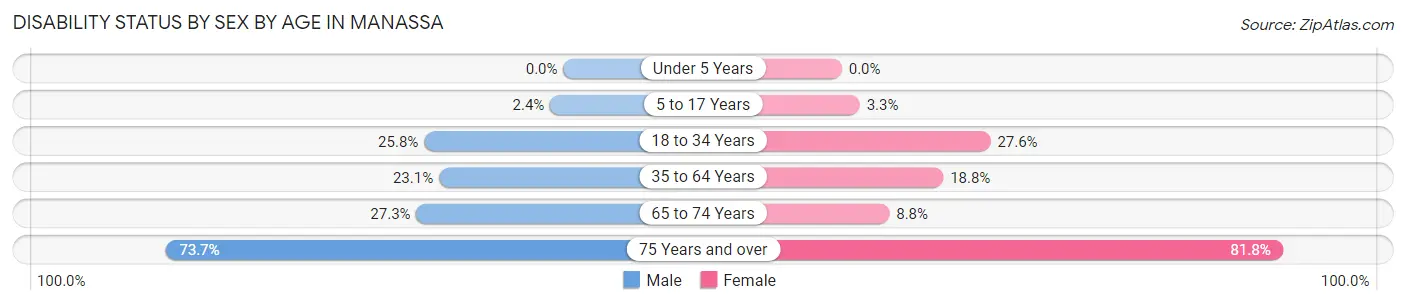
| Age Bracket | Male | Female |
| Under 5 Years | 0 (0.0%) | 0 (0.0%) |
| 5 to 17 Years | 2 (2.4%) | 3 (3.3%) |
| 18 to 34 Years | 23 (25.8%) | 24 (27.6%) |
| 35 to 64 Years | 39 (23.1%) | 35 (18.8%) |
| 65 to 74 Years | 15 (27.3%) | 3 (8.8%) |
| 75 Years and over | 28 (73.7%) | 27 (81.8%) |
Disability Class by Sex by Age in Manassa
Disability Class: Hearing Difficulty
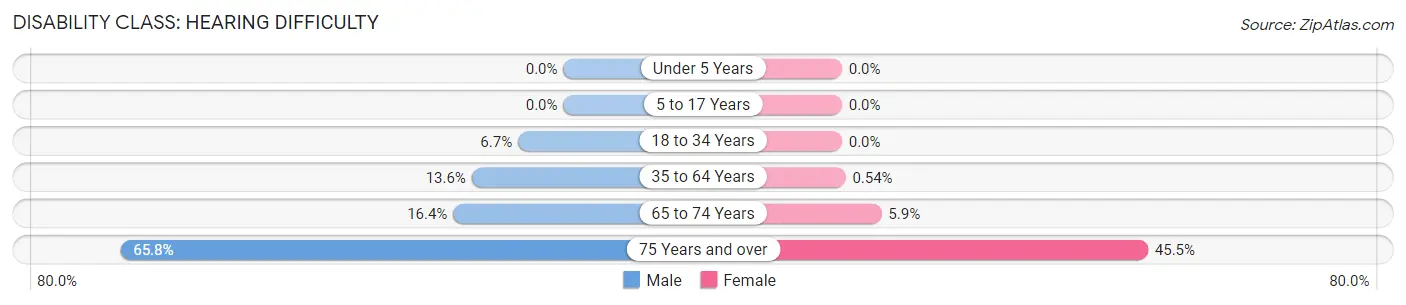
| Age Bracket | Male | Female |
| Under 5 Years | 0 (0.0%) | 0 (0.0%) |
| 5 to 17 Years | 0 (0.0%) | 0 (0.0%) |
| 18 to 34 Years | 6 (6.7%) | 0 (0.0%) |
| 35 to 64 Years | 23 (13.6%) | 1 (0.5%) |
| 65 to 74 Years | 9 (16.4%) | 2 (5.9%) |
| 75 Years and over | 25 (65.8%) | 15 (45.5%) |
Disability Class: Vision Difficulty
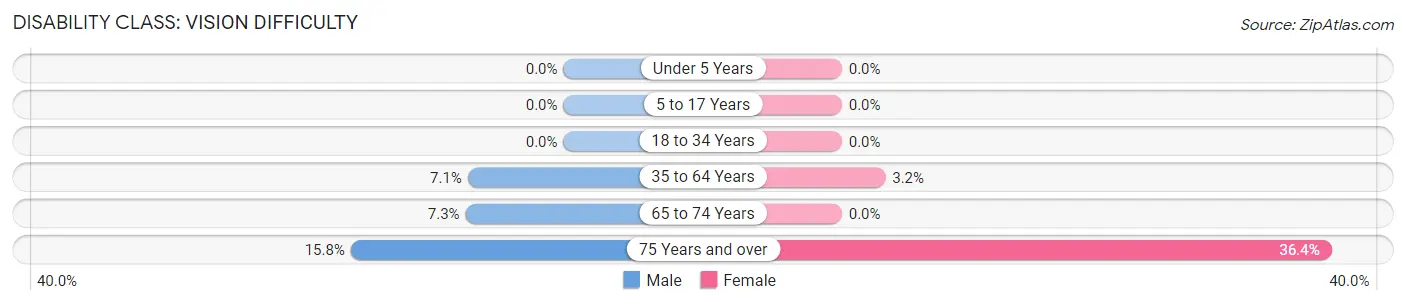
| Age Bracket | Male | Female |
| Under 5 Years | 0 (0.0%) | 0 (0.0%) |
| 5 to 17 Years | 0 (0.0%) | 0 (0.0%) |
| 18 to 34 Years | 0 (0.0%) | 0 (0.0%) |
| 35 to 64 Years | 12 (7.1%) | 6 (3.2%) |
| 65 to 74 Years | 4 (7.3%) | 0 (0.0%) |
| 75 Years and over | 6 (15.8%) | 12 (36.4%) |
Disability Class: Cognitive Difficulty
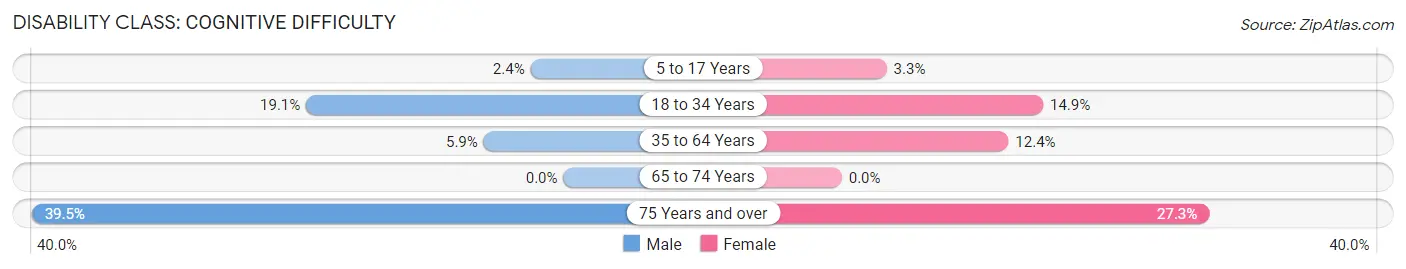
| Age Bracket | Male | Female |
| 5 to 17 Years | 2 (2.4%) | 3 (3.3%) |
| 18 to 34 Years | 17 (19.1%) | 13 (14.9%) |
| 35 to 64 Years | 10 (5.9%) | 23 (12.4%) |
| 65 to 74 Years | 0 (0.0%) | 0 (0.0%) |
| 75 Years and over | 15 (39.5%) | 9 (27.3%) |
Disability Class: Ambulatory Difficulty
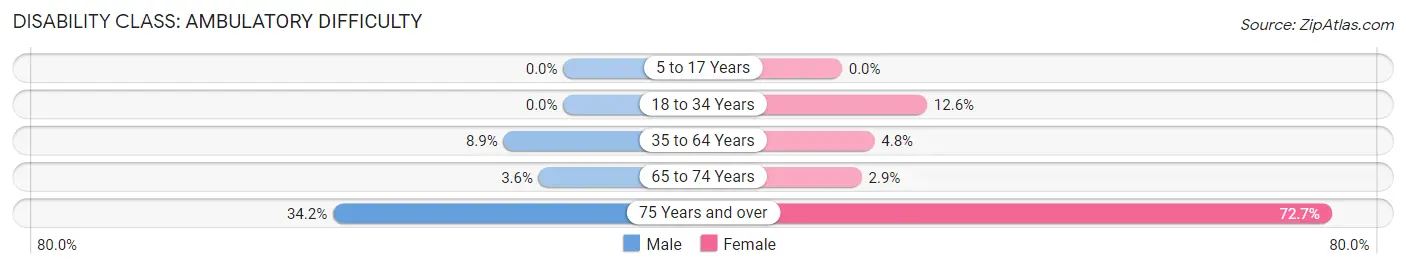
| Age Bracket | Male | Female |
| 5 to 17 Years | 0 (0.0%) | 0 (0.0%) |
| 18 to 34 Years | 0 (0.0%) | 11 (12.6%) |
| 35 to 64 Years | 15 (8.9%) | 9 (4.8%) |
| 65 to 74 Years | 2 (3.6%) | 1 (2.9%) |
| 75 Years and over | 13 (34.2%) | 24 (72.7%) |
Disability Class: Self-Care Difficulty
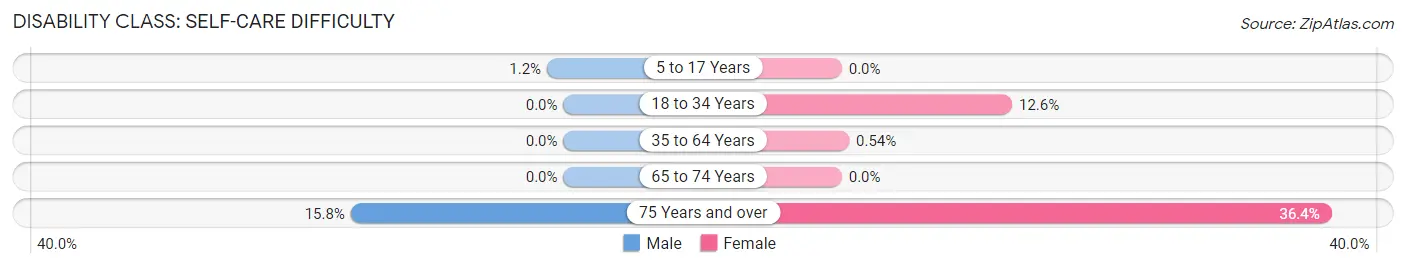
| Age Bracket | Male | Female |
| 5 to 17 Years | 1 (1.2%) | 0 (0.0%) |
| 18 to 34 Years | 0 (0.0%) | 11 (12.6%) |
| 35 to 64 Years | 0 (0.0%) | 1 (0.5%) |
| 65 to 74 Years | 0 (0.0%) | 0 (0.0%) |
| 75 Years and over | 6 (15.8%) | 12 (36.4%) |
Technology Access in Manassa
Computing Device Access in Manassa
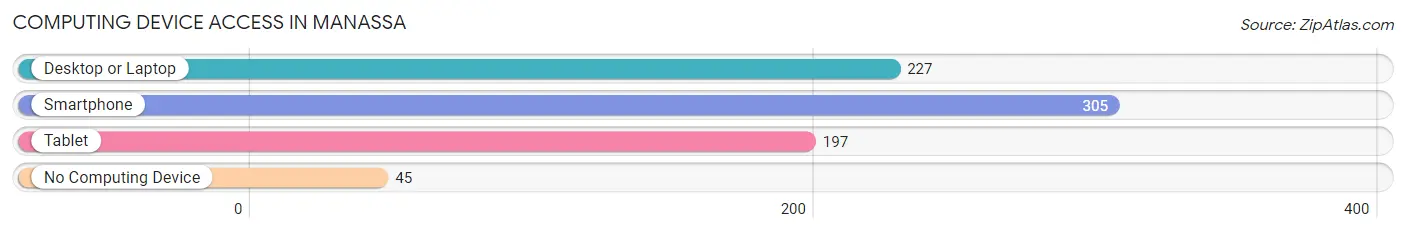
| Device Type | # Households | % Households |
| Desktop or Laptop | 227 | 61.7% |
| Smartphone | 305 | 82.9% |
| Tablet | 197 | 53.5% |
| No Computing Device | 45 | 12.2% |
| Total | 368 | 100.0% |
Internet Access in Manassa
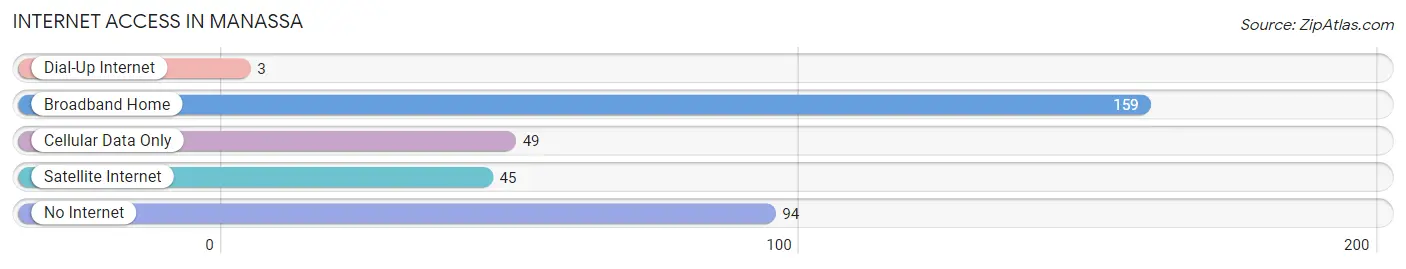
| Internet Type | # Households | % Households |
| Dial-Up Internet | 3 | 0.8% |
| Broadband Home | 159 | 43.2% |
| Cellular Data Only | 49 | 13.3% |
| Satellite Internet | 45 | 12.2% |
| No Internet | 94 | 25.5% |
| Total | 368 | 100.0% |
Manassa Summary
Manassa is a small town located in the San Luis Valley of Colorado. It is situated in the southeastern corner of the state, about 90 miles south of Denver. The town was founded in 1879 by a group of settlers from New Mexico, and it has a population of about 1,000 people.
Manassa is located in the San Luis Valley, which is a large, flat valley surrounded by mountains. The valley is home to a variety of wildlife, including elk, deer, antelope, and bighorn sheep. The valley is also known for its hot springs, which are popular with tourists.
The economy of Manassa is largely based on agriculture. The town is home to several farms, which produce a variety of crops, including potatoes, alfalfa, and hay. The town also has a small manufacturing sector, which produces a variety of products, including furniture and clothing.
The demographics of Manassa are largely Hispanic. According to the 2010 census, the town has a population of 1,000 people, of which 97.3% are Hispanic. The median household income is $30,000, and the median age is 33.
Manassa is served by the San Luis Valley Regional Airport, which is located about 20 miles away in Alamosa. The town is also served by a number of bus lines, which provide transportation to nearby towns and cities.
Manassa is a small town with a rich history and a unique culture. It is a great place to visit for those looking to experience the beauty of the San Luis Valley and the hospitality of its people.
Common Questions
What is Per Capita Income in Manassa?
Per Capita income in Manassa is $30,459.
What is the Median Family Income in Manassa?
Median Family Income in Manassa is $70,714.
What is the Median Household income in Manassa?
Median Household Income in Manassa is $60,441.
What is Inequality or Gini Index in Manassa?
Inequality or Gini Index in Manassa is 0.43.
What is the Total Population of Manassa?
Total Population of Manassa is 936.
What is the Total Male Population of Manassa?
Total Male Population of Manassa is 480.
What is the Total Female Population of Manassa?
Total Female Population of Manassa is 456.
What is the Ratio of Males per 100 Females in Manassa?
There are 105.26 Males per 100 Females in Manassa.
What is the Ratio of Females per 100 Males in Manassa?
There are 95.00 Females per 100 Males in Manassa.
What is the Median Population Age in Manassa?
Median Population Age in Manassa is 37.7 Years.
What is the Average Family Size in Manassa
Average Family Size in Manassa is 3.1 People.
What is the Average Household Size in Manassa
Average Household Size in Manassa is 2.5 People.
How Large is the Labor Force in Manassa?
There are 472 People in the Labor Forcein in Manassa.
What is the Percentage of People in the Labor Force in Manassa?
65.7% of People are in the Labor Force in Manassa.
What is the Unemployment Rate in Manassa?
Unemployment Rate in Manassa is 2.8%.