Zip Codes with the Highest Percentage of Population Employed in Manufacturing in Littleton, CO
RELATED REPORTS & OPTIONS
Manufacturing
Littleton
Compare Zip Codes
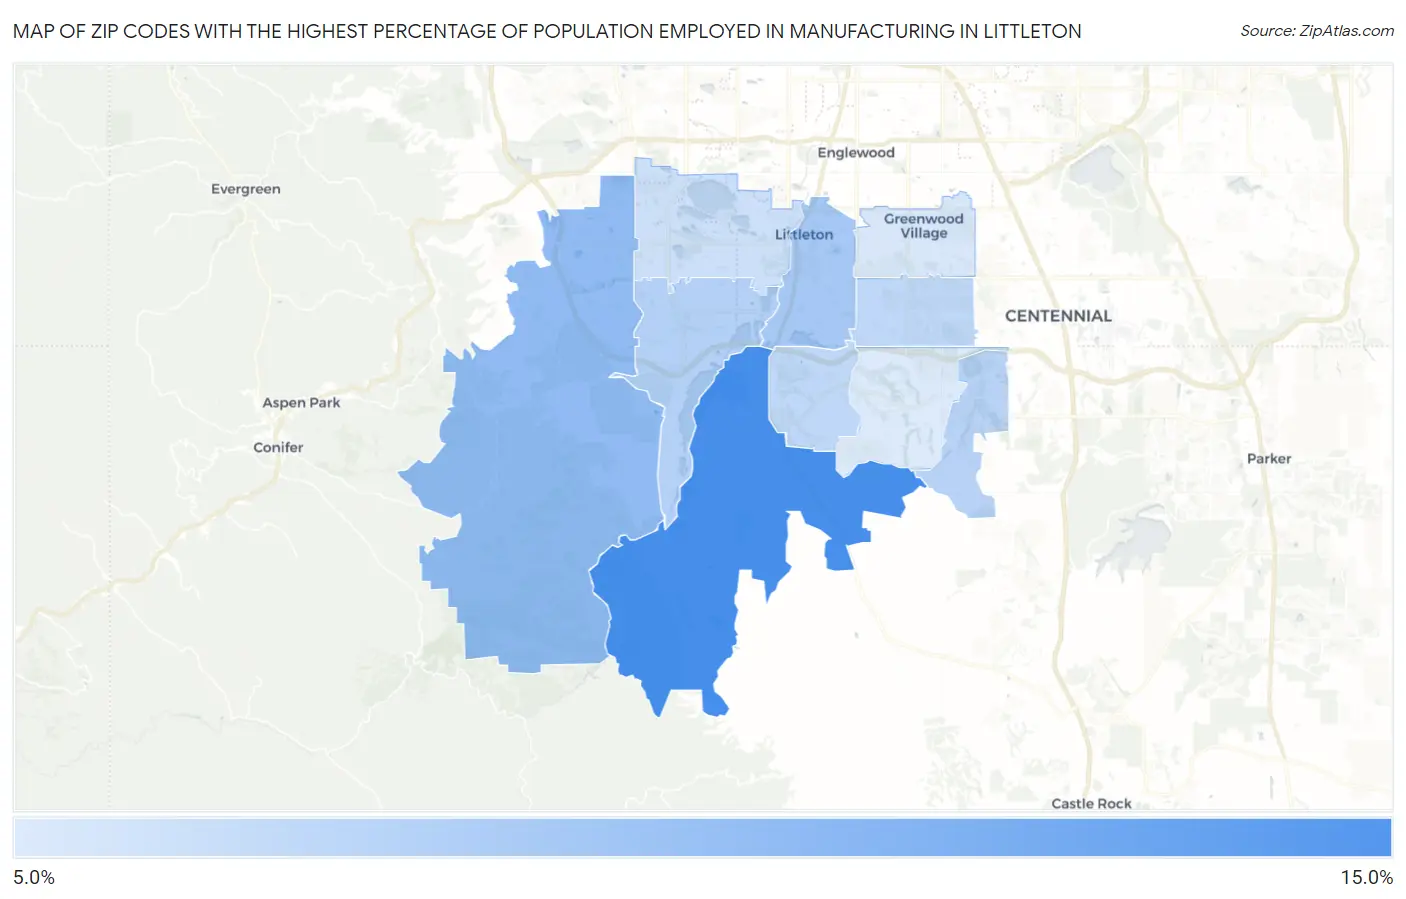
Map of Zip Codes with the Highest Percentage of Population Employed in Manufacturing in Littleton
0.0%
15.0%
Zip Codes with the Highest Percentage of Population Employed in Manufacturing in Littleton, CO
| Zip Code | % Employed | vs State | vs National | |
| 1. | 80125 | 12.4% | 7.0%(+5.42)#41 | 10.0%(+2.42)#12,129 |
| 2. | 80127 | 9.5% | 7.0%(+2.49)#76 | 10.0%(-0.509)#16,665 |
| 3. | 80120 | 8.6% | 7.0%(+1.63)#99 | 10.0%(-1.37)#18,079 |
| 4. | 80128 | 8.1% | 7.0%(+1.10)#114 | 10.0%(-1.90)#18,996 |
| 5. | 80130 | 7.9% | 7.0%(+0.916)#117 | 10.0%(-2.08)#19,341 |
| 6. | 80122 | 7.6% | 7.0%(+0.638)#125 | 10.0%(-2.36)#19,833 |
| 7. | 80129 | 7.6% | 7.0%(+0.591)#128 | 10.0%(-2.41)#19,915 |
| 8. | 80123 | 7.1% | 7.0%(+0.060)#144 | 10.0%(-2.94)#20,891 |
| 9. | 80121 | 6.7% | 7.0%(-0.324)#159 | 10.0%(-3.32)#21,550 |
| 10. | 80126 | 6.5% | 7.0%(-0.532)#175 | 10.0%(-3.53)#21,917 |
1
Common Questions
What are the Top 5 Zip Codes with the Highest Percentage of Population Employed in Manufacturing in Littleton, CO?
Top 5 Zip Codes with the Highest Percentage of Population Employed in Manufacturing in Littleton, CO are:
What zip code has the Highest Percentage of Population Employed in Manufacturing in Littleton, CO?
80125 has the Highest Percentage of Population Employed in Manufacturing in Littleton, CO with 12.4%.
What is the Percentage of Population Employed in Manufacturing in Littleton, CO?
Percentage of Population Employed in Manufacturing in Littleton is 8.7%.
What is the Percentage of Population Employed in Manufacturing in Colorado?
Percentage of Population Employed in Manufacturing in Colorado is 7.0%.
What is the Percentage of Population Employed in Manufacturing in the United States?
Percentage of Population Employed in Manufacturing in the United States is 10.0%.