Limon, CO Map & Demographics
Limon Map
Limon Overview
$35,482
PER CAPITA INCOME
$82,589
AVG FAMILY INCOME
$49,034
AVG HOUSEHOLD INCOME
12.4%
WAGE / INCOME GAP [ % ]
87.6¢/ $1
WAGE / INCOME GAP [ $ ]
0.46
INEQUALITY / GINI INDEX
1,479
TOTAL POPULATION
740
MALE POPULATION
739
FEMALE POPULATION
100.14
MALES / 100 FEMALES
99.86
FEMALES / 100 MALES
47.1
MEDIAN AGE
2.8
AVG FAMILY SIZE
2.1
AVG HOUSEHOLD SIZE
852
LABOR FORCE [ PEOPLE ]
65.7%
PERCENT IN LABOR FORCE
1.9%
UNEMPLOYMENT RATE
Limon Area Codes
Income in Limon
Income Overview in Limon
Per Capita Income in Limon is $35,482, while median incomes of families and households are $82,589 and $49,034 respectively.
| Characteristic | Number | Measure |
| Per Capita Income | 1,479 | $35,482 |
| Median Family Income | 379 | $82,589 |
| Mean Family Income | 379 | $104,534 |
| Median Household Income | 699 | $49,034 |
| Mean Household Income | 699 | $76,522 |
| Income Deficit | 379 | $0 |
| Wage / Income Gap (%) | 1,479 | 12.44% |
| Wage / Income Gap ($) | 1,479 | 87.56¢ per $1 |
| Gini / Inequality Index | 1,479 | 0.46 |
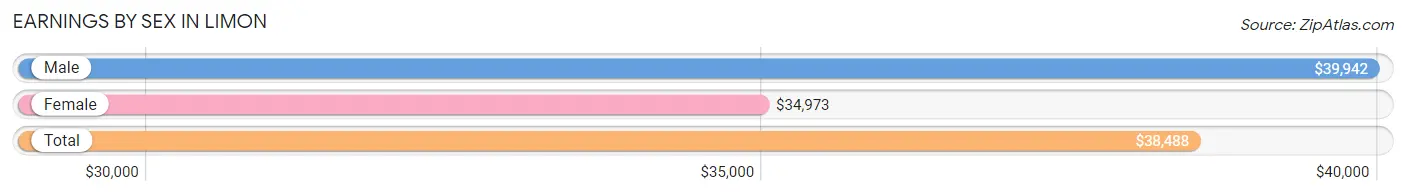
Earnings by Sex in Limon
Average Earnings in Limon are $38,488, $39,942 for men and $34,973 for women, a difference of 12.4%.
| Sex | Number | Average Earnings |
| Male | 476 (51.7%) | $39,942 |
| Female | 445 (48.3%) | $34,973 |
| Total | 921 (100.0%) | $38,488 |
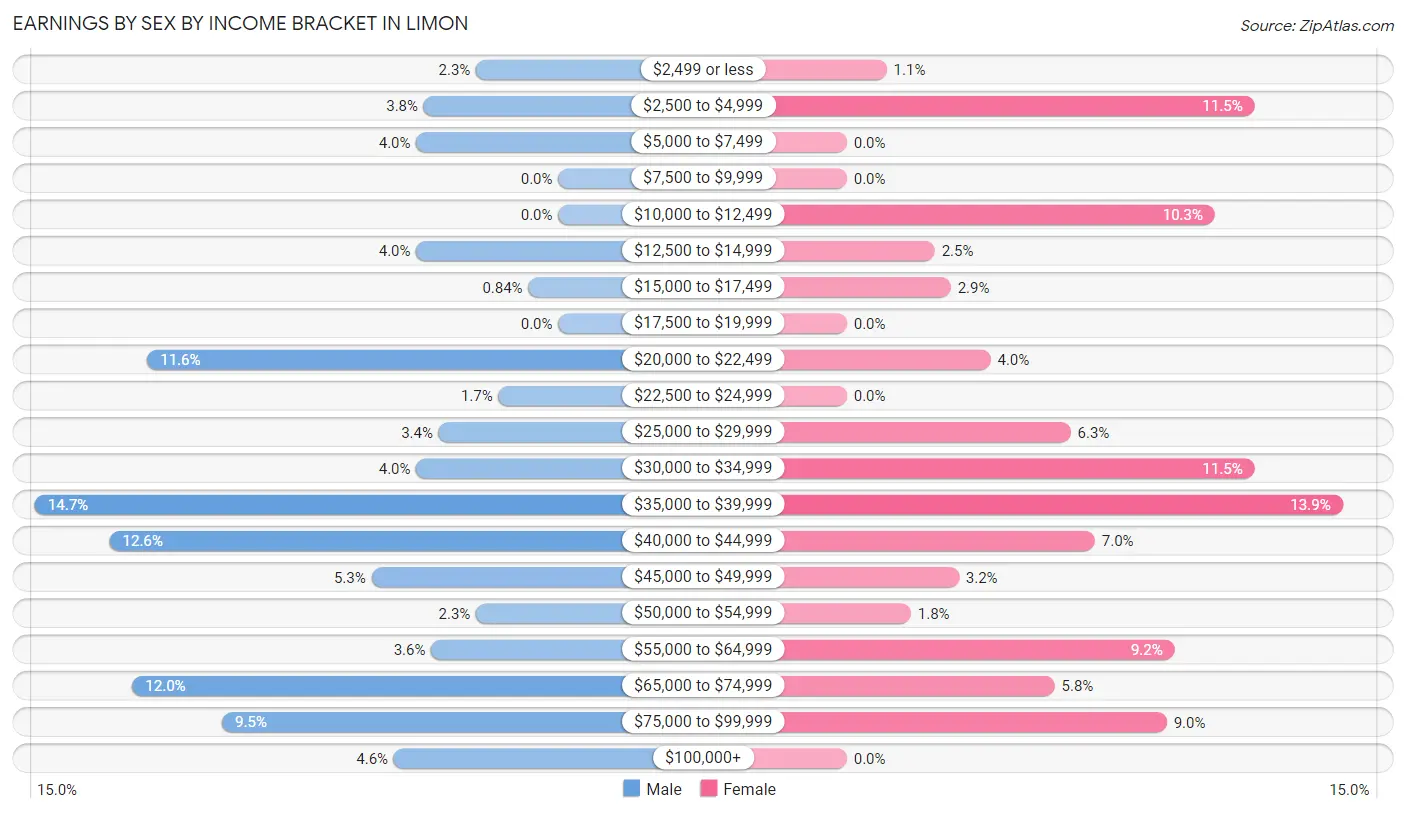
Earnings by Sex by Income Bracket in Limon
The most common earnings brackets in Limon are $35,000 to $39,999 for men (70 | 14.7%) and $35,000 to $39,999 for women (62 | 13.9%).
| Income | Male | Female |
| $2,499 or less | 11 (2.3%) | 5 (1.1%) |
| $2,500 to $4,999 | 18 (3.8%) | 51 (11.5%) |
| $5,000 to $7,499 | 19 (4.0%) | 0 (0.0%) |
| $7,500 to $9,999 | 0 (0.0%) | 0 (0.0%) |
| $10,000 to $12,499 | 0 (0.0%) | 46 (10.3%) |
| $12,500 to $14,999 | 19 (4.0%) | 11 (2.5%) |
| $15,000 to $17,499 | 4 (0.8%) | 13 (2.9%) |
| $17,500 to $19,999 | 0 (0.0%) | 0 (0.0%) |
| $20,000 to $22,499 | 55 (11.6%) | 18 (4.0%) |
| $22,500 to $24,999 | 8 (1.7%) | 0 (0.0%) |
| $25,000 to $29,999 | 16 (3.4%) | 28 (6.3%) |
| $30,000 to $34,999 | 19 (4.0%) | 51 (11.5%) |
| $35,000 to $39,999 | 70 (14.7%) | 62 (13.9%) |
| $40,000 to $44,999 | 60 (12.6%) | 31 (7.0%) |
| $45,000 to $49,999 | 25 (5.2%) | 14 (3.2%) |
| $50,000 to $54,999 | 11 (2.3%) | 8 (1.8%) |
| $55,000 to $64,999 | 17 (3.6%) | 41 (9.2%) |
| $65,000 to $74,999 | 57 (12.0%) | 26 (5.8%) |
| $75,000 to $99,999 | 45 (9.5%) | 40 (9.0%) |
| $100,000+ | 22 (4.6%) | 0 (0.0%) |
| Total | 476 (100.0%) | 445 (100.0%) |
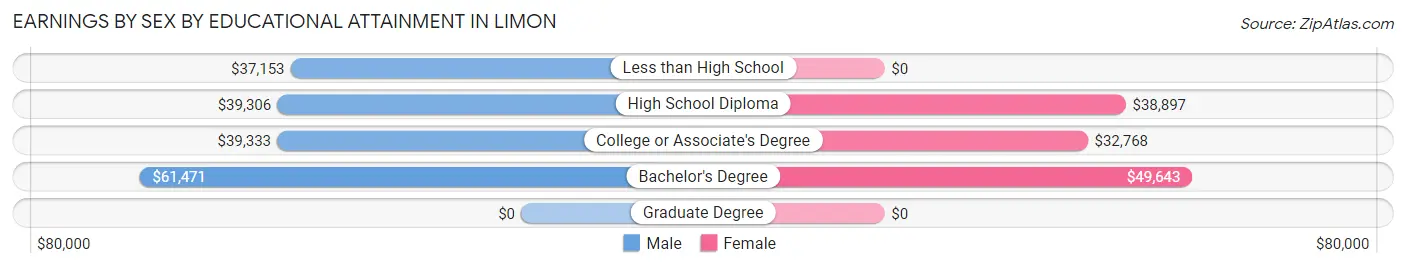
Earnings by Sex by Educational Attainment in Limon
Average earnings in Limon are $41,471 for men and $38,710 for women, a difference of 6.7%. Men with an educational attainment of bachelor's degree enjoy the highest average annual earnings of $61,471, while those with less than high school education earn the least with $37,153. Women with an educational attainment of bachelor's degree earn the most with the average annual earnings of $49,643, while those with college or associate's degree education have the smallest earnings of $32,768.
| Educational Attainment | Male Income | Female Income |
| Less than High School | $37,153 | $0 |
| High School Diploma | $39,306 | $38,897 |
| College or Associate's Degree | $39,333 | $32,768 |
| Bachelor's Degree | $61,471 | $49,643 |
| Graduate Degree | - | - |
| Total | $41,471 | $38,710 |
Family Income in Limon
Family Income Brackets in Limon
According to the Limon family income data, there are 70 families falling into the $100,000 to $149,999 income range, which is the most common income bracket and makes up 18.5% of all families.
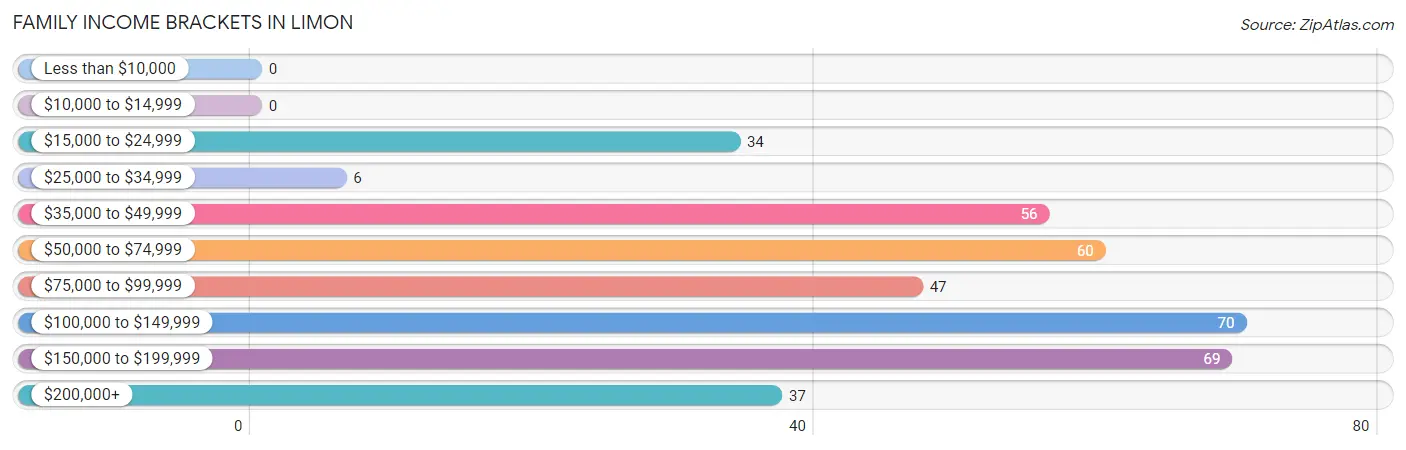
| Income Bracket | # Families | % Families |
| Less than $10,000 | 0 | 0.0% |
| $10,000 to $14,999 | 0 | 0.0% |
| $15,000 to $24,999 | 34 | 9.0% |
| $25,000 to $34,999 | 6 | 1.6% |
| $35,000 to $49,999 | 56 | 14.8% |
| $50,000 to $74,999 | 60 | 15.8% |
| $75,000 to $99,999 | 47 | 12.4% |
| $100,000 to $149,999 | 70 | 18.5% |
| $150,000 to $199,999 | 69 | 18.2% |
| $200,000+ | 37 | 9.8% |
Family Income by Famaliy Size in Limon
5-person families (15 | 4.0%) account for the highest median family income in Limon with $125,893 per family, while 2-person families (199 | 52.5%) have the highest median income of $56,524 per family member.
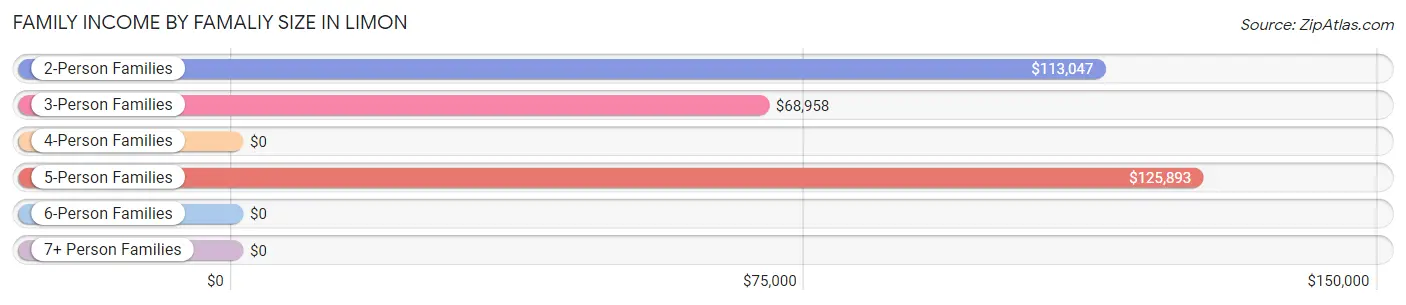
| Income Bracket | # Families | Median Income |
| 2-Person Families | 199 (52.5%) | $113,047 |
| 3-Person Families | 114 (30.1%) | $68,958 |
| 4-Person Families | 51 (13.5%) | $0 |
| 5-Person Families | 15 (4.0%) | $125,893 |
| 6-Person Families | 0 (0.0%) | $0 |
| 7+ Person Families | 0 (0.0%) | $0 |
| Total | 379 (100.0%) | $82,589 |
Family Income by Number of Earners in Limon
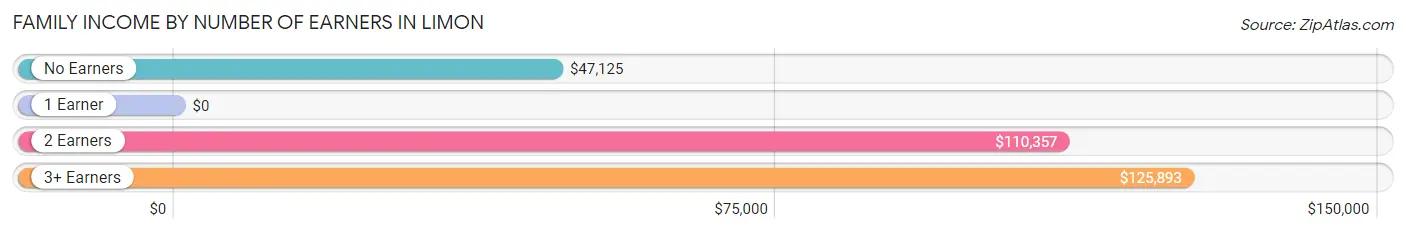
| Number of Earners | # Families | Median Income |
| No Earners | 31 (8.2%) | $47,125 |
| 1 Earner | 81 (21.4%) | $0 |
| 2 Earners | 176 (46.4%) | $110,357 |
| 3+ Earners | 91 (24.0%) | $125,893 |
| Total | 379 (100.0%) | $82,589 |
Household Income in Limon
Household Income Brackets in Limon
With 105 households falling in the category, the $25,000 to $34,999 income range is the most frequent in Limon, accounting for 15.0% of all households. In contrast, only 39 households (5.6%) fall into the $10,000 to $14,999 income bracket, making it the least populous group.
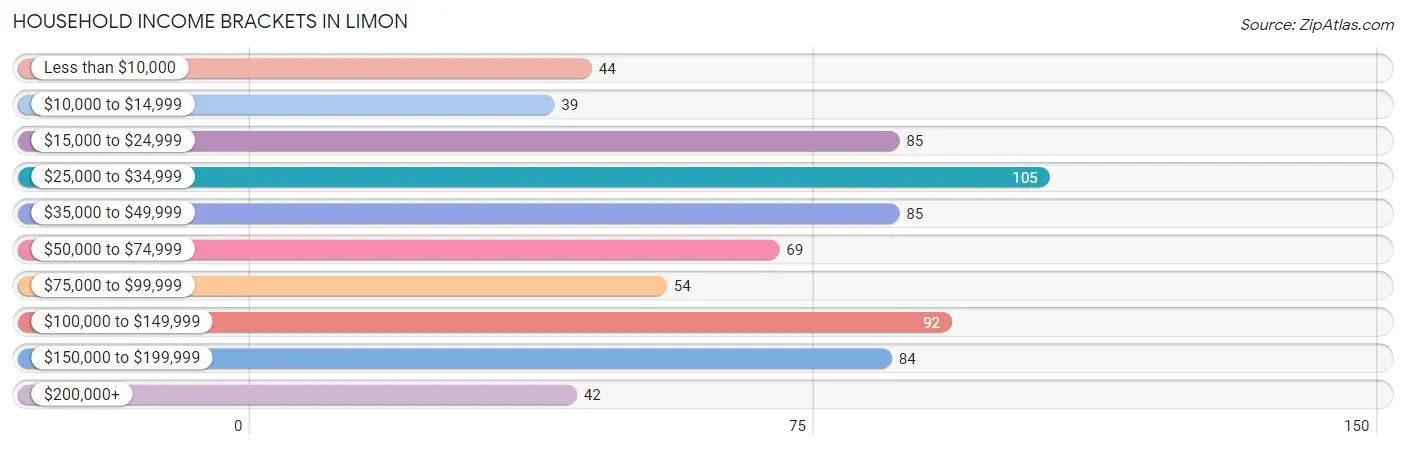
| Income Bracket | # Households | % Households |
| Less than $10,000 | 44 | 6.3% |
| $10,000 to $14,999 | 39 | 5.6% |
| $15,000 to $24,999 | 85 | 12.2% |
| $25,000 to $34,999 | 105 | 15.0% |
| $35,000 to $49,999 | 85 | 12.2% |
| $50,000 to $74,999 | 69 | 9.9% |
| $75,000 to $99,999 | 54 | 7.7% |
| $100,000 to $149,999 | 92 | 13.2% |
| $150,000 to $199,999 | 84 | 12.0% |
| $200,000+ | 42 | 6.0% |
Household Income by Householder Age in Limon
The median household income in Limon is $49,034, with the highest median household income of $84,107 found in the 25 to 44 years age bracket for the primary householder. A total of 220 households (31.5%) fall into this category. Meanwhile, the 15 to 24 years age bracket for the primary householder has the lowest median household income of $0, with 12 households (1.7%) in this group.
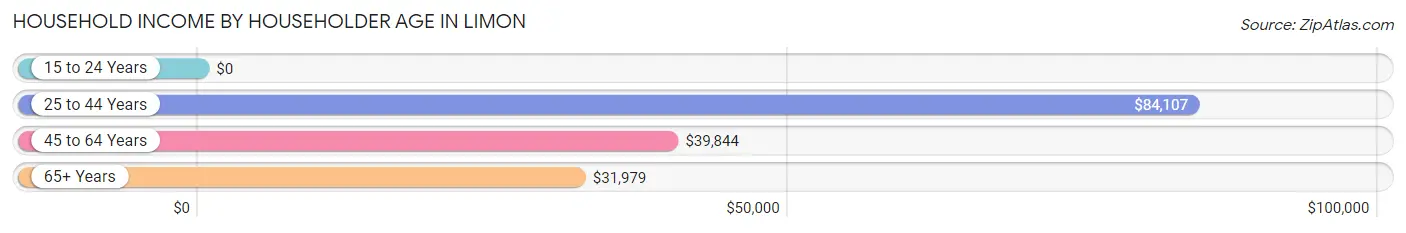
| Income Bracket | # Households | Median Income |
| 15 to 24 Years | 12 (1.7%) | $0 |
| 25 to 44 Years | 220 (31.5%) | $84,107 |
| 45 to 64 Years | 226 (32.3%) | $39,844 |
| 65+ Years | 241 (34.5%) | $31,979 |
| Total | 699 (100.0%) | $49,034 |
Poverty in Limon
Income Below Poverty by Sex and Age in Limon
With 4.8% poverty level for males and 8.7% for females among the residents of Limon, 25 to 34 year old males and 75 year old and over females are the most vulnerable to poverty, with 19 males (12.8%) and 32 females (37.7%) in their respective age groups living below the poverty level.
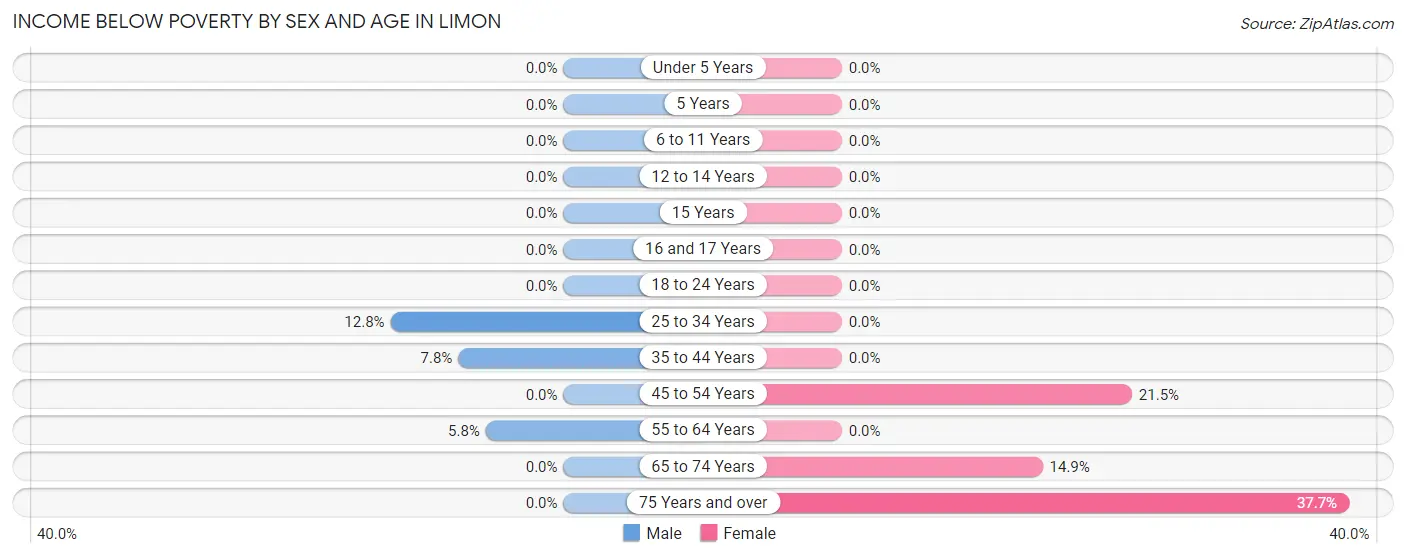
| Age Bracket | Male | Female |
| Under 5 Years | 0 (0.0%) | 0 (0.0%) |
| 5 Years | 0 (0.0%) | 0 (0.0%) |
| 6 to 11 Years | 0 (0.0%) | 0 (0.0%) |
| 12 to 14 Years | 0 (0.0%) | 0 (0.0%) |
| 15 Years | 0 (0.0%) | 0 (0.0%) |
| 16 and 17 Years | 0 (0.0%) | 0 (0.0%) |
| 18 to 24 Years | 0 (0.0%) | 0 (0.0%) |
| 25 to 34 Years | 19 (12.8%) | 0 (0.0%) |
| 35 to 44 Years | 5 (7.8%) | 0 (0.0%) |
| 45 to 54 Years | 0 (0.0%) | 14 (21.5%) |
| 55 to 64 Years | 9 (5.8%) | 0 (0.0%) |
| 65 to 74 Years | 0 (0.0%) | 17 (14.9%) |
| 75 Years and over | 0 (0.0%) | 32 (37.7%) |
| Total | 33 (4.8%) | 63 (8.7%) |
Income Above Poverty by Sex and Age in Limon
According to the poverty statistics in Limon, males aged under 5 years and females aged under 5 years are the age groups that are most secure financially, with 100.0% of males and 100.0% of females in these age groups living above the poverty line.
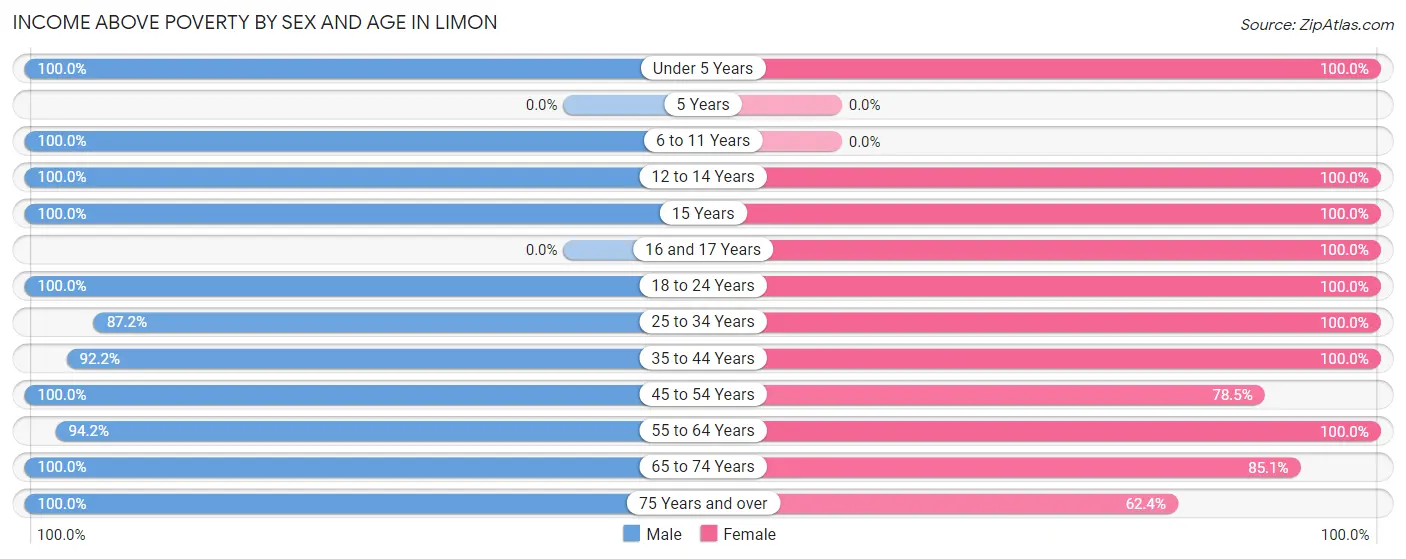
| Age Bracket | Male | Female |
| Under 5 Years | 18 (100.0%) | 24 (100.0%) |
| 5 Years | 0 (0.0%) | 0 (0.0%) |
| 6 to 11 Years | 28 (100.0%) | 0 (0.0%) |
| 12 to 14 Years | 14 (100.0%) | 39 (100.0%) |
| 15 Years | 6 (100.0%) | 20 (100.0%) |
| 16 and 17 Years | 0 (0.0%) | 11 (100.0%) |
| 18 to 24 Years | 82 (100.0%) | 50 (100.0%) |
| 25 to 34 Years | 129 (87.2%) | 110 (100.0%) |
| 35 to 44 Years | 59 (92.2%) | 70 (100.0%) |
| 45 to 54 Years | 68 (100.0%) | 51 (78.5%) |
| 55 to 64 Years | 147 (94.2%) | 137 (100.0%) |
| 65 to 74 Years | 79 (100.0%) | 97 (85.1%) |
| 75 Years and over | 25 (100.0%) | 53 (62.4%) |
| Total | 655 (95.2%) | 662 (91.3%) |
Income Below Poverty Among Married-Couple Families in Limon
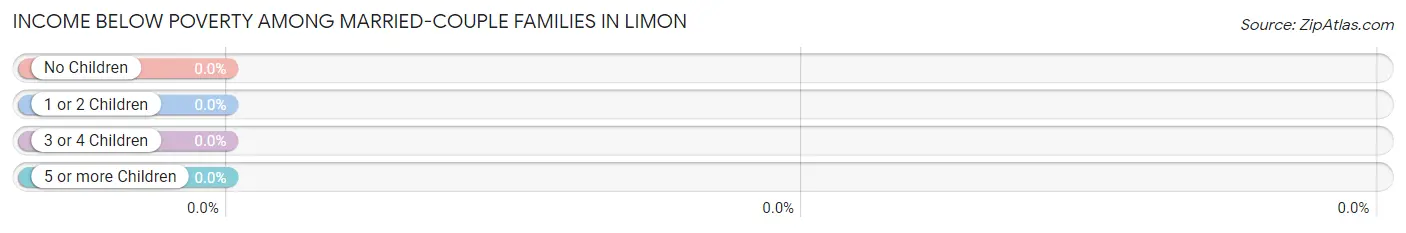
| Children | Above Poverty | Below Poverty |
| No Children | 265 (100.0%) | 0 (0.0%) |
| 1 or 2 Children | 54 (100.0%) | 0 (0.0%) |
| 3 or 4 Children | 5 (100.0%) | 0 (0.0%) |
| 5 or more Children | 0 (0.0%) | 0 (0.0%) |
| Total | 324 (100.0%) | 0 (0.0%) |
Income Below Poverty Among Single-Parent Households in Limon
| Children | Single Father | Single Mother |
| No Children | 0 (0.0%) | 0 (0.0%) |
| 1 or 2 Children | 0 (0.0%) | 0 (0.0%) |
| 3 or 4 Children | 0 (0.0%) | 0 (0.0%) |
| 5 or more Children | 0 (0.0%) | 0 (0.0%) |
| Total | 0 (0.0%) | 0 (0.0%) |
Income Below Poverty Among Married-Couple vs Single-Parent Households in Limon
| Children | Married-Couple Families | Single-Parent Households |
| No Children | 0 (0.0%) | 0 (0.0%) |
| 1 or 2 Children | 0 (0.0%) | 0 (0.0%) |
| 3 or 4 Children | 0 (0.0%) | 0 (0.0%) |
| 5 or more Children | 0 (0.0%) | 0 (0.0%) |
| Total | 0 (0.0%) | 0 (0.0%) |
Race in Limon
The most populous races in Limon are White / Caucasian (1,340 | 90.6%), Two or more Races (67 | 4.5%), and Hispanic or Latino (58 | 3.9%).
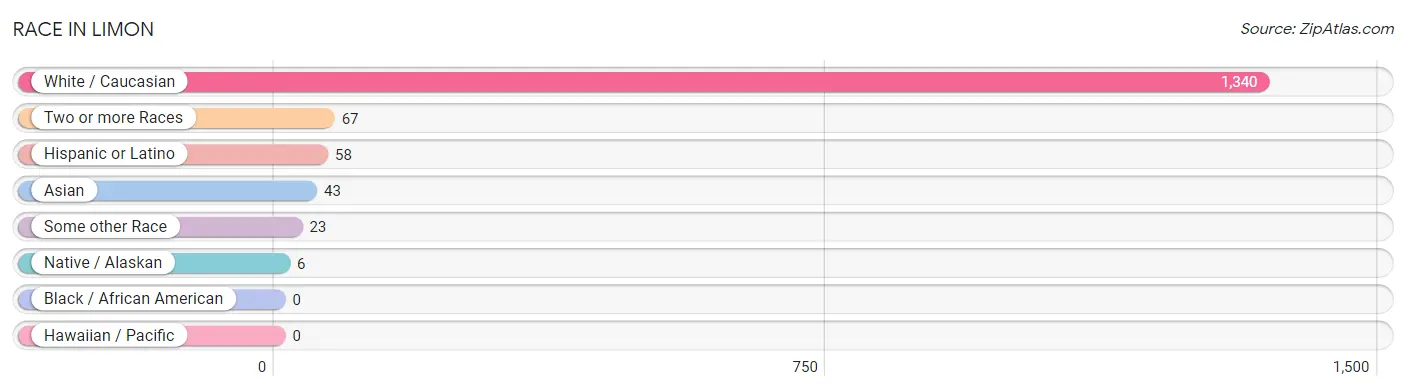
| Race | # Population | % Population |
| Asian | 43 | 2.9% |
| Black / African American | 0 | 0.0% |
| Hawaiian / Pacific | 0 | 0.0% |
| Hispanic or Latino | 58 | 3.9% |
| Native / Alaskan | 6 | 0.4% |
| White / Caucasian | 1,340 | 90.6% |
| Two or more Races | 67 | 4.5% |
| Some other Race | 23 | 1.6% |
| Total | 1,479 | 100.0% |
Ancestry in Limon
The most populous ancestries reported in Limon are German (294 | 19.9%), Irish (237 | 16.0%), English (129 | 8.7%), European (62 | 4.2%), and Italian (49 | 3.3%), together accounting for 52.1% of all Limon residents.
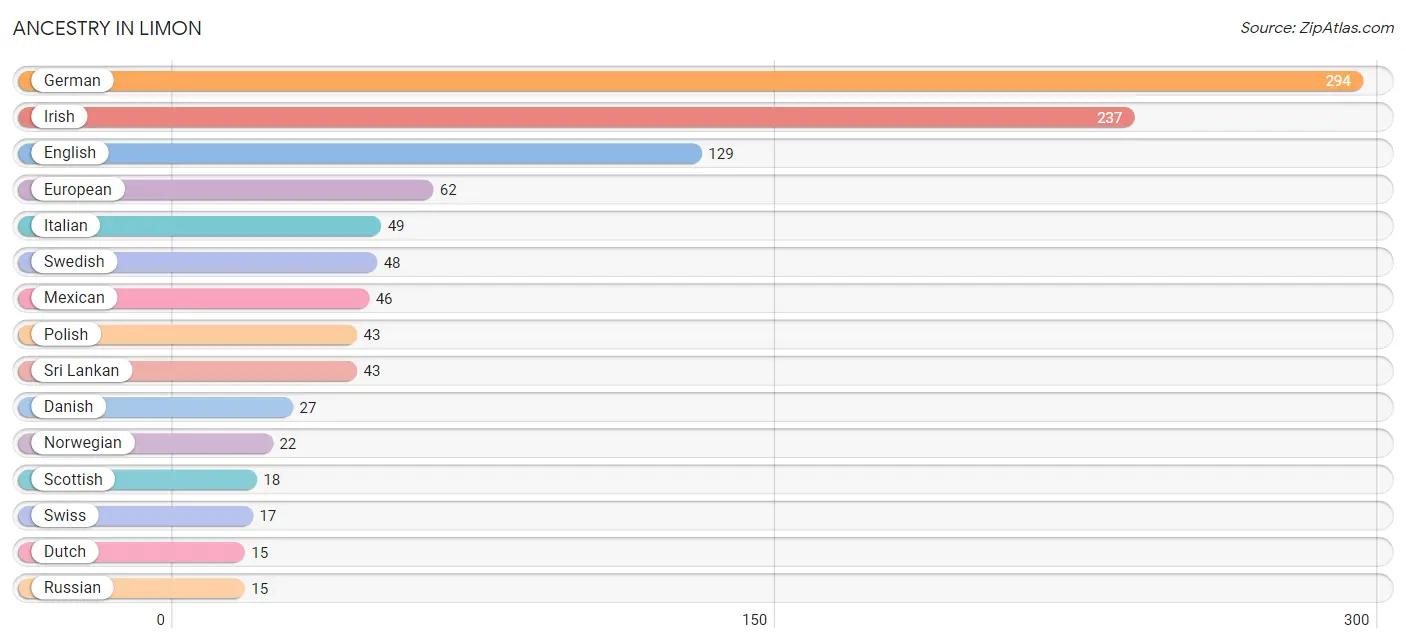
| Ancestry | # Population | % Population |
| American | 14 | 0.9% |
| British | 4 | 0.3% |
| Cajun | 1 | 0.1% |
| Czech | 10 | 0.7% |
| Danish | 27 | 1.8% |
| Dutch | 15 | 1.0% |
| English | 129 | 8.7% |
| European | 62 | 4.2% |
| French | 7 | 0.5% |
| German | 294 | 19.9% |
| Irish | 237 | 16.0% |
| Italian | 49 | 3.3% |
| Mexican | 46 | 3.1% |
| Northern European | 4 | 0.3% |
| Norwegian | 22 | 1.5% |
| Polish | 43 | 2.9% |
| Portuguese | 7 | 0.5% |
| Romanian | 9 | 0.6% |
| Russian | 15 | 1.0% |
| Scandinavian | 1 | 0.1% |
| Scotch-Irish | 2 | 0.1% |
| Scottish | 18 | 1.2% |
| Sri Lankan | 43 | 2.9% |
| Swedish | 48 | 3.3% |
| Swiss | 17 | 1.1% | View All 25 Rows |
Immigrants in Limon
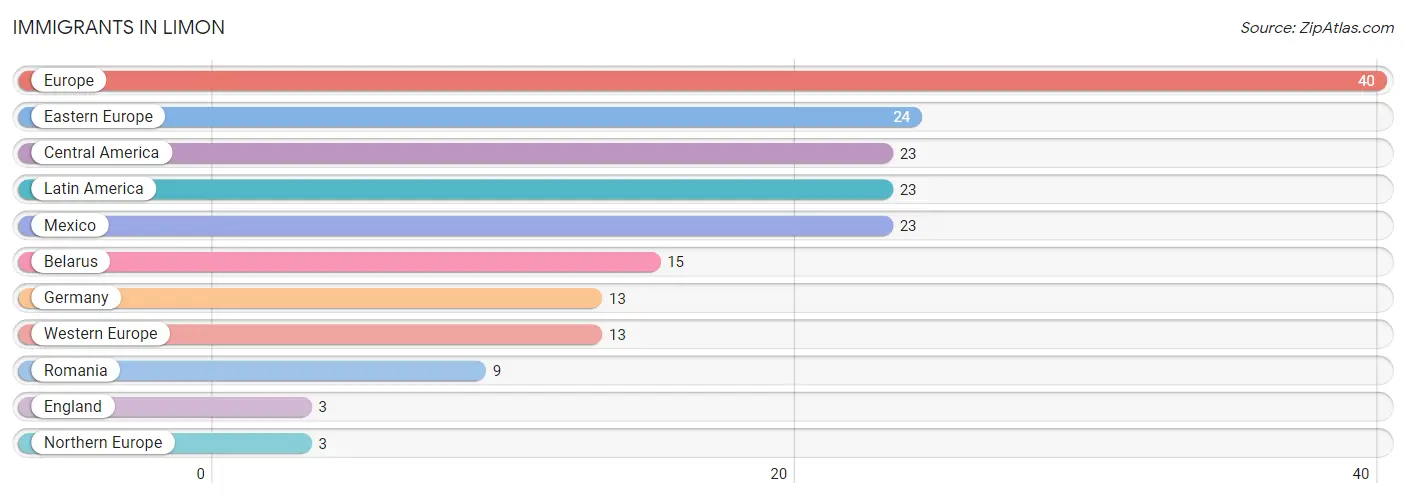
The most numerous immigrant groups reported in Limon came from Europe (40 | 2.7%), Eastern Europe (24 | 1.6%), Central America (23 | 1.6%), Latin America (23 | 1.6%), and Mexico (23 | 1.6%), together accounting for 9.0% of all Limon residents.
| Immigration Origin | # Population | % Population |
| Belarus | 15 | 1.0% |
| Central America | 23 | 1.6% |
| Eastern Europe | 24 | 1.6% |
| England | 3 | 0.2% |
| Europe | 40 | 2.7% |
| Germany | 13 | 0.9% |
| Latin America | 23 | 1.6% |
| Mexico | 23 | 1.6% |
| Northern Europe | 3 | 0.2% |
| Romania | 9 | 0.6% |
| Western Europe | 13 | 0.9% | View All 11 Rows |
Sex and Age in Limon
Sex and Age in Limon
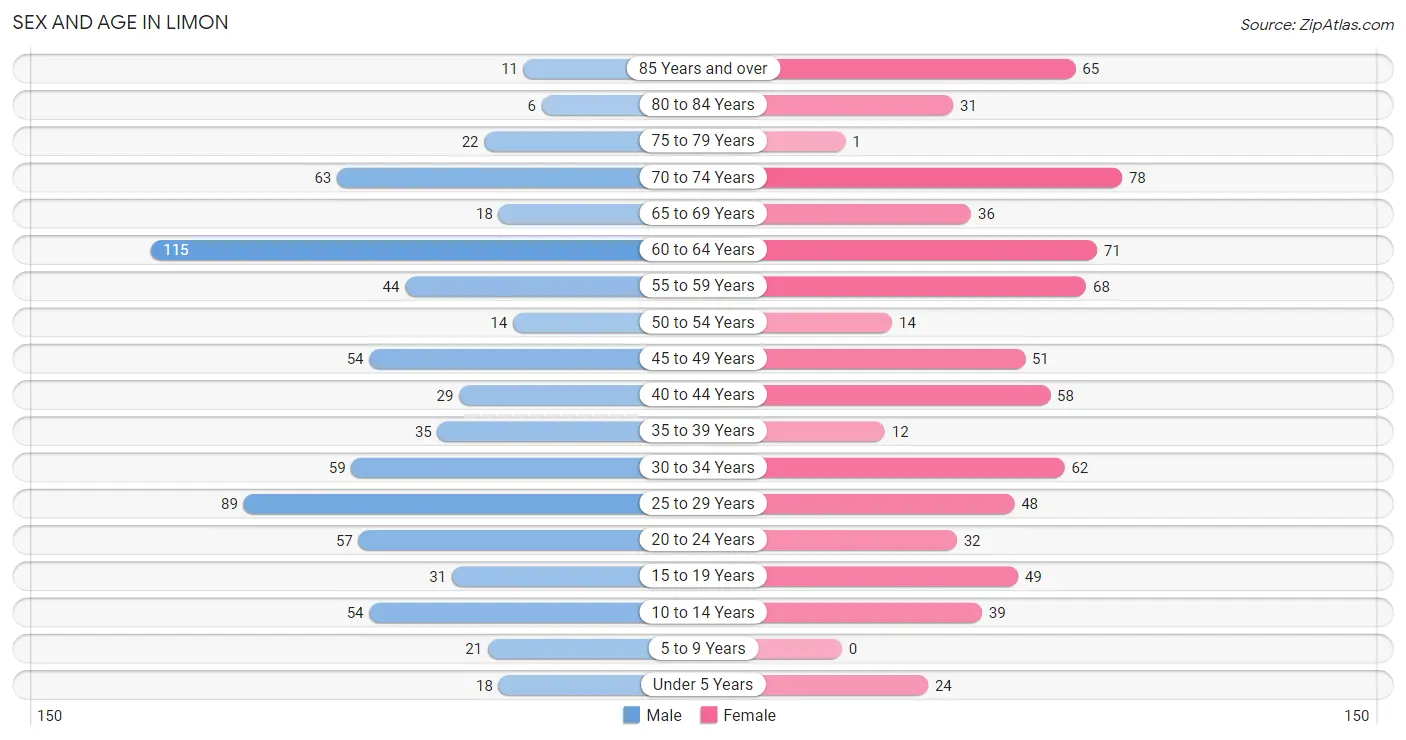
The most populous age groups in Limon are 60 to 64 Years (115 | 15.5%) for men and 70 to 74 Years (78 | 10.5%) for women.
| Age Bracket | Male | Female |
| Under 5 Years | 18 (2.4%) | 24 (3.3%) |
| 5 to 9 Years | 21 (2.8%) | 0 (0.0%) |
| 10 to 14 Years | 54 (7.3%) | 39 (5.3%) |
| 15 to 19 Years | 31 (4.2%) | 49 (6.6%) |
| 20 to 24 Years | 57 (7.7%) | 32 (4.3%) |
| 25 to 29 Years | 89 (12.0%) | 48 (6.5%) |
| 30 to 34 Years | 59 (8.0%) | 62 (8.4%) |
| 35 to 39 Years | 35 (4.7%) | 12 (1.6%) |
| 40 to 44 Years | 29 (3.9%) | 58 (7.9%) |
| 45 to 49 Years | 54 (7.3%) | 51 (6.9%) |
| 50 to 54 Years | 14 (1.9%) | 14 (1.9%) |
| 55 to 59 Years | 44 (5.9%) | 68 (9.2%) |
| 60 to 64 Years | 115 (15.5%) | 71 (9.6%) |
| 65 to 69 Years | 18 (2.4%) | 36 (4.9%) |
| 70 to 74 Years | 63 (8.5%) | 78 (10.5%) |
| 75 to 79 Years | 22 (3.0%) | 1 (0.1%) |
| 80 to 84 Years | 6 (0.8%) | 31 (4.2%) |
| 85 Years and over | 11 (1.5%) | 65 (8.8%) |
| Total | 740 (100.0%) | 739 (100.0%) |
Families and Households in Limon
Median Family Size in Limon
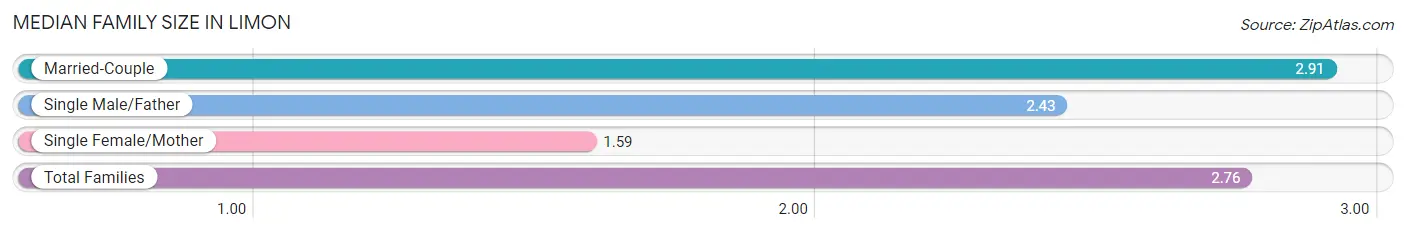
The median family size in Limon is 2.76 persons per family, with married-couple families (324 | 85.5%) accounting for the largest median family size of 2.91 persons per family. On the other hand, single female/mother families (34 | 9.0%) represent the smallest median family size with 1.59 persons per family.
| Family Type | # Families | Family Size |
| Married-Couple | 324 (85.5%) | 2.91 |
| Single Male/Father | 21 (5.5%) | 2.43 |
| Single Female/Mother | 34 (9.0%) | 1.59 |
| Total Families | 379 (100.0%) | 2.76 |
Median Household Size in Limon
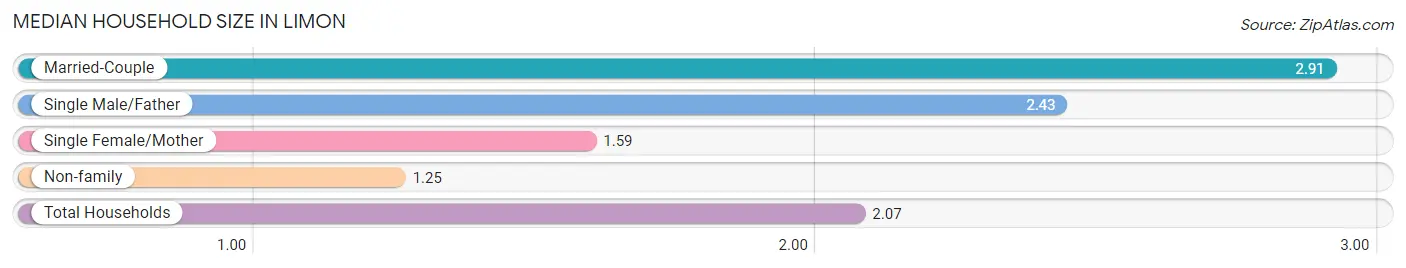
The median household size in Limon is 2.07 persons per household, with married-couple households (324 | 46.4%) accounting for the largest median household size of 2.91 persons per household. non-family households (320 | 45.8%) represent the smallest median household size with 1.25 persons per household.
| Household Type | # Households | Household Size |
| Married-Couple | 324 (46.4%) | 2.91 |
| Single Male/Father | 21 (3.0%) | 2.43 |
| Single Female/Mother | 34 (4.9%) | 1.59 |
| Non-family | 320 (45.8%) | 1.25 |
| Total Households | 699 (100.0%) | 2.07 |
Household Size by Marriage Status in Limon
Out of a total of 699 households in Limon, 379 (54.2%) are family households, while 320 (45.8%) are nonfamily households. The most numerous type of family households are 2-person households, comprising 199, and the most common type of nonfamily households are 1-person households, comprising 279.
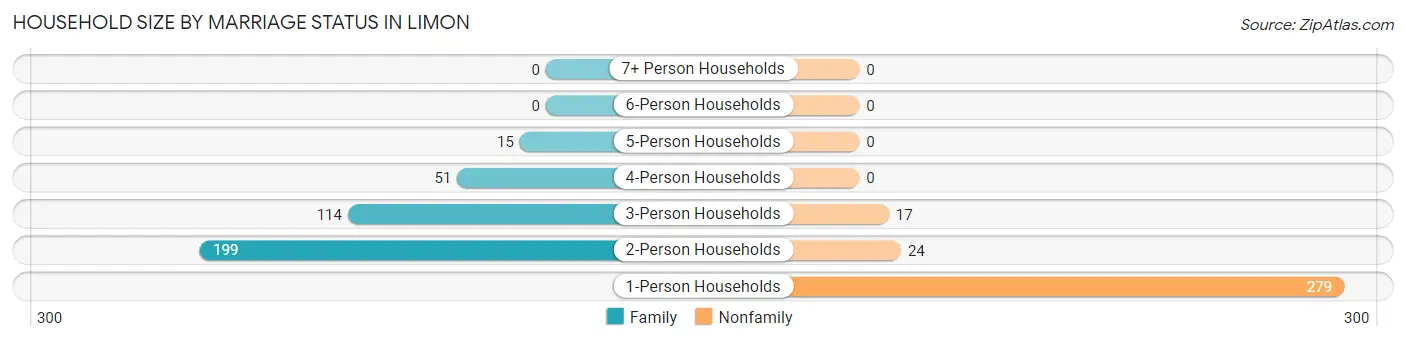
| Household Size | Family Households | Nonfamily Households |
| 1-Person Households | - | 279 (39.9%) |
| 2-Person Households | 199 (28.5%) | 24 (3.4%) |
| 3-Person Households | 114 (16.3%) | 17 (2.4%) |
| 4-Person Households | 51 (7.3%) | 0 (0.0%) |
| 5-Person Households | 15 (2.1%) | 0 (0.0%) |
| 6-Person Households | 0 (0.0%) | 0 (0.0%) |
| 7+ Person Households | 0 (0.0%) | 0 (0.0%) |
| Total | 379 (54.2%) | 320 (45.8%) |
Female Fertility in Limon
Fertility by Age in Limon
| Age Bracket | Women with Births | Births / 1,000 Women |
| 15 to 19 years | 0 (0.0%) | 0.0 |
| 20 to 34 years | 0 (0.0%) | 0.0 |
| 35 to 50 years | 0 (0.0%) | 0.0 |
| Total | 0 (0.0%) | 0.0 |
Fertility by Age by Marriage Status in Limon
| Age Bracket | Married | Unmarried |
| 15 to 19 years | 0 (0.0%) | 0 (0.0%) |
| 20 to 34 years | 0 (0.0%) | 0 (0.0%) |
| 35 to 50 years | 0 (0.0%) | 0 (0.0%) |
| Total | 0 (0.0%) | 0 (0.0%) |
Fertility by Education in Limon
| Educational Attainment | Women with Births | Births / 1,000 Women |
| Less than High School | 0 (0.0%) | 0.0 |
| High School Diploma | 0 (0.0%) | 0.0 |
| College or Associate's Degree | 0 (0.0%) | 0.0 |
| Bachelor's Degree | 0 (0.0%) | 0.0 |
| Graduate Degree | 0 (0.0%) | 0.0 |
| Total | 0 (0.0%) | 0.0 |
Fertility by Education by Marriage Status in Limon
| Educational Attainment | Married | Unmarried |
| Less than High School | 0 (0.0%) | 0 (0.0%) |
| High School Diploma | 0 (0.0%) | 0 (0.0%) |
| College or Associate's Degree | 0 (0.0%) | 0 (0.0%) |
| Bachelor's Degree | 0 (0.0%) | 0 (0.0%) |
| Graduate Degree | 0 (0.0%) | 0 (0.0%) |
| Total | 0 (0.0%) | 0 (0.0%) |
Employment Characteristics in Limon
Employment by Class of Employer in Limon
Among the 825 employed individuals in Limon, private company employees (502 | 60.9%), state government employees (124 | 15.0%), and self-employed (not incorporated) (67 | 8.1%) make up the most common classes of employment.
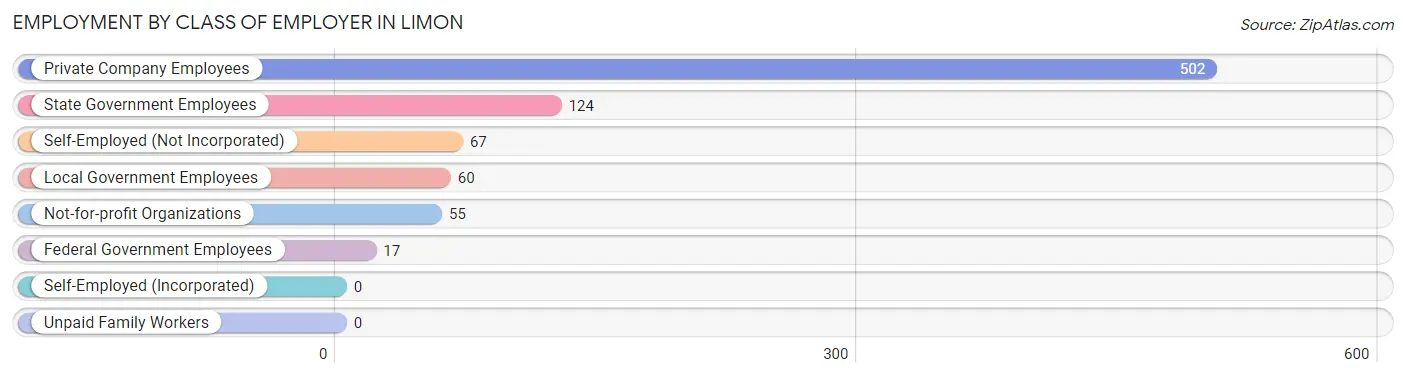
| Employer Class | # Employees | % Employees |
| Private Company Employees | 502 | 60.9% |
| Self-Employed (Incorporated) | 0 | 0.0% |
| Self-Employed (Not Incorporated) | 67 | 8.1% |
| Not-for-profit Organizations | 55 | 6.7% |
| Local Government Employees | 60 | 7.3% |
| State Government Employees | 124 | 15.0% |
| Federal Government Employees | 17 | 2.1% |
| Unpaid Family Workers | 0 | 0.0% |
| Total | 825 | 100.0% |
Employment Status by Age in Limon
According to the labor force statistics for Limon, out of the total population over 16 years of age (1,297), 65.7% or 852 individuals are in the labor force, with 1.9% or 16 of them unemployed. The age group with the highest labor force participation rate is 20 to 24 years, with 100.0% or 89 individuals in the labor force. Within the labor force, the 60 to 64 years age range has the highest percentage of unemployed individuals, with 13.7% or 16 of them being unemployed.
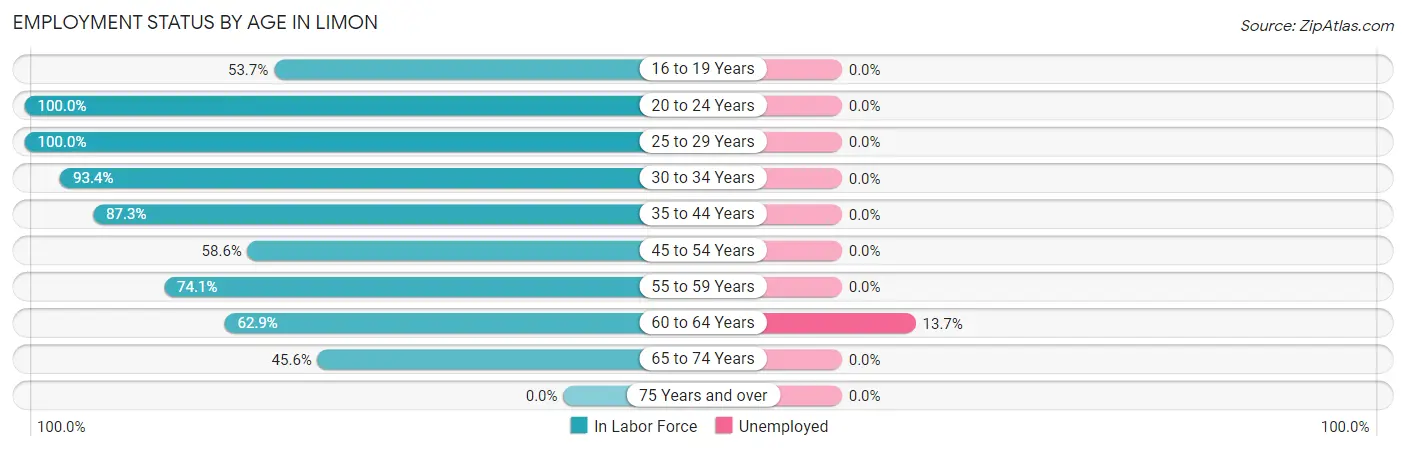
| Age Bracket | In Labor Force | Unemployed |
| 16 to 19 Years | 29 (53.7%) | 0 (0.0%) |
| 20 to 24 Years | 89 (100.0%) | 0 (0.0%) |
| 25 to 29 Years | 137 (100.0%) | 0 (0.0%) |
| 30 to 34 Years | 113 (93.4%) | 0 (0.0%) |
| 35 to 44 Years | 117 (87.3%) | 0 (0.0%) |
| 45 to 54 Years | 78 (58.6%) | 0 (0.0%) |
| 55 to 59 Years | 83 (74.1%) | 0 (0.0%) |
| 60 to 64 Years | 117 (62.9%) | 16 (13.7%) |
| 65 to 74 Years | 89 (45.6%) | 0 (0.0%) |
| 75 Years and over | 0 (0.0%) | 0 (0.0%) |
| Total | 852 (65.7%) | 16 (1.9%) |
Employment Status by Educational Attainment in Limon
According to labor force statistics for Limon, 78.4% of individuals (645) out of the total population between 25 and 64 years of age (823) are in the labor force, with 2.5% or 16 of them being unemployed. The group with the highest labor force participation rate are those with the educational attainment of less than high school, with 96.9% or 31 individuals in the labor force. Within the labor force, individuals with college / associate degree education have the highest percentage of unemployment, with 8.0% or 16 of them being unemployed.
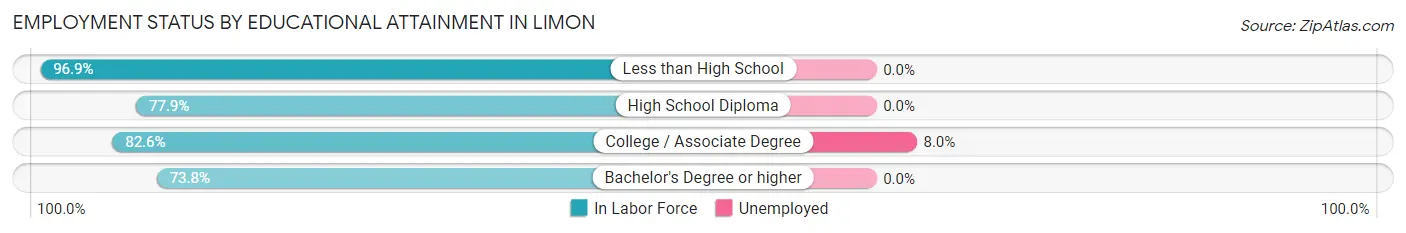
| Educational Attainment | In Labor Force | Unemployed |
| Less than High School | 31 (96.9%) | 0 (0.0%) |
| High School Diploma | 173 (77.9%) | 0 (0.0%) |
| College / Associate Degree | 199 (82.6%) | 19 (8.0%) |
| Bachelor's Degree or higher | 242 (73.8%) | 0 (0.0%) |
| Total | 645 (78.4%) | 21 (2.5%) |
Employment Occupations by Sex in Limon
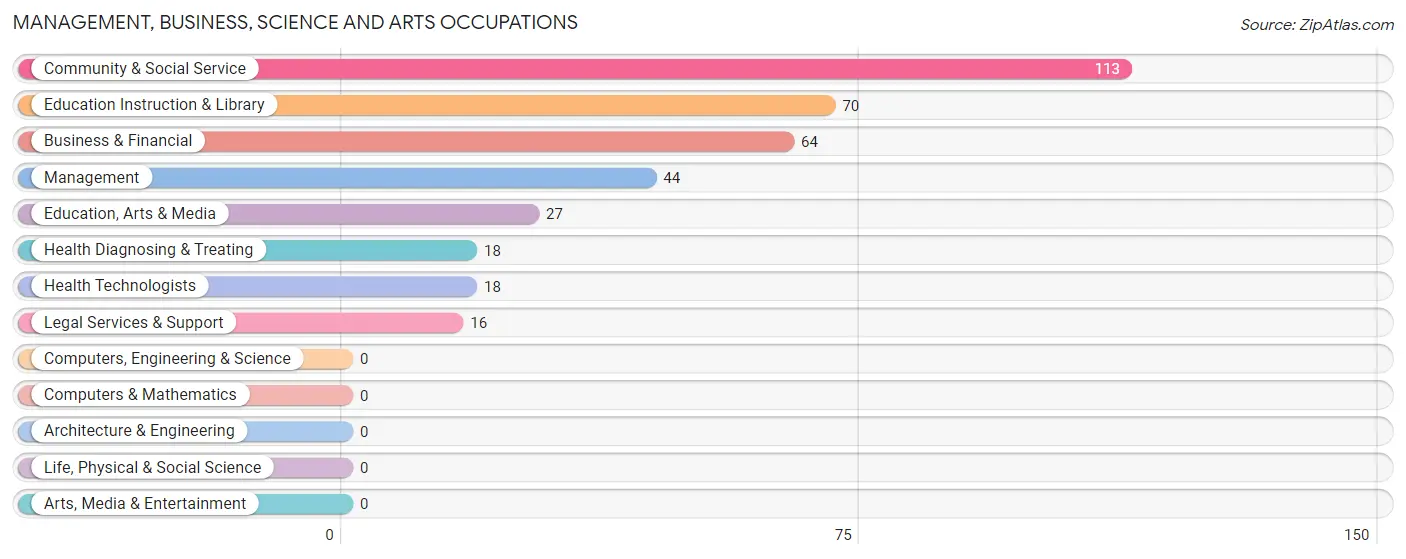
Management, Business, Science and Arts Occupations
The most common Management, Business, Science and Arts occupations in Limon are Community & Social Service (113 | 13.8%), Education Instruction & Library (70 | 8.6%), Business & Financial (64 | 7.8%), Management (44 | 5.4%), and Education, Arts & Media (27 | 3.3%).
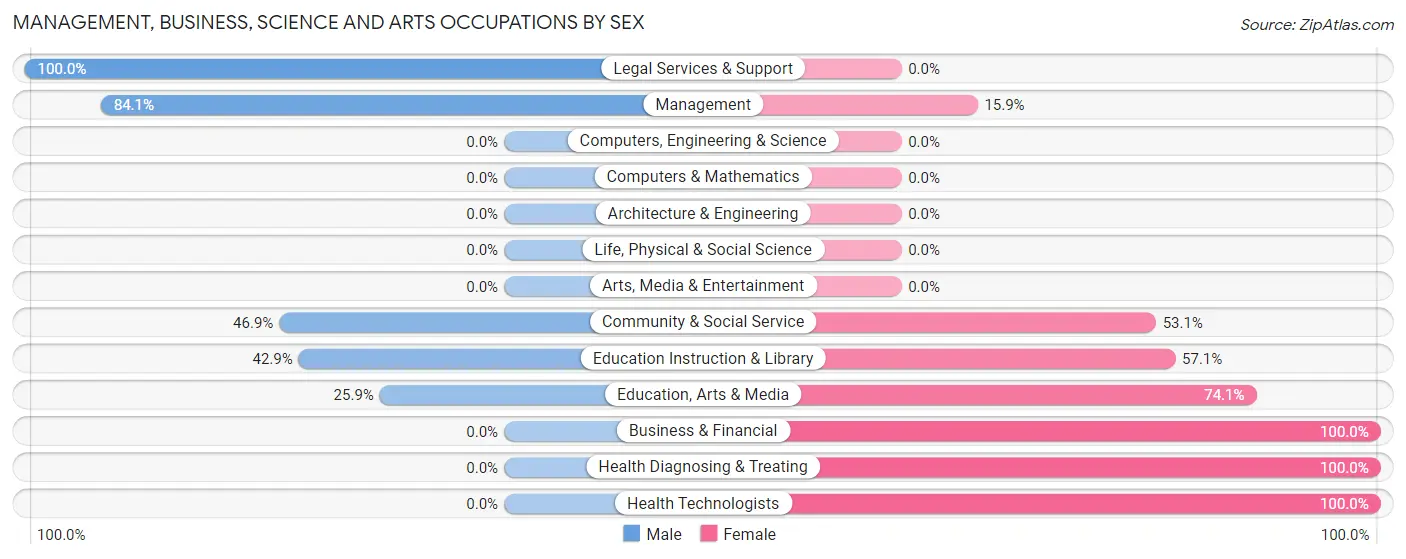
Management, Business, Science and Arts Occupations by Sex
Within the Management, Business, Science and Arts occupations in Limon, the most male-oriented occupations are Legal Services & Support (100.0%), Management (84.1%), and Community & Social Service (46.9%), while the most female-oriented occupations are Business & Financial (100.0%), Health Diagnosing & Treating (100.0%), and Health Technologists (100.0%).
| Occupation | Male | Female |
| Management | 37 (84.1%) | 7 (15.9%) |
| Business & Financial | 0 (0.0%) | 64 (100.0%) |
| Computers, Engineering & Science | 0 (0.0%) | 0 (0.0%) |
| Computers & Mathematics | 0 (0.0%) | 0 (0.0%) |
| Architecture & Engineering | 0 (0.0%) | 0 (0.0%) |
| Life, Physical & Social Science | 0 (0.0%) | 0 (0.0%) |
| Community & Social Service | 53 (46.9%) | 60 (53.1%) |
| Education, Arts & Media | 7 (25.9%) | 20 (74.1%) |
| Legal Services & Support | 16 (100.0%) | 0 (0.0%) |
| Education Instruction & Library | 30 (42.9%) | 40 (57.1%) |
| Arts, Media & Entertainment | 0 (0.0%) | 0 (0.0%) |
| Health Diagnosing & Treating | 0 (0.0%) | 18 (100.0%) |
| Health Technologists | 0 (0.0%) | 18 (100.0%) |
| Total (Category) | 90 (37.7%) | 149 (62.3%) |
| Total (Overall) | 440 (53.7%) | 379 (46.3%) |
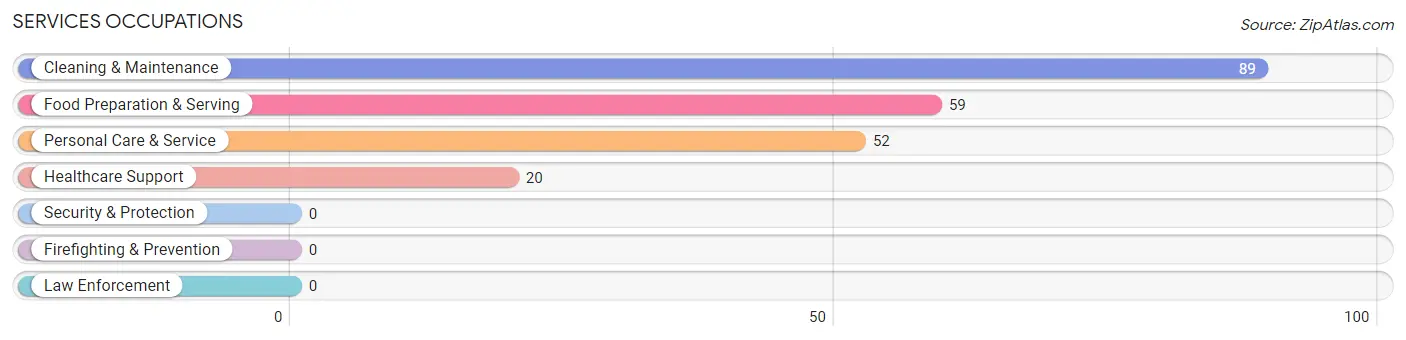
Services Occupations
The most common Services occupations in Limon are Cleaning & Maintenance (89 | 10.9%), Food Preparation & Serving (59 | 7.2%), Personal Care & Service (52 | 6.4%), and Healthcare Support (20 | 2.4%).
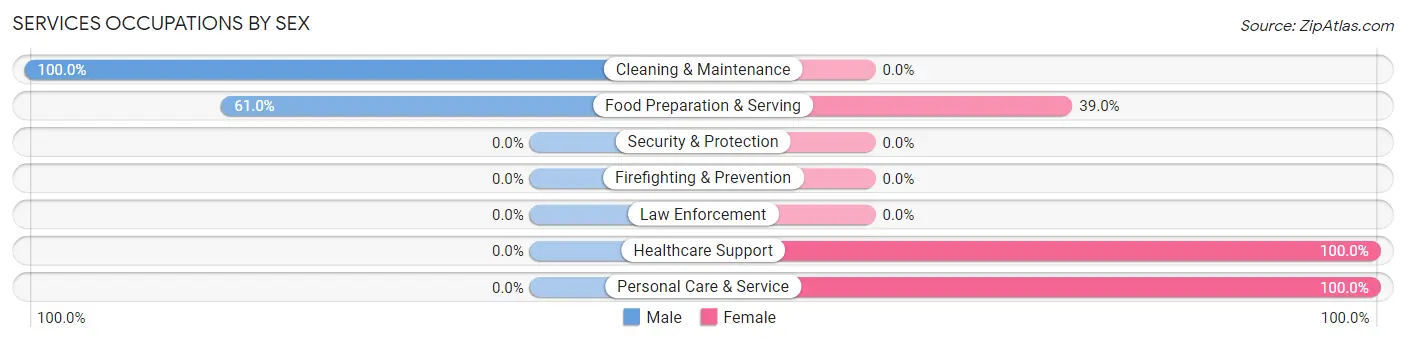
Services Occupations by Sex
Within the Services occupations in Limon, the most male-oriented occupations are Cleaning & Maintenance (100.0%), and Food Preparation & Serving (61.0%), while the most female-oriented occupations are Healthcare Support (100.0%), Personal Care & Service (100.0%), and Food Preparation & Serving (39.0%).
| Occupation | Male | Female |
| Healthcare Support | 0 (0.0%) | 20 (100.0%) |
| Security & Protection | 0 (0.0%) | 0 (0.0%) |
| Firefighting & Prevention | 0 (0.0%) | 0 (0.0%) |
| Law Enforcement | 0 (0.0%) | 0 (0.0%) |
| Food Preparation & Serving | 36 (61.0%) | 23 (39.0%) |
| Cleaning & Maintenance | 89 (100.0%) | 0 (0.0%) |
| Personal Care & Service | 0 (0.0%) | 52 (100.0%) |
| Total (Category) | 125 (56.8%) | 95 (43.2%) |
| Total (Overall) | 440 (53.7%) | 379 (46.3%) |
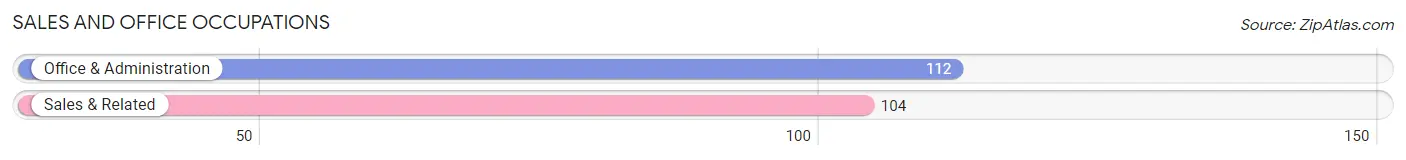
Sales and Office Occupations
The most common Sales and Office occupations in Limon are Office & Administration (112 | 13.7%), and Sales & Related (104 | 12.7%).
Sales and Office Occupations by Sex
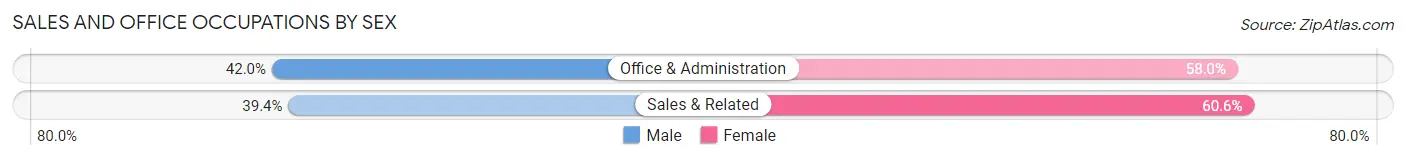
| Occupation | Male | Female |
| Sales & Related | 41 (39.4%) | 63 (60.6%) |
| Office & Administration | 47 (42.0%) | 65 (58.0%) |
| Total (Category) | 88 (40.7%) | 128 (59.3%) |
| Total (Overall) | 440 (53.7%) | 379 (46.3%) |
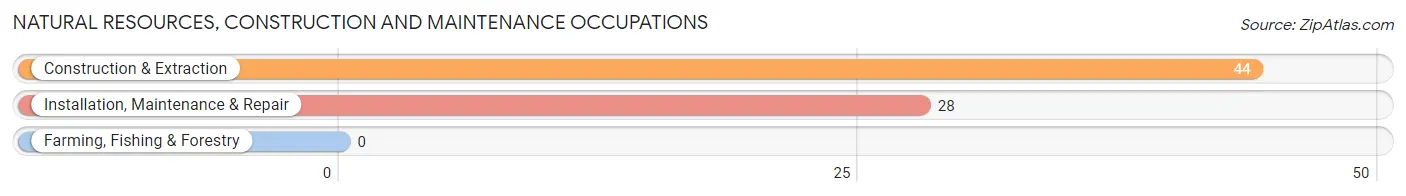
Natural Resources, Construction and Maintenance Occupations
The most common Natural Resources, Construction and Maintenance occupations in Limon are Construction & Extraction (44 | 5.4%), and Installation, Maintenance & Repair (28 | 3.4%).
Natural Resources, Construction and Maintenance Occupations by Sex
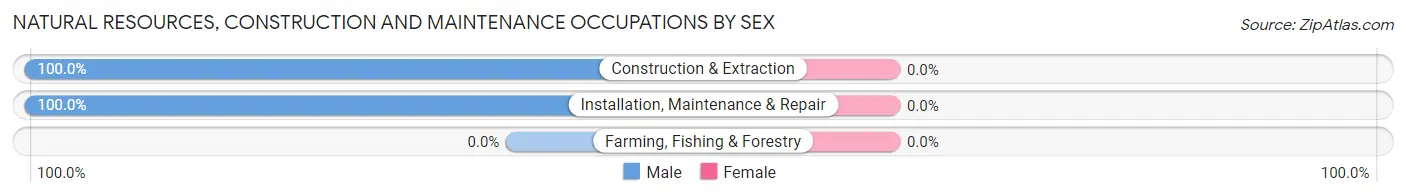
| Occupation | Male | Female |
| Farming, Fishing & Forestry | 0 (0.0%) | 0 (0.0%) |
| Construction & Extraction | 44 (100.0%) | 0 (0.0%) |
| Installation, Maintenance & Repair | 28 (100.0%) | 0 (0.0%) |
| Total (Category) | 72 (100.0%) | 0 (0.0%) |
| Total (Overall) | 440 (53.7%) | 379 (46.3%) |
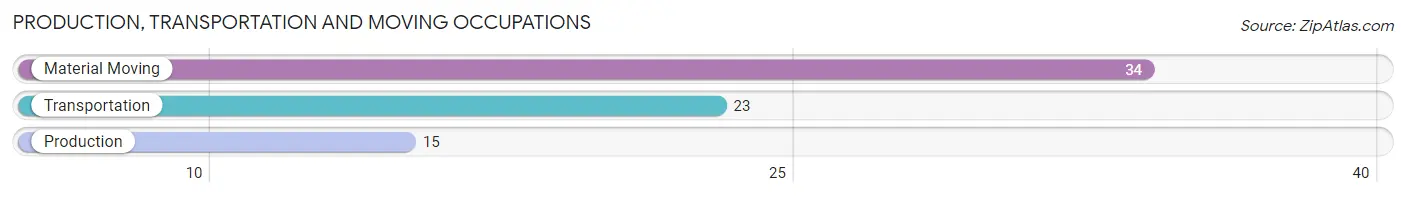
Production, Transportation and Moving Occupations
The most common Production, Transportation and Moving occupations in Limon are Material Moving (34 | 4.2%), Transportation (23 | 2.8%), and Production (15 | 1.8%).
Production, Transportation and Moving Occupations by Sex
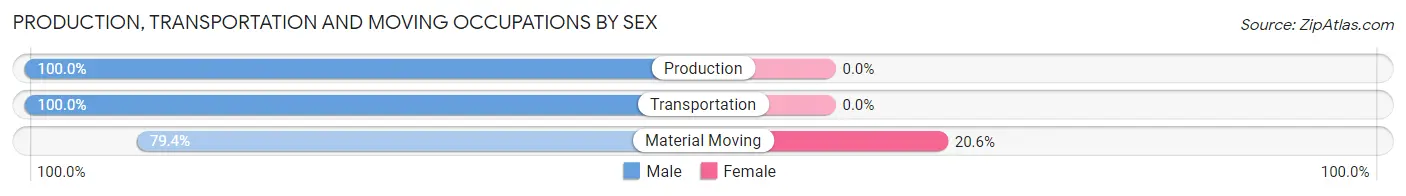
| Occupation | Male | Female |
| Production | 15 (100.0%) | 0 (0.0%) |
| Transportation | 23 (100.0%) | 0 (0.0%) |
| Material Moving | 27 (79.4%) | 7 (20.6%) |
| Total (Category) | 65 (90.3%) | 7 (9.7%) |
| Total (Overall) | 440 (53.7%) | 379 (46.3%) |
Employment Industries by Sex in Limon
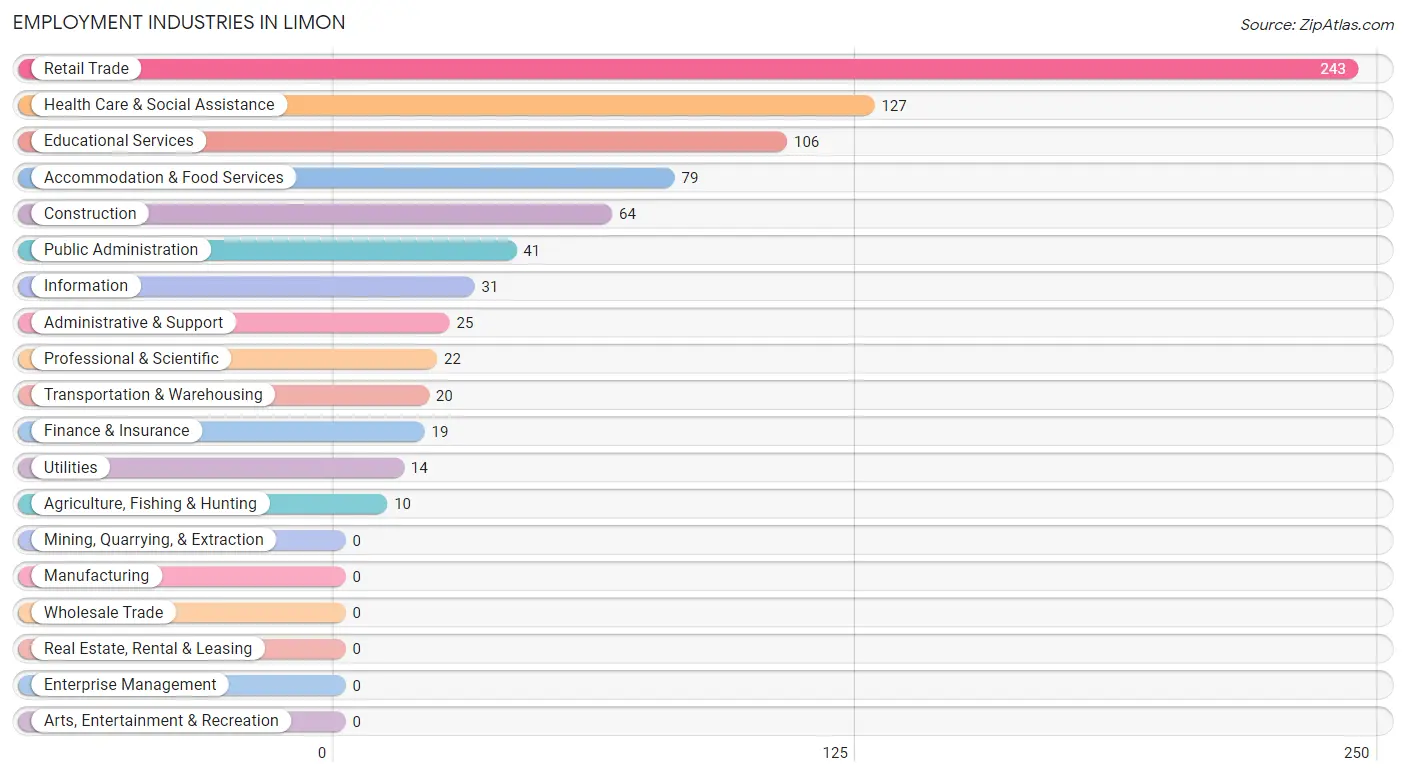
Employment Industries in Limon
The major employment industries in Limon include Retail Trade (243 | 29.7%), Health Care & Social Assistance (127 | 15.5%), Educational Services (106 | 12.9%), Accommodation & Food Services (79 | 9.7%), and Construction (64 | 7.8%).
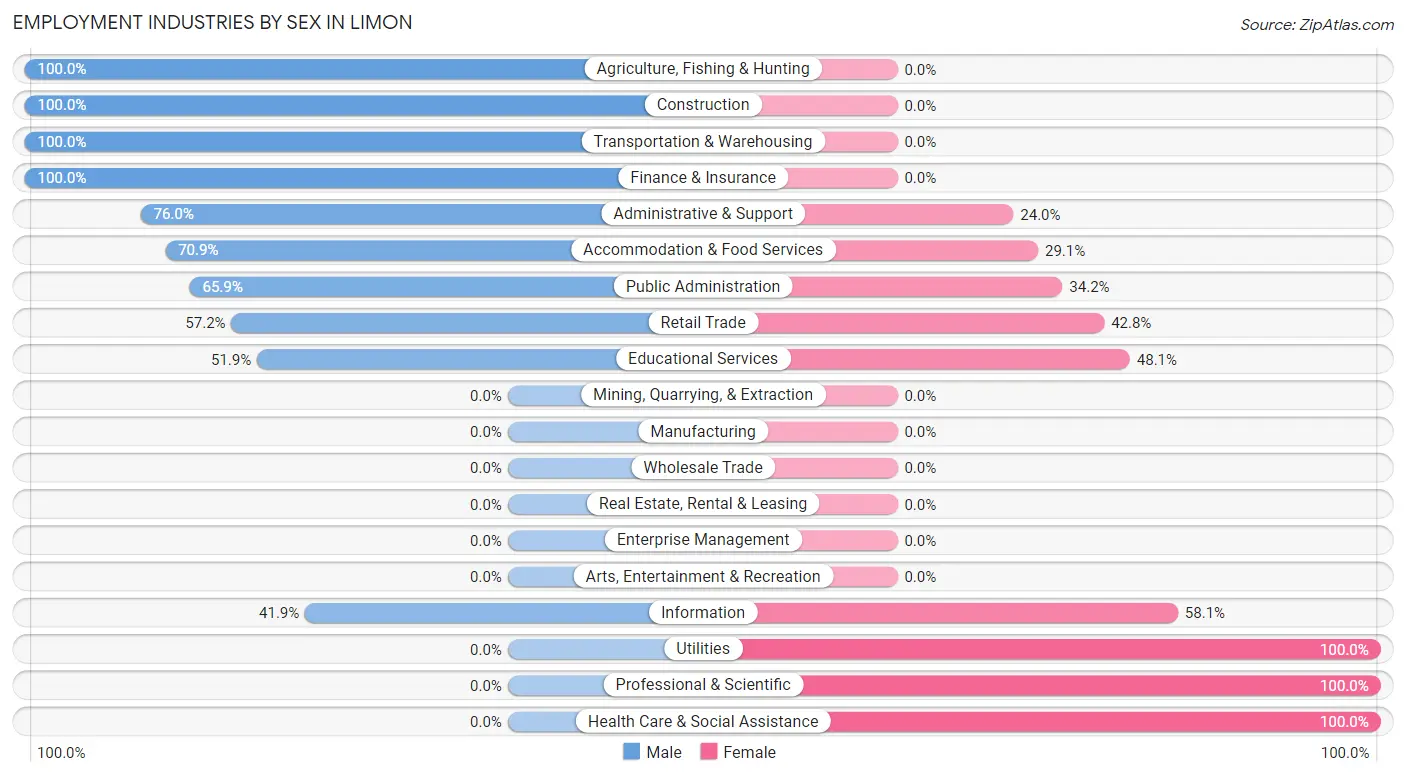
Employment Industries by Sex in Limon
The Limon industries that see more men than women are Agriculture, Fishing & Hunting (100.0%), Construction (100.0%), and Transportation & Warehousing (100.0%), whereas the industries that tend to have a higher number of women are Utilities (100.0%), Professional & Scientific (100.0%), and Health Care & Social Assistance (100.0%).
| Industry | Male | Female |
| Agriculture, Fishing & Hunting | 10 (100.0%) | 0 (0.0%) |
| Mining, Quarrying, & Extraction | 0 (0.0%) | 0 (0.0%) |
| Construction | 64 (100.0%) | 0 (0.0%) |
| Manufacturing | 0 (0.0%) | 0 (0.0%) |
| Wholesale Trade | 0 (0.0%) | 0 (0.0%) |
| Retail Trade | 139 (57.2%) | 104 (42.8%) |
| Transportation & Warehousing | 20 (100.0%) | 0 (0.0%) |
| Utilities | 0 (0.0%) | 14 (100.0%) |
| Information | 13 (41.9%) | 18 (58.1%) |
| Finance & Insurance | 19 (100.0%) | 0 (0.0%) |
| Real Estate, Rental & Leasing | 0 (0.0%) | 0 (0.0%) |
| Professional & Scientific | 0 (0.0%) | 22 (100.0%) |
| Enterprise Management | 0 (0.0%) | 0 (0.0%) |
| Administrative & Support | 19 (76.0%) | 6 (24.0%) |
| Educational Services | 55 (51.9%) | 51 (48.1%) |
| Health Care & Social Assistance | 0 (0.0%) | 127 (100.0%) |
| Arts, Entertainment & Recreation | 0 (0.0%) | 0 (0.0%) |
| Accommodation & Food Services | 56 (70.9%) | 23 (29.1%) |
| Public Administration | 27 (65.8%) | 14 (34.2%) |
| Total | 440 (53.7%) | 379 (46.3%) |
Education in Limon
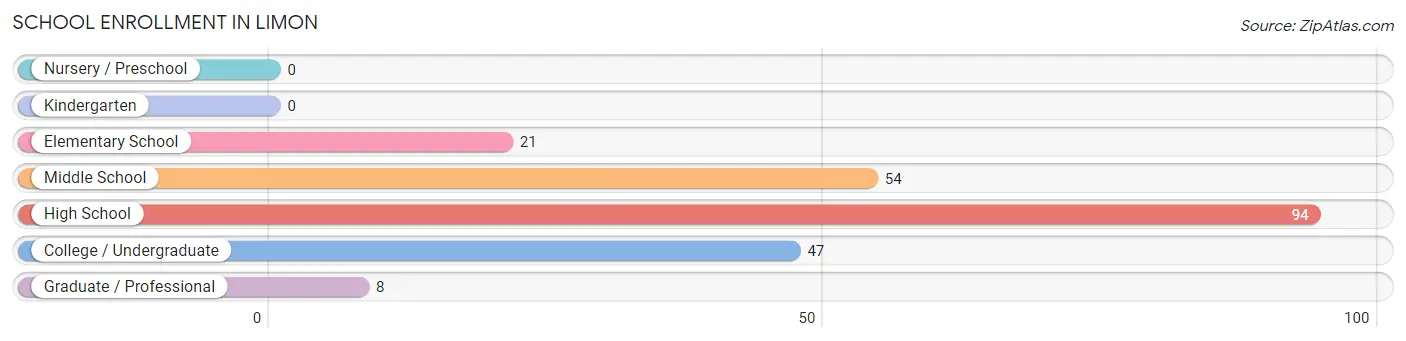
School Enrollment in Limon
The most common levels of schooling among the 224 students in Limon are high school (94 | 42.0%), middle school (54 | 24.1%), and college / undergraduate (47 | 21.0%).
| School Level | # Students | % Students |
| Nursery / Preschool | 0 | 0.0% |
| Kindergarten | 0 | 0.0% |
| Elementary School | 21 | 9.4% |
| Middle School | 54 | 24.1% |
| High School | 94 | 42.0% |
| College / Undergraduate | 47 | 21.0% |
| Graduate / Professional | 8 | 3.6% |
| Total | 224 | 100.0% |
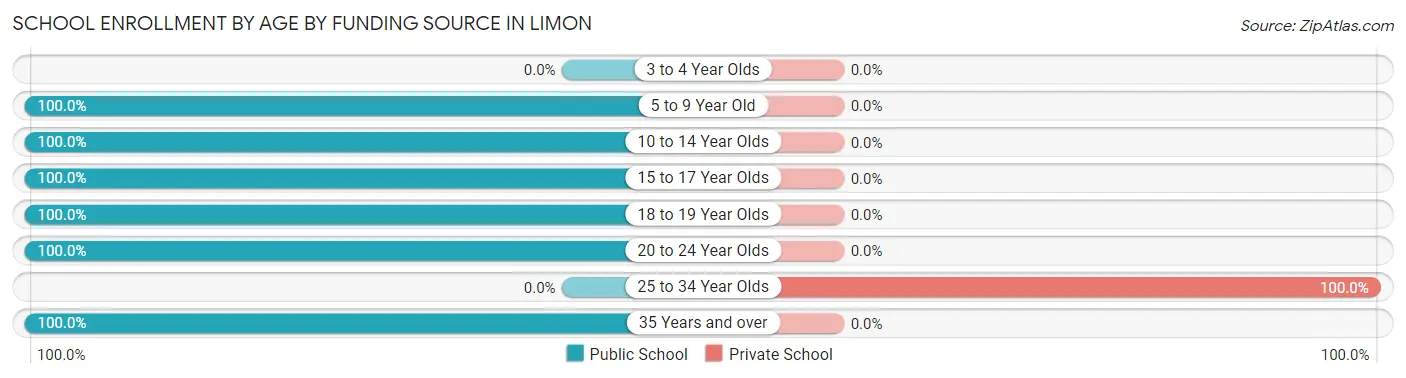
School Enrollment by Age by Funding Source in Limon
Out of a total of 224 students who are enrolled in schools in Limon, 16 (7.1%) attend a private institution, while the remaining 208 (92.9%) are enrolled in public schools. The age group of 25 to 34 year olds has the highest likelihood of being enrolled in private schools, with 16 (100.0% in the age bracket) enrolled. Conversely, the age group of 5 to 9 year old has the lowest likelihood of being enrolled in a private school, with 21 (100.0% in the age bracket) attending a public institution.
| Age Bracket | Public School | Private School |
| 3 to 4 Year Olds | 0 (0.0%) | 0 (0.0%) |
| 5 to 9 Year Old | 21 (100.0%) | 0 (0.0%) |
| 10 to 14 Year Olds | 75 (100.0%) | 0 (0.0%) |
| 15 to 17 Year Olds | 37 (100.0%) | 0 (0.0%) |
| 18 to 19 Year Olds | 36 (100.0%) | 0 (0.0%) |
| 20 to 24 Year Olds | 20 (100.0%) | 0 (0.0%) |
| 25 to 34 Year Olds | 0 (0.0%) | 16 (100.0%) |
| 35 Years and over | 19 (100.0%) | 0 (0.0%) |
| Total | 208 (92.9%) | 16 (7.1%) |
Educational Attainment by Field of Study in Limon
Education (125 | 28.8%), engineering (76 | 17.5%), business (60 | 13.8%), science & technology (43 | 9.9%), and arts & humanities (36 | 8.3%) are the most common fields of study among 434 individuals in Limon who have obtained a bachelor's degree or higher.
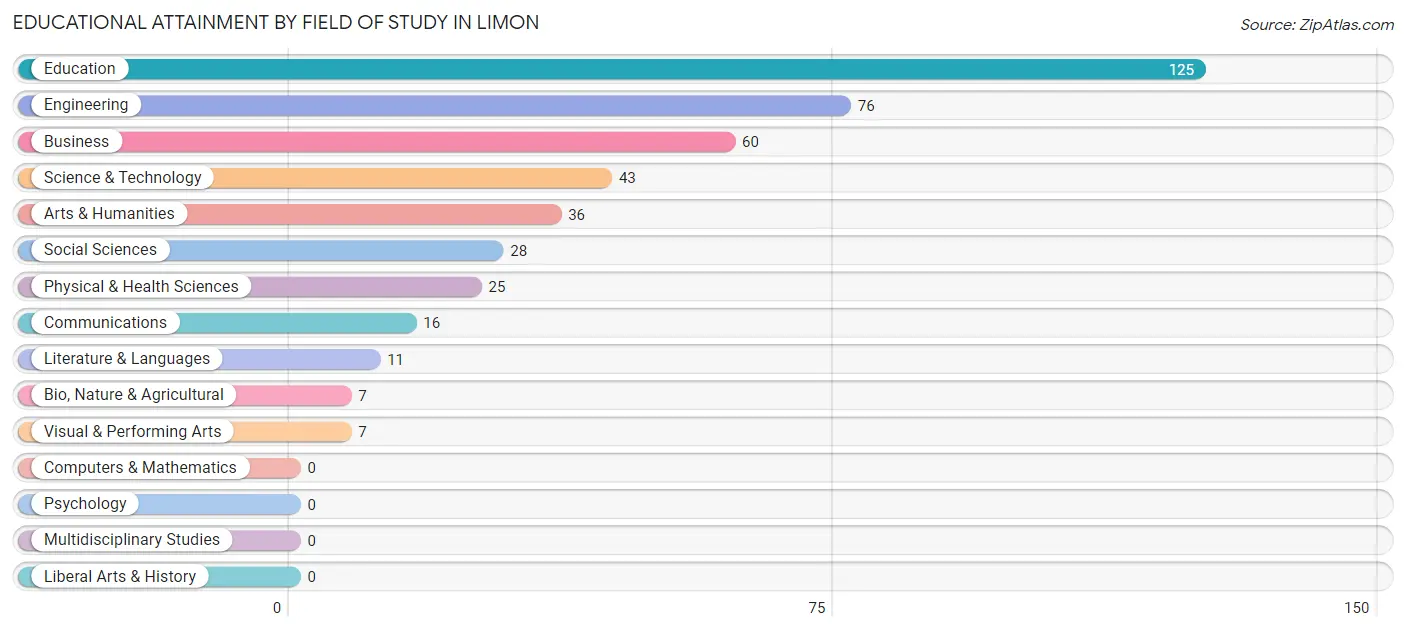
| Field of Study | # Graduates | % Graduates |
| Computers & Mathematics | 0 | 0.0% |
| Bio, Nature & Agricultural | 7 | 1.6% |
| Physical & Health Sciences | 25 | 5.8% |
| Psychology | 0 | 0.0% |
| Social Sciences | 28 | 6.5% |
| Engineering | 76 | 17.5% |
| Multidisciplinary Studies | 0 | 0.0% |
| Science & Technology | 43 | 9.9% |
| Business | 60 | 13.8% |
| Education | 125 | 28.8% |
| Literature & Languages | 11 | 2.5% |
| Liberal Arts & History | 0 | 0.0% |
| Visual & Performing Arts | 7 | 1.6% |
| Communications | 16 | 3.7% |
| Arts & Humanities | 36 | 8.3% |
| Total | 434 | 100.0% |
Transportation & Commute in Limon
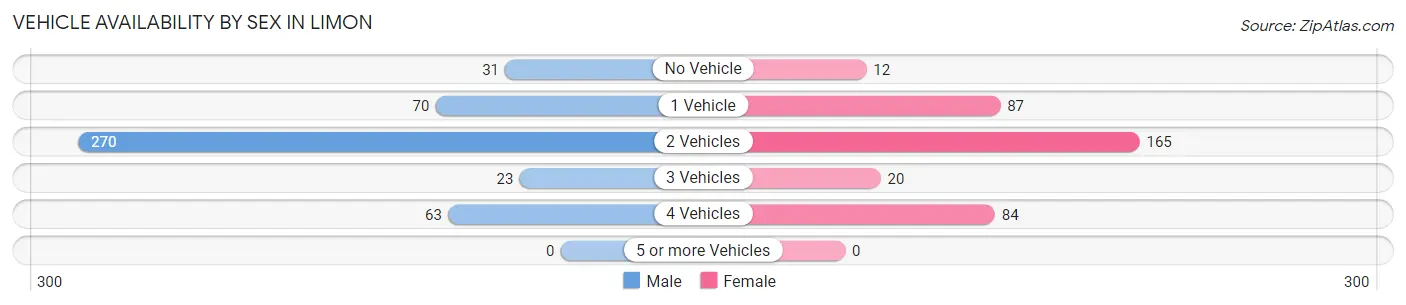
Vehicle Availability by Sex in Limon
The most prevalent vehicle ownership categories in Limon are males with 2 vehicles (270, accounting for 59.1%) and females with 2 vehicles (165, making up 73.4%).
| Vehicles Available | Male | Female |
| No Vehicle | 31 (6.8%) | 12 (3.3%) |
| 1 Vehicle | 70 (15.3%) | 87 (23.6%) |
| 2 Vehicles | 270 (59.1%) | 165 (44.8%) |
| 3 Vehicles | 23 (5.0%) | 20 (5.4%) |
| 4 Vehicles | 63 (13.8%) | 84 (22.8%) |
| 5 or more Vehicles | 0 (0.0%) | 0 (0.0%) |
| Total | 457 (100.0%) | 368 (100.0%) |
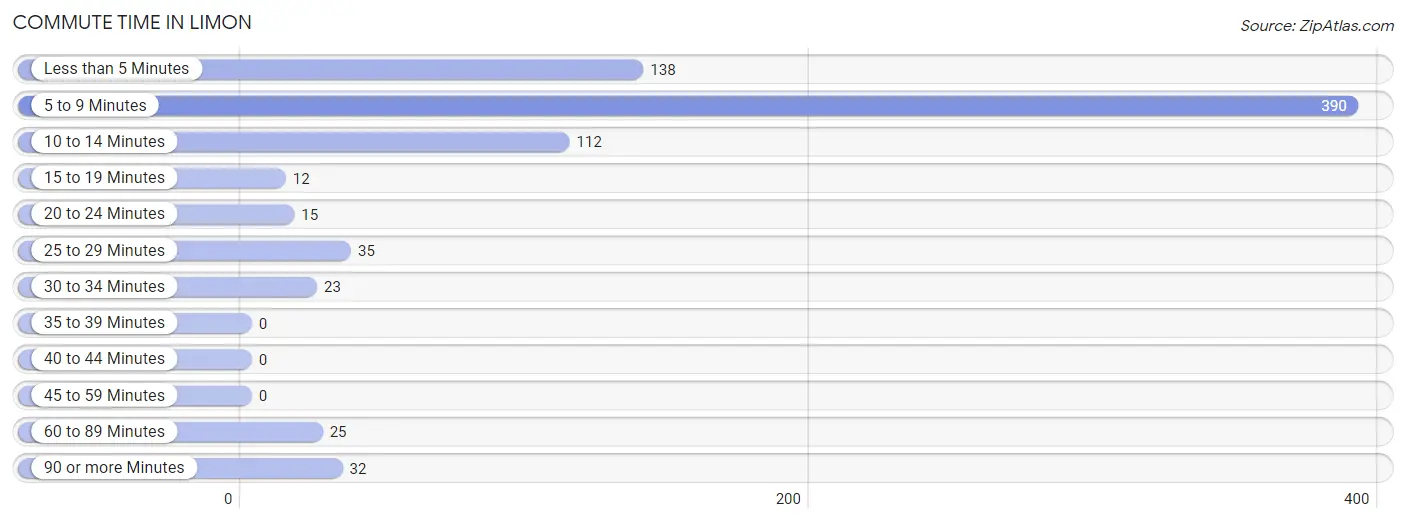
Commute Time in Limon
The most frequently occuring commute durations in Limon are 5 to 9 minutes (390 commuters, 49.9%), less than 5 minutes (138 commuters, 17.6%), and 10 to 14 minutes (112 commuters, 14.3%).
| Commute Time | # Commuters | % Commuters |
| Less than 5 Minutes | 138 | 17.6% |
| 5 to 9 Minutes | 390 | 49.9% |
| 10 to 14 Minutes | 112 | 14.3% |
| 15 to 19 Minutes | 12 | 1.5% |
| 20 to 24 Minutes | 15 | 1.9% |
| 25 to 29 Minutes | 35 | 4.5% |
| 30 to 34 Minutes | 23 | 2.9% |
| 35 to 39 Minutes | 0 | 0.0% |
| 40 to 44 Minutes | 0 | 0.0% |
| 45 to 59 Minutes | 0 | 0.0% |
| 60 to 89 Minutes | 25 | 3.2% |
| 90 or more Minutes | 32 | 4.1% |
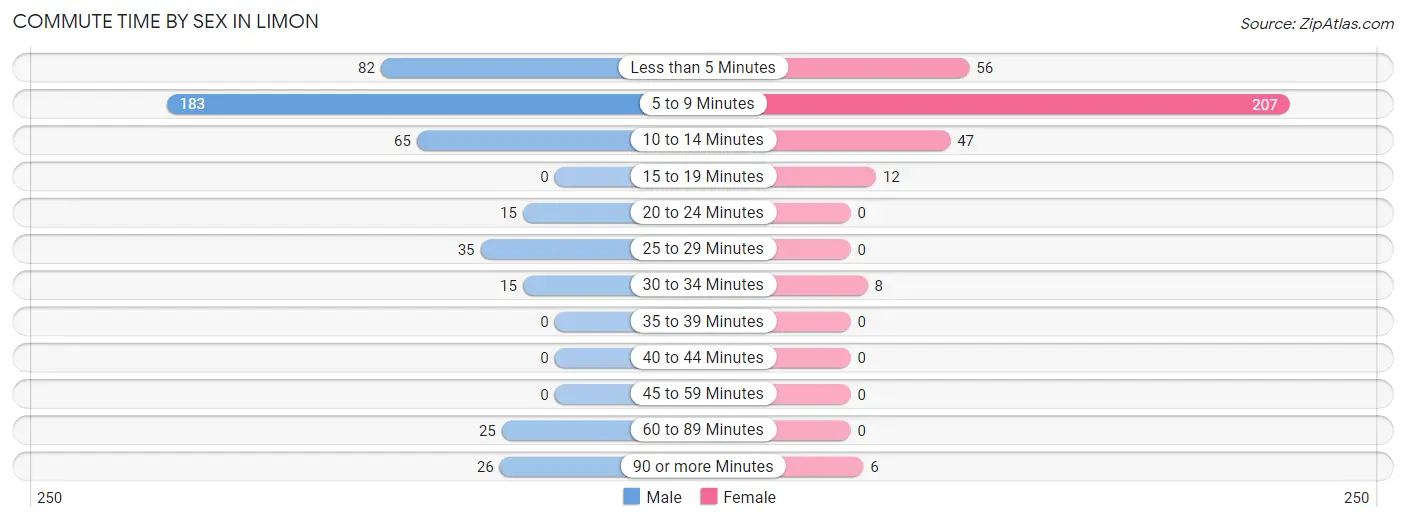
Commute Time by Sex in Limon
The most common commute times in Limon are 5 to 9 minutes (183 commuters, 41.0%) for males and 5 to 9 minutes (207 commuters, 61.6%) for females.
| Commute Time | Male | Female |
| Less than 5 Minutes | 82 (18.4%) | 56 (16.7%) |
| 5 to 9 Minutes | 183 (41.0%) | 207 (61.6%) |
| 10 to 14 Minutes | 65 (14.6%) | 47 (14.0%) |
| 15 to 19 Minutes | 0 (0.0%) | 12 (3.6%) |
| 20 to 24 Minutes | 15 (3.4%) | 0 (0.0%) |
| 25 to 29 Minutes | 35 (7.9%) | 0 (0.0%) |
| 30 to 34 Minutes | 15 (3.4%) | 8 (2.4%) |
| 35 to 39 Minutes | 0 (0.0%) | 0 (0.0%) |
| 40 to 44 Minutes | 0 (0.0%) | 0 (0.0%) |
| 45 to 59 Minutes | 0 (0.0%) | 0 (0.0%) |
| 60 to 89 Minutes | 25 (5.6%) | 0 (0.0%) |
| 90 or more Minutes | 26 (5.8%) | 6 (1.8%) |
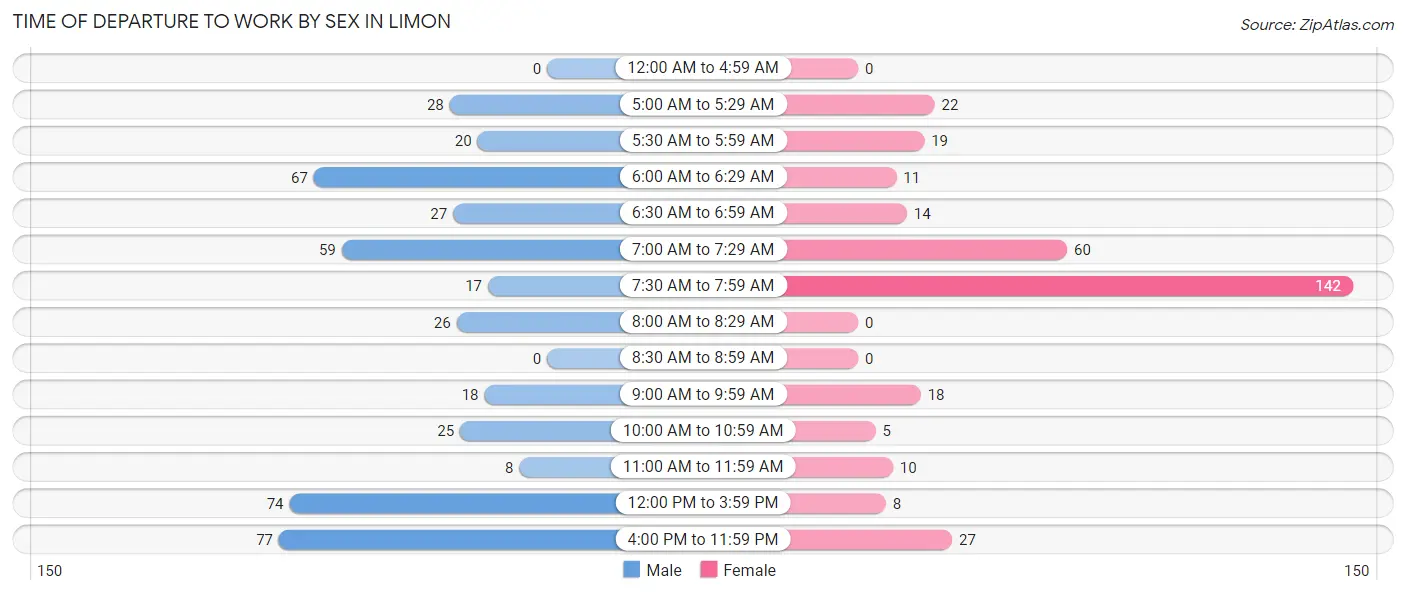
Time of Departure to Work by Sex in Limon
The most frequent times of departure to work in Limon are 4:00 PM to 11:59 PM (77, 17.3%) for males and 7:30 AM to 7:59 AM (142, 42.3%) for females.
| Time of Departure | Male | Female |
| 12:00 AM to 4:59 AM | 0 (0.0%) | 0 (0.0%) |
| 5:00 AM to 5:29 AM | 28 (6.3%) | 22 (6.6%) |
| 5:30 AM to 5:59 AM | 20 (4.5%) | 19 (5.7%) |
| 6:00 AM to 6:29 AM | 67 (15.0%) | 11 (3.3%) |
| 6:30 AM to 6:59 AM | 27 (6.0%) | 14 (4.2%) |
| 7:00 AM to 7:29 AM | 59 (13.2%) | 60 (17.9%) |
| 7:30 AM to 7:59 AM | 17 (3.8%) | 142 (42.3%) |
| 8:00 AM to 8:29 AM | 26 (5.8%) | 0 (0.0%) |
| 8:30 AM to 8:59 AM | 0 (0.0%) | 0 (0.0%) |
| 9:00 AM to 9:59 AM | 18 (4.0%) | 18 (5.4%) |
| 10:00 AM to 10:59 AM | 25 (5.6%) | 5 (1.5%) |
| 11:00 AM to 11:59 AM | 8 (1.8%) | 10 (3.0%) |
| 12:00 PM to 3:59 PM | 74 (16.6%) | 8 (2.4%) |
| 4:00 PM to 11:59 PM | 77 (17.3%) | 27 (8.0%) |
| Total | 446 (100.0%) | 336 (100.0%) |
Housing Occupancy in Limon
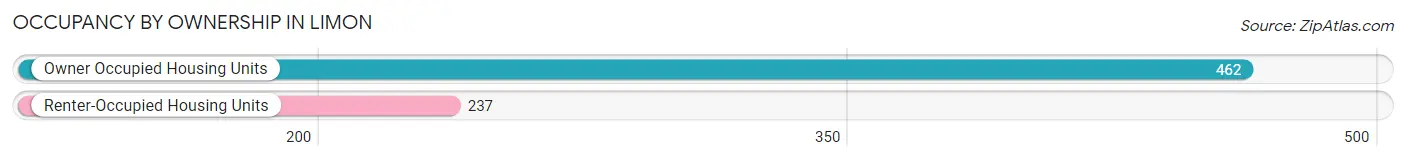
Occupancy by Ownership in Limon
Of the total 699 dwellings in Limon, owner-occupied units account for 462 (66.1%), while renter-occupied units make up 237 (33.9%).
| Occupancy | # Housing Units | % Housing Units |
| Owner Occupied Housing Units | 462 | 66.1% |
| Renter-Occupied Housing Units | 237 | 33.9% |
| Total Occupied Housing Units | 699 | 100.0% |
Occupancy by Household Size in Limon
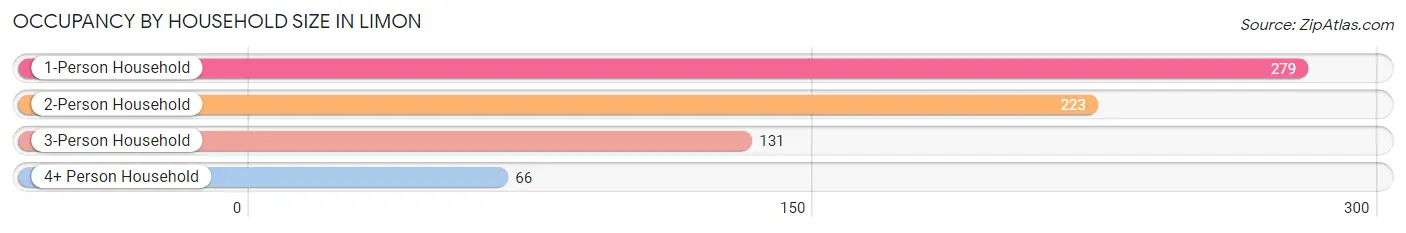
| Household Size | # Housing Units | % Housing Units |
| 1-Person Household | 279 | 39.9% |
| 2-Person Household | 223 | 31.9% |
| 3-Person Household | 131 | 18.7% |
| 4+ Person Household | 66 | 9.4% |
| Total Housing Units | 699 | 100.0% |
Occupancy by Ownership by Household Size in Limon
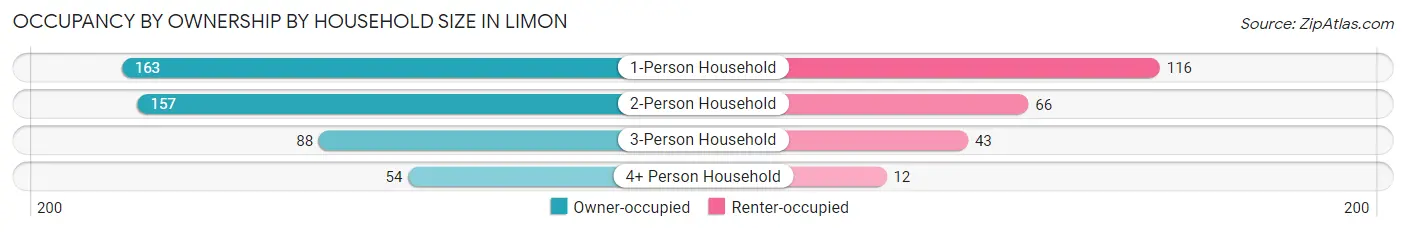
| Household Size | Owner-occupied | Renter-occupied |
| 1-Person Household | 163 (58.4%) | 116 (41.6%) |
| 2-Person Household | 157 (70.4%) | 66 (29.6%) |
| 3-Person Household | 88 (67.2%) | 43 (32.8%) |
| 4+ Person Household | 54 (81.8%) | 12 (18.2%) |
| Total Housing Units | 462 (66.1%) | 237 (33.9%) |
Occupancy by Educational Attainment in Limon
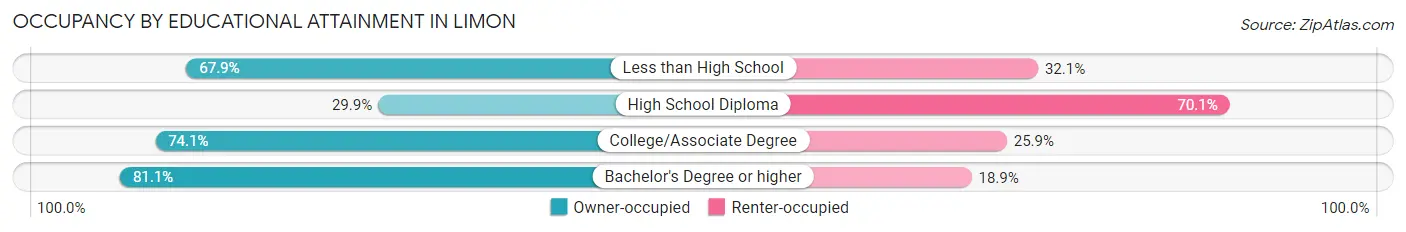
| Household Size | Owner-occupied | Renter-occupied |
| Less than High School | 36 (67.9%) | 17 (32.1%) |
| High School Diploma | 47 (29.9%) | 110 (70.1%) |
| College/Associate Degree | 186 (74.1%) | 65 (25.9%) |
| Bachelor's Degree or higher | 193 (81.1%) | 45 (18.9%) |
Occupancy by Age of Householder in Limon
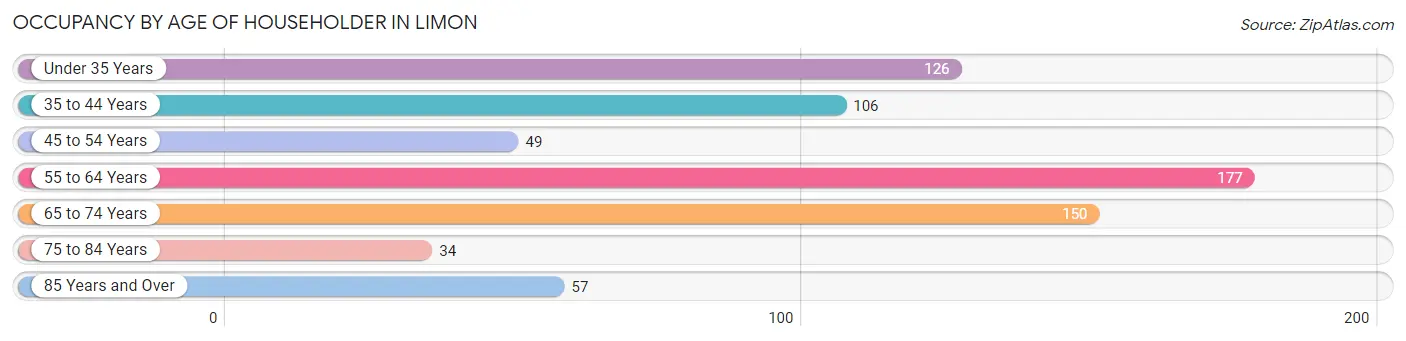
| Age Bracket | # Households | % Households |
| Under 35 Years | 126 | 18.0% |
| 35 to 44 Years | 106 | 15.2% |
| 45 to 54 Years | 49 | 7.0% |
| 55 to 64 Years | 177 | 25.3% |
| 65 to 74 Years | 150 | 21.5% |
| 75 to 84 Years | 34 | 4.9% |
| 85 Years and Over | 57 | 8.2% |
| Total | 699 | 100.0% |
Housing Finances in Limon
Median Income by Occupancy in Limon
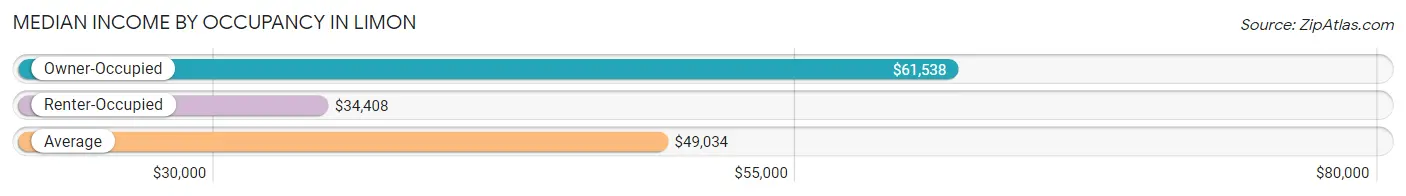
| Occupancy Type | # Households | Median Income |
| Owner-Occupied | 462 (66.1%) | $61,538 |
| Renter-Occupied | 237 (33.9%) | $34,408 |
| Average | 699 (100.0%) | $49,034 |
Occupancy by Householder Income Bracket in Limon
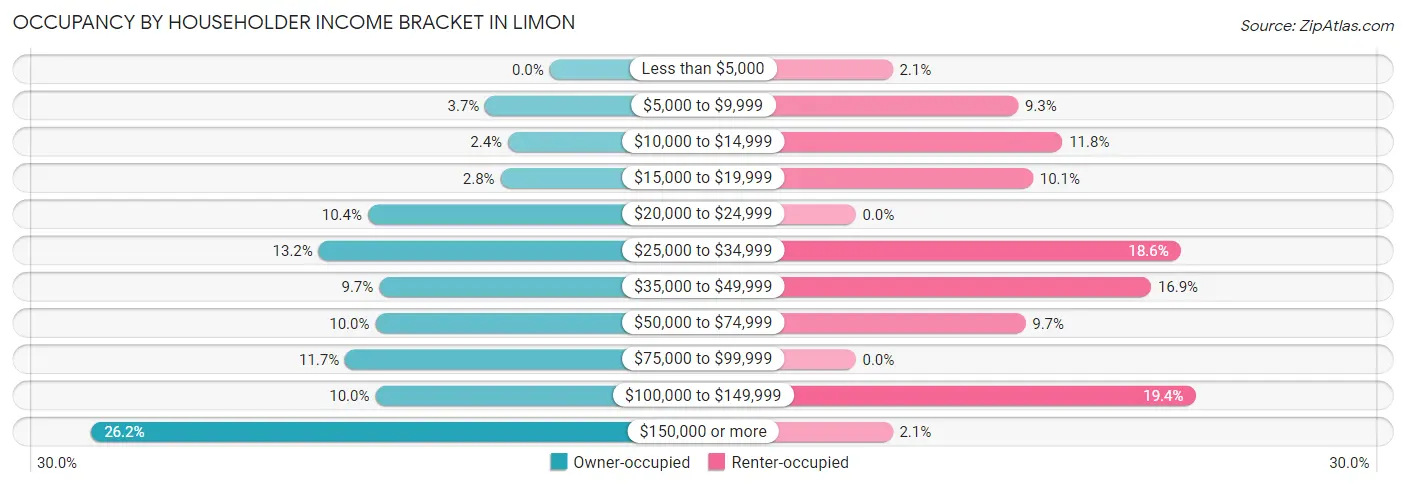
| Income Bracket | Owner-occupied | Renter-occupied |
| Less than $5,000 | 0 (0.0%) | 5 (2.1%) |
| $5,000 to $9,999 | 17 (3.7%) | 22 (9.3%) |
| $10,000 to $14,999 | 11 (2.4%) | 28 (11.8%) |
| $15,000 to $19,999 | 13 (2.8%) | 24 (10.1%) |
| $20,000 to $24,999 | 48 (10.4%) | 0 (0.0%) |
| $25,000 to $34,999 | 61 (13.2%) | 44 (18.6%) |
| $35,000 to $49,999 | 45 (9.7%) | 40 (16.9%) |
| $50,000 to $74,999 | 46 (10.0%) | 23 (9.7%) |
| $75,000 to $99,999 | 54 (11.7%) | 0 (0.0%) |
| $100,000 to $149,999 | 46 (10.0%) | 46 (19.4%) |
| $150,000 or more | 121 (26.2%) | 5 (2.1%) |
| Total | 462 (100.0%) | 237 (100.0%) |
Monthly Housing Cost Tiers in Limon
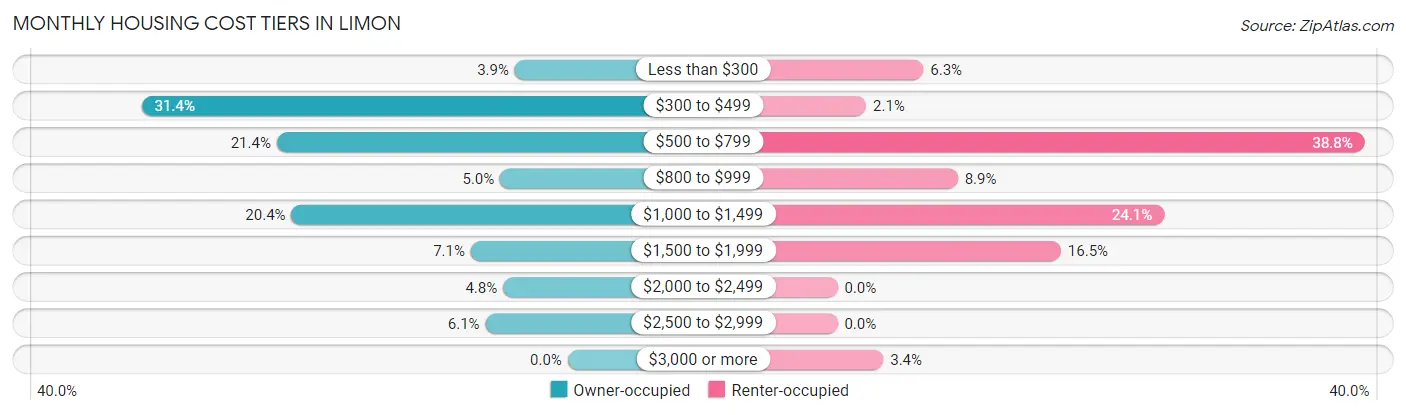
| Monthly Cost | Owner-occupied | Renter-occupied |
| Less than $300 | 18 (3.9%) | 15 (6.3%) |
| $300 to $499 | 145 (31.4%) | 5 (2.1%) |
| $500 to $799 | 99 (21.4%) | 92 (38.8%) |
| $800 to $999 | 23 (5.0%) | 21 (8.9%) |
| $1,000 to $1,499 | 94 (20.3%) | 57 (24.0%) |
| $1,500 to $1,999 | 33 (7.1%) | 39 (16.5%) |
| $2,000 to $2,499 | 22 (4.8%) | 0 (0.0%) |
| $2,500 to $2,999 | 28 (6.1%) | 0 (0.0%) |
| $3,000 or more | 0 (0.0%) | 8 (3.4%) |
| Total | 462 (100.0%) | 237 (100.0%) |
Physical Housing Characteristics in Limon
Housing Structures in Limon
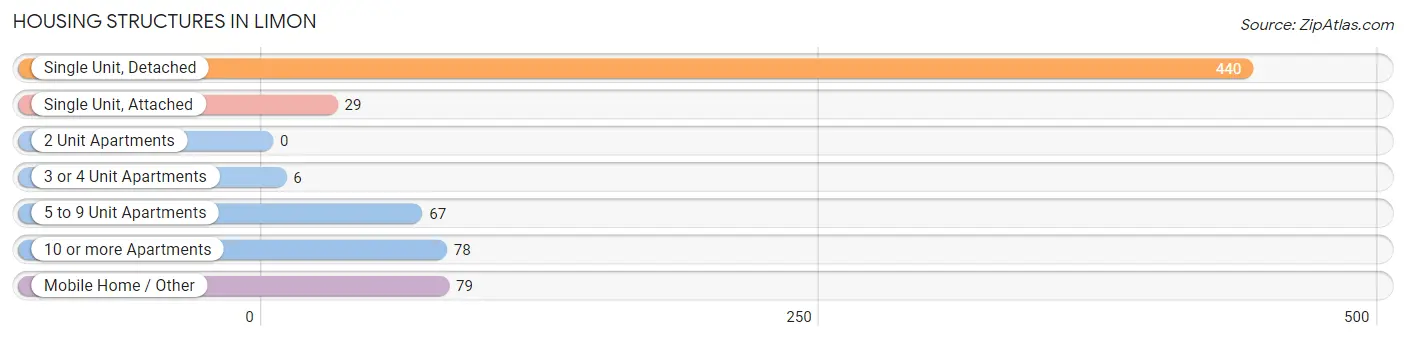
| Structure Type | # Housing Units | % Housing Units |
| Single Unit, Detached | 440 | 62.9% |
| Single Unit, Attached | 29 | 4.2% |
| 2 Unit Apartments | 0 | 0.0% |
| 3 or 4 Unit Apartments | 6 | 0.9% |
| 5 to 9 Unit Apartments | 67 | 9.6% |
| 10 or more Apartments | 78 | 11.2% |
| Mobile Home / Other | 79 | 11.3% |
| Total | 699 | 100.0% |
Housing Structures by Occupancy in Limon
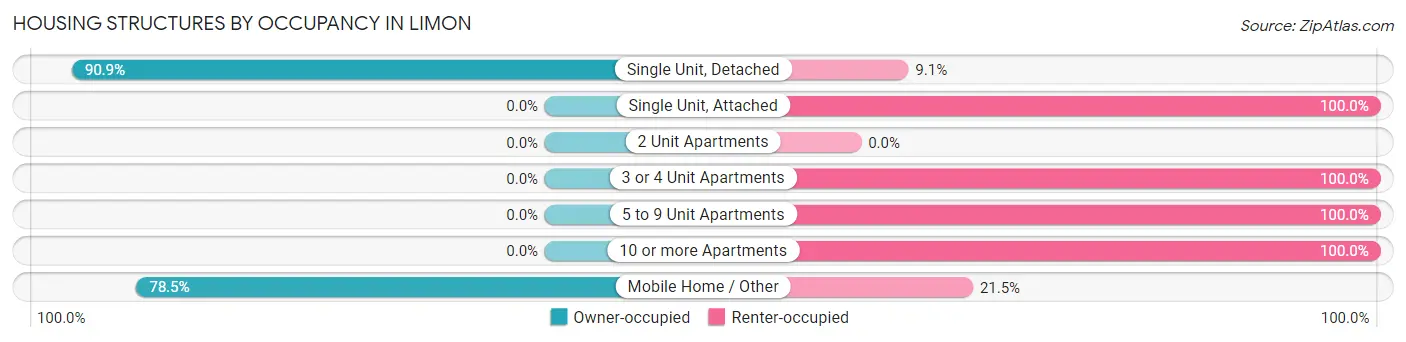
| Structure Type | Owner-occupied | Renter-occupied |
| Single Unit, Detached | 400 (90.9%) | 40 (9.1%) |
| Single Unit, Attached | 0 (0.0%) | 29 (100.0%) |
| 2 Unit Apartments | 0 (0.0%) | 0 (0.0%) |
| 3 or 4 Unit Apartments | 0 (0.0%) | 6 (100.0%) |
| 5 to 9 Unit Apartments | 0 (0.0%) | 67 (100.0%) |
| 10 or more Apartments | 0 (0.0%) | 78 (100.0%) |
| Mobile Home / Other | 62 (78.5%) | 17 (21.5%) |
| Total | 462 (66.1%) | 237 (33.9%) |
Housing Structures by Number of Rooms in Limon
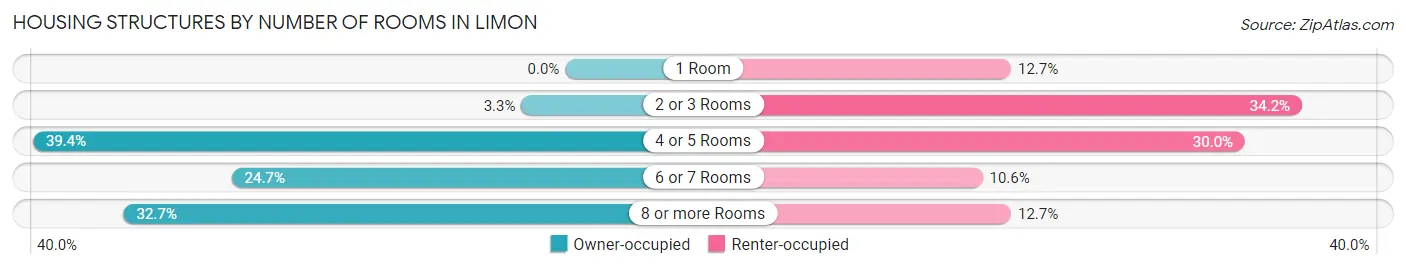
| Number of Rooms | Owner-occupied | Renter-occupied |
| 1 Room | 0 (0.0%) | 30 (12.7%) |
| 2 or 3 Rooms | 15 (3.3%) | 81 (34.2%) |
| 4 or 5 Rooms | 182 (39.4%) | 71 (30.0%) |
| 6 or 7 Rooms | 114 (24.7%) | 25 (10.5%) |
| 8 or more Rooms | 151 (32.7%) | 30 (12.7%) |
| Total | 462 (100.0%) | 237 (100.0%) |
Housing Structure by Heating Type in Limon
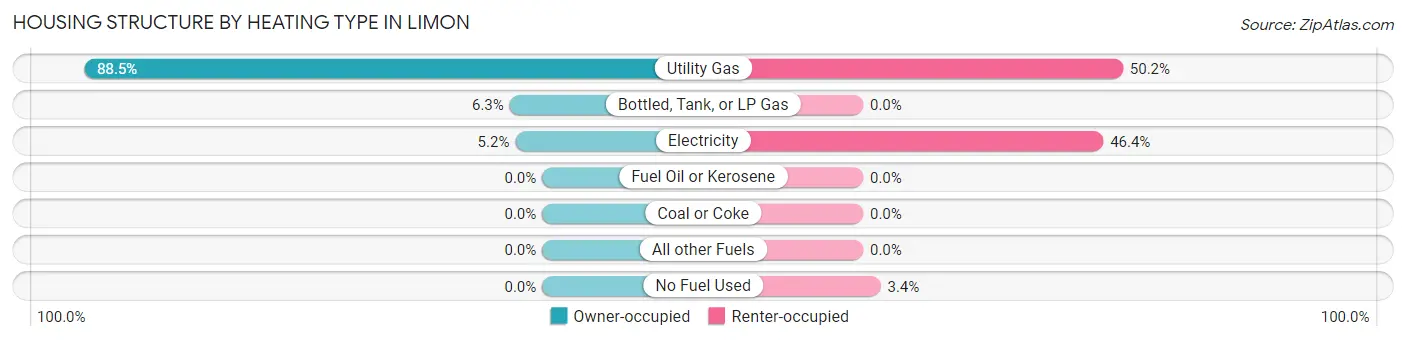
| Heating Type | Owner-occupied | Renter-occupied |
| Utility Gas | 409 (88.5%) | 119 (50.2%) |
| Bottled, Tank, or LP Gas | 29 (6.3%) | 0 (0.0%) |
| Electricity | 24 (5.2%) | 110 (46.4%) |
| Fuel Oil or Kerosene | 0 (0.0%) | 0 (0.0%) |
| Coal or Coke | 0 (0.0%) | 0 (0.0%) |
| All other Fuels | 0 (0.0%) | 0 (0.0%) |
| No Fuel Used | 0 (0.0%) | 8 (3.4%) |
| Total | 462 (100.0%) | 237 (100.0%) |
Household Vehicle Usage in Limon
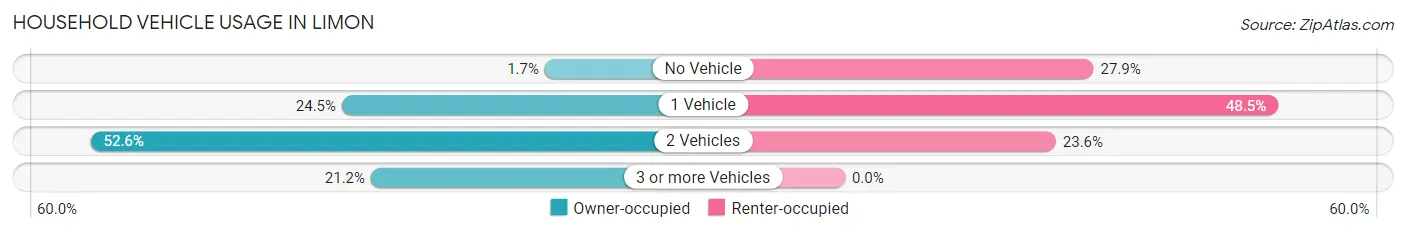
| Vehicles per Household | Owner-occupied | Renter-occupied |
| No Vehicle | 8 (1.7%) | 66 (27.9%) |
| 1 Vehicle | 113 (24.5%) | 115 (48.5%) |
| 2 Vehicles | 243 (52.6%) | 56 (23.6%) |
| 3 or more Vehicles | 98 (21.2%) | 0 (0.0%) |
| Total | 462 (100.0%) | 237 (100.0%) |
Real Estate & Mortgages in Limon
Real Estate and Mortgage Overview in Limon
| Characteristic | Without Mortgage | With Mortgage |
| Housing Units | 233 | 229 |
| Median Property Value | $122,800 | $308,000 |
| Median Household Income | $37,188 | $86 |
| Monthly Housing Costs | $445 | $0 |
| Real Estate Taxes | $688 | $0 |
Property Value by Mortgage Status in Limon
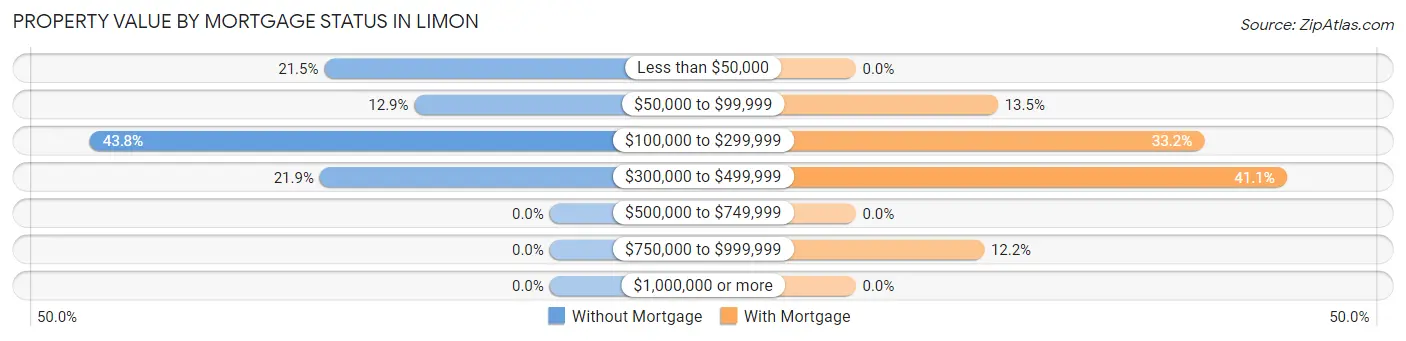
| Property Value | Without Mortgage | With Mortgage |
| Less than $50,000 | 50 (21.5%) | 0 (0.0%) |
| $50,000 to $99,999 | 30 (12.9%) | 31 (13.5%) |
| $100,000 to $299,999 | 102 (43.8%) | 76 (33.2%) |
| $300,000 to $499,999 | 51 (21.9%) | 94 (41.0%) |
| $500,000 to $749,999 | 0 (0.0%) | 0 (0.0%) |
| $750,000 to $999,999 | 0 (0.0%) | 28 (12.2%) |
| $1,000,000 or more | 0 (0.0%) | 0 (0.0%) |
| Total | 233 (100.0%) | 229 (100.0%) |
Household Income by Mortgage Status in Limon
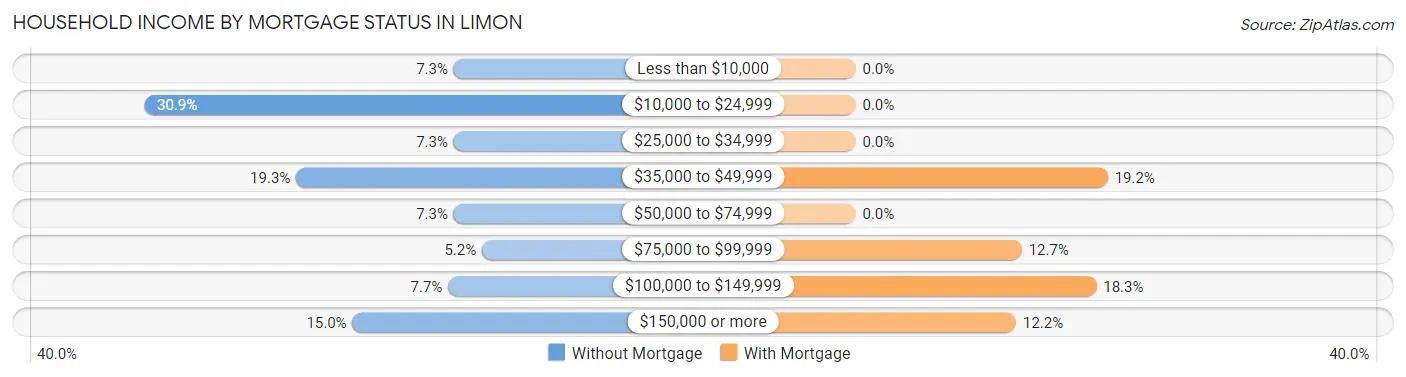
| Household Income | Without Mortgage | With Mortgage |
| Less than $10,000 | 17 (7.3%) | 0 (0.0%) |
| $10,000 to $24,999 | 72 (30.9%) | 0 (0.0%) |
| $25,000 to $34,999 | 17 (7.3%) | 0 (0.0%) |
| $35,000 to $49,999 | 45 (19.3%) | 44 (19.2%) |
| $50,000 to $74,999 | 17 (7.3%) | 0 (0.0%) |
| $75,000 to $99,999 | 12 (5.1%) | 29 (12.7%) |
| $100,000 to $149,999 | 18 (7.7%) | 42 (18.3%) |
| $150,000 or more | 35 (15.0%) | 28 (12.2%) |
| Total | 233 (100.0%) | 229 (100.0%) |
Property Value to Household Income Ratio in Limon
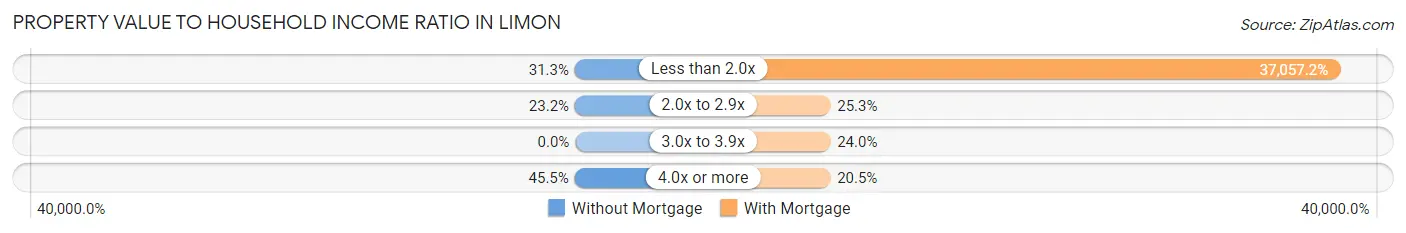
| Value-to-Income Ratio | Without Mortgage | With Mortgage |
| Less than 2.0x | 73 (31.3%) | 84,861 (37,057.2%) |
| 2.0x to 2.9x | 54 (23.2%) | 58 (25.3%) |
| 3.0x to 3.9x | 0 (0.0%) | 55 (24.0%) |
| 4.0x or more | 106 (45.5%) | 47 (20.5%) |
| Total | 233 (100.0%) | 229 (100.0%) |
Real Estate Taxes by Mortgage Status in Limon
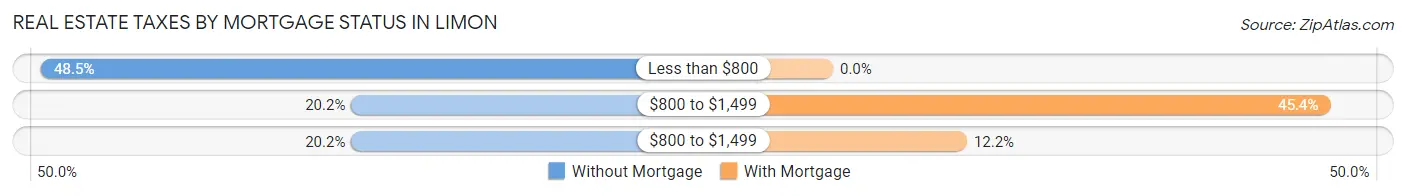
| Property Taxes | Without Mortgage | With Mortgage |
| Less than $800 | 113 (48.5%) | 0 (0.0%) |
| $800 to $1,499 | 47 (20.2%) | 104 (45.4%) |
| $800 to $1,499 | 47 (20.2%) | 28 (12.2%) |
| Total | 233 (100.0%) | 229 (100.0%) |
Health & Disability in Limon
Health Insurance Coverage by Age in Limon
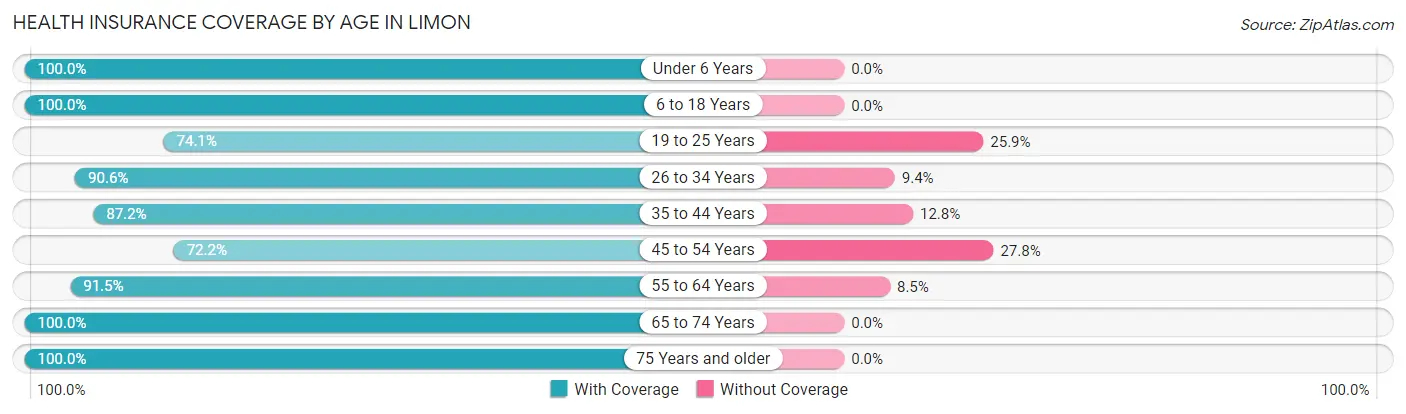
| Age Bracket | With Coverage | Without Coverage |
| Under 6 Years | 42 (100.0%) | 0 (0.0%) |
| 6 to 18 Years | 194 (100.0%) | 0 (0.0%) |
| 19 to 25 Years | 100 (74.1%) | 35 (25.9%) |
| 26 to 34 Years | 192 (90.6%) | 20 (9.4%) |
| 35 to 44 Years | 102 (87.2%) | 15 (12.8%) |
| 45 to 54 Years | 96 (72.2%) | 37 (27.8%) |
| 55 to 64 Years | 268 (91.5%) | 25 (8.5%) |
| 65 to 74 Years | 193 (100.0%) | 0 (0.0%) |
| 75 Years and older | 110 (100.0%) | 0 (0.0%) |
| Total | 1,297 (90.8%) | 132 (9.2%) |
Health Insurance Coverage by Citizenship Status in Limon
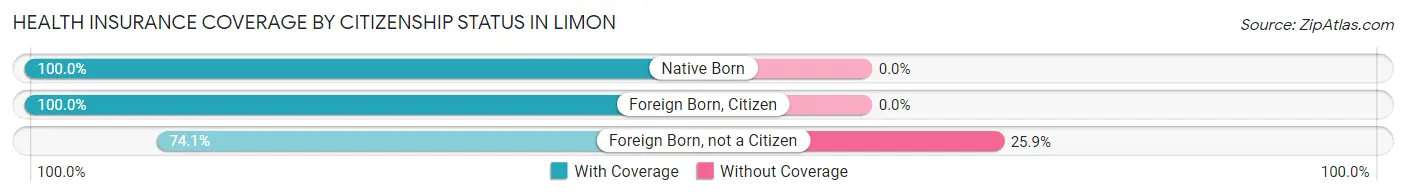
| Citizenship Status | With Coverage | Without Coverage |
| Native Born | 42 (100.0%) | 0 (0.0%) |
| Foreign Born, Citizen | 194 (100.0%) | 0 (0.0%) |
| Foreign Born, not a Citizen | 100 (74.1%) | 35 (25.9%) |
Health Insurance Coverage by Household Income in Limon
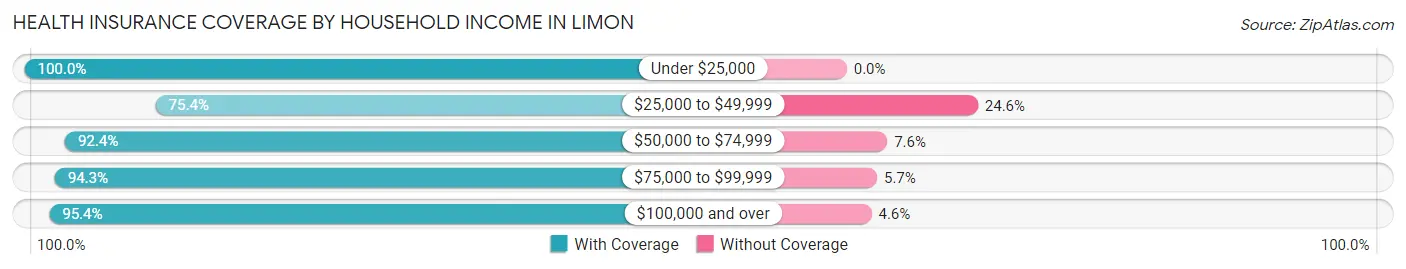
| Household Income | With Coverage | Without Coverage |
| Under $25,000 | 194 (100.0%) | 0 (0.0%) |
| $25,000 to $49,999 | 255 (75.4%) | 83 (24.6%) |
| $50,000 to $74,999 | 171 (92.4%) | 14 (7.6%) |
| $75,000 to $99,999 | 183 (94.3%) | 11 (5.7%) |
| $100,000 and over | 494 (95.4%) | 24 (4.6%) |
Public vs Private Health Insurance Coverage by Age in Limon
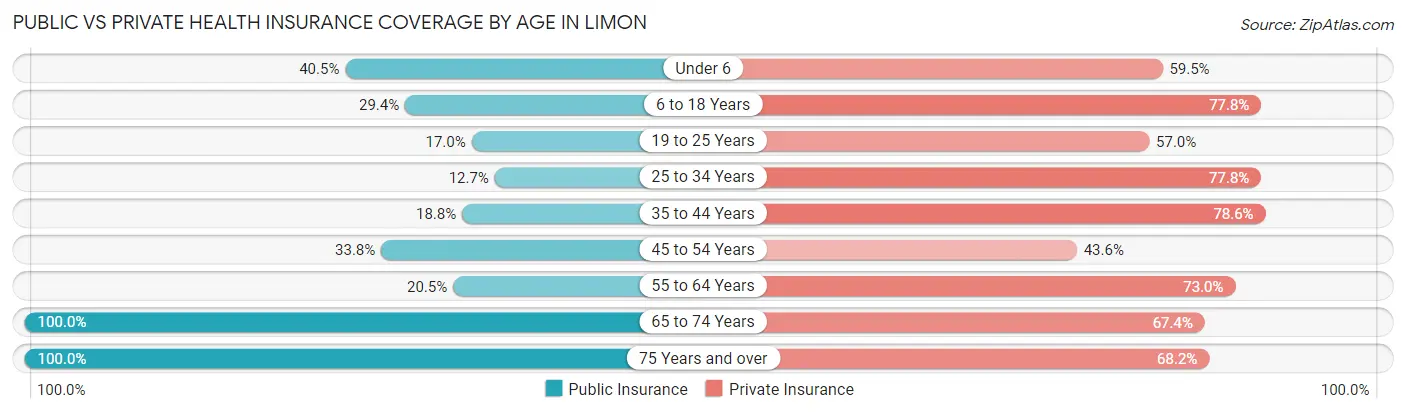
| Age Bracket | Public Insurance | Private Insurance |
| Under 6 | 17 (40.5%) | 25 (59.5%) |
| 6 to 18 Years | 57 (29.4%) | 151 (77.8%) |
| 19 to 25 Years | 23 (17.0%) | 77 (57.0%) |
| 25 to 34 Years | 27 (12.7%) | 165 (77.8%) |
| 35 to 44 Years | 22 (18.8%) | 92 (78.6%) |
| 45 to 54 Years | 45 (33.8%) | 58 (43.6%) |
| 55 to 64 Years | 60 (20.5%) | 214 (73.0%) |
| 65 to 74 Years | 193 (100.0%) | 130 (67.4%) |
| 75 Years and over | 110 (100.0%) | 75 (68.2%) |
| Total | 554 (38.8%) | 987 (69.1%) |
Disability Status by Sex by Age in Limon
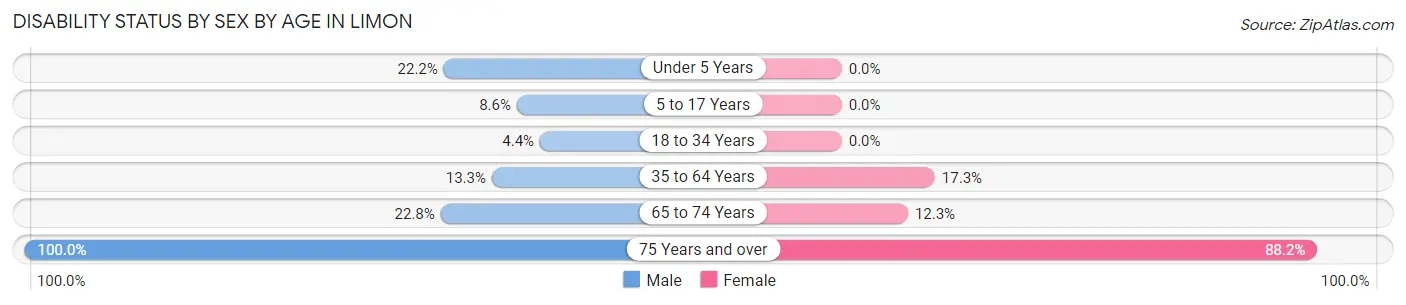
| Age Bracket | Male | Female |
| Under 5 Years | 4 (22.2%) | 0 (0.0%) |
| 5 to 17 Years | 7 (8.6%) | 0 (0.0%) |
| 18 to 34 Years | 10 (4.3%) | 0 (0.0%) |
| 35 to 64 Years | 36 (13.3%) | 47 (17.3%) |
| 65 to 74 Years | 18 (22.8%) | 14 (12.3%) |
| 75 Years and over | 25 (100.0%) | 75 (88.2%) |
Disability Class by Sex by Age in Limon
Disability Class: Hearing Difficulty
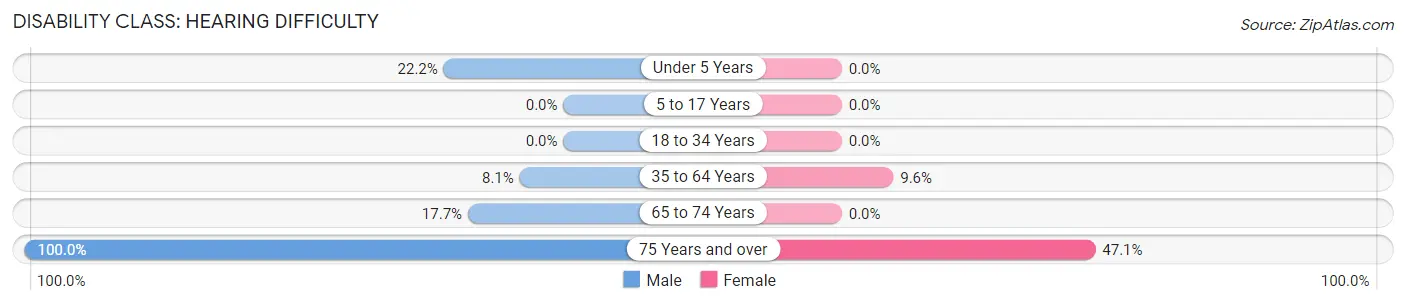
| Age Bracket | Male | Female |
| Under 5 Years | 4 (22.2%) | 0 (0.0%) |
| 5 to 17 Years | 0 (0.0%) | 0 (0.0%) |
| 18 to 34 Years | 0 (0.0%) | 0 (0.0%) |
| 35 to 64 Years | 22 (8.1%) | 26 (9.6%) |
| 65 to 74 Years | 14 (17.7%) | 0 (0.0%) |
| 75 Years and over | 25 (100.0%) | 40 (47.1%) |
Disability Class: Vision Difficulty
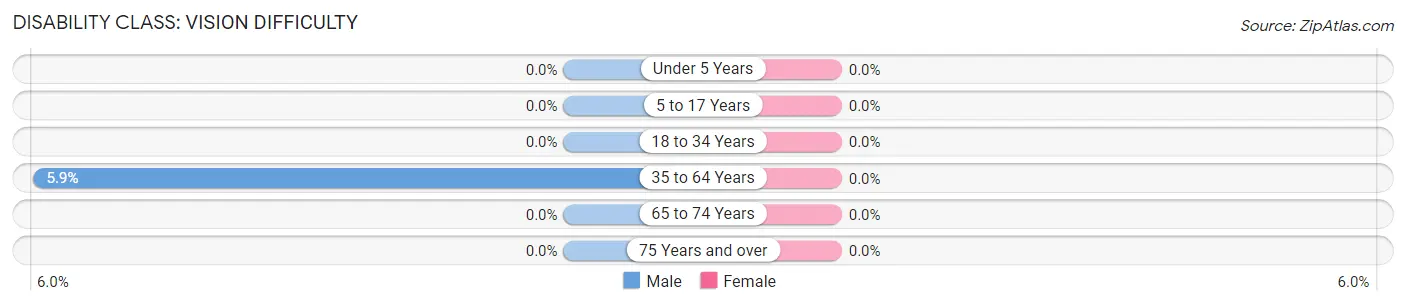
| Age Bracket | Male | Female |
| Under 5 Years | 0 (0.0%) | 0 (0.0%) |
| 5 to 17 Years | 0 (0.0%) | 0 (0.0%) |
| 18 to 34 Years | 0 (0.0%) | 0 (0.0%) |
| 35 to 64 Years | 16 (5.9%) | 0 (0.0%) |
| 65 to 74 Years | 0 (0.0%) | 0 (0.0%) |
| 75 Years and over | 0 (0.0%) | 0 (0.0%) |
Disability Class: Cognitive Difficulty
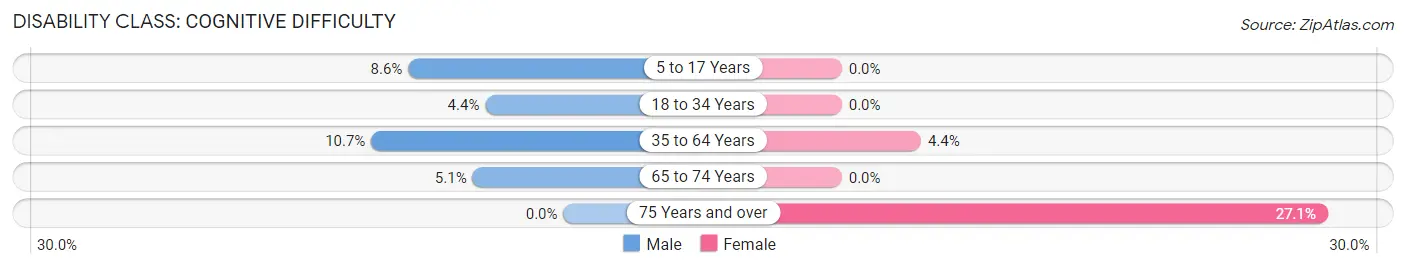
| Age Bracket | Male | Female |
| 5 to 17 Years | 7 (8.6%) | 0 (0.0%) |
| 18 to 34 Years | 10 (4.3%) | 0 (0.0%) |
| 35 to 64 Years | 29 (10.7%) | 12 (4.4%) |
| 65 to 74 Years | 4 (5.1%) | 0 (0.0%) |
| 75 Years and over | 0 (0.0%) | 23 (27.1%) |
Disability Class: Ambulatory Difficulty
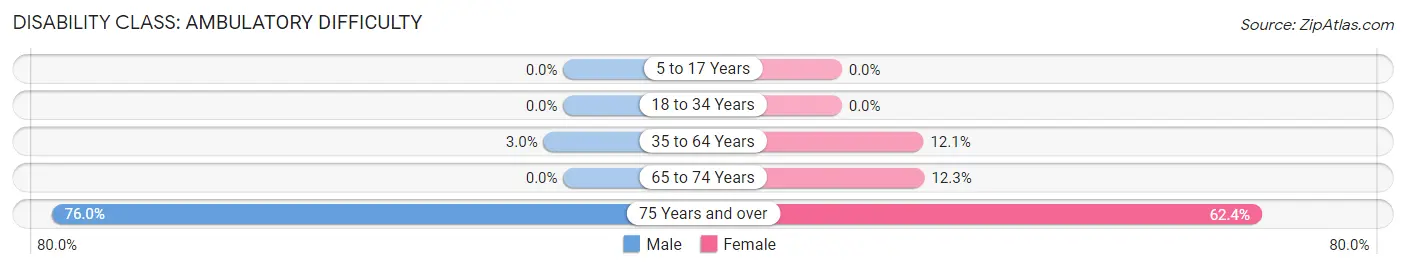
| Age Bracket | Male | Female |
| 5 to 17 Years | 0 (0.0%) | 0 (0.0%) |
| 18 to 34 Years | 0 (0.0%) | 0 (0.0%) |
| 35 to 64 Years | 8 (2.9%) | 33 (12.1%) |
| 65 to 74 Years | 0 (0.0%) | 14 (12.3%) |
| 75 Years and over | 19 (76.0%) | 53 (62.4%) |
Disability Class: Self-Care Difficulty
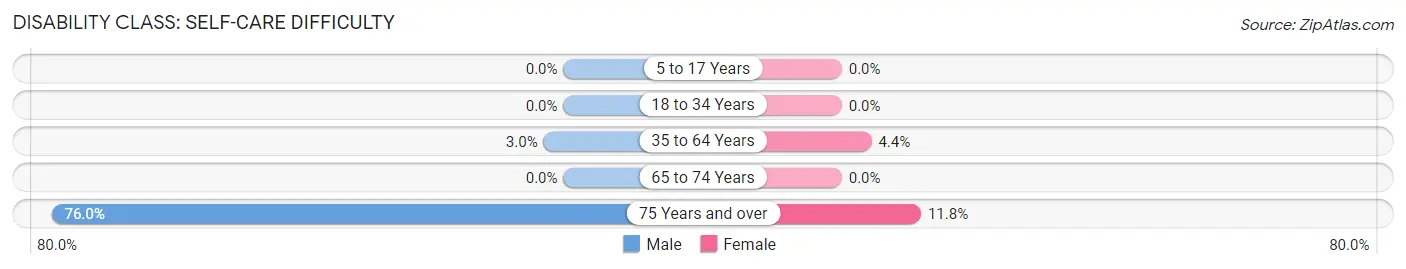
| Age Bracket | Male | Female |
| 5 to 17 Years | 0 (0.0%) | 0 (0.0%) |
| 18 to 34 Years | 0 (0.0%) | 0 (0.0%) |
| 35 to 64 Years | 8 (2.9%) | 12 (4.4%) |
| 65 to 74 Years | 0 (0.0%) | 0 (0.0%) |
| 75 Years and over | 19 (76.0%) | 10 (11.8%) |
Technology Access in Limon
Computing Device Access in Limon
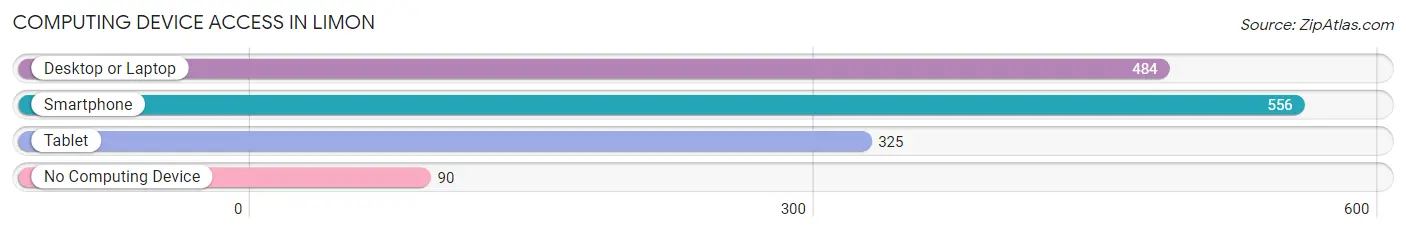
| Device Type | # Households | % Households |
| Desktop or Laptop | 484 | 69.2% |
| Smartphone | 556 | 79.5% |
| Tablet | 325 | 46.5% |
| No Computing Device | 90 | 12.9% |
| Total | 699 | 100.0% |
Internet Access in Limon
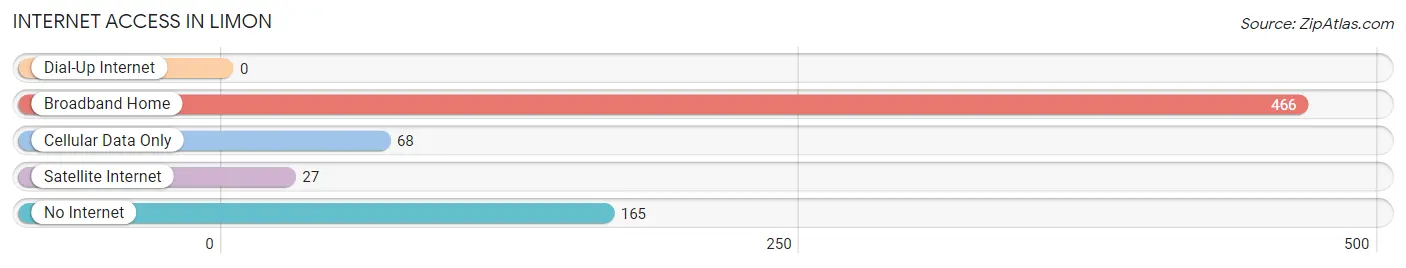
| Internet Type | # Households | % Households |
| Dial-Up Internet | 0 | 0.0% |
| Broadband Home | 466 | 66.7% |
| Cellular Data Only | 68 | 9.7% |
| Satellite Internet | 27 | 3.9% |
| No Internet | 165 | 23.6% |
| Total | 699 | 100.0% |
Limon Summary
Limon, Colorado is a small town located in Lincoln County, Colorado, United States. It is situated along the Union Pacific Railroad line, approximately 70 miles east of Denver. The town was founded in 1888 and has a population of 2,077 as of the 2010 census.
History
Limon was founded in 1888 by the Union Pacific Railroad. The town was named after the Spanish word for lemon, “limon”, due to the abundance of wild lemon trees in the area. The town was originally a stop on the Union Pacific Railroad line, and it quickly grew into a bustling community.
In the early 1900s, Limon was a major hub for the cattle industry. The town was home to several large ranches, and the Union Pacific Railroad provided a convenient way to transport cattle to other parts of the country.
In the 1920s, the town began to experience a decline in population as the cattle industry moved away from the area. However, the town was able to remain afloat due to its location along the Union Pacific Railroad line.
In the 1950s, the town experienced a resurgence in population as the Union Pacific Railroad began to expand its operations in the area. The town was also home to a large Air Force base, which provided jobs and economic stability to the area.
Geography
Limon is located in Lincoln County, Colorado, United States. It is situated along the Union Pacific Railroad line, approximately 70 miles east of Denver. The town is located at an elevation of 4,845 feet above sea level.
The town is located in the High Plains region of Colorado, and the climate is semi-arid. The average annual temperature is 54 degrees Fahrenheit, and the average annual precipitation is 16.5 inches.
Economy
The economy of Limon is largely based on agriculture and the Union Pacific Railroad. The town is home to several large ranches, and the Union Pacific Railroad provides a convenient way to transport cattle to other parts of the country.
The town is also home to a large Air Force base, which provides jobs and economic stability to the area. The base is home to the 140th Wing of the Colorado Air National Guard, and it is the largest employer in the town.
Demographics
As of the 2010 census, the population of Limon was 2,077. The racial makeup of the town was 94.3% White, 0.7% African American, 0.7% Native American, 0.3% Asian, 0.1% Pacific Islander, 2.2% from other races, and 1.9% from two or more races. Hispanic or Latino of any race were 6.3% of the population.
The median income for a household in the town was $37,917, and the median income for a family was $45,000. The per capita income for the town was $18,945. About 11.2% of families and 14.2% of the population were below the poverty line, including 18.2% of those under age 18 and 8.3% of those age 65 or over.
Common Questions
What is Per Capita Income in Limon?
Per Capita income in Limon is $35,482.
What is the Median Family Income in Limon?
Median Family Income in Limon is $82,589.
What is the Median Household income in Limon?
Median Household Income in Limon is $49,034.
What is Income or Wage Gap in Limon?
Income or Wage Gap in Limon is 12.4%.
Women in Limon earn 87.6 cents for every dollar earned by a man.
What is Inequality or Gini Index in Limon?
Inequality or Gini Index in Limon is 0.46.
What is the Total Population of Limon?
Total Population of Limon is 1,479.
What is the Total Male Population of Limon?
Total Male Population of Limon is 740.
What is the Total Female Population of Limon?
Total Female Population of Limon is 739.
What is the Ratio of Males per 100 Females in Limon?
There are 100.14 Males per 100 Females in Limon.
What is the Ratio of Females per 100 Males in Limon?
There are 99.86 Females per 100 Males in Limon.
What is the Median Population Age in Limon?
Median Population Age in Limon is 47.1 Years.
What is the Average Family Size in Limon
Average Family Size in Limon is 2.8 People.
What is the Average Household Size in Limon
Average Household Size in Limon is 2.1 People.
How Large is the Labor Force in Limon?
There are 852 People in the Labor Forcein in Limon.
What is the Percentage of People in the Labor Force in Limon?
65.7% of People are in the Labor Force in Limon.
What is the Unemployment Rate in Limon?
Unemployment Rate in Limon is 1.9%.