Las Animas, CO Map & Demographics
Las Animas Map
Las Animas Overview
$21,139
PER CAPITA INCOME
$44,706
AVG FAMILY INCOME
$45,355
AVG HOUSEHOLD INCOME
13.0%
WAGE / INCOME GAP [ % ]
87.0¢/ $1
WAGE / INCOME GAP [ $ ]
$10,912
FAMILY INCOME DEFICIT
0.41
INEQUALITY / GINI INDEX
2,421
TOTAL POPULATION
1,159
MALE POPULATION
1,262
FEMALE POPULATION
91.84
MALES / 100 FEMALES
108.89
FEMALES / 100 MALES
38.8
MEDIAN AGE
2.9
AVG FAMILY SIZE
2.2
AVG HOUSEHOLD SIZE
928
LABOR FORCE [ PEOPLE ]
49.4%
PERCENT IN LABOR FORCE
10.3%
UNEMPLOYMENT RATE
Las Animas Zip Codes
Las Animas Area Codes
Income in Las Animas
Income Overview in Las Animas
Per Capita Income in Las Animas is $21,139, while median incomes of families and households are $44,706 and $45,355 respectively.
| Characteristic | Number | Measure |
| Per Capita Income | 2,421 | $21,139 |
| Median Family Income | 592 | $44,706 |
| Mean Family Income | 592 | $55,166 |
| Median Household Income | 1,037 | $45,355 |
| Mean Household Income | 1,037 | $50,153 |
| Income Deficit | 592 | $10,912 |
| Wage / Income Gap (%) | 2,421 | 13.03% |
| Wage / Income Gap ($) | 2,421 | 86.97¢ per $1 |
| Gini / Inequality Index | 2,421 | 0.41 |
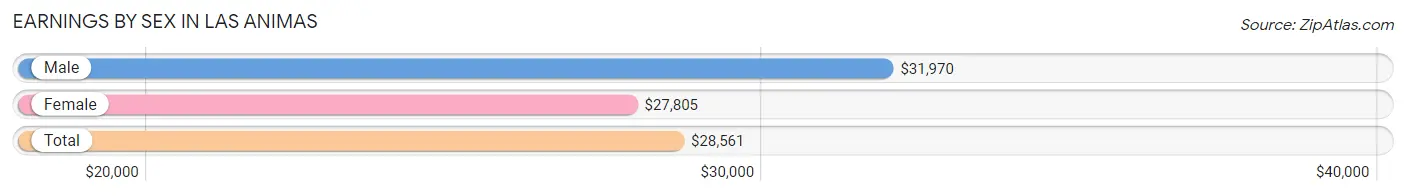
Earnings by Sex in Las Animas
Average Earnings in Las Animas are $28,561, $31,970 for men and $27,805 for women, a difference of 13.0%.
| Sex | Number | Average Earnings |
| Male | 512 (57.3%) | $31,970 |
| Female | 381 (42.7%) | $27,805 |
| Total | 893 (100.0%) | $28,561 |
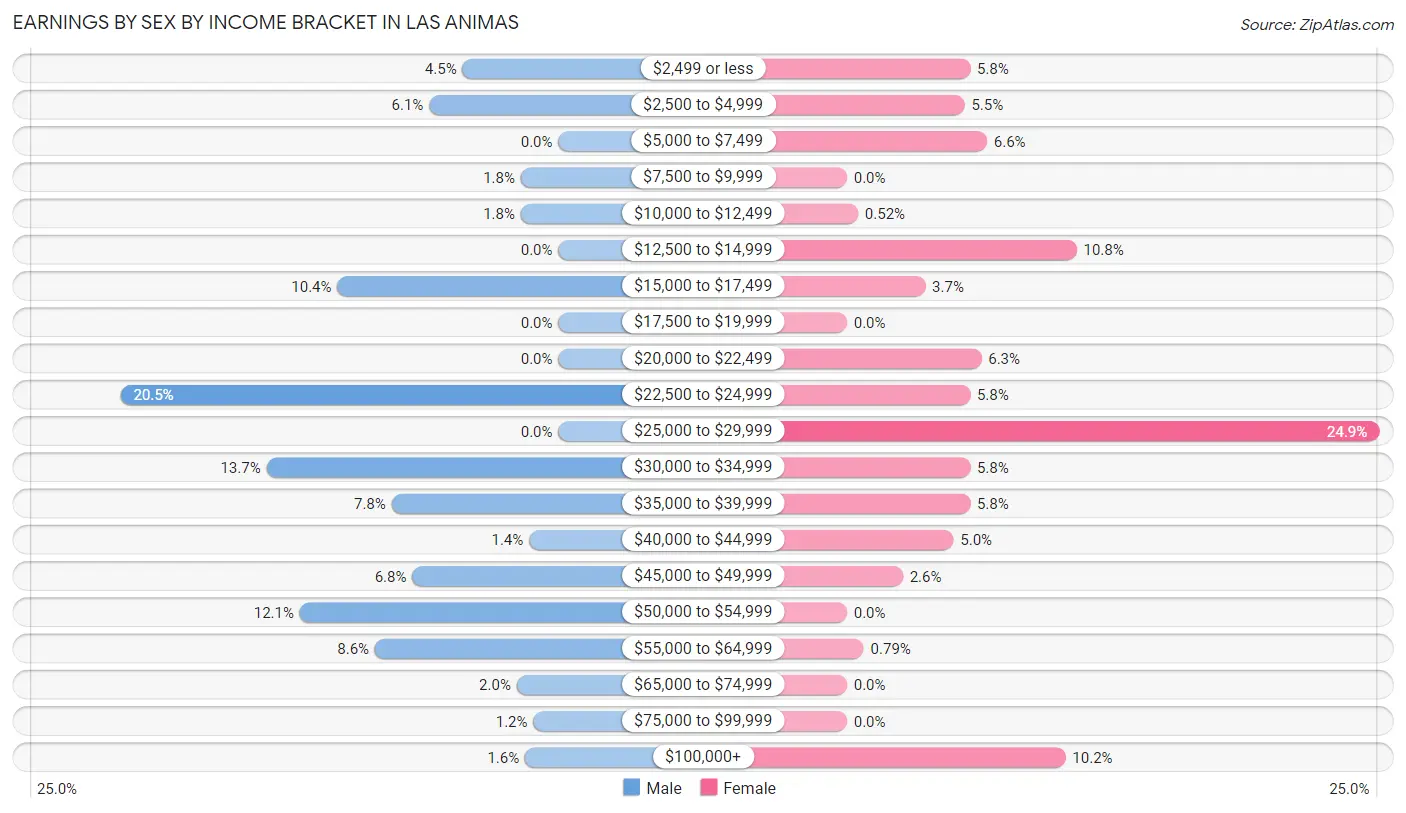
Earnings by Sex by Income Bracket in Las Animas
The most common earnings brackets in Las Animas are $22,500 to $24,999 for men (105 | 20.5%) and $25,000 to $29,999 for women (95 | 24.9%).
| Income | Male | Female |
| $2,499 or less | 23 (4.5%) | 22 (5.8%) |
| $2,500 to $4,999 | 31 (6.0%) | 21 (5.5%) |
| $5,000 to $7,499 | 0 (0.0%) | 25 (6.6%) |
| $7,500 to $9,999 | 9 (1.8%) | 0 (0.0%) |
| $10,000 to $12,499 | 9 (1.8%) | 2 (0.5%) |
| $12,500 to $14,999 | 0 (0.0%) | 41 (10.8%) |
| $15,000 to $17,499 | 53 (10.3%) | 14 (3.7%) |
| $17,500 to $19,999 | 0 (0.0%) | 0 (0.0%) |
| $20,000 to $22,499 | 0 (0.0%) | 24 (6.3%) |
| $22,500 to $24,999 | 105 (20.5%) | 22 (5.8%) |
| $25,000 to $29,999 | 0 (0.0%) | 95 (24.9%) |
| $30,000 to $34,999 | 70 (13.7%) | 22 (5.8%) |
| $35,000 to $39,999 | 40 (7.8%) | 22 (5.8%) |
| $40,000 to $44,999 | 7 (1.4%) | 19 (5.0%) |
| $45,000 to $49,999 | 35 (6.8%) | 10 (2.6%) |
| $50,000 to $54,999 | 62 (12.1%) | 0 (0.0%) |
| $55,000 to $64,999 | 44 (8.6%) | 3 (0.8%) |
| $65,000 to $74,999 | 10 (1.9%) | 0 (0.0%) |
| $75,000 to $99,999 | 6 (1.2%) | 0 (0.0%) |
| $100,000+ | 8 (1.6%) | 39 (10.2%) |
| Total | 512 (100.0%) | 381 (100.0%) |
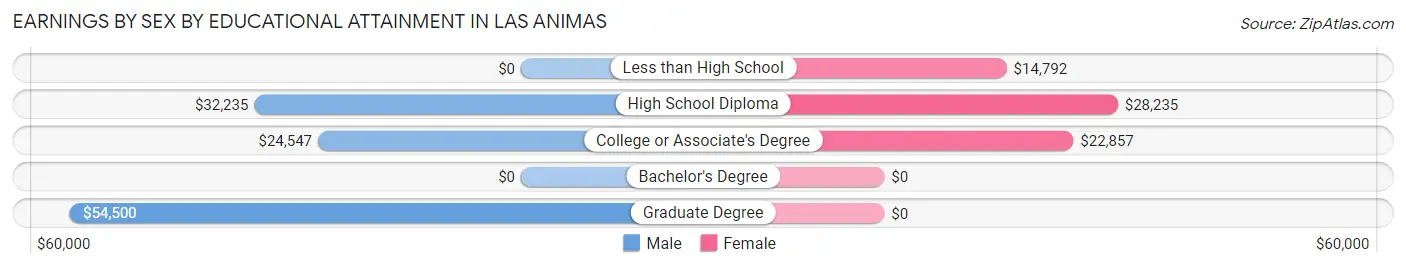
Earnings by Sex by Educational Attainment in Las Animas
Average earnings in Las Animas are $32,770 for men and $27,776 for women, a difference of 15.2%. Men with an educational attainment of graduate degree enjoy the highest average annual earnings of $54,500, while those with college or associate's degree education earn the least with $24,547. Women with an educational attainment of high school diploma earn the most with the average annual earnings of $28,235, while those with less than high school education have the smallest earnings of $14,792.
| Educational Attainment | Male Income | Female Income |
| Less than High School | - | - |
| High School Diploma | $32,235 | $28,235 |
| College or Associate's Degree | $24,547 | $22,857 |
| Bachelor's Degree | - | - |
| Graduate Degree | $54,500 | $0 |
| Total | $32,770 | $27,776 |
Family Income in Las Animas
Family Income Brackets in Las Animas
According to the Las Animas family income data, there are 110 families falling into the $75,000 to $99,999 income range, which is the most common income bracket and makes up 18.6% of all families.
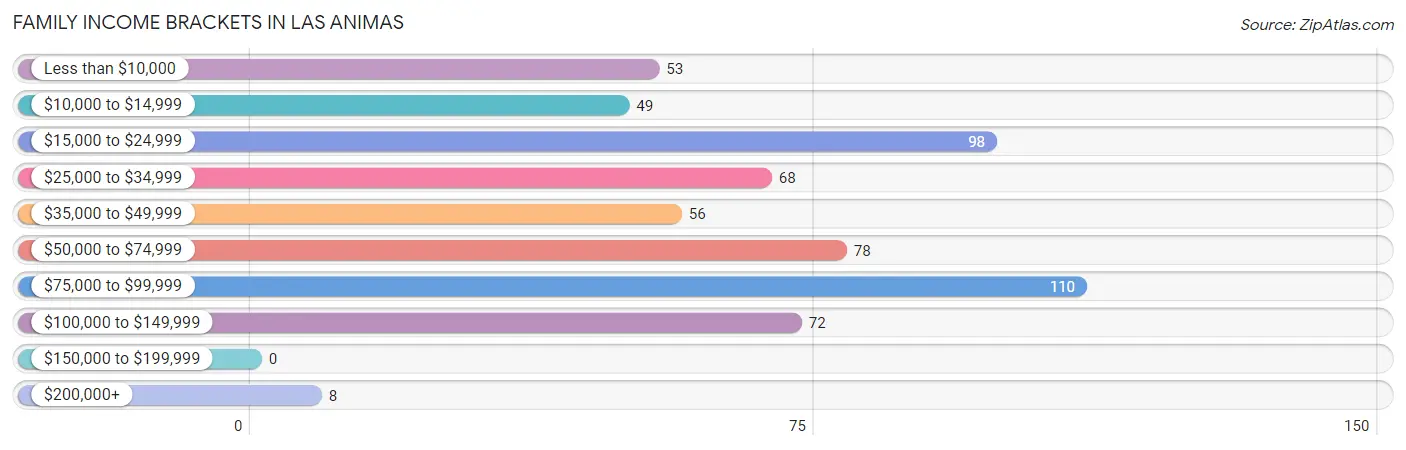
| Income Bracket | # Families | % Families |
| Less than $10,000 | 53 | 9.0% |
| $10,000 to $14,999 | 49 | 8.3% |
| $15,000 to $24,999 | 98 | 16.6% |
| $25,000 to $34,999 | 68 | 11.5% |
| $35,000 to $49,999 | 56 | 9.5% |
| $50,000 to $74,999 | 78 | 13.2% |
| $75,000 to $99,999 | 110 | 18.6% |
| $100,000 to $149,999 | 72 | 12.2% |
| $150,000 to $199,999 | 0 | 0.0% |
| $200,000+ | 8 | 1.4% |
Family Income by Famaliy Size in Las Animas
3-person families (131 | 22.1%) account for the highest median family income in Las Animas with $46,438 per family, while 2-person families (243 | 41.0%) have the highest median income of $15,860 per family member.
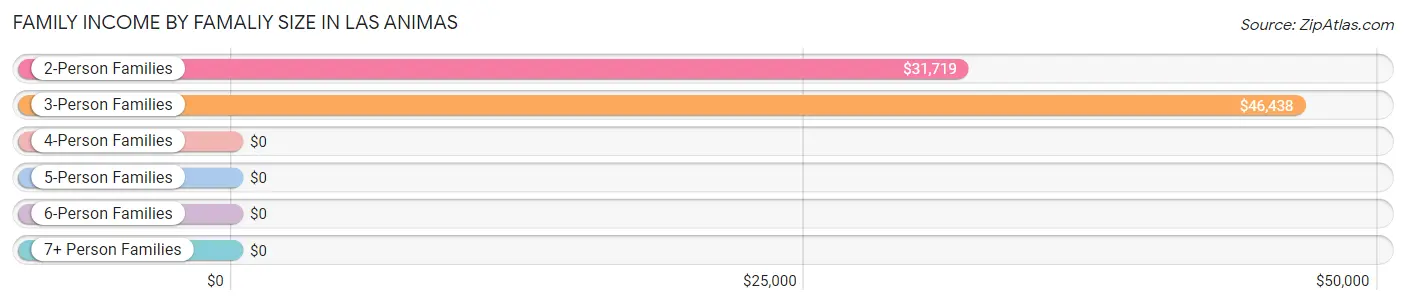
| Income Bracket | # Families | Median Income |
| 2-Person Families | 243 (41.0%) | $31,719 |
| 3-Person Families | 131 (22.1%) | $46,438 |
| 4-Person Families | 107 (18.1%) | $0 |
| 5-Person Families | 73 (12.3%) | $0 |
| 6-Person Families | 38 (6.4%) | $0 |
| 7+ Person Families | 0 (0.0%) | $0 |
| Total | 592 (100.0%) | $44,706 |
Family Income by Number of Earners in Las Animas
The median family income in Las Animas is $44,706, with families comprising 2 earners (172) having the highest median family income of $89,063, while families with 1 earner (227) have the lowest median family income of $24,494, accounting for 29.0% and 38.3% of families, respectively.
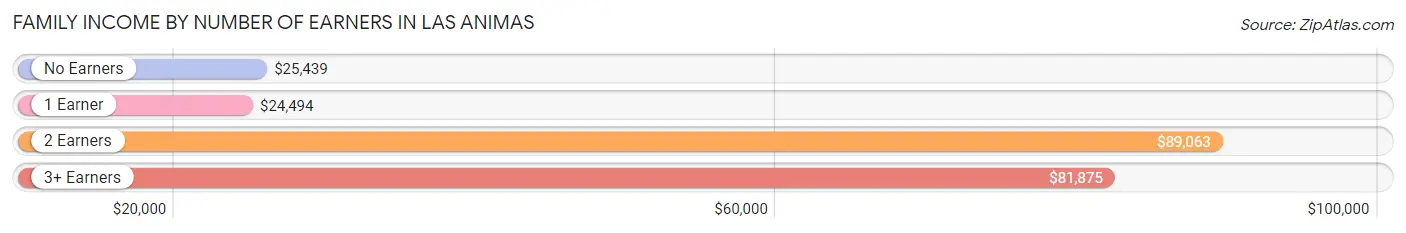
| Number of Earners | # Families | Median Income |
| No Earners | 169 (28.5%) | $25,439 |
| 1 Earner | 227 (38.3%) | $24,494 |
| 2 Earners | 172 (29.0%) | $89,063 |
| 3+ Earners | 24 (4.1%) | $81,875 |
| Total | 592 (100.0%) | $44,706 |
Household Income in Las Animas
Household Income Brackets in Las Animas
With 233 households falling in the category, the $50,000 to $74,999 income range is the most frequent in Las Animas, accounting for 22.5% of all households.
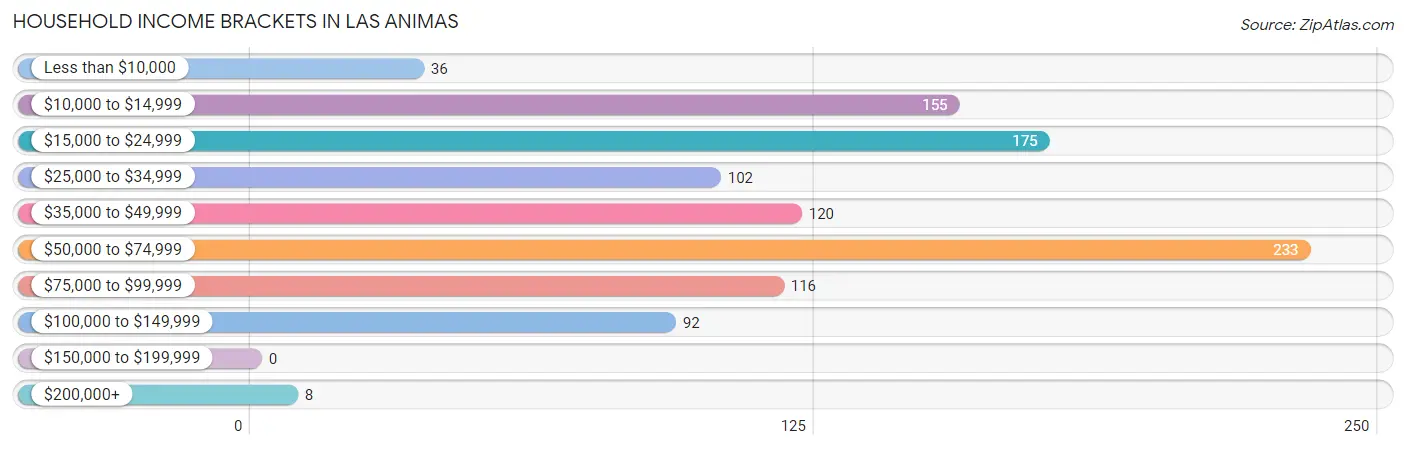
| Income Bracket | # Households | % Households |
| Less than $10,000 | 36 | 3.5% |
| $10,000 to $14,999 | 155 | 14.9% |
| $15,000 to $24,999 | 175 | 16.9% |
| $25,000 to $34,999 | 102 | 9.8% |
| $35,000 to $49,999 | 120 | 11.6% |
| $50,000 to $74,999 | 233 | 22.5% |
| $75,000 to $99,999 | 116 | 11.2% |
| $100,000 to $149,999 | 92 | 8.9% |
| $150,000 to $199,999 | 0 | 0.0% |
| $200,000+ | 8 | 0.8% |
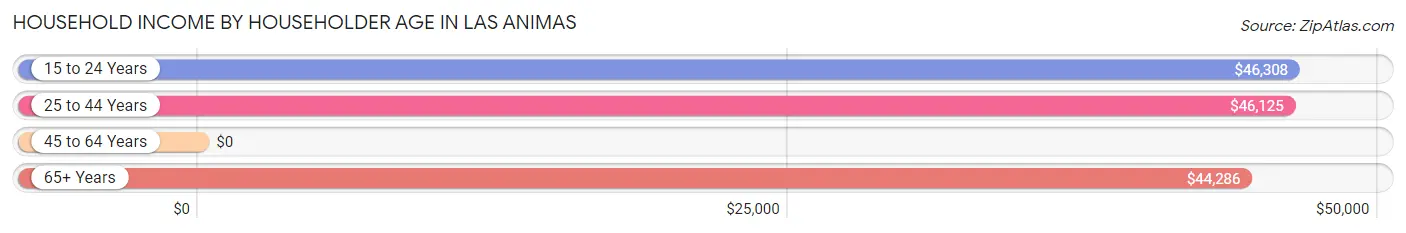
Household Income by Householder Age in Las Animas
The median household income in Las Animas is $45,355, with the highest median household income of $46,308 found in the 15 to 24 years age bracket for the primary householder. A total of 77 households (7.4%) fall into this category. Meanwhile, the 45 to 64 years age bracket for the primary householder has the lowest median household income of $0, with 298 households (28.7%) in this group.
| Income Bracket | # Households | Median Income |
| 15 to 24 Years | 77 (7.4%) | $46,308 |
| 25 to 44 Years | 292 (28.2%) | $46,125 |
| 45 to 64 Years | 298 (28.7%) | $0 |
| 65+ Years | 370 (35.7%) | $44,286 |
| Total | 1,037 (100.0%) | $45,355 |
Poverty in Las Animas
Income Below Poverty by Sex and Age in Las Animas
With 30.1% poverty level for males and 38.7% for females among the residents of Las Animas, 12 to 14 year old males and 5 year old females are the most vulnerable to poverty, with 26 males (76.5%) and 17 females (100.0%) in their respective age groups living below the poverty level.
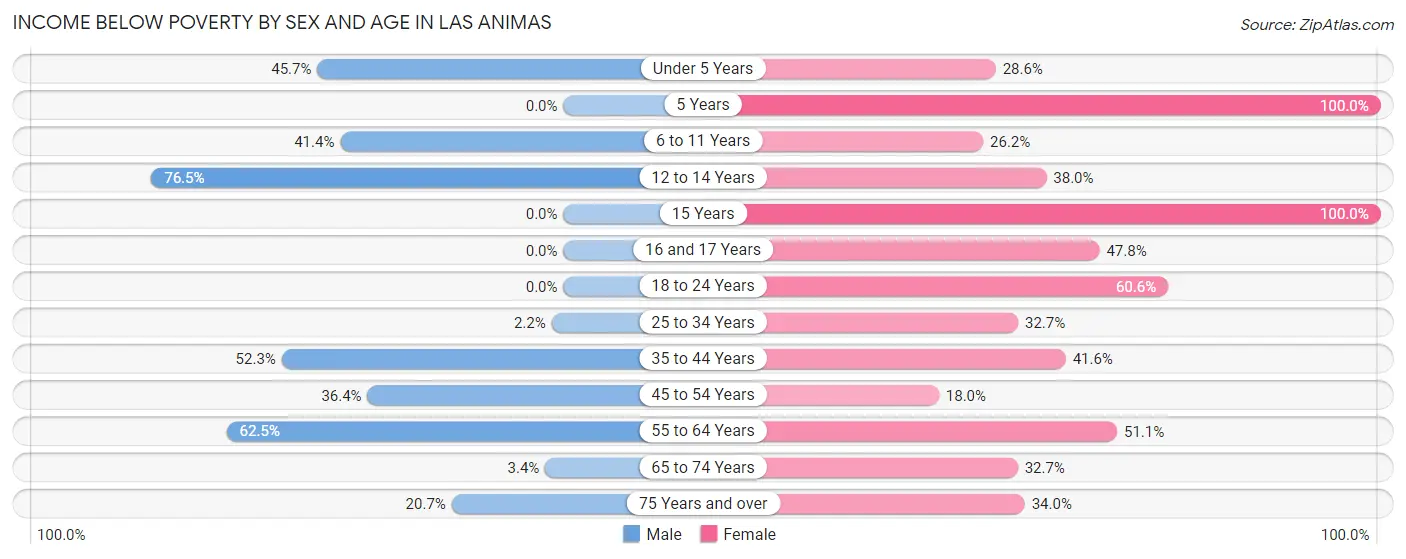
| Age Bracket | Male | Female |
| Under 5 Years | 58 (45.7%) | 14 (28.6%) |
| 5 Years | 0 (0.0%) | 17 (100.0%) |
| 6 to 11 Years | 41 (41.4%) | 32 (26.2%) |
| 12 to 14 Years | 26 (76.5%) | 30 (38.0%) |
| 15 Years | 0 (0.0%) | 15 (100.0%) |
| 16 and 17 Years | 0 (0.0%) | 11 (47.8%) |
| 18 to 24 Years | 0 (0.0%) | 66 (60.6%) |
| 25 to 34 Years | 4 (2.2%) | 53 (32.7%) |
| 35 to 44 Years | 80 (52.3%) | 64 (41.6%) |
| 45 to 54 Years | 24 (36.4%) | 20 (18.0%) |
| 55 to 64 Years | 85 (62.5%) | 70 (51.1%) |
| 65 to 74 Years | 6 (3.4%) | 48 (32.7%) |
| 75 Years and over | 17 (20.7%) | 36 (34.0%) |
| Total | 341 (30.1%) | 476 (38.7%) |
Income Above Poverty by Sex and Age in Las Animas
According to the poverty statistics in Las Animas, males aged 16 and 17 years and females aged 45 to 54 years are the age groups that are most secure financially, with 100.0% of males and 82.0% of females in these age groups living above the poverty line.
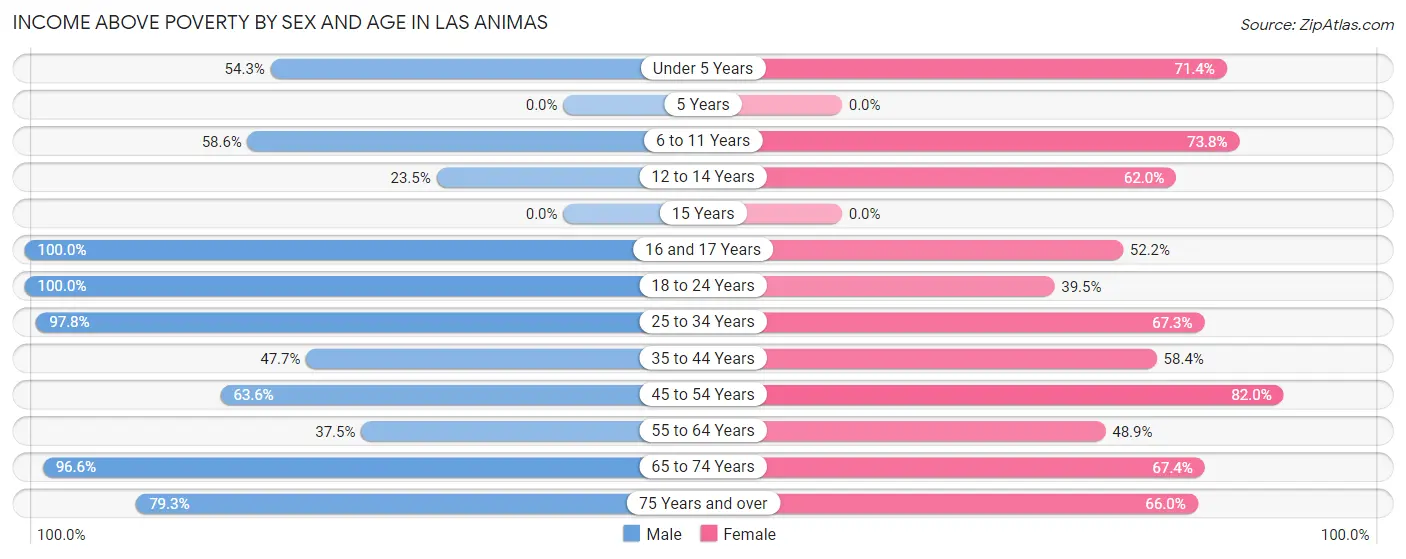
| Age Bracket | Male | Female |
| Under 5 Years | 69 (54.3%) | 35 (71.4%) |
| 5 Years | 0 (0.0%) | 0 (0.0%) |
| 6 to 11 Years | 58 (58.6%) | 90 (73.8%) |
| 12 to 14 Years | 8 (23.5%) | 49 (62.0%) |
| 15 Years | 0 (0.0%) | 0 (0.0%) |
| 16 and 17 Years | 28 (100.0%) | 12 (52.2%) |
| 18 to 24 Years | 48 (100.0%) | 43 (39.5%) |
| 25 to 34 Years | 179 (97.8%) | 109 (67.3%) |
| 35 to 44 Years | 73 (47.7%) | 90 (58.4%) |
| 45 to 54 Years | 42 (63.6%) | 91 (82.0%) |
| 55 to 64 Years | 51 (37.5%) | 67 (48.9%) |
| 65 to 74 Years | 172 (96.6%) | 99 (67.3%) |
| 75 Years and over | 65 (79.3%) | 70 (66.0%) |
| Total | 793 (69.9%) | 755 (61.3%) |
Income Below Poverty Among Married-Couple Families in Las Animas
The poverty statistics for married-couple families in Las Animas show that 20.0% or 76 of the total 380 families live below the poverty line. Families with 3 or 4 children have the highest poverty rate of 64.9%, comprising of 37 families. On the other hand, families with no children have the lowest poverty rate of 11.3%, which includes 17 families.
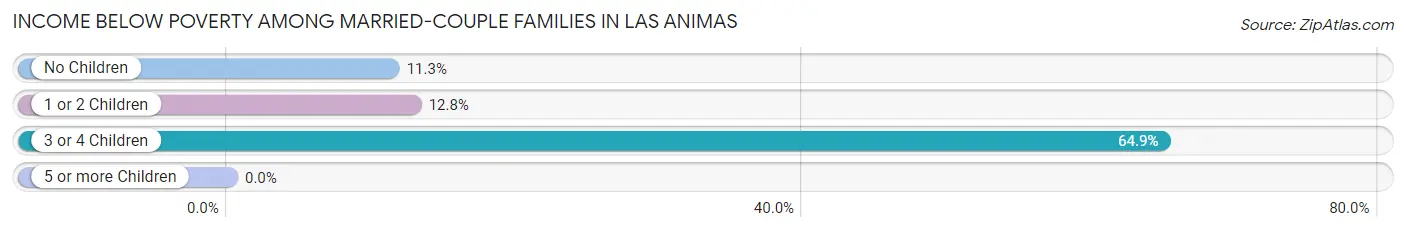
| Children | Above Poverty | Below Poverty |
| No Children | 134 (88.7%) | 17 (11.3%) |
| 1 or 2 Children | 150 (87.2%) | 22 (12.8%) |
| 3 or 4 Children | 20 (35.1%) | 37 (64.9%) |
| 5 or more Children | 0 (0.0%) | 0 (0.0%) |
| Total | 304 (80.0%) | 76 (20.0%) |
Income Below Poverty Among Single-Parent Households in Las Animas
According to the poverty data in Las Animas, 16.1% or 5 single-father households and 70.2% or 127 single-mother households are living below the poverty line. Among single-father households, those with 3 or 4 children have the highest poverty rate, with 3 households (100.0%) experiencing poverty. Likewise, among single-mother households, those with 3 or 4 children have the highest poverty rate, with 34 households (100.0%) falling below the poverty line.
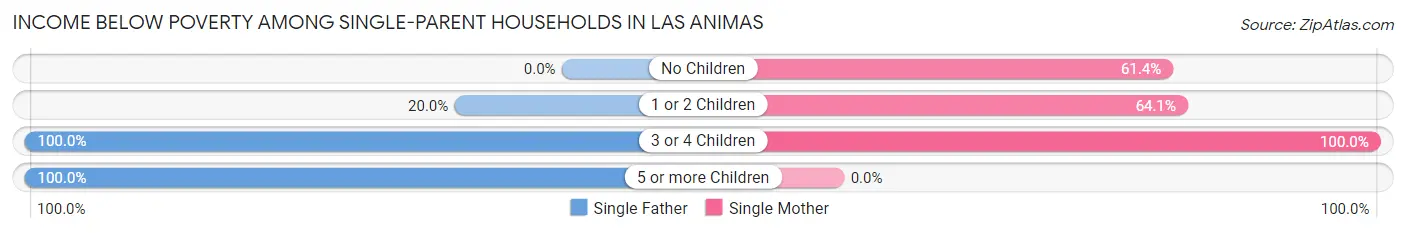
| Children | Single Father | Single Mother |
| No Children | 0 (0.0%) | 27 (61.4%) |
| 1 or 2 Children | 1 (20.0%) | 66 (64.1%) |
| 3 or 4 Children | 3 (100.0%) | 34 (100.0%) |
| 5 or more Children | 1 (100.0%) | 0 (0.0%) |
| Total | 5 (16.1%) | 127 (70.2%) |
Income Below Poverty Among Married-Couple vs Single-Parent Households in Las Animas
The poverty data for Las Animas shows that 76 of the married-couple family households (20.0%) and 132 of the single-parent households (62.3%) are living below the poverty level. Within the married-couple family households, those with 3 or 4 children have the highest poverty rate, with 37 households (64.9%) falling below the poverty line. Among the single-parent households, those with 3 or 4 children have the highest poverty rate, with 37 household (100.0%) living below poverty.
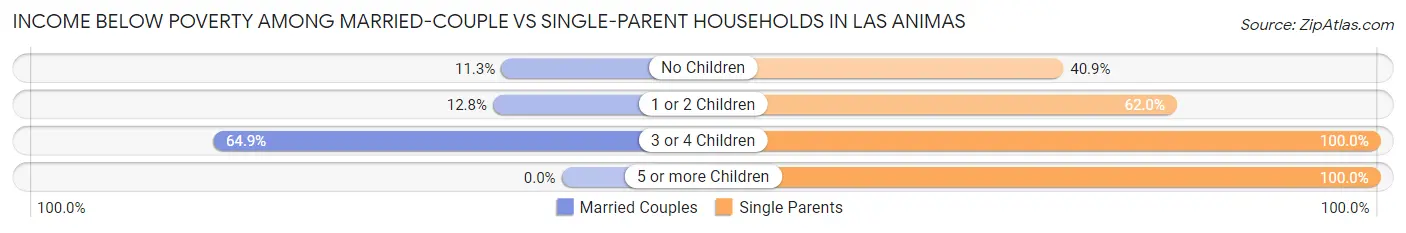
| Children | Married-Couple Families | Single-Parent Households |
| No Children | 17 (11.3%) | 27 (40.9%) |
| 1 or 2 Children | 22 (12.8%) | 67 (62.0%) |
| 3 or 4 Children | 37 (64.9%) | 37 (100.0%) |
| 5 or more Children | 0 (0.0%) | 1 (100.0%) |
| Total | 76 (20.0%) | 132 (62.3%) |
Race in Las Animas
The most populous races in Las Animas are White / Caucasian (1,642 | 67.8%), Hispanic or Latino (1,131 | 46.7%), and Two or more Races (331 | 13.7%).
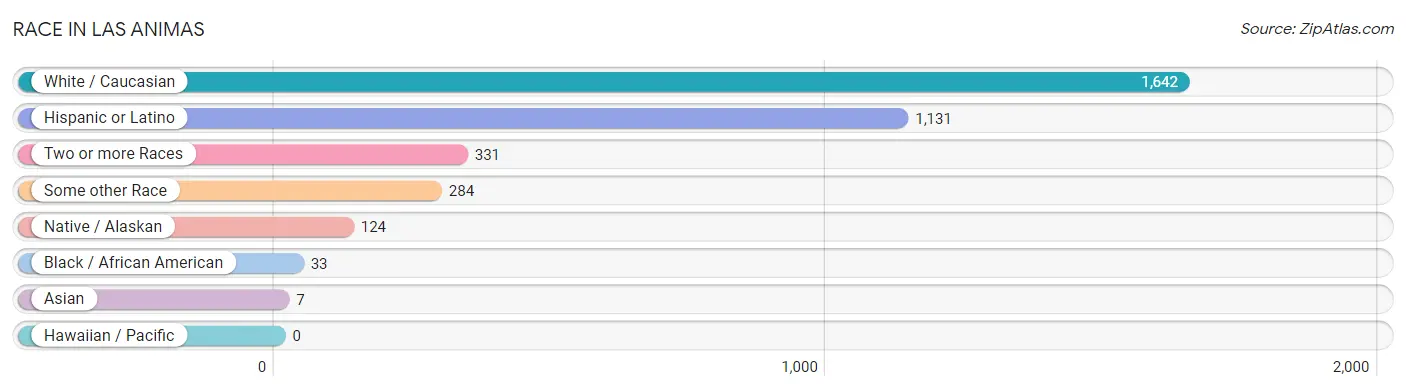
| Race | # Population | % Population |
| Asian | 7 | 0.3% |
| Black / African American | 33 | 1.4% |
| Hawaiian / Pacific | 0 | 0.0% |
| Hispanic or Latino | 1,131 | 46.7% |
| Native / Alaskan | 124 | 5.1% |
| White / Caucasian | 1,642 | 67.8% |
| Two or more Races | 331 | 13.7% |
| Some other Race | 284 | 11.7% |
| Total | 2,421 | 100.0% |
Ancestry in Las Animas
The most populous ancestries reported in Las Animas are Mexican (864 | 35.7%), German (213 | 8.8%), English (129 | 5.3%), American (119 | 4.9%), and Chippewa (91 | 3.8%), together accounting for 58.5% of all Las Animas residents.
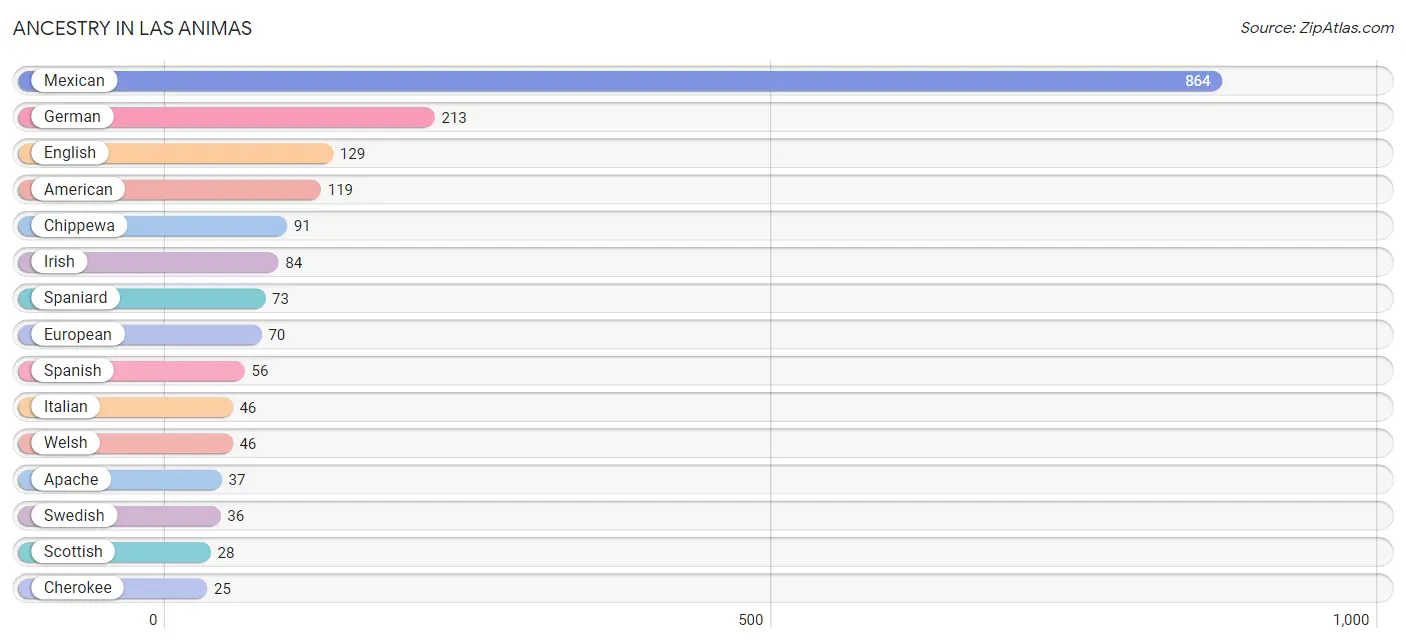
| Ancestry | # Population | % Population |
| American | 119 | 4.9% |
| Apache | 37 | 1.5% |
| Austrian | 4 | 0.2% |
| Bhutanese | 8 | 0.3% |
| Blackfeet | 8 | 0.3% |
| British | 4 | 0.2% |
| Cherokee | 25 | 1.0% |
| Chippewa | 91 | 3.8% |
| Comanche | 11 | 0.4% |
| Czech | 4 | 0.2% |
| English | 129 | 5.3% |
| European | 70 | 2.9% |
| French | 20 | 0.8% |
| German | 213 | 8.8% |
| Hopi | 3 | 0.1% |
| Irish | 84 | 3.5% |
| Italian | 46 | 1.9% |
| Korean | 7 | 0.3% |
| Mexican | 864 | 35.7% |
| Mexican American Indian | 4 | 0.2% |
| Navajo | 6 | 0.3% |
| Norwegian | 7 | 0.3% |
| Polish | 5 | 0.2% |
| Pueblo | 11 | 0.4% |
| Russian | 25 | 1.0% |
| Scandinavian | 6 | 0.3% |
| Scotch-Irish | 6 | 0.3% |
| Scottish | 28 | 1.2% |
| Sioux | 13 | 0.5% |
| Spaniard | 73 | 3.0% |
| Spanish | 56 | 2.3% |
| Swedish | 36 | 1.5% |
| Welsh | 46 | 1.9% | View All 33 Rows |
Immigrants in Las Animas
The most numerous immigrant groups reported in Las Animas came from Central America (13 | 0.5%), Latin America (13 | 0.5%), Mexico (13 | 0.5%), Asia (7 | 0.3%), and Philippines (7 | 0.3%), together accounting for 2.2% of all Las Animas residents.
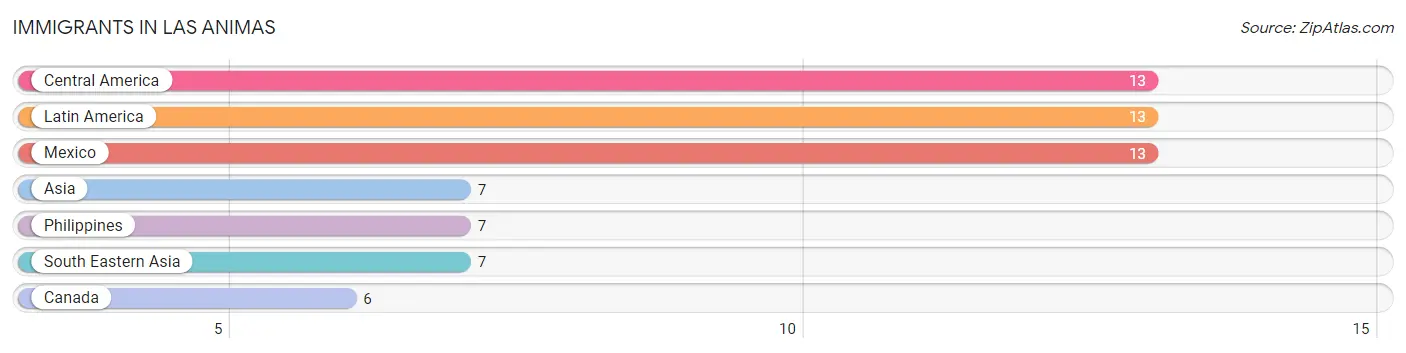
| Immigration Origin | # Population | % Population |
| Asia | 7 | 0.3% |
| Canada | 6 | 0.3% |
| Central America | 13 | 0.5% |
| Latin America | 13 | 0.5% |
| Mexico | 13 | 0.5% |
| Philippines | 7 | 0.3% |
| South Eastern Asia | 7 | 0.3% | View All 7 Rows |
Sex and Age in Las Animas
Sex and Age in Las Animas
The most populous age groups in Las Animas are 30 to 34 Years (143 | 12.3%) for men and 5 to 9 Years (116 | 9.2%) for women.
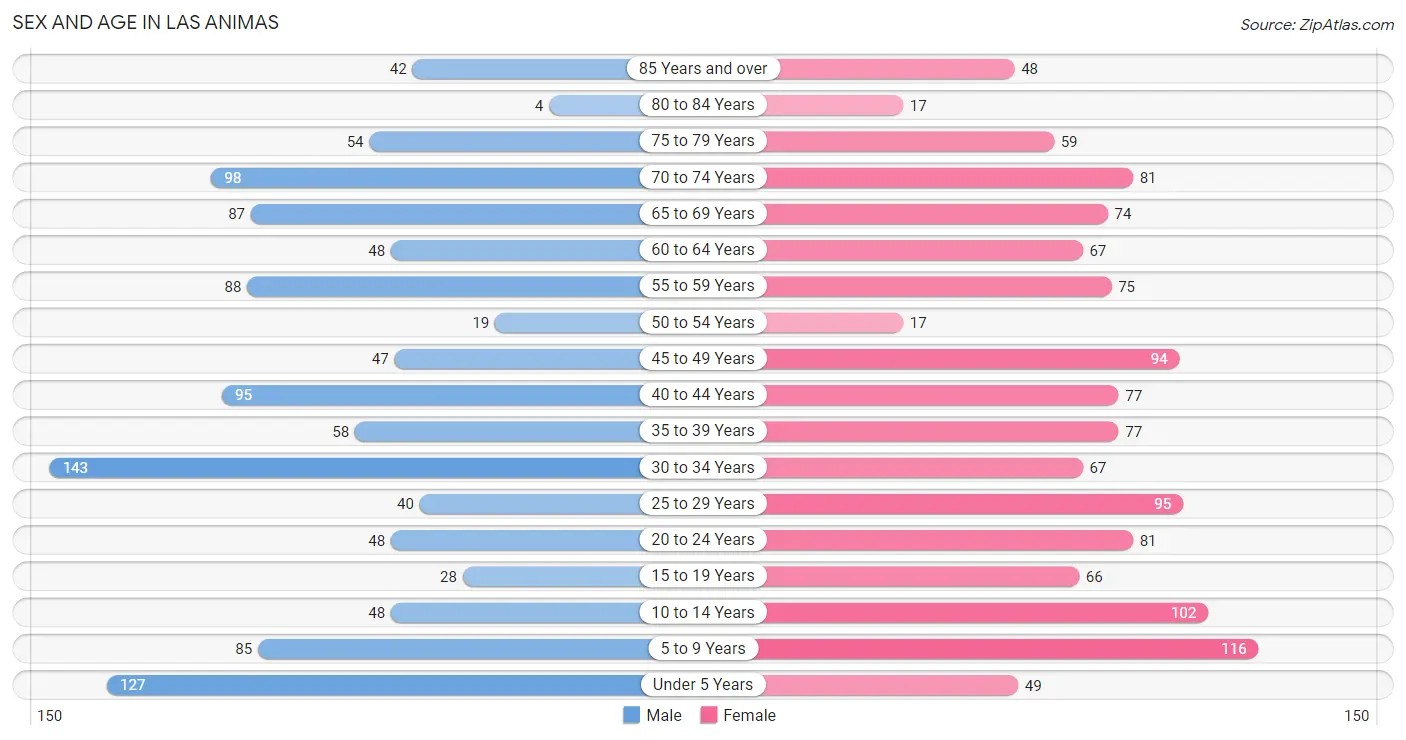
| Age Bracket | Male | Female |
| Under 5 Years | 127 (11.0%) | 49 (3.9%) |
| 5 to 9 Years | 85 (7.3%) | 116 (9.2%) |
| 10 to 14 Years | 48 (4.1%) | 102 (8.1%) |
| 15 to 19 Years | 28 (2.4%) | 66 (5.2%) |
| 20 to 24 Years | 48 (4.1%) | 81 (6.4%) |
| 25 to 29 Years | 40 (3.5%) | 95 (7.5%) |
| 30 to 34 Years | 143 (12.3%) | 67 (5.3%) |
| 35 to 39 Years | 58 (5.0%) | 77 (6.1%) |
| 40 to 44 Years | 95 (8.2%) | 77 (6.1%) |
| 45 to 49 Years | 47 (4.1%) | 94 (7.4%) |
| 50 to 54 Years | 19 (1.6%) | 17 (1.3%) |
| 55 to 59 Years | 88 (7.6%) | 75 (5.9%) |
| 60 to 64 Years | 48 (4.1%) | 67 (5.3%) |
| 65 to 69 Years | 87 (7.5%) | 74 (5.9%) |
| 70 to 74 Years | 98 (8.5%) | 81 (6.4%) |
| 75 to 79 Years | 54 (4.7%) | 59 (4.7%) |
| 80 to 84 Years | 4 (0.4%) | 17 (1.3%) |
| 85 Years and over | 42 (3.6%) | 48 (3.8%) |
| Total | 1,159 (100.0%) | 1,262 (100.0%) |
Families and Households in Las Animas
Median Family Size in Las Animas
The median family size in Las Animas is 2.94 persons per family, with married-couple families (380 | 64.2%) accounting for the largest median family size of 3.34 persons per family. On the other hand, single female/mother families (181 | 30.6%) represent the smallest median family size with 2.14 persons per family.
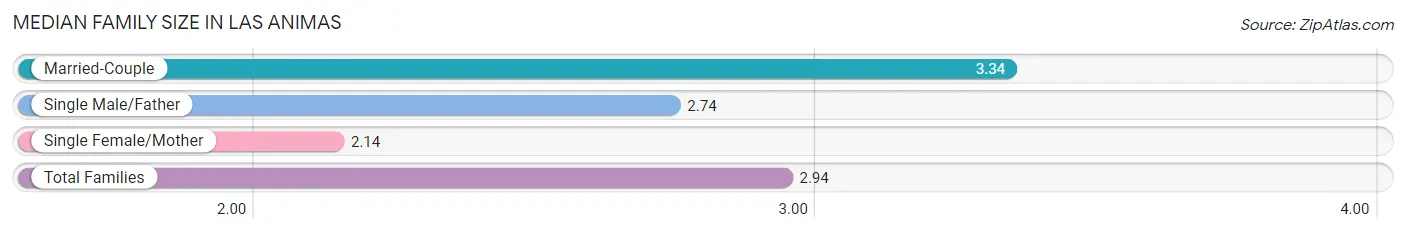
| Family Type | # Families | Family Size |
| Married-Couple | 380 (64.2%) | 3.34 |
| Single Male/Father | 31 (5.2%) | 2.74 |
| Single Female/Mother | 181 (30.6%) | 2.14 |
| Total Families | 592 (100.0%) | 2.94 |
Median Household Size in Las Animas
The median household size in Las Animas is 2.22 persons per household, with married-couple households (380 | 36.6%) accounting for the largest median household size of 3.34 persons per household. non-family households (445 | 42.9%) represent the smallest median household size with 1.16 persons per household.
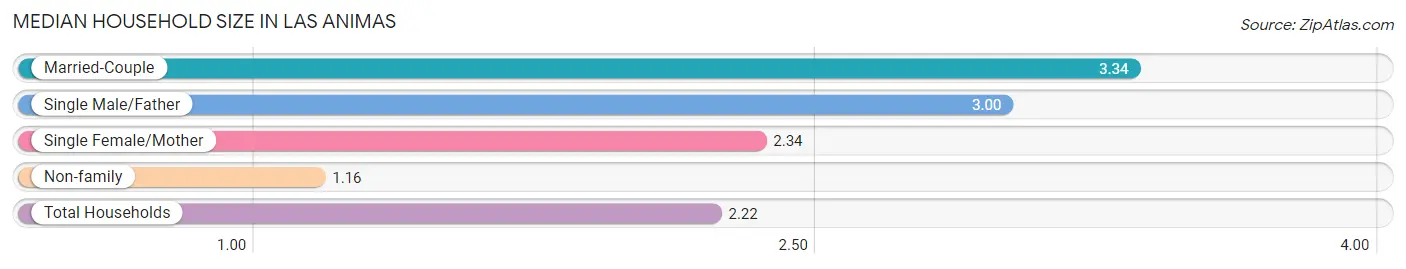
| Household Type | # Households | Household Size |
| Married-Couple | 380 (36.6%) | 3.34 |
| Single Male/Father | 31 (3.0%) | 3.00 |
| Single Female/Mother | 181 (17.4%) | 2.34 |
| Non-family | 445 (42.9%) | 1.16 |
| Total Households | 1,037 (100.0%) | 2.22 |
Household Size by Marriage Status in Las Animas
Out of a total of 1,037 households in Las Animas, 592 (57.1%) are family households, while 445 (42.9%) are nonfamily households. The most numerous type of family households are 2-person households, comprising 200, and the most common type of nonfamily households are 1-person households, comprising 385.
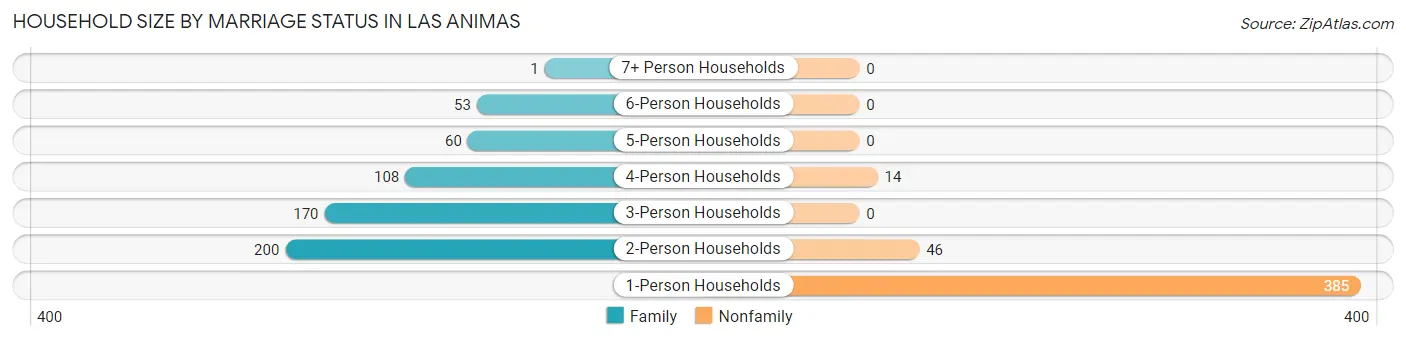
| Household Size | Family Households | Nonfamily Households |
| 1-Person Households | - | 385 (37.1%) |
| 2-Person Households | 200 (19.3%) | 46 (4.4%) |
| 3-Person Households | 170 (16.4%) | 0 (0.0%) |
| 4-Person Households | 108 (10.4%) | 14 (1.3%) |
| 5-Person Households | 60 (5.8%) | 0 (0.0%) |
| 6-Person Households | 53 (5.1%) | 0 (0.0%) |
| 7+ Person Households | 1 (0.1%) | 0 (0.0%) |
| Total | 592 (57.1%) | 445 (42.9%) |
Female Fertility in Las Animas
Fertility by Age in Las Animas
Average fertility rate in Las Animas is 41.0 births per 1,000 women. Women in the age bracket of 20 to 34 years have the highest fertility rate with 95.0 births per 1,000 women. Women in the age bracket of 20 to 34 years acount for 100.0% of all women with births.
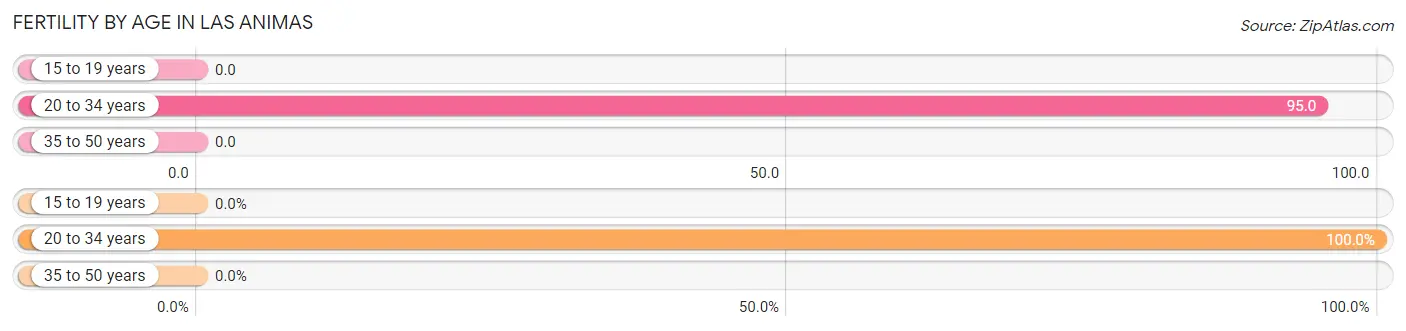
| Age Bracket | Women with Births | Births / 1,000 Women |
| 15 to 19 years | 0 (0.0%) | 0.0 |
| 20 to 34 years | 23 (100.0%) | 95.0 |
| 35 to 50 years | 0 (0.0%) | 0.0 |
| Total | 23 (100.0%) | 41.0 |
Fertility by Age by Marriage Status in Las Animas
30.4% of women with births (23) in Las Animas are married. The highest percentage of unmarried women with births falls into 20 to 34 years age bracket with 69.6% of them unmarried at the time of birth, while the lowest percentage of unmarried women with births belong to 20 to 34 years age bracket with 69.6% of them unmarried.
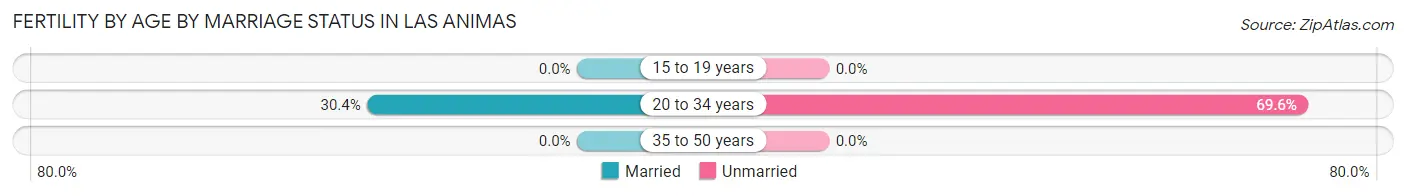
| Age Bracket | Married | Unmarried |
| 15 to 19 years | 0 (0.0%) | 0 (0.0%) |
| 20 to 34 years | 7 (30.4%) | 16 (69.6%) |
| 35 to 50 years | 0 (0.0%) | 0 (0.0%) |
| Total | 7 (30.4%) | 16 (69.6%) |
Fertility by Education in Las Animas
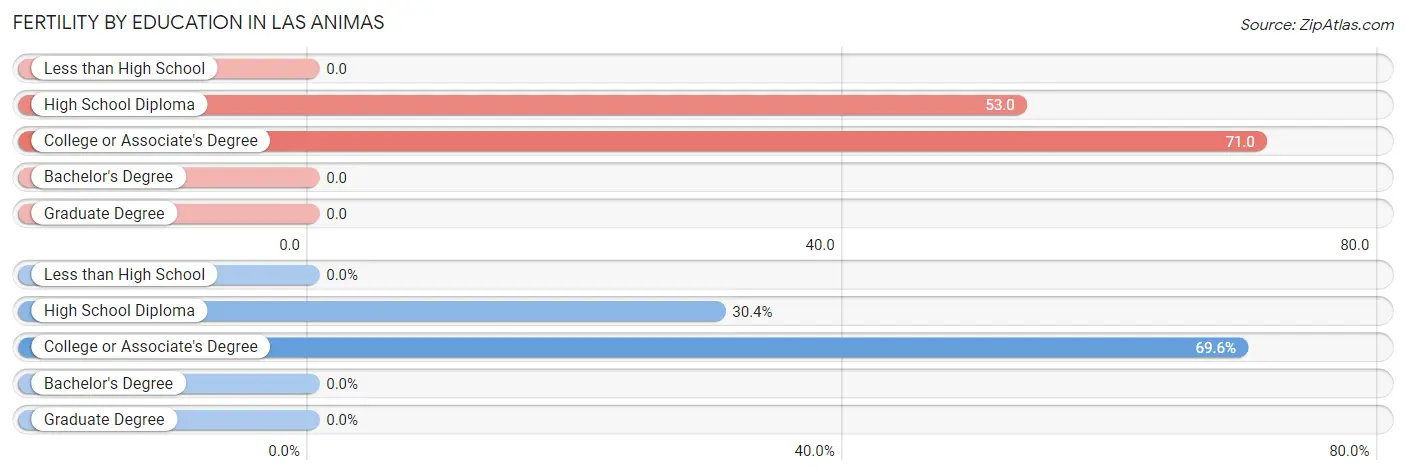
| Educational Attainment | Women with Births | Births / 1,000 Women |
| Less than High School | 0 (0.0%) | 0.0 |
| High School Diploma | 7 (30.4%) | 53.0 |
| College or Associate's Degree | 16 (69.6%) | 71.0 |
| Bachelor's Degree | 0 (0.0%) | 0.0 |
| Graduate Degree | 0 (0.0%) | 0.0 |
| Total | 23 (100.0%) | 41.0 |
Fertility by Education by Marriage Status in Las Animas
69.6% of women with births in Las Animas are unmarried. Women with the educational attainment of high school diploma are most likely to be married with 100.0% of them married at childbirth, while women with the educational attainment of college or associate's degree are least likely to be married with 100.0% of them unmarried at childbirth.
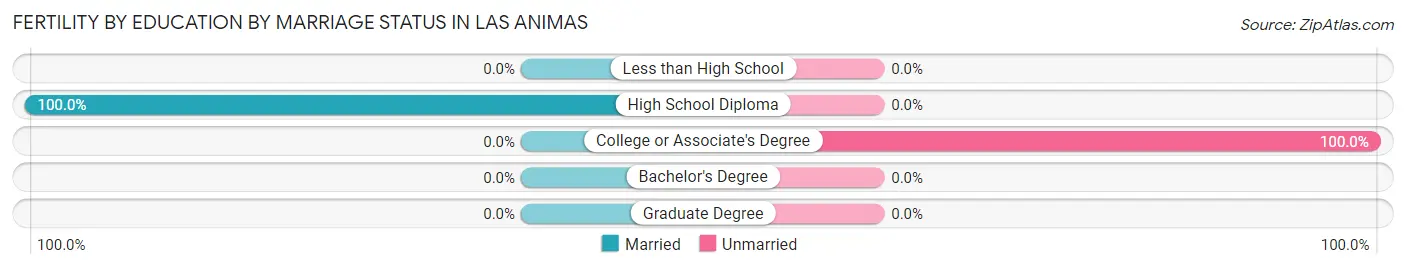
| Educational Attainment | Married | Unmarried |
| Less than High School | 0 (0.0%) | 0 (0.0%) |
| High School Diploma | 7 (100.0%) | 0 (0.0%) |
| College or Associate's Degree | 0 (0.0%) | 16 (100.0%) |
| Bachelor's Degree | 0 (0.0%) | 0 (0.0%) |
| Graduate Degree | 0 (0.0%) | 0 (0.0%) |
| Total | 7 (30.4%) | 16 (69.6%) |
Employment Characteristics in Las Animas
Employment by Class of Employer in Las Animas
Among the 832 employed individuals in Las Animas, private company employees (408 | 49.0%), local government employees (183 | 22.0%), and not-for-profit organizations (111 | 13.3%) make up the most common classes of employment.
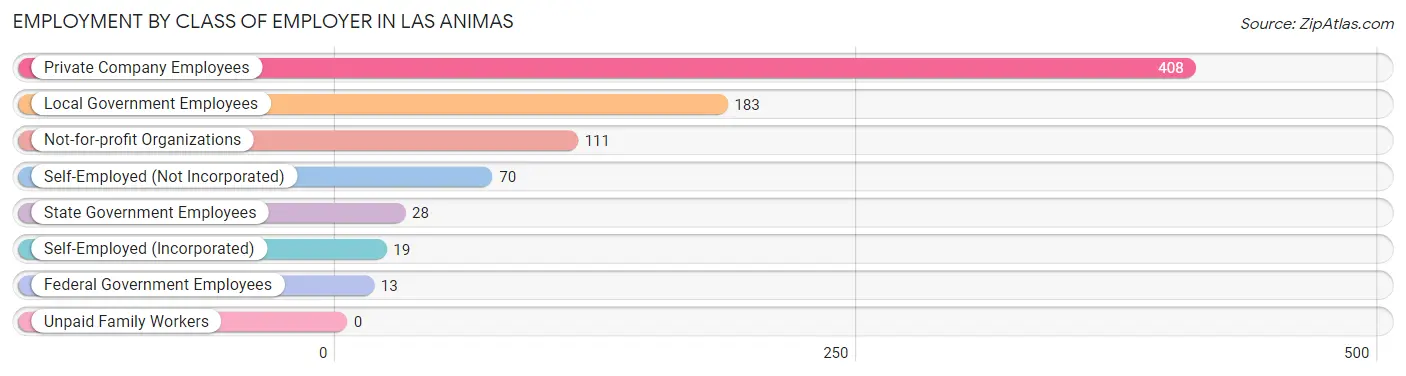
| Employer Class | # Employees | % Employees |
| Private Company Employees | 408 | 49.0% |
| Self-Employed (Incorporated) | 19 | 2.3% |
| Self-Employed (Not Incorporated) | 70 | 8.4% |
| Not-for-profit Organizations | 111 | 13.3% |
| Local Government Employees | 183 | 22.0% |
| State Government Employees | 28 | 3.4% |
| Federal Government Employees | 13 | 1.6% |
| Unpaid Family Workers | 0 | 0.0% |
| Total | 832 | 100.0% |
Employment Status by Age in Las Animas
According to the labor force statistics for Las Animas, out of the total population over 16 years of age (1,879), 49.4% or 928 individuals are in the labor force, with 10.3% or 96 of them unemployed. The age group with the highest labor force participation rate is 30 to 34 years, with 95.2% or 200 individuals in the labor force. Within the labor force, the 25 to 29 years age range has the highest percentage of unemployed individuals, with 54.1% or 40 of them being unemployed.
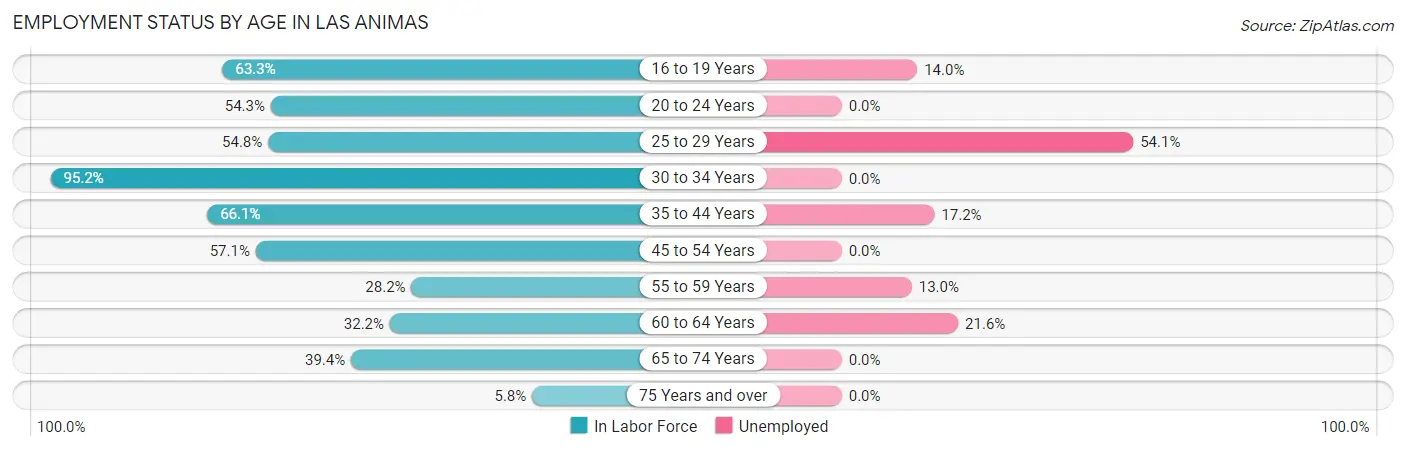
| Age Bracket | In Labor Force | Unemployed |
| 16 to 19 Years | 50 (63.3%) | 7 (14.0%) |
| 20 to 24 Years | 70 (54.3%) | 0 (0.0%) |
| 25 to 29 Years | 74 (54.8%) | 40 (54.1%) |
| 30 to 34 Years | 200 (95.2%) | 0 (0.0%) |
| 35 to 44 Years | 203 (66.1%) | 35 (17.2%) |
| 45 to 54 Years | 101 (57.1%) | 0 (0.0%) |
| 55 to 59 Years | 46 (28.2%) | 6 (13.0%) |
| 60 to 64 Years | 37 (32.2%) | 8 (21.6%) |
| 65 to 74 Years | 134 (39.4%) | 0 (0.0%) |
| 75 Years and over | 13 (5.8%) | 0 (0.0%) |
| Total | 928 (49.4%) | 96 (10.3%) |
Employment Status by Educational Attainment in Las Animas
According to labor force statistics for Las Animas, 59.7% of individuals (661) out of the total population between 25 and 64 years of age (1,107) are in the labor force, with 13.5% or 89 of them being unemployed. The group with the highest labor force participation rate are those with the educational attainment of bachelor's degree or higher, with 86.4% or 121 individuals in the labor force. Within the labor force, individuals with college / associate degree education have the highest percentage of unemployment, with 26.5% or 50 of them being unemployed.
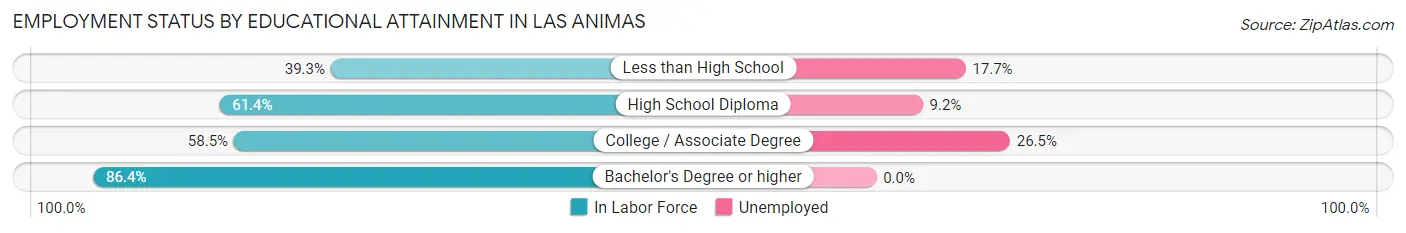
| Educational Attainment | In Labor Force | Unemployed |
| Less than High School | 79 (39.3%) | 36 (17.7%) |
| High School Diploma | 272 (61.4%) | 41 (9.2%) |
| College / Associate Degree | 189 (58.5%) | 86 (26.5%) |
| Bachelor's Degree or higher | 121 (86.4%) | 0 (0.0%) |
| Total | 661 (59.7%) | 149 (13.5%) |
Employment Occupations by Sex in Las Animas
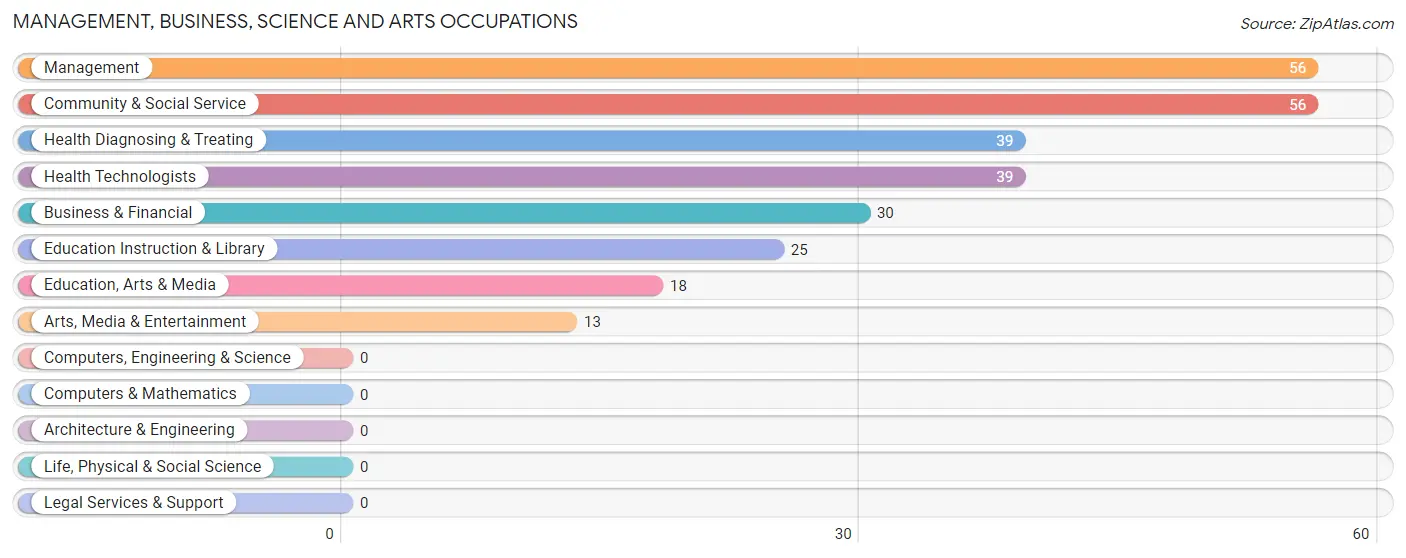
Management, Business, Science and Arts Occupations
The most common Management, Business, Science and Arts occupations in Las Animas are Management (56 | 6.7%), Community & Social Service (56 | 6.7%), Health Diagnosing & Treating (39 | 4.7%), Health Technologists (39 | 4.7%), and Business & Financial (30 | 3.6%).
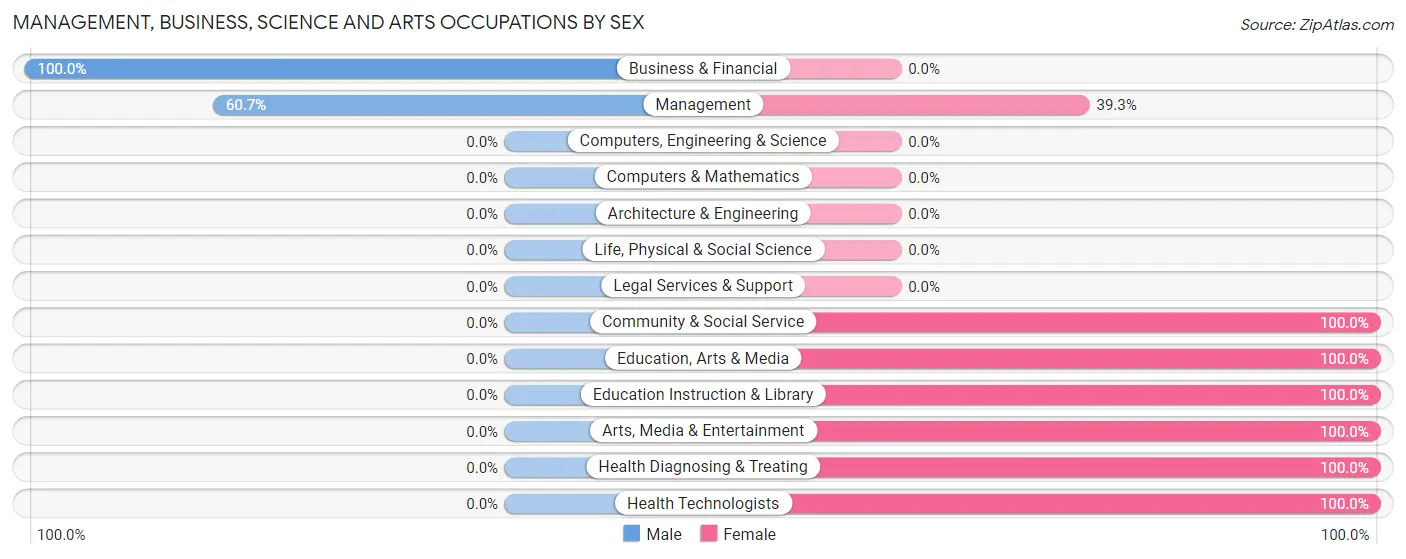
Management, Business, Science and Arts Occupations by Sex
Within the Management, Business, Science and Arts occupations in Las Animas, the most male-oriented occupations are Business & Financial (100.0%), and Management (60.7%), while the most female-oriented occupations are Community & Social Service (100.0%), Education, Arts & Media (100.0%), and Education Instruction & Library (100.0%).
| Occupation | Male | Female |
| Management | 34 (60.7%) | 22 (39.3%) |
| Business & Financial | 30 (100.0%) | 0 (0.0%) |
| Computers, Engineering & Science | 0 (0.0%) | 0 (0.0%) |
| Computers & Mathematics | 0 (0.0%) | 0 (0.0%) |
| Architecture & Engineering | 0 (0.0%) | 0 (0.0%) |
| Life, Physical & Social Science | 0 (0.0%) | 0 (0.0%) |
| Community & Social Service | 0 (0.0%) | 56 (100.0%) |
| Education, Arts & Media | 0 (0.0%) | 18 (100.0%) |
| Legal Services & Support | 0 (0.0%) | 0 (0.0%) |
| Education Instruction & Library | 0 (0.0%) | 25 (100.0%) |
| Arts, Media & Entertainment | 0 (0.0%) | 13 (100.0%) |
| Health Diagnosing & Treating | 0 (0.0%) | 39 (100.0%) |
| Health Technologists | 0 (0.0%) | 39 (100.0%) |
| Total (Category) | 64 (35.4%) | 117 (64.6%) |
| Total (Overall) | 486 (58.4%) | 346 (41.6%) |
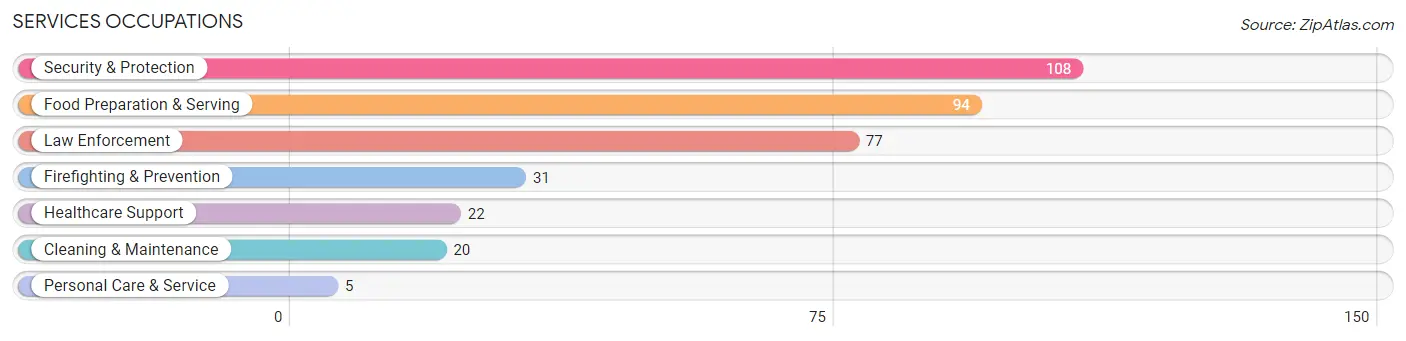
Services Occupations
The most common Services occupations in Las Animas are Security & Protection (108 | 13.0%), Food Preparation & Serving (94 | 11.3%), Law Enforcement (77 | 9.2%), Firefighting & Prevention (31 | 3.7%), and Healthcare Support (22 | 2.6%).
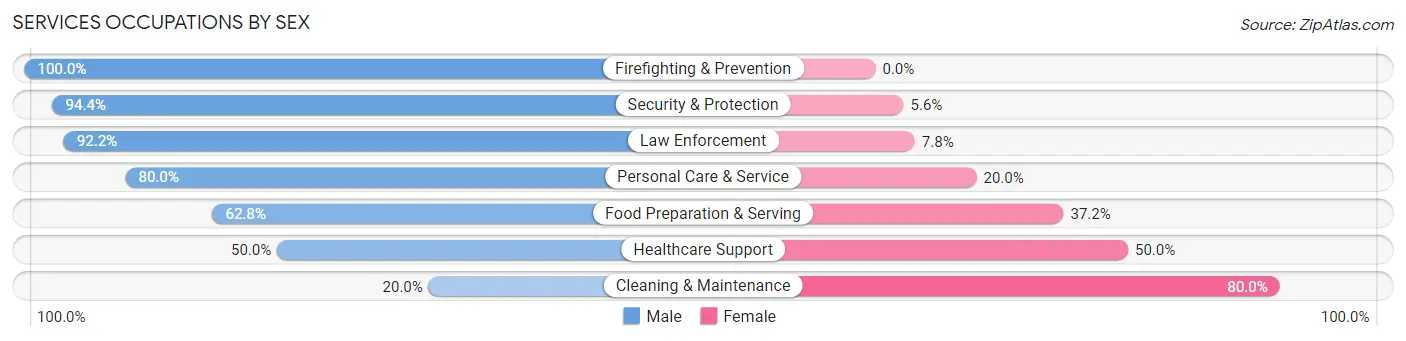
Services Occupations by Sex
Within the Services occupations in Las Animas, the most male-oriented occupations are Firefighting & Prevention (100.0%), Security & Protection (94.4%), and Law Enforcement (92.2%), while the most female-oriented occupations are Cleaning & Maintenance (80.0%), Healthcare Support (50.0%), and Food Preparation & Serving (37.2%).
| Occupation | Male | Female |
| Healthcare Support | 11 (50.0%) | 11 (50.0%) |
| Security & Protection | 102 (94.4%) | 6 (5.6%) |
| Firefighting & Prevention | 31 (100.0%) | 0 (0.0%) |
| Law Enforcement | 71 (92.2%) | 6 (7.8%) |
| Food Preparation & Serving | 59 (62.8%) | 35 (37.2%) |
| Cleaning & Maintenance | 4 (20.0%) | 16 (80.0%) |
| Personal Care & Service | 4 (80.0%) | 1 (20.0%) |
| Total (Category) | 180 (72.3%) | 69 (27.7%) |
| Total (Overall) | 486 (58.4%) | 346 (41.6%) |
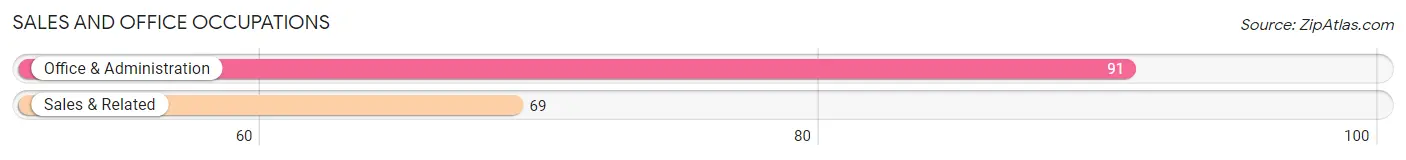
Sales and Office Occupations
The most common Sales and Office occupations in Las Animas are Office & Administration (91 | 10.9%), and Sales & Related (69 | 8.3%).
Sales and Office Occupations by Sex
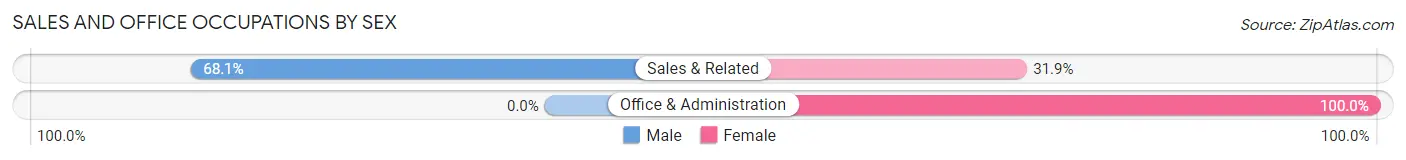
| Occupation | Male | Female |
| Sales & Related | 47 (68.1%) | 22 (31.9%) |
| Office & Administration | 0 (0.0%) | 91 (100.0%) |
| Total (Category) | 47 (29.4%) | 113 (70.6%) |
| Total (Overall) | 486 (58.4%) | 346 (41.6%) |
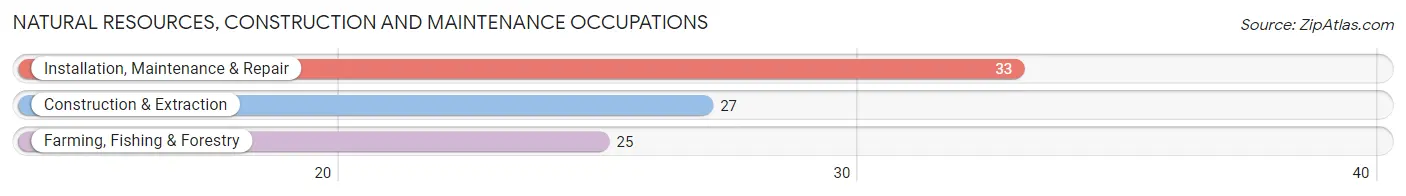
Natural Resources, Construction and Maintenance Occupations
The most common Natural Resources, Construction and Maintenance occupations in Las Animas are Installation, Maintenance & Repair (33 | 4.0%), Construction & Extraction (27 | 3.3%), and Farming, Fishing & Forestry (25 | 3.0%).
Natural Resources, Construction and Maintenance Occupations by Sex
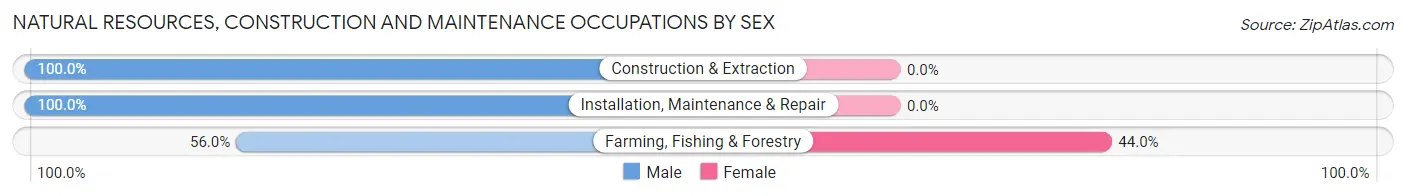
| Occupation | Male | Female |
| Farming, Fishing & Forestry | 14 (56.0%) | 11 (44.0%) |
| Construction & Extraction | 27 (100.0%) | 0 (0.0%) |
| Installation, Maintenance & Repair | 33 (100.0%) | 0 (0.0%) |
| Total (Category) | 74 (87.1%) | 11 (12.9%) |
| Total (Overall) | 486 (58.4%) | 346 (41.6%) |
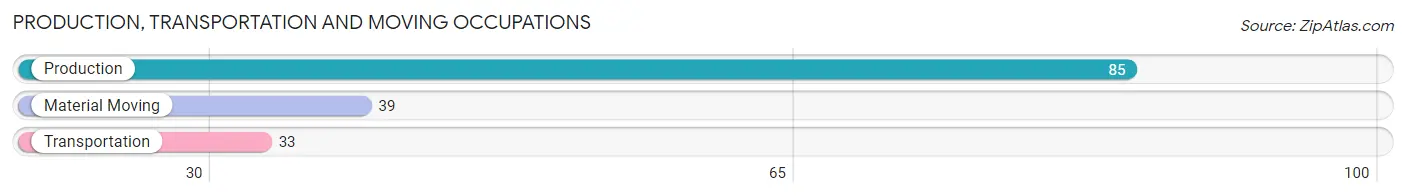
Production, Transportation and Moving Occupations
The most common Production, Transportation and Moving occupations in Las Animas are Production (85 | 10.2%), Material Moving (39 | 4.7%), and Transportation (33 | 4.0%).
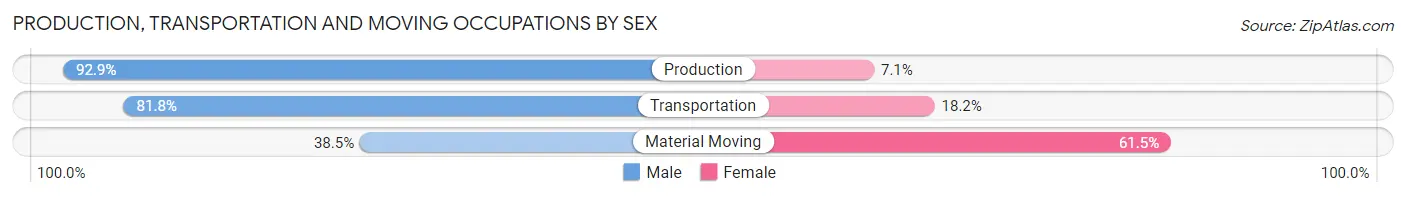
Production, Transportation and Moving Occupations by Sex
| Occupation | Male | Female |
| Production | 79 (92.9%) | 6 (7.1%) |
| Transportation | 27 (81.8%) | 6 (18.2%) |
| Material Moving | 15 (38.5%) | 24 (61.5%) |
| Total (Category) | 121 (77.1%) | 36 (22.9%) |
| Total (Overall) | 486 (58.4%) | 346 (41.6%) |
Employment Industries by Sex in Las Animas
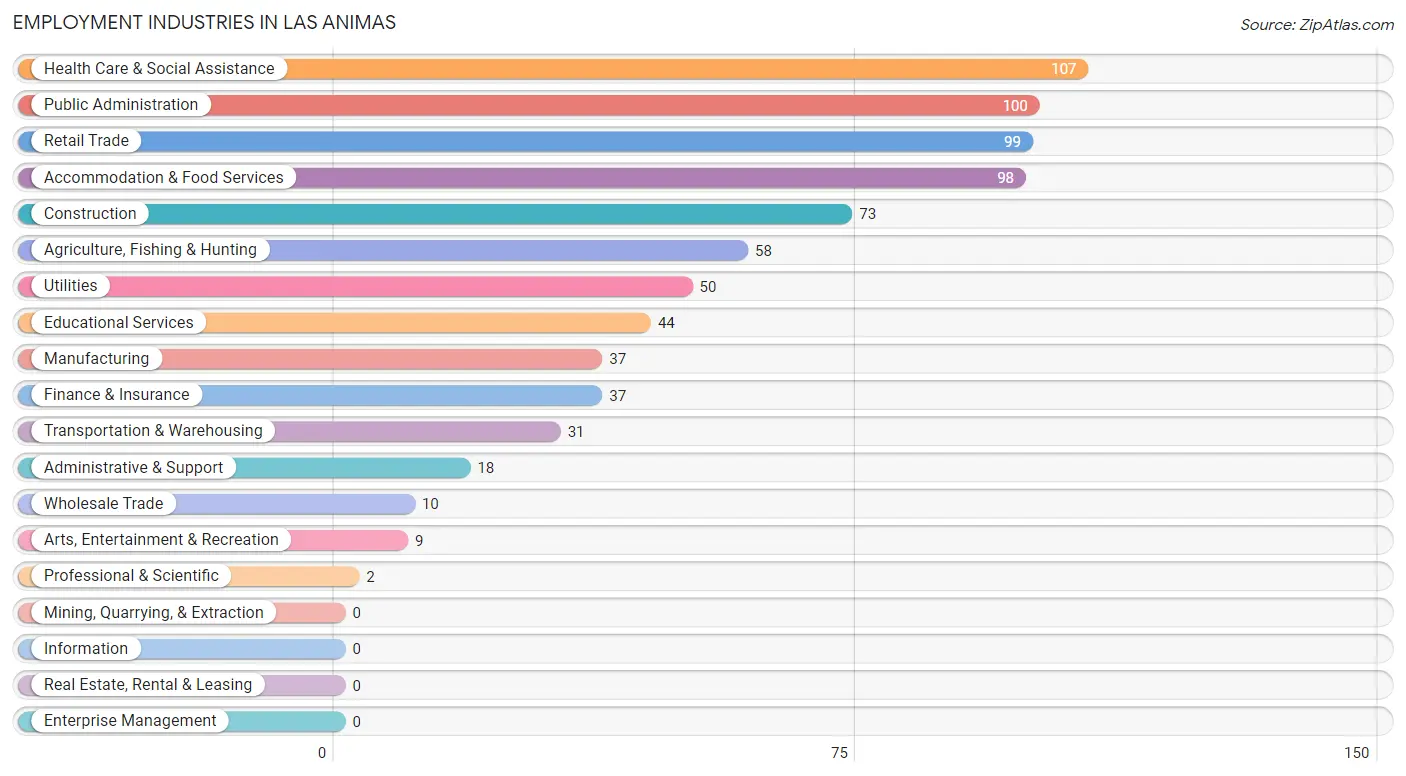
Employment Industries in Las Animas
The major employment industries in Las Animas include Health Care & Social Assistance (107 | 12.9%), Public Administration (100 | 12.0%), Retail Trade (99 | 11.9%), Accommodation & Food Services (98 | 11.8%), and Construction (73 | 8.8%).
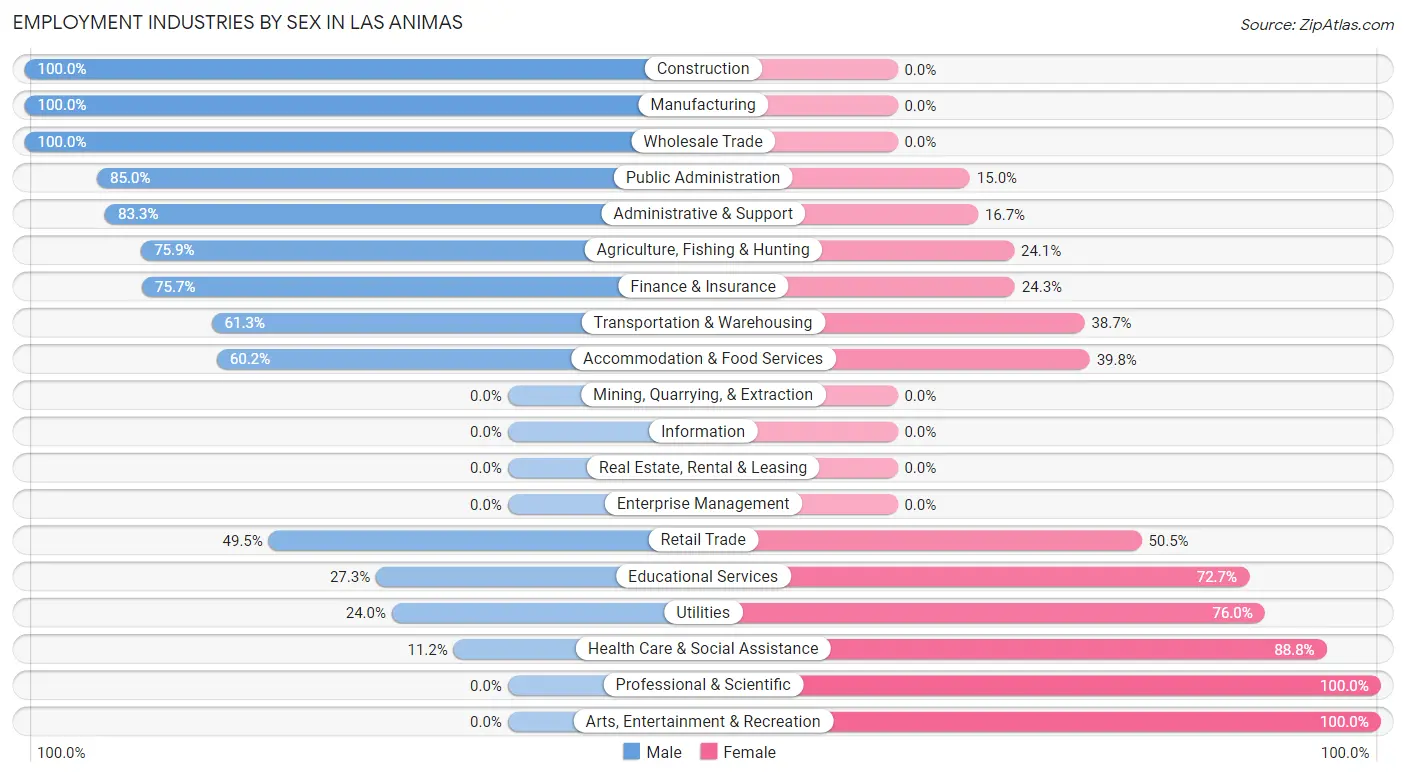
Employment Industries by Sex in Las Animas
The Las Animas industries that see more men than women are Construction (100.0%), Manufacturing (100.0%), and Wholesale Trade (100.0%), whereas the industries that tend to have a higher number of women are Professional & Scientific (100.0%), Arts, Entertainment & Recreation (100.0%), and Health Care & Social Assistance (88.8%).
| Industry | Male | Female |
| Agriculture, Fishing & Hunting | 44 (75.9%) | 14 (24.1%) |
| Mining, Quarrying, & Extraction | 0 (0.0%) | 0 (0.0%) |
| Construction | 73 (100.0%) | 0 (0.0%) |
| Manufacturing | 37 (100.0%) | 0 (0.0%) |
| Wholesale Trade | 10 (100.0%) | 0 (0.0%) |
| Retail Trade | 49 (49.5%) | 50 (50.5%) |
| Transportation & Warehousing | 19 (61.3%) | 12 (38.7%) |
| Utilities | 12 (24.0%) | 38 (76.0%) |
| Information | 0 (0.0%) | 0 (0.0%) |
| Finance & Insurance | 28 (75.7%) | 9 (24.3%) |
| Real Estate, Rental & Leasing | 0 (0.0%) | 0 (0.0%) |
| Professional & Scientific | 0 (0.0%) | 2 (100.0%) |
| Enterprise Management | 0 (0.0%) | 0 (0.0%) |
| Administrative & Support | 15 (83.3%) | 3 (16.7%) |
| Educational Services | 12 (27.3%) | 32 (72.7%) |
| Health Care & Social Assistance | 12 (11.2%) | 95 (88.8%) |
| Arts, Entertainment & Recreation | 0 (0.0%) | 9 (100.0%) |
| Accommodation & Food Services | 59 (60.2%) | 39 (39.8%) |
| Public Administration | 85 (85.0%) | 15 (15.0%) |
| Total | 486 (58.4%) | 346 (41.6%) |
Education in Las Animas
School Enrollment in Las Animas
The most common levels of schooling among the 508 students in Las Animas are elementary school (156 | 30.7%), high school (106 | 20.9%), and middle school (100 | 19.7%).
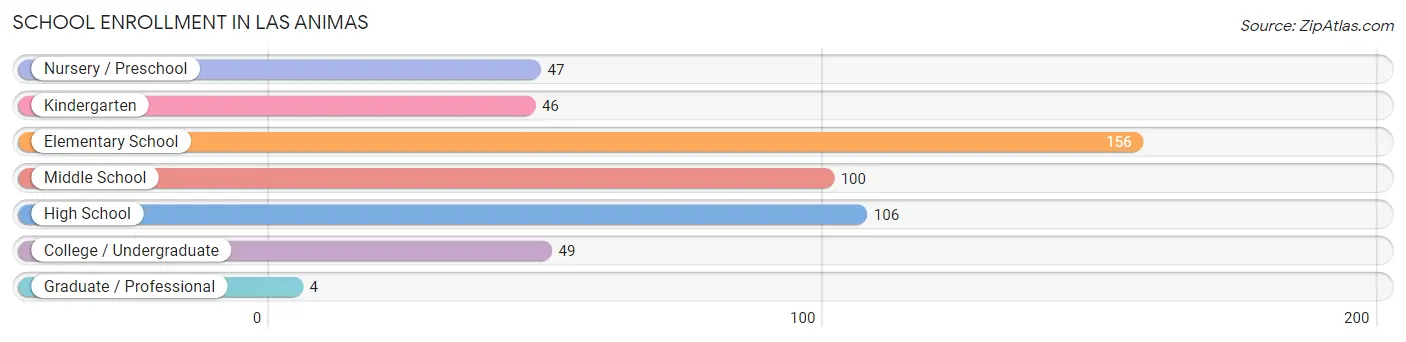
| School Level | # Students | % Students |
| Nursery / Preschool | 47 | 9.2% |
| Kindergarten | 46 | 9.1% |
| Elementary School | 156 | 30.7% |
| Middle School | 100 | 19.7% |
| High School | 106 | 20.9% |
| College / Undergraduate | 49 | 9.7% |
| Graduate / Professional | 4 | 0.8% |
| Total | 508 | 100.0% |
School Enrollment by Age by Funding Source in Las Animas
Out of a total of 508 students who are enrolled in schools in Las Animas, 108 (21.3%) attend a private institution, while the remaining 400 (78.7%) are enrolled in public schools. The age group of 20 to 24 year olds has the highest likelihood of being enrolled in private schools, with 13 (59.1% in the age bracket) enrolled. Conversely, the age group of 3 to 4 year olds has the lowest likelihood of being enrolled in a private school, with 30 (100.0% in the age bracket) attending a public institution.
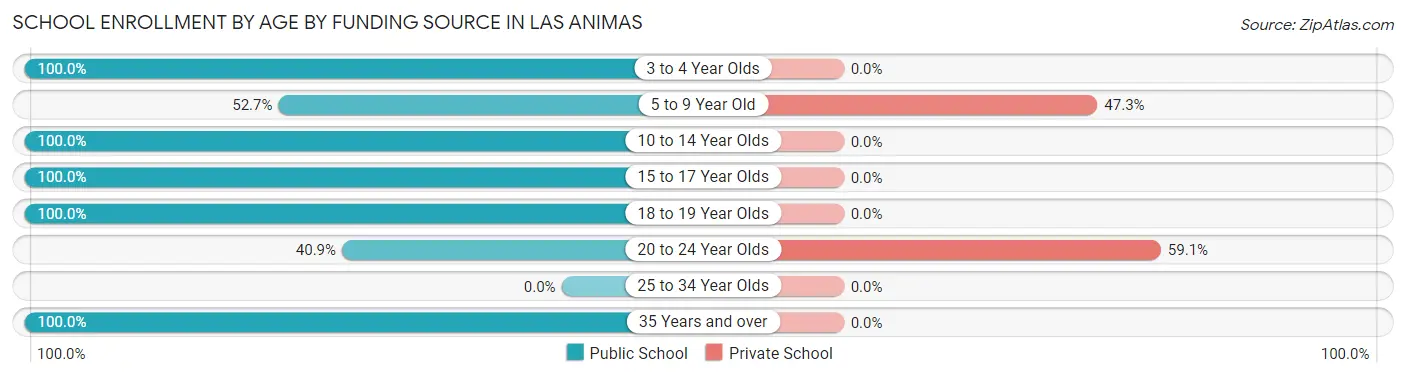
| Age Bracket | Public School | Private School |
| 3 to 4 Year Olds | 30 (100.0%) | 0 (0.0%) |
| 5 to 9 Year Old | 106 (52.7%) | 95 (47.3%) |
| 10 to 14 Year Olds | 150 (100.0%) | 0 (0.0%) |
| 15 to 17 Year Olds | 61 (100.0%) | 0 (0.0%) |
| 18 to 19 Year Olds | 19 (100.0%) | 0 (0.0%) |
| 20 to 24 Year Olds | 9 (40.9%) | 13 (59.1%) |
| 25 to 34 Year Olds | 0 (0.0%) | 0 (0.0%) |
| 35 Years and over | 25 (100.0%) | 0 (0.0%) |
| Total | 400 (78.7%) | 108 (21.3%) |
Educational Attainment by Field of Study in Las Animas
Education (66 | 29.3%), science & technology (54 | 24.0%), liberal arts & history (28 | 12.4%), bio, nature & agricultural (25 | 11.1%), and computers & mathematics (15 | 6.7%) are the most common fields of study among 225 individuals in Las Animas who have obtained a bachelor's degree or higher.
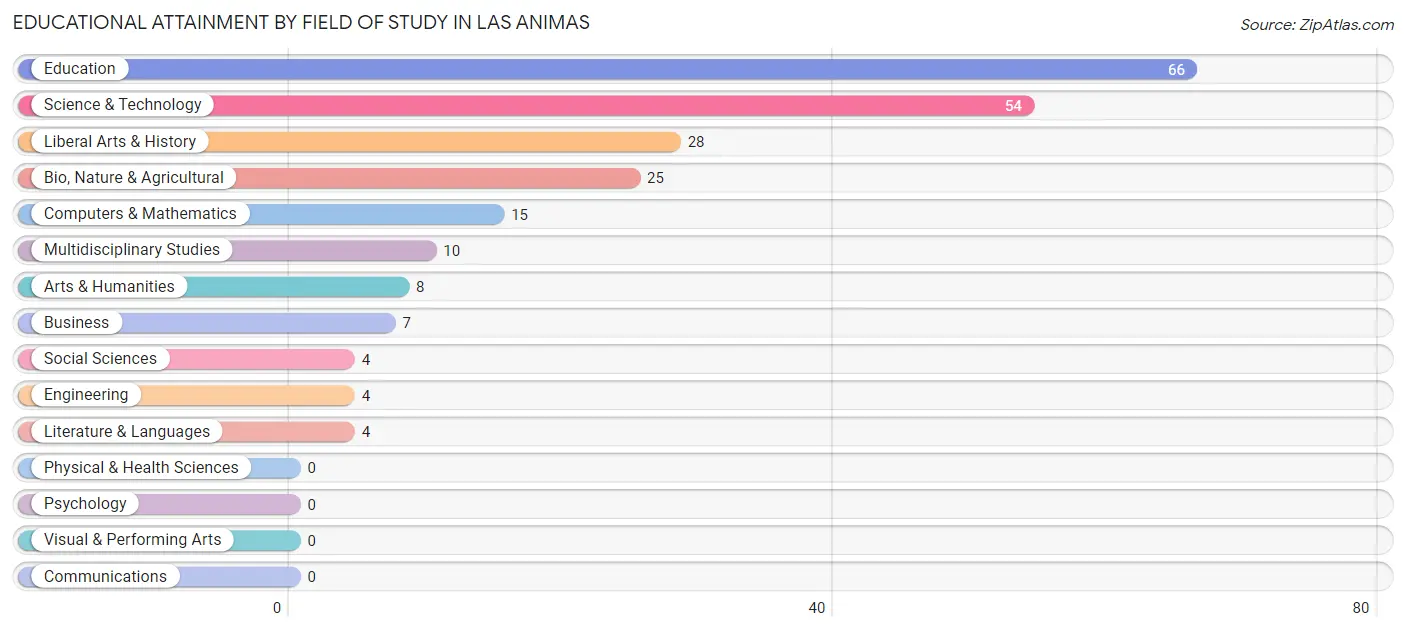
| Field of Study | # Graduates | % Graduates |
| Computers & Mathematics | 15 | 6.7% |
| Bio, Nature & Agricultural | 25 | 11.1% |
| Physical & Health Sciences | 0 | 0.0% |
| Psychology | 0 | 0.0% |
| Social Sciences | 4 | 1.8% |
| Engineering | 4 | 1.8% |
| Multidisciplinary Studies | 10 | 4.4% |
| Science & Technology | 54 | 24.0% |
| Business | 7 | 3.1% |
| Education | 66 | 29.3% |
| Literature & Languages | 4 | 1.8% |
| Liberal Arts & History | 28 | 12.4% |
| Visual & Performing Arts | 0 | 0.0% |
| Communications | 0 | 0.0% |
| Arts & Humanities | 8 | 3.6% |
| Total | 225 | 100.0% |
Transportation & Commute in Las Animas
Vehicle Availability by Sex in Las Animas
The most prevalent vehicle ownership categories in Las Animas are males with 2 vehicles (257, accounting for 52.9%) and females with 2 vehicles (157, making up 74.3%).
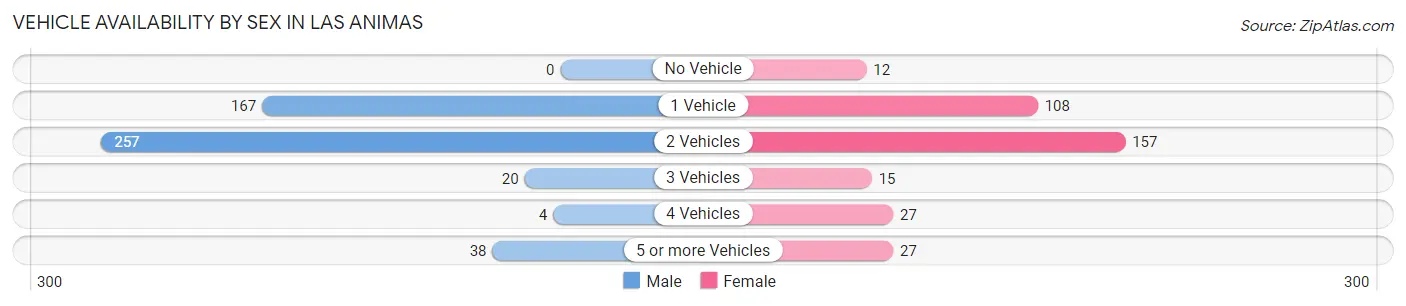
| Vehicles Available | Male | Female |
| No Vehicle | 0 (0.0%) | 12 (3.5%) |
| 1 Vehicle | 167 (34.4%) | 108 (31.2%) |
| 2 Vehicles | 257 (52.9%) | 157 (45.4%) |
| 3 Vehicles | 20 (4.1%) | 15 (4.3%) |
| 4 Vehicles | 4 (0.8%) | 27 (7.8%) |
| 5 or more Vehicles | 38 (7.8%) | 27 (7.8%) |
| Total | 486 (100.0%) | 346 (100.0%) |
Commute Time in Las Animas
The most frequently occuring commute durations in Las Animas are less than 5 minutes (279 commuters, 36.4%), 5 to 9 minutes (175 commuters, 22.8%), and 10 to 14 minutes (96 commuters, 12.5%).
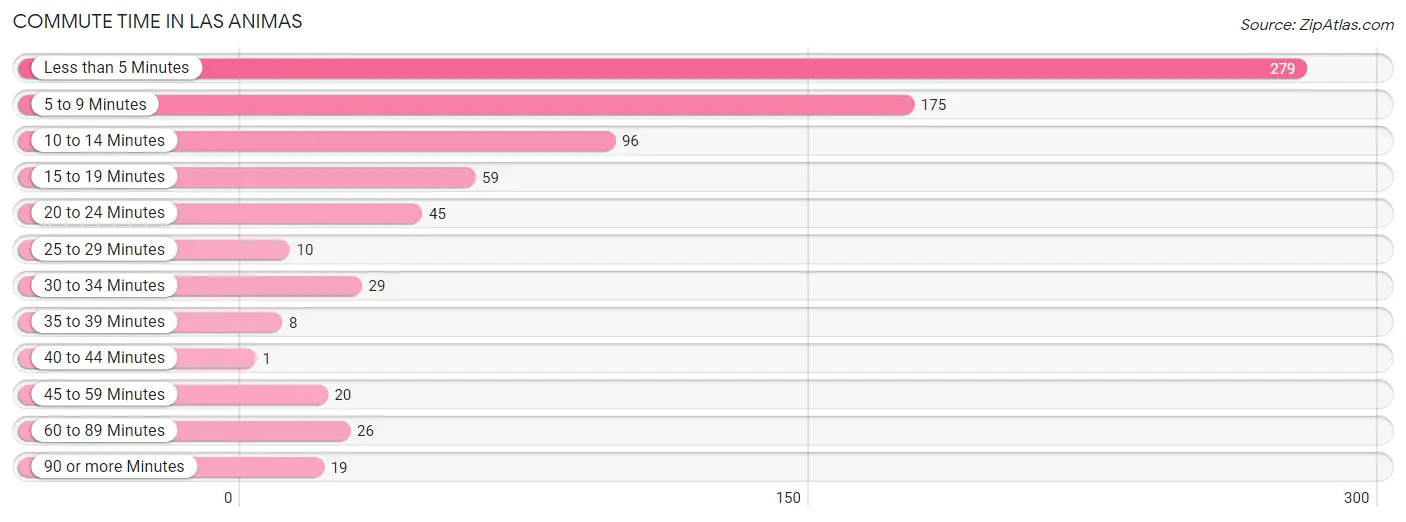
| Commute Time | # Commuters | % Commuters |
| Less than 5 Minutes | 279 | 36.4% |
| 5 to 9 Minutes | 175 | 22.8% |
| 10 to 14 Minutes | 96 | 12.5% |
| 15 to 19 Minutes | 59 | 7.7% |
| 20 to 24 Minutes | 45 | 5.9% |
| 25 to 29 Minutes | 10 | 1.3% |
| 30 to 34 Minutes | 29 | 3.8% |
| 35 to 39 Minutes | 8 | 1.0% |
| 40 to 44 Minutes | 1 | 0.1% |
| 45 to 59 Minutes | 20 | 2.6% |
| 60 to 89 Minutes | 26 | 3.4% |
| 90 or more Minutes | 19 | 2.5% |
Commute Time by Sex in Las Animas
The most common commute times in Las Animas are less than 5 minutes (194 commuters, 41.3%) for males and 5 to 9 minutes (113 commuters, 38.1%) for females.
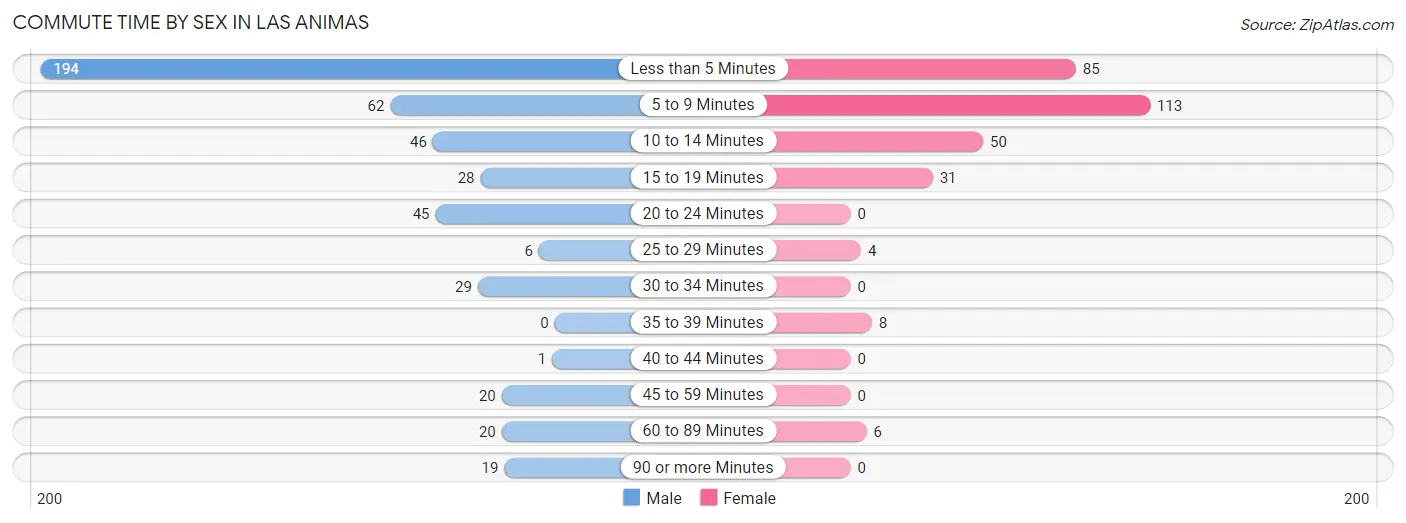
| Commute Time | Male | Female |
| Less than 5 Minutes | 194 (41.3%) | 85 (28.6%) |
| 5 to 9 Minutes | 62 (13.2%) | 113 (38.1%) |
| 10 to 14 Minutes | 46 (9.8%) | 50 (16.8%) |
| 15 to 19 Minutes | 28 (6.0%) | 31 (10.4%) |
| 20 to 24 Minutes | 45 (9.6%) | 0 (0.0%) |
| 25 to 29 Minutes | 6 (1.3%) | 4 (1.3%) |
| 30 to 34 Minutes | 29 (6.2%) | 0 (0.0%) |
| 35 to 39 Minutes | 0 (0.0%) | 8 (2.7%) |
| 40 to 44 Minutes | 1 (0.2%) | 0 (0.0%) |
| 45 to 59 Minutes | 20 (4.3%) | 0 (0.0%) |
| 60 to 89 Minutes | 20 (4.3%) | 6 (2.0%) |
| 90 or more Minutes | 19 (4.0%) | 0 (0.0%) |
Time of Departure to Work by Sex in Las Animas
The most frequent times of departure to work in Las Animas are 7:00 AM to 7:29 AM (134, 28.5%) for males and 7:00 AM to 7:29 AM (71, 23.9%) for females.
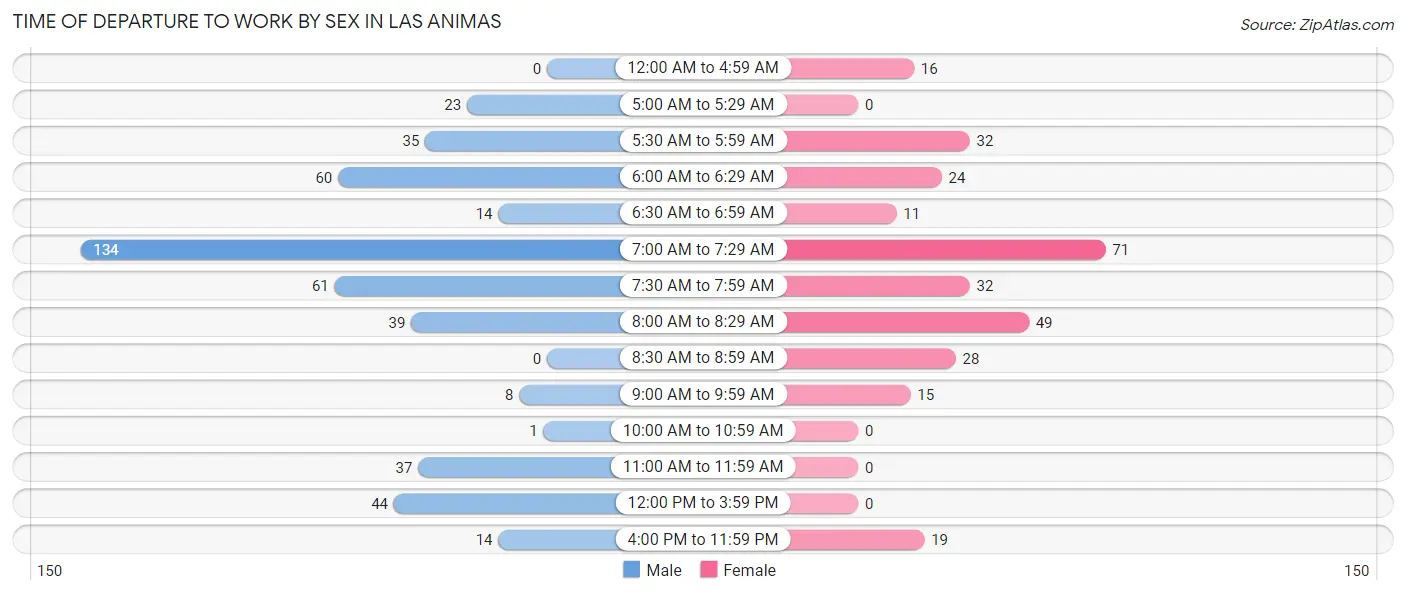
| Time of Departure | Male | Female |
| 12:00 AM to 4:59 AM | 0 (0.0%) | 16 (5.4%) |
| 5:00 AM to 5:29 AM | 23 (4.9%) | 0 (0.0%) |
| 5:30 AM to 5:59 AM | 35 (7.4%) | 32 (10.8%) |
| 6:00 AM to 6:29 AM | 60 (12.8%) | 24 (8.1%) |
| 6:30 AM to 6:59 AM | 14 (3.0%) | 11 (3.7%) |
| 7:00 AM to 7:29 AM | 134 (28.5%) | 71 (23.9%) |
| 7:30 AM to 7:59 AM | 61 (13.0%) | 32 (10.8%) |
| 8:00 AM to 8:29 AM | 39 (8.3%) | 49 (16.5%) |
| 8:30 AM to 8:59 AM | 0 (0.0%) | 28 (9.4%) |
| 9:00 AM to 9:59 AM | 8 (1.7%) | 15 (5.1%) |
| 10:00 AM to 10:59 AM | 1 (0.2%) | 0 (0.0%) |
| 11:00 AM to 11:59 AM | 37 (7.9%) | 0 (0.0%) |
| 12:00 PM to 3:59 PM | 44 (9.4%) | 0 (0.0%) |
| 4:00 PM to 11:59 PM | 14 (3.0%) | 19 (6.4%) |
| Total | 470 (100.0%) | 297 (100.0%) |
Housing Occupancy in Las Animas
Occupancy by Ownership in Las Animas
Of the total 1,037 dwellings in Las Animas, owner-occupied units account for 548 (52.8%), while renter-occupied units make up 489 (47.2%).
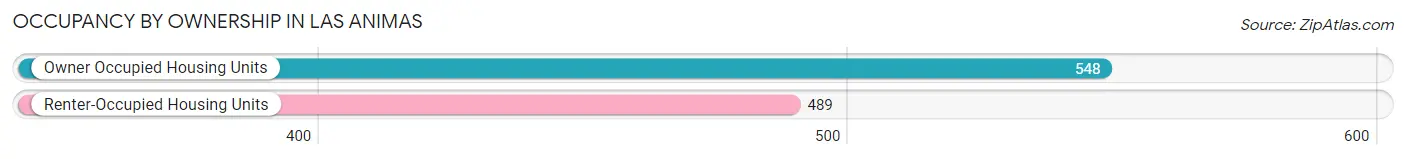
| Occupancy | # Housing Units | % Housing Units |
| Owner Occupied Housing Units | 548 | 52.8% |
| Renter-Occupied Housing Units | 489 | 47.2% |
| Total Occupied Housing Units | 1,037 | 100.0% |
Occupancy by Household Size in Las Animas
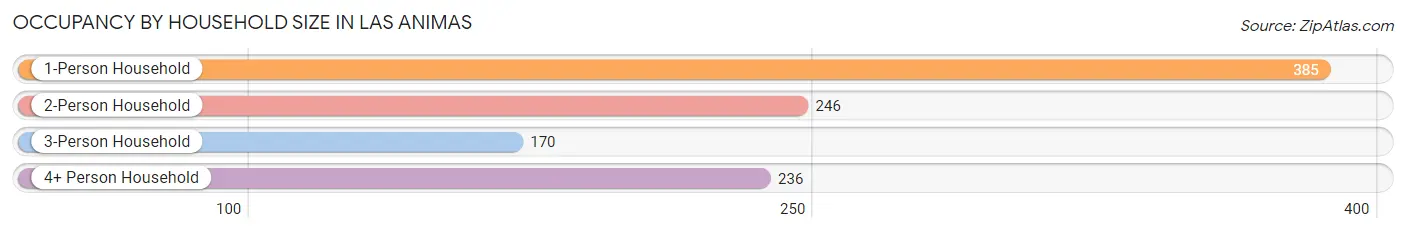
| Household Size | # Housing Units | % Housing Units |
| 1-Person Household | 385 | 37.1% |
| 2-Person Household | 246 | 23.7% |
| 3-Person Household | 170 | 16.4% |
| 4+ Person Household | 236 | 22.8% |
| Total Housing Units | 1,037 | 100.0% |
Occupancy by Ownership by Household Size in Las Animas
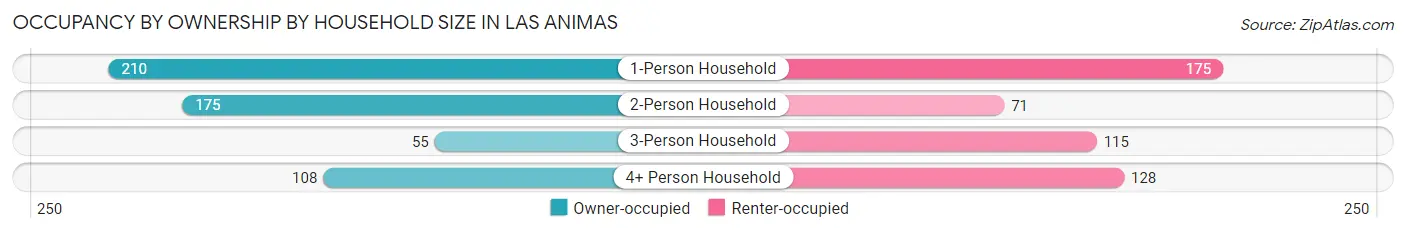
| Household Size | Owner-occupied | Renter-occupied |
| 1-Person Household | 210 (54.5%) | 175 (45.5%) |
| 2-Person Household | 175 (71.1%) | 71 (28.9%) |
| 3-Person Household | 55 (32.4%) | 115 (67.6%) |
| 4+ Person Household | 108 (45.8%) | 128 (54.2%) |
| Total Housing Units | 548 (52.8%) | 489 (47.2%) |
Occupancy by Educational Attainment in Las Animas
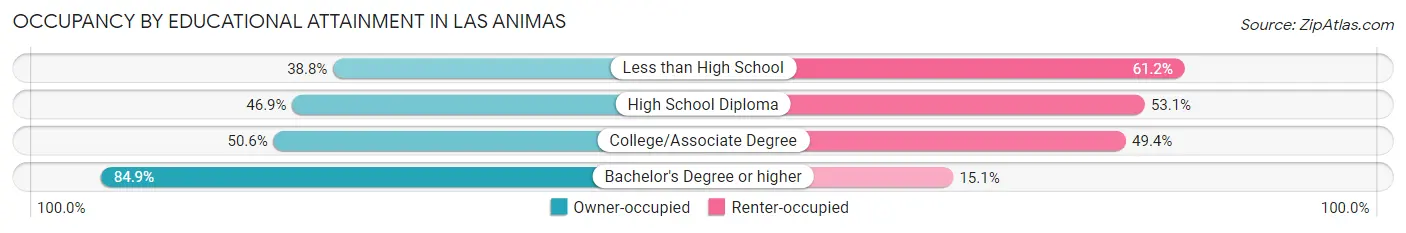
| Household Size | Owner-occupied | Renter-occupied |
| Less than High School | 66 (38.8%) | 104 (61.2%) |
| High School Diploma | 114 (46.9%) | 129 (53.1%) |
| College/Associate Degree | 239 (50.6%) | 233 (49.4%) |
| Bachelor's Degree or higher | 129 (84.9%) | 23 (15.1%) |
Occupancy by Age of Householder in Las Animas
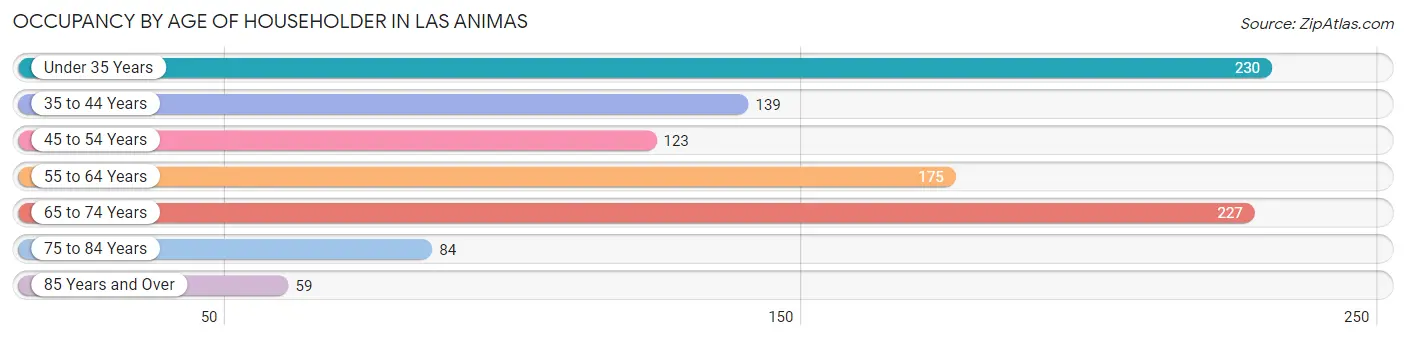
| Age Bracket | # Households | % Households |
| Under 35 Years | 230 | 22.2% |
| 35 to 44 Years | 139 | 13.4% |
| 45 to 54 Years | 123 | 11.9% |
| 55 to 64 Years | 175 | 16.9% |
| 65 to 74 Years | 227 | 21.9% |
| 75 to 84 Years | 84 | 8.1% |
| 85 Years and Over | 59 | 5.7% |
| Total | 1,037 | 100.0% |
Housing Finances in Las Animas
Median Income by Occupancy in Las Animas
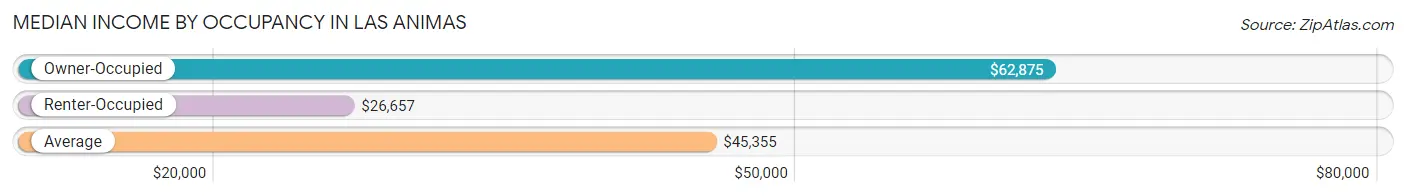
| Occupancy Type | # Households | Median Income |
| Owner-Occupied | 548 (52.8%) | $62,875 |
| Renter-Occupied | 489 (47.2%) | $26,657 |
| Average | 1,037 (100.0%) | $45,355 |
Occupancy by Householder Income Bracket in Las Animas
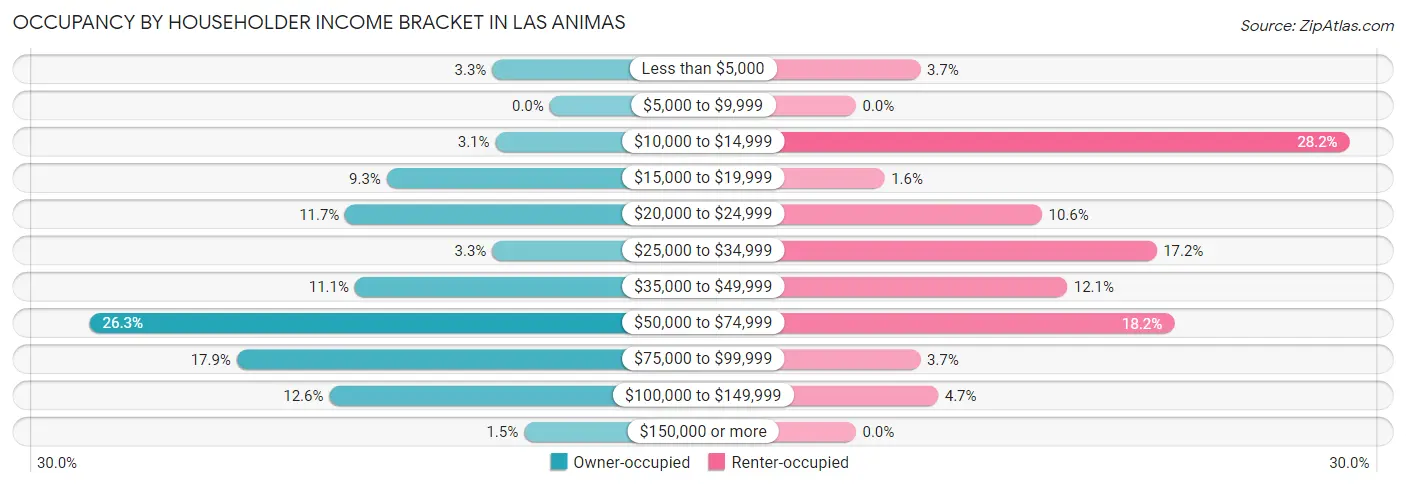
| Income Bracket | Owner-occupied | Renter-occupied |
| Less than $5,000 | 18 (3.3%) | 18 (3.7%) |
| $5,000 to $9,999 | 0 (0.0%) | 0 (0.0%) |
| $10,000 to $14,999 | 17 (3.1%) | 138 (28.2%) |
| $15,000 to $19,999 | 51 (9.3%) | 8 (1.6%) |
| $20,000 to $24,999 | 64 (11.7%) | 52 (10.6%) |
| $25,000 to $34,999 | 18 (3.3%) | 84 (17.2%) |
| $35,000 to $49,999 | 61 (11.1%) | 59 (12.1%) |
| $50,000 to $74,999 | 144 (26.3%) | 89 (18.2%) |
| $75,000 to $99,999 | 98 (17.9%) | 18 (3.7%) |
| $100,000 to $149,999 | 69 (12.6%) | 23 (4.7%) |
| $150,000 or more | 8 (1.5%) | 0 (0.0%) |
| Total | 548 (100.0%) | 489 (100.0%) |
Monthly Housing Cost Tiers in Las Animas
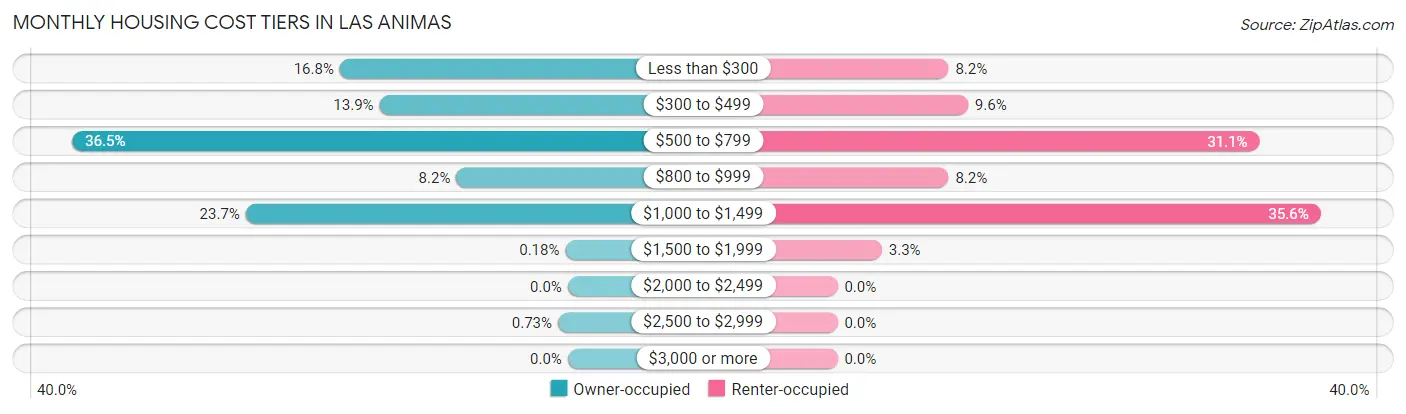
| Monthly Cost | Owner-occupied | Renter-occupied |
| Less than $300 | 92 (16.8%) | 40 (8.2%) |
| $300 to $499 | 76 (13.9%) | 47 (9.6%) |
| $500 to $799 | 200 (36.5%) | 152 (31.1%) |
| $800 to $999 | 45 (8.2%) | 40 (8.2%) |
| $1,000 to $1,499 | 130 (23.7%) | 174 (35.6%) |
| $1,500 to $1,999 | 1 (0.2%) | 16 (3.3%) |
| $2,000 to $2,499 | 0 (0.0%) | 0 (0.0%) |
| $2,500 to $2,999 | 4 (0.7%) | 0 (0.0%) |
| $3,000 or more | 0 (0.0%) | 0 (0.0%) |
| Total | 548 (100.0%) | 489 (100.0%) |
Physical Housing Characteristics in Las Animas
Housing Structures in Las Animas
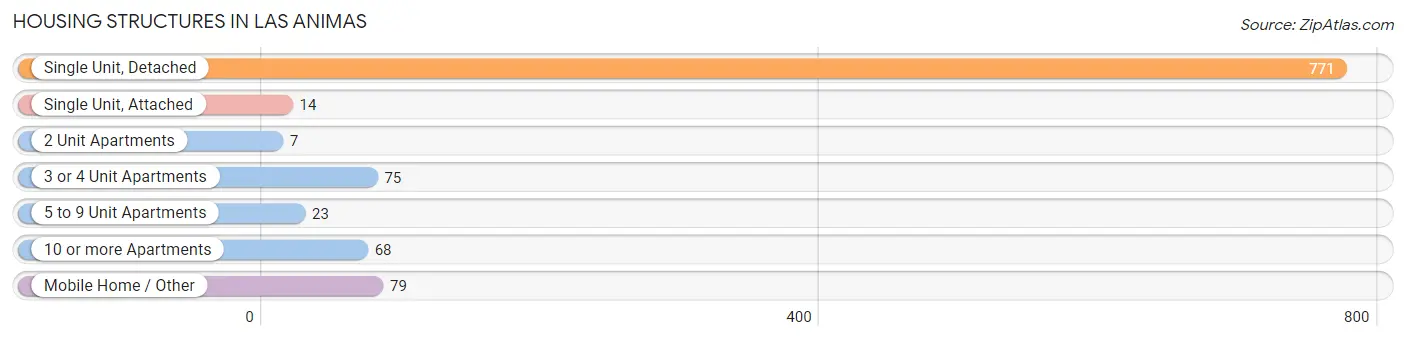
| Structure Type | # Housing Units | % Housing Units |
| Single Unit, Detached | 771 | 74.4% |
| Single Unit, Attached | 14 | 1.3% |
| 2 Unit Apartments | 7 | 0.7% |
| 3 or 4 Unit Apartments | 75 | 7.2% |
| 5 to 9 Unit Apartments | 23 | 2.2% |
| 10 or more Apartments | 68 | 6.6% |
| Mobile Home / Other | 79 | 7.6% |
| Total | 1,037 | 100.0% |
Housing Structures by Occupancy in Las Animas
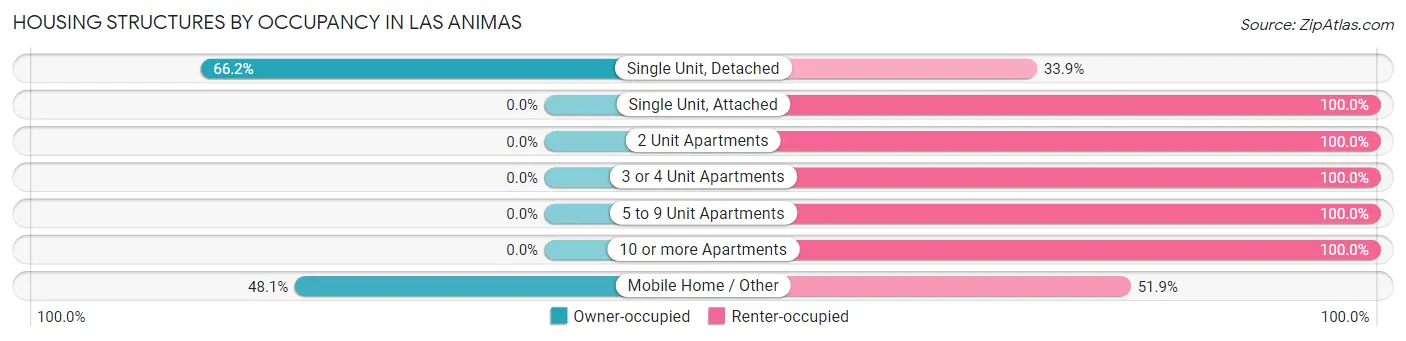
| Structure Type | Owner-occupied | Renter-occupied |
| Single Unit, Detached | 510 (66.1%) | 261 (33.9%) |
| Single Unit, Attached | 0 (0.0%) | 14 (100.0%) |
| 2 Unit Apartments | 0 (0.0%) | 7 (100.0%) |
| 3 or 4 Unit Apartments | 0 (0.0%) | 75 (100.0%) |
| 5 to 9 Unit Apartments | 0 (0.0%) | 23 (100.0%) |
| 10 or more Apartments | 0 (0.0%) | 68 (100.0%) |
| Mobile Home / Other | 38 (48.1%) | 41 (51.9%) |
| Total | 548 (52.8%) | 489 (47.2%) |
Housing Structures by Number of Rooms in Las Animas
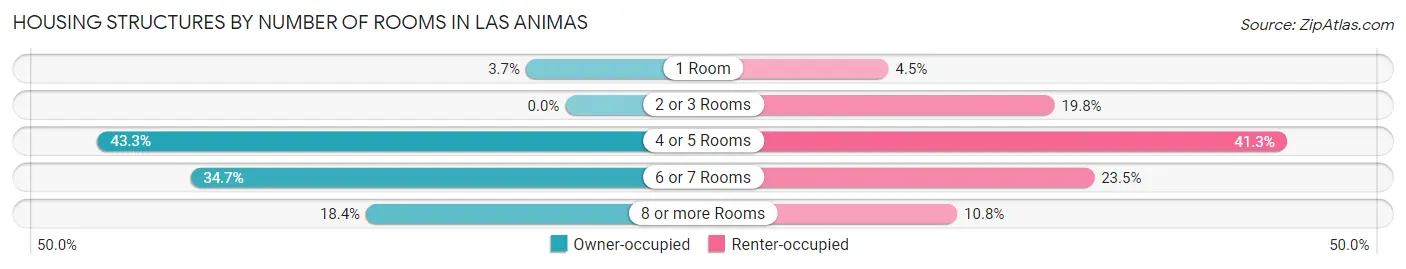
| Number of Rooms | Owner-occupied | Renter-occupied |
| 1 Room | 20 (3.6%) | 22 (4.5%) |
| 2 or 3 Rooms | 0 (0.0%) | 97 (19.8%) |
| 4 or 5 Rooms | 237 (43.2%) | 202 (41.3%) |
| 6 or 7 Rooms | 190 (34.7%) | 115 (23.5%) |
| 8 or more Rooms | 101 (18.4%) | 53 (10.8%) |
| Total | 548 (100.0%) | 489 (100.0%) |
Housing Structure by Heating Type in Las Animas
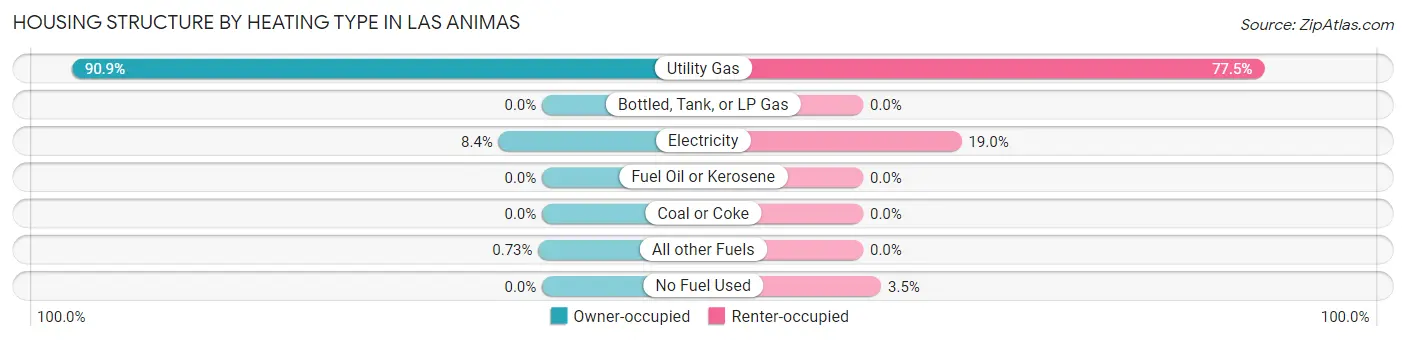
| Heating Type | Owner-occupied | Renter-occupied |
| Utility Gas | 498 (90.9%) | 379 (77.5%) |
| Bottled, Tank, or LP Gas | 0 (0.0%) | 0 (0.0%) |
| Electricity | 46 (8.4%) | 93 (19.0%) |
| Fuel Oil or Kerosene | 0 (0.0%) | 0 (0.0%) |
| Coal or Coke | 0 (0.0%) | 0 (0.0%) |
| All other Fuels | 4 (0.7%) | 0 (0.0%) |
| No Fuel Used | 0 (0.0%) | 17 (3.5%) |
| Total | 548 (100.0%) | 489 (100.0%) |
Household Vehicle Usage in Las Animas
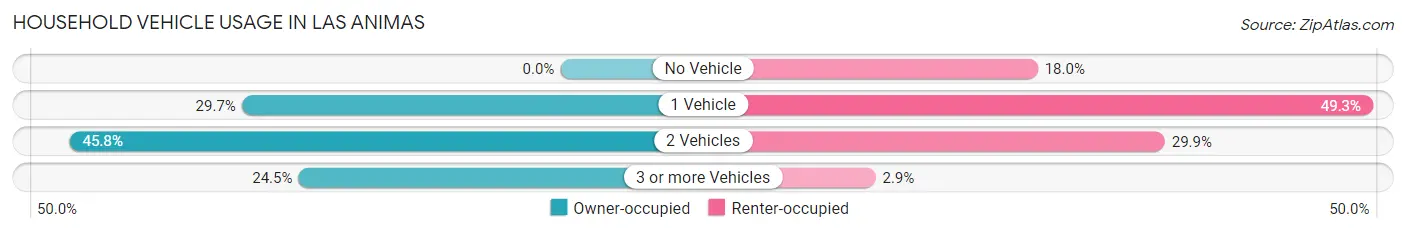
| Vehicles per Household | Owner-occupied | Renter-occupied |
| No Vehicle | 0 (0.0%) | 88 (18.0%) |
| 1 Vehicle | 163 (29.7%) | 241 (49.3%) |
| 2 Vehicles | 251 (45.8%) | 146 (29.9%) |
| 3 or more Vehicles | 134 (24.4%) | 14 (2.9%) |
| Total | 548 (100.0%) | 489 (100.0%) |
Real Estate & Mortgages in Las Animas
Real Estate and Mortgage Overview in Las Animas
| Characteristic | Without Mortgage | With Mortgage |
| Housing Units | 297 | 251 |
| Median Property Value | $58,300 | $95,000 |
| Median Household Income | $52,569 | $0 |
| Monthly Housing Costs | $385 | $0 |
| Real Estate Taxes | $360 | $44 |
Property Value by Mortgage Status in Las Animas
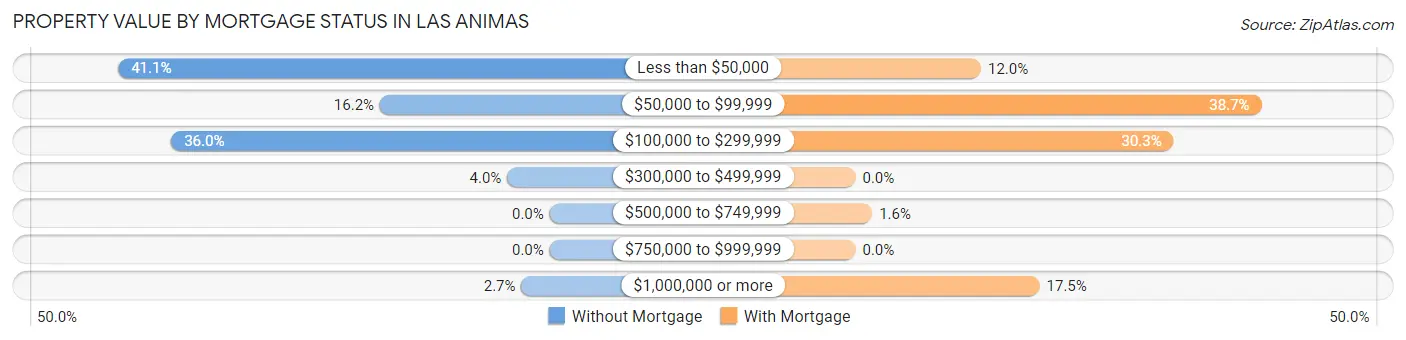
| Property Value | Without Mortgage | With Mortgage |
| Less than $50,000 | 122 (41.1%) | 30 (11.9%) |
| $50,000 to $99,999 | 48 (16.2%) | 97 (38.7%) |
| $100,000 to $299,999 | 107 (36.0%) | 76 (30.3%) |
| $300,000 to $499,999 | 12 (4.0%) | 0 (0.0%) |
| $500,000 to $749,999 | 0 (0.0%) | 4 (1.6%) |
| $750,000 to $999,999 | 0 (0.0%) | 0 (0.0%) |
| $1,000,000 or more | 8 (2.7%) | 44 (17.5%) |
| Total | 297 (100.0%) | 251 (100.0%) |
Household Income by Mortgage Status in Las Animas
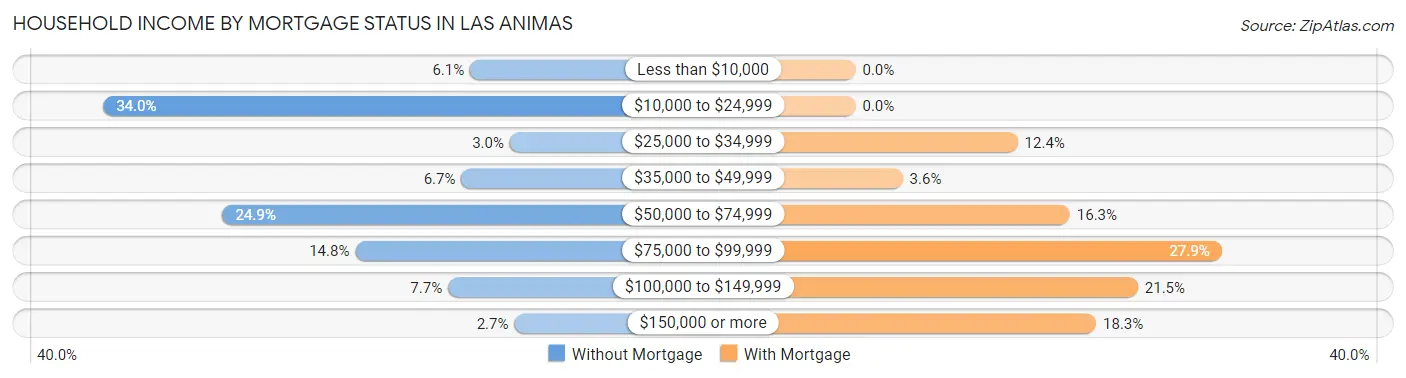
| Household Income | Without Mortgage | With Mortgage |
| Less than $10,000 | 18 (6.1%) | 0 (0.0%) |
| $10,000 to $24,999 | 101 (34.0%) | 0 (0.0%) |
| $25,000 to $34,999 | 9 (3.0%) | 31 (12.3%) |
| $35,000 to $49,999 | 20 (6.7%) | 9 (3.6%) |
| $50,000 to $74,999 | 74 (24.9%) | 41 (16.3%) |
| $75,000 to $99,999 | 44 (14.8%) | 70 (27.9%) |
| $100,000 to $149,999 | 23 (7.7%) | 54 (21.5%) |
| $150,000 or more | 8 (2.7%) | 46 (18.3%) |
| Total | 297 (100.0%) | 251 (100.0%) |
Property Value to Household Income Ratio in Las Animas
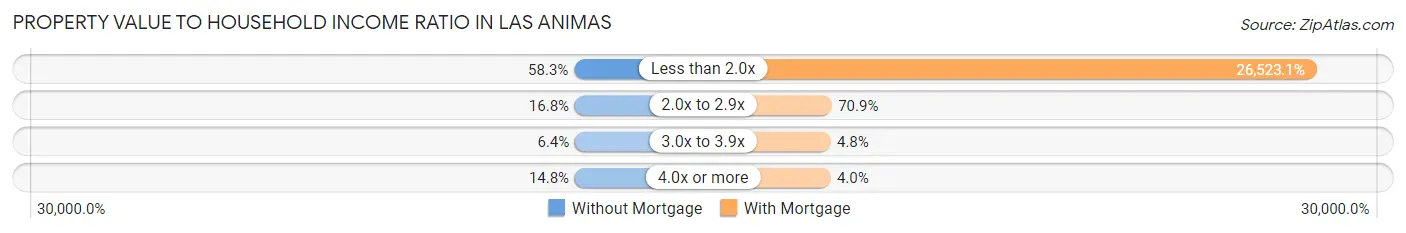
| Value-to-Income Ratio | Without Mortgage | With Mortgage |
| Less than 2.0x | 173 (58.3%) | 66,573 (26,523.1%) |
| 2.0x to 2.9x | 50 (16.8%) | 178 (70.9%) |
| 3.0x to 3.9x | 19 (6.4%) | 12 (4.8%) |
| 4.0x or more | 44 (14.8%) | 10 (4.0%) |
| Total | 297 (100.0%) | 251 (100.0%) |
Real Estate Taxes by Mortgage Status in Las Animas
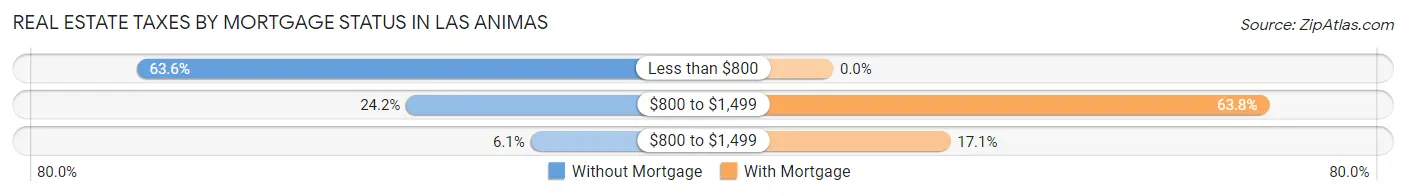
| Property Taxes | Without Mortgage | With Mortgage |
| Less than $800 | 189 (63.6%) | 0 (0.0%) |
| $800 to $1,499 | 72 (24.2%) | 160 (63.7%) |
| $800 to $1,499 | 18 (6.1%) | 43 (17.1%) |
| Total | 297 (100.0%) | 251 (100.0%) |
Health & Disability in Las Animas
Health Insurance Coverage by Age in Las Animas
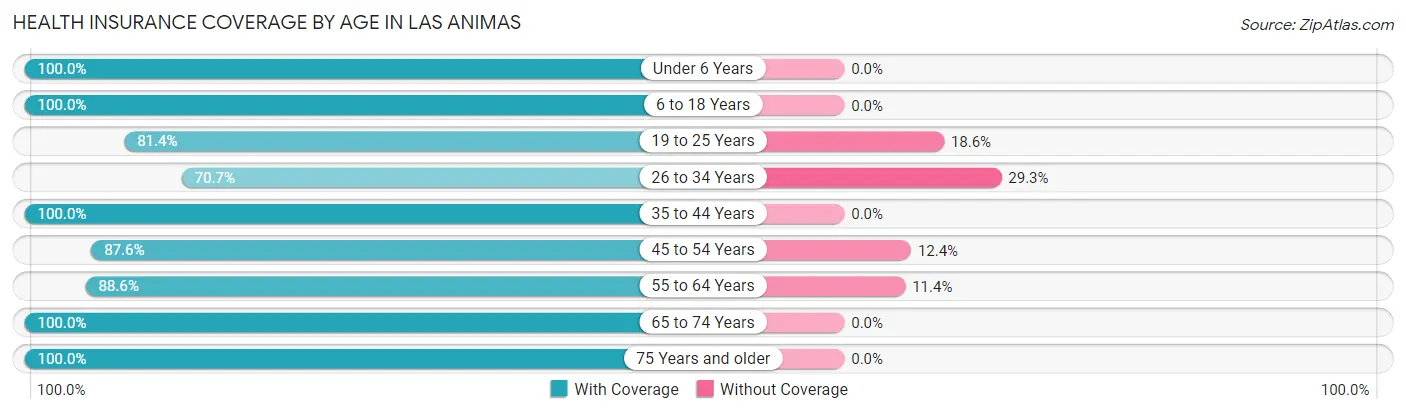
| Age Bracket | With Coverage | Without Coverage |
| Under 6 Years | 193 (100.0%) | 0 (0.0%) |
| 6 to 18 Years | 422 (100.0%) | 0 (0.0%) |
| 19 to 25 Years | 149 (81.4%) | 34 (18.6%) |
| 26 to 34 Years | 210 (70.7%) | 87 (29.3%) |
| 35 to 44 Years | 307 (100.0%) | 0 (0.0%) |
| 45 to 54 Years | 155 (87.6%) | 22 (12.4%) |
| 55 to 64 Years | 242 (88.6%) | 31 (11.4%) |
| 65 to 74 Years | 325 (100.0%) | 0 (0.0%) |
| 75 Years and older | 188 (100.0%) | 0 (0.0%) |
| Total | 2,191 (92.6%) | 174 (7.4%) |
Health Insurance Coverage by Citizenship Status in Las Animas
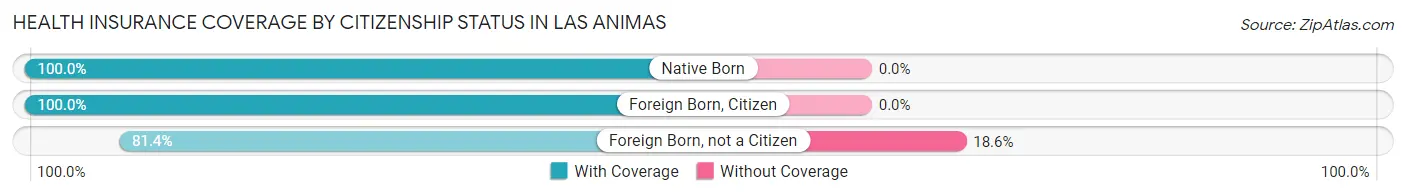
| Citizenship Status | With Coverage | Without Coverage |
| Native Born | 193 (100.0%) | 0 (0.0%) |
| Foreign Born, Citizen | 422 (100.0%) | 0 (0.0%) |
| Foreign Born, not a Citizen | 149 (81.4%) | 34 (18.6%) |
Health Insurance Coverage by Household Income in Las Animas
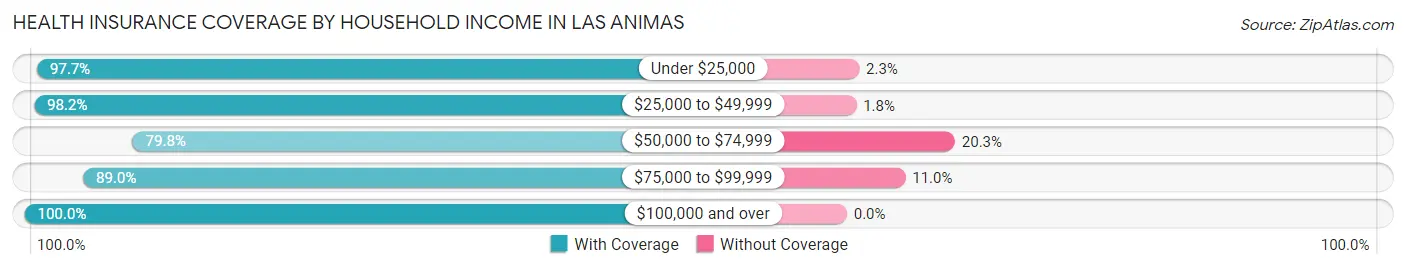
| Household Income | With Coverage | Without Coverage |
| Under $25,000 | 635 (97.7%) | 15 (2.3%) |
| $25,000 to $49,999 | 443 (98.2%) | 8 (1.8%) |
| $50,000 to $74,999 | 441 (79.7%) | 112 (20.3%) |
| $75,000 to $99,999 | 317 (89.0%) | 39 (11.0%) |
| $100,000 and over | 295 (100.0%) | 0 (0.0%) |
Public vs Private Health Insurance Coverage by Age in Las Animas
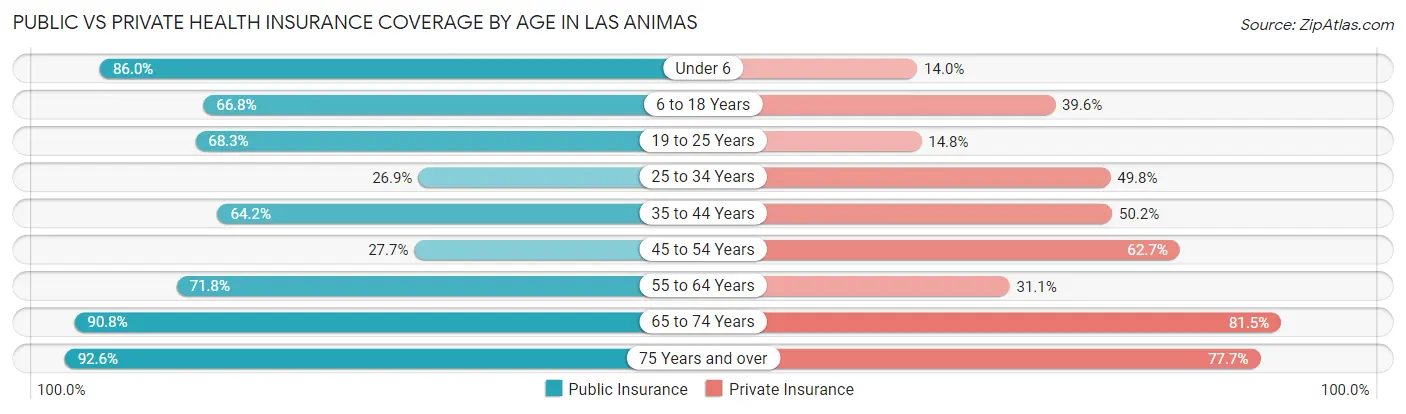
| Age Bracket | Public Insurance | Private Insurance |
| Under 6 | 166 (86.0%) | 27 (14.0%) |
| 6 to 18 Years | 282 (66.8%) | 167 (39.6%) |
| 19 to 25 Years | 125 (68.3%) | 27 (14.7%) |
| 25 to 34 Years | 80 (26.9%) | 148 (49.8%) |
| 35 to 44 Years | 197 (64.2%) | 154 (50.2%) |
| 45 to 54 Years | 49 (27.7%) | 111 (62.7%) |
| 55 to 64 Years | 196 (71.8%) | 85 (31.1%) |
| 65 to 74 Years | 295 (90.8%) | 265 (81.5%) |
| 75 Years and over | 174 (92.5%) | 146 (77.7%) |
| Total | 1,564 (66.1%) | 1,130 (47.8%) |
Disability Status by Sex by Age in Las Animas
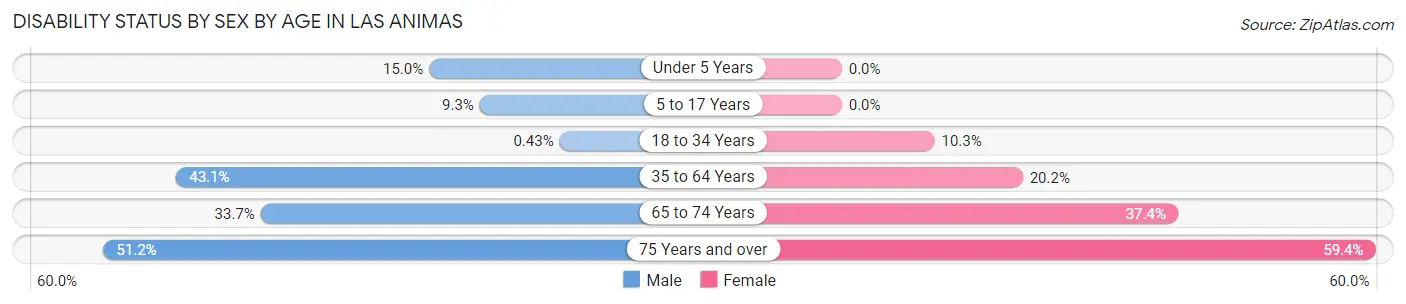
| Age Bracket | Male | Female |
| Under 5 Years | 19 (15.0%) | 0 (0.0%) |
| 5 to 17 Years | 15 (9.3%) | 0 (0.0%) |
| 18 to 34 Years | 1 (0.4%) | 28 (10.3%) |
| 35 to 64 Years | 153 (43.1%) | 81 (20.2%) |
| 65 to 74 Years | 60 (33.7%) | 55 (37.4%) |
| 75 Years and over | 42 (51.2%) | 63 (59.4%) |
Disability Class by Sex by Age in Las Animas
Disability Class: Hearing Difficulty
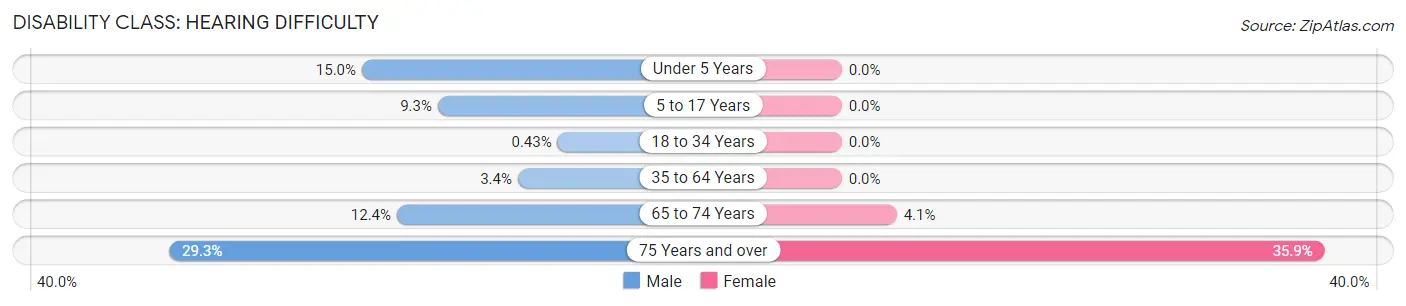
| Age Bracket | Male | Female |
| Under 5 Years | 19 (15.0%) | 0 (0.0%) |
| 5 to 17 Years | 15 (9.3%) | 0 (0.0%) |
| 18 to 34 Years | 1 (0.4%) | 0 (0.0%) |
| 35 to 64 Years | 12 (3.4%) | 0 (0.0%) |
| 65 to 74 Years | 22 (12.4%) | 6 (4.1%) |
| 75 Years and over | 24 (29.3%) | 38 (35.8%) |
Disability Class: Vision Difficulty
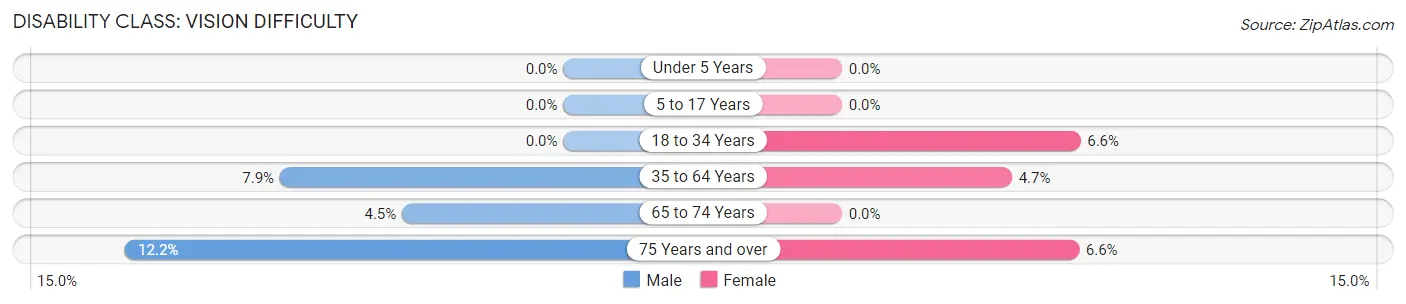
| Age Bracket | Male | Female |
| Under 5 Years | 0 (0.0%) | 0 (0.0%) |
| 5 to 17 Years | 0 (0.0%) | 0 (0.0%) |
| 18 to 34 Years | 0 (0.0%) | 18 (6.6%) |
| 35 to 64 Years | 28 (7.9%) | 19 (4.7%) |
| 65 to 74 Years | 8 (4.5%) | 0 (0.0%) |
| 75 Years and over | 10 (12.2%) | 7 (6.6%) |
Disability Class: Cognitive Difficulty
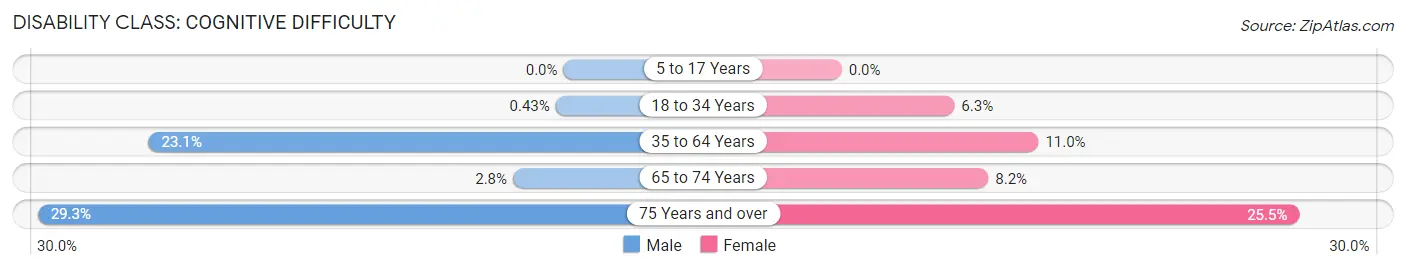
| Age Bracket | Male | Female |
| 5 to 17 Years | 0 (0.0%) | 0 (0.0%) |
| 18 to 34 Years | 1 (0.4%) | 17 (6.3%) |
| 35 to 64 Years | 82 (23.1%) | 44 (11.0%) |
| 65 to 74 Years | 5 (2.8%) | 12 (8.2%) |
| 75 Years and over | 24 (29.3%) | 27 (25.5%) |
Disability Class: Ambulatory Difficulty
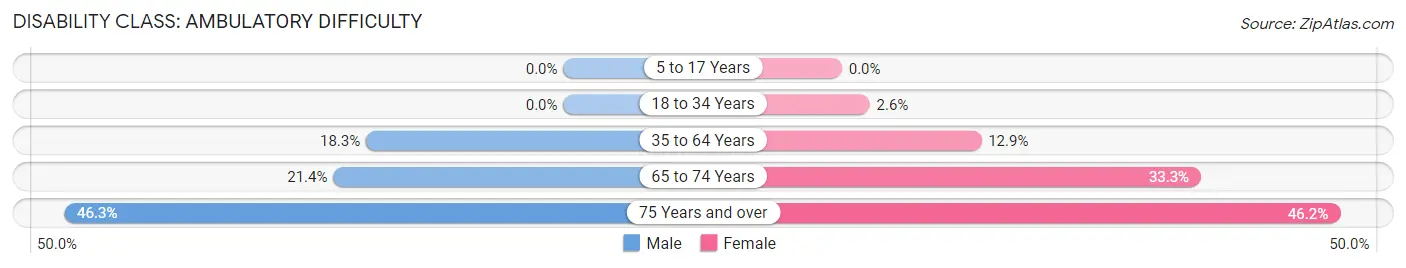
| Age Bracket | Male | Female |
| 5 to 17 Years | 0 (0.0%) | 0 (0.0%) |
| 18 to 34 Years | 0 (0.0%) | 7 (2.6%) |
| 35 to 64 Years | 65 (18.3%) | 52 (12.9%) |
| 65 to 74 Years | 38 (21.3%) | 49 (33.3%) |
| 75 Years and over | 38 (46.3%) | 49 (46.2%) |
Disability Class: Self-Care Difficulty
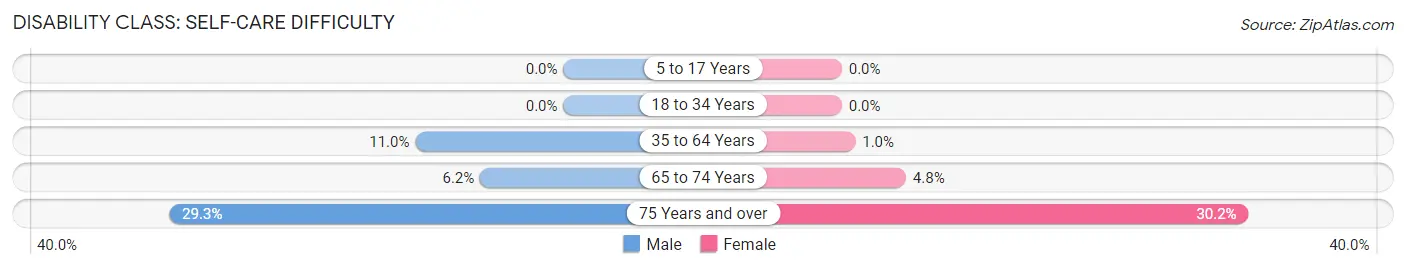
| Age Bracket | Male | Female |
| 5 to 17 Years | 0 (0.0%) | 0 (0.0%) |
| 18 to 34 Years | 0 (0.0%) | 0 (0.0%) |
| 35 to 64 Years | 39 (11.0%) | 4 (1.0%) |
| 65 to 74 Years | 11 (6.2%) | 7 (4.8%) |
| 75 Years and over | 24 (29.3%) | 32 (30.2%) |
Technology Access in Las Animas
Computing Device Access in Las Animas
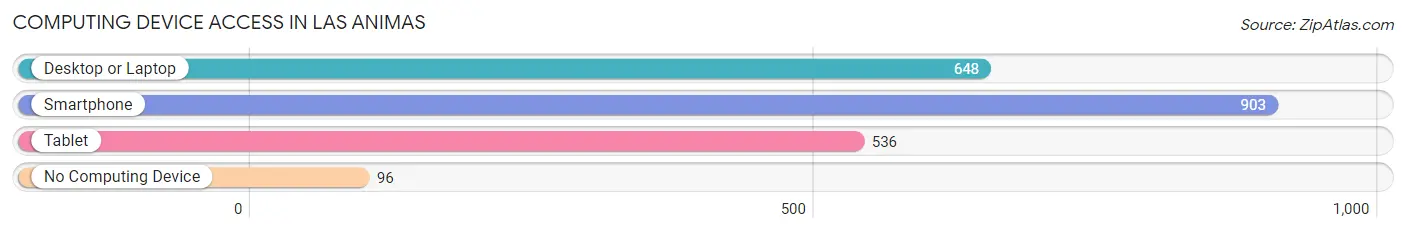
| Device Type | # Households | % Households |
| Desktop or Laptop | 648 | 62.5% |
| Smartphone | 903 | 87.1% |
| Tablet | 536 | 51.7% |
| No Computing Device | 96 | 9.3% |
| Total | 1,037 | 100.0% |
Internet Access in Las Animas
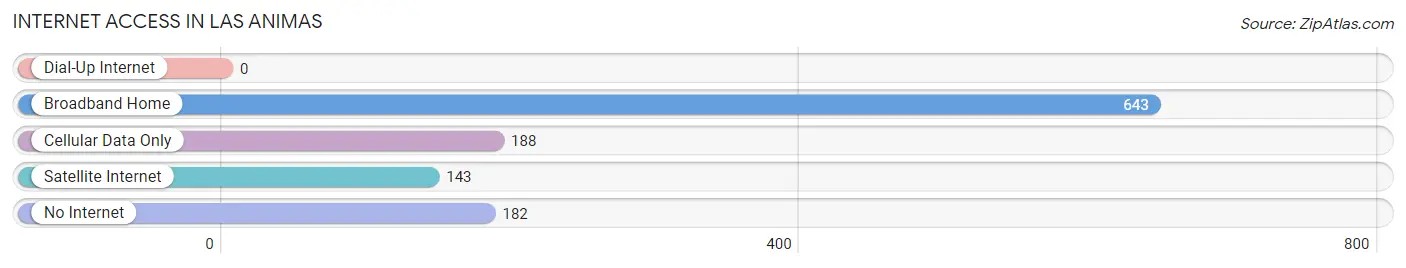
| Internet Type | # Households | % Households |
| Dial-Up Internet | 0 | 0.0% |
| Broadband Home | 643 | 62.0% |
| Cellular Data Only | 188 | 18.1% |
| Satellite Internet | 143 | 13.8% |
| No Internet | 182 | 17.5% |
| Total | 1,037 | 100.0% |
Las Animas Summary
History
The town of Las Animas, Colorado is located in Bent County, in the southeastern corner of the state. It is situated along the Arkansas River, and is the county seat of Bent County. The town was founded in 1866, and was named after the nearby Las Animas Creek. The creek was named by Spanish explorers, who named it after the local Native American tribe, the Ute Indians.
Las Animas was originally a trading post for the Ute Indians, and was the site of a major battle between the Ute and the Arapaho Indians in 1868. The town was incorporated in 1872, and quickly became an important stop on the Santa Fe Trail. The town was also a major stop on the Denver and Rio Grande Railroad, which was built in 1878.
Las Animas was an important agricultural center in the late 19th and early 20th centuries. The town was home to several large farms, and was the site of the first sugar beet factory in Colorado. The town also had a large cattle industry, and was home to several large ranches.
The town was also an important center for the mining industry. The area was home to several large coal mines, and the town was the site of the first coal-fired power plant in Colorado. The town was also home to several large gold and silver mines.
Geography
Las Animas is located in the southeastern corner of Colorado, in Bent County. The town is situated along the Arkansas River, and is located at an elevation of 4,719 feet. The town is located in the High Plains region of Colorado, and is surrounded by rolling hills and prairies.
The climate in Las Animas is semi-arid, with hot summers and cold winters. The average annual temperature is 54 degrees Fahrenheit, and the average annual precipitation is 16.5 inches.
Economy
The economy of Las Animas is largely based on agriculture and tourism. The town is home to several large farms, and is the site of the first sugar beet factory in Colorado. The town also has a large cattle industry, and is home to several large ranches.
The town is also home to several large coal mines, and the town was the site of the first coal-fired power plant in Colorado. The town is also home to several large gold and silver mines.
The town is also a popular tourist destination, and is home to several historic sites, including the Bent County Courthouse, the Bent County Jail, and the Bent County Museum. The town is also home to several parks, including the Las Animas City Park and the Bent County State Park.
Demographics
As of the 2010 census, the population of Las Animas was 2,711. The racial makeup of the town was 81.3% White, 0.7% African American, 0.9% Native American, 0.3% Asian, 0.1% Pacific Islander, 14.2% from other races, and 2.5% from two or more races. Hispanic or Latino of any race were 25.2% of the population.
The median household income in Las Animas was $31,250, and the median family income was $37,500. The per capita income in the town was $15,945. About 17.2% of families and 20.7% of the population were below the poverty line, including 28.3% of those under age 18 and 10.2% of those age 65 or over.
Common Questions
What is Per Capita Income in Las Animas?
Per Capita income in Las Animas is $21,139.
What is the Median Family Income in Las Animas?
Median Family Income in Las Animas is $44,706.
What is the Median Household income in Las Animas?
Median Household Income in Las Animas is $45,355.
What is Income or Wage Gap in Las Animas?
Income or Wage Gap in Las Animas is 13.0%.
Women in Las Animas earn 87.0 cents for every dollar earned by a man.
What is Family Income Deficit in Las Animas?
Family Income Deficit in Las Animas is $10,912.
Families that are below poverty line in Las Animas earn $10,912 less on average than the poverty threshold level.
What is Inequality or Gini Index in Las Animas?
Inequality or Gini Index in Las Animas is 0.41.
What is the Total Population of Las Animas?
Total Population of Las Animas is 2,421.
What is the Total Male Population of Las Animas?
Total Male Population of Las Animas is 1,159.
What is the Total Female Population of Las Animas?
Total Female Population of Las Animas is 1,262.
What is the Ratio of Males per 100 Females in Las Animas?
There are 91.84 Males per 100 Females in Las Animas.
What is the Ratio of Females per 100 Males in Las Animas?
There are 108.89 Females per 100 Males in Las Animas.
What is the Median Population Age in Las Animas?
Median Population Age in Las Animas is 38.8 Years.
What is the Average Family Size in Las Animas
Average Family Size in Las Animas is 2.9 People.
What is the Average Household Size in Las Animas
Average Household Size in Las Animas is 2.2 People.
How Large is the Labor Force in Las Animas?
There are 928 People in the Labor Forcein in Las Animas.
What is the Percentage of People in the Labor Force in Las Animas?
49.4% of People are in the Labor Force in Las Animas.
What is the Unemployment Rate in Las Animas?
Unemployment Rate in Las Animas is 10.3%.