Kit Carson, CO Map & Demographics
Kit Carson Map
Kit Carson Overview
$39,930
PER CAPITA INCOME
$85,625
AVG FAMILY INCOME
$54,792
AVG HOUSEHOLD INCOME
0.36
INEQUALITY / GINI INDEX
228
TOTAL POPULATION
125
MALE POPULATION
103
FEMALE POPULATION
121.36
MALES / 100 FEMALES
82.40
FEMALES / 100 MALES
42.0
MEDIAN AGE
2.5
AVG FAMILY SIZE
2.1
AVG HOUSEHOLD SIZE
142
LABOR FORCE [ PEOPLE ]
72.4%
PERCENT IN LABOR FORCE
2.8%
UNEMPLOYMENT RATE
Kit Carson Zip Codes
Kit Carson Area Codes
Income in Kit Carson
Income Overview in Kit Carson
Per Capita Income in Kit Carson is $39,930, while median incomes of families and households are $85,625 and $54,792 respectively.
| Characteristic | Number | Measure |
| Per Capita Income | 228 | $39,930 |
| Median Family Income | 71 | $85,625 |
| Mean Family Income | 71 | $81,411 |
| Median Household Income | 103 | $54,792 |
| Mean Household Income | 103 | $84,404 |
| Income Deficit | 71 | $0 |
| Wage / Income Gap (%) | 228 | 0.00% |
| Wage / Income Gap ($) | 228 | 100.00¢ per $1 |
| Gini / Inequality Index | 228 | 0.36 |
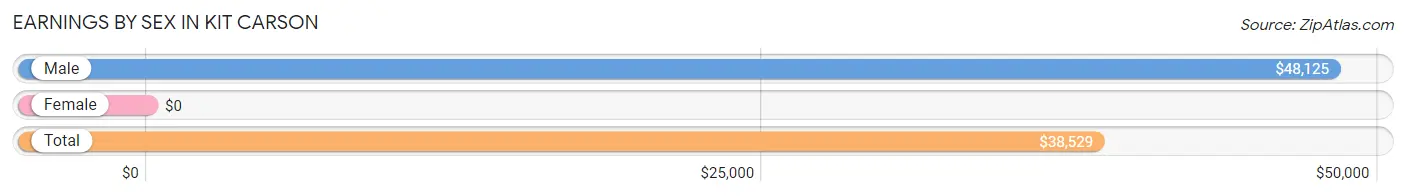
Earnings by Sex in Kit Carson
| Sex | Number | Average Earnings |
| Male | 86 (55.8%) | $48,125 |
| Female | 68 (44.2%) | $0 |
| Total | 154 (100.0%) | $38,529 |
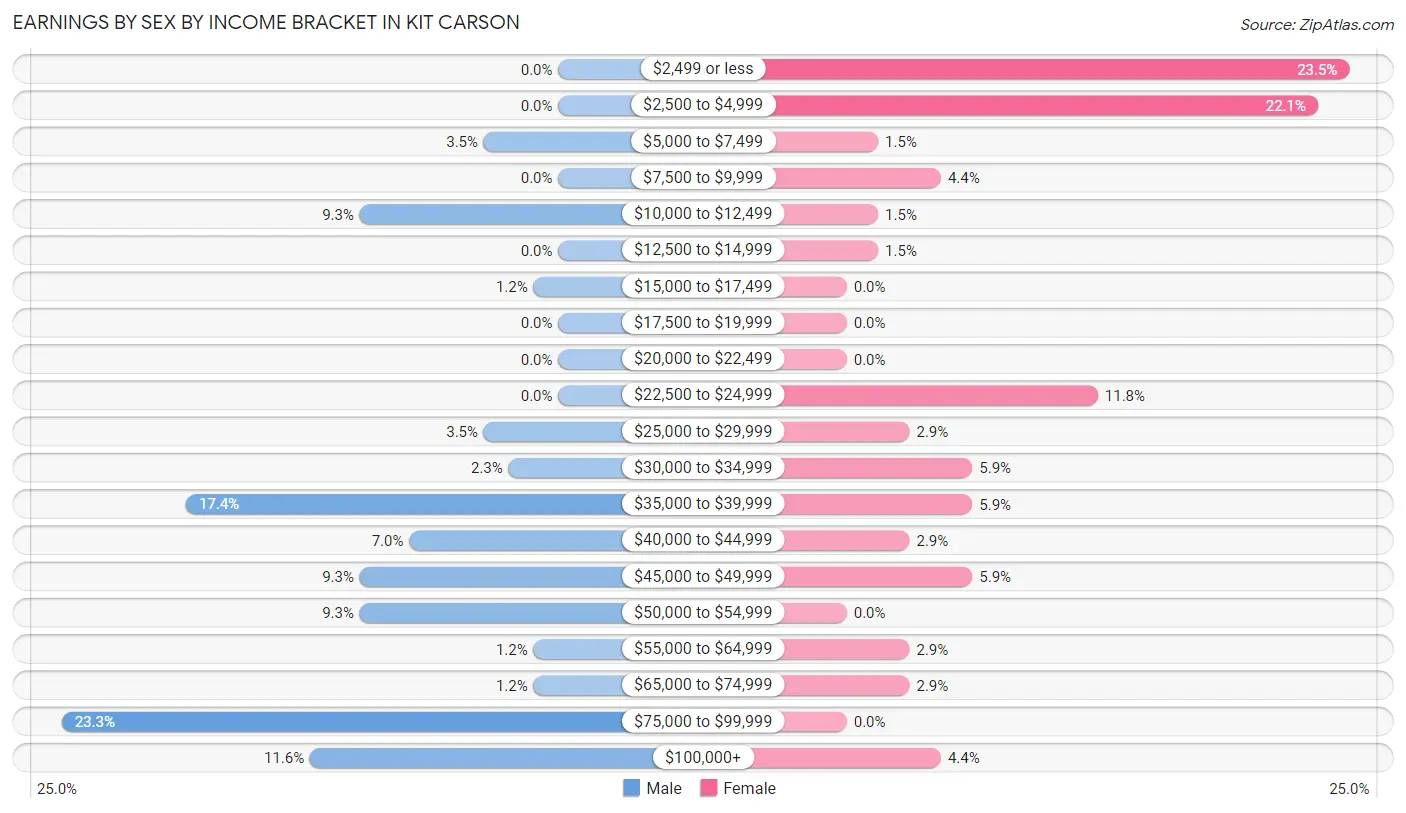
Earnings by Sex by Income Bracket in Kit Carson
The most common earnings brackets in Kit Carson are $75,000 to $99,999 for men (20 | 23.3%) and $2,499 or less for women (16 | 23.5%).
| Income | Male | Female |
| $2,499 or less | 0 (0.0%) | 16 (23.5%) |
| $2,500 to $4,999 | 0 (0.0%) | 15 (22.1%) |
| $5,000 to $7,499 | 3 (3.5%) | 1 (1.5%) |
| $7,500 to $9,999 | 0 (0.0%) | 3 (4.4%) |
| $10,000 to $12,499 | 8 (9.3%) | 1 (1.5%) |
| $12,500 to $14,999 | 0 (0.0%) | 1 (1.5%) |
| $15,000 to $17,499 | 1 (1.2%) | 0 (0.0%) |
| $17,500 to $19,999 | 0 (0.0%) | 0 (0.0%) |
| $20,000 to $22,499 | 0 (0.0%) | 0 (0.0%) |
| $22,500 to $24,999 | 0 (0.0%) | 8 (11.8%) |
| $25,000 to $29,999 | 3 (3.5%) | 2 (2.9%) |
| $30,000 to $34,999 | 2 (2.3%) | 4 (5.9%) |
| $35,000 to $39,999 | 15 (17.4%) | 4 (5.9%) |
| $40,000 to $44,999 | 6 (7.0%) | 2 (2.9%) |
| $45,000 to $49,999 | 8 (9.3%) | 4 (5.9%) |
| $50,000 to $54,999 | 8 (9.3%) | 0 (0.0%) |
| $55,000 to $64,999 | 1 (1.2%) | 2 (2.9%) |
| $65,000 to $74,999 | 1 (1.2%) | 2 (2.9%) |
| $75,000 to $99,999 | 20 (23.3%) | 0 (0.0%) |
| $100,000+ | 10 (11.6%) | 3 (4.4%) |
| Total | 86 (100.0%) | 68 (100.0%) |
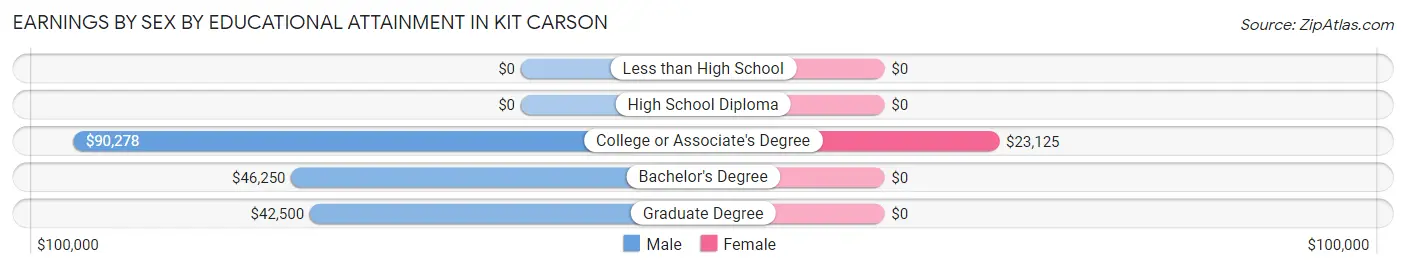
Earnings by Sex by Educational Attainment in Kit Carson
Average earnings in Kit Carson are $49,375 for men and $26,250 for women, a difference of 46.8%. Men with an educational attainment of college or associate's degree enjoy the highest average annual earnings of $90,278, while those with graduate degree education earn the least with $42,500. Women with an educational attainment of college or associate's degree earn the most with the average annual earnings of $23,125, while those with college or associate's degree education have the smallest earnings of $23,125.
| Educational Attainment | Male Income | Female Income |
| Less than High School | - | - |
| High School Diploma | - | - |
| College or Associate's Degree | $90,278 | $23,125 |
| Bachelor's Degree | $46,250 | $0 |
| Graduate Degree | $42,500 | $0 |
| Total | $49,375 | $26,250 |
Family Income in Kit Carson
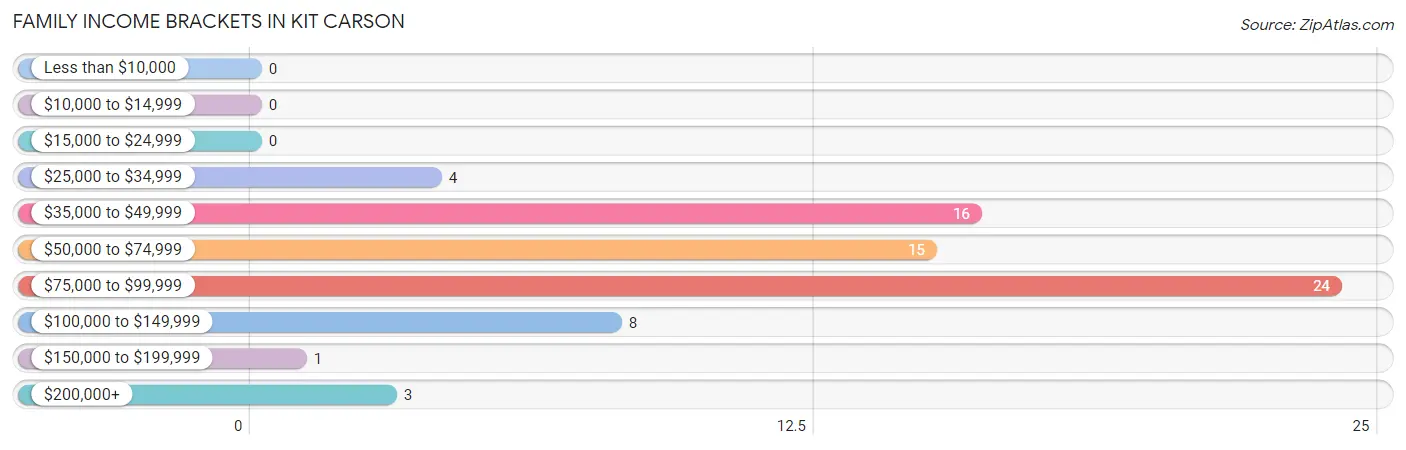
Family Income Brackets in Kit Carson
According to the Kit Carson family income data, there are 24 families falling into the $75,000 to $99,999 income range, which is the most common income bracket and makes up 33.8% of all families.
| Income Bracket | # Families | % Families |
| Less than $10,000 | 0 | 0.0% |
| $10,000 to $14,999 | 0 | 0.0% |
| $15,000 to $24,999 | 0 | 0.0% |
| $25,000 to $34,999 | 4 | 5.6% |
| $35,000 to $49,999 | 16 | 22.5% |
| $50,000 to $74,999 | 15 | 21.1% |
| $75,000 to $99,999 | 24 | 33.8% |
| $100,000 to $149,999 | 8 | 11.3% |
| $150,000 to $199,999 | 1 | 1.4% |
| $200,000+ | 3 | 4.2% |
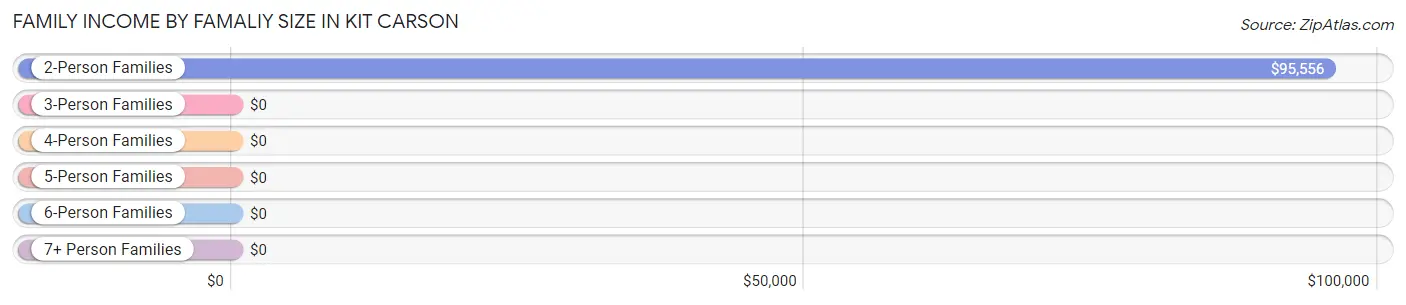
Family Income by Famaliy Size in Kit Carson
2-person families (50 | 70.4%) account for the highest median family income in Kit Carson with $95,556 per family, while 2-person families (50 | 70.4%) have the highest median income of $47,778 per family member.
| Income Bracket | # Families | Median Income |
| 2-Person Families | 50 (70.4%) | $95,556 |
| 3-Person Families | 13 (18.3%) | $0 |
| 4-Person Families | 5 (7.0%) | $0 |
| 5-Person Families | 3 (4.2%) | $0 |
| 6-Person Families | 0 (0.0%) | $0 |
| 7+ Person Families | 0 (0.0%) | $0 |
| Total | 71 (100.0%) | $85,625 |
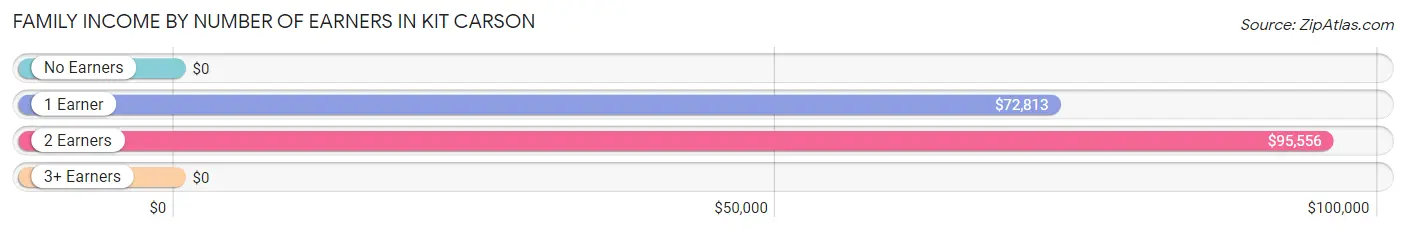
Family Income by Number of Earners in Kit Carson
| Number of Earners | # Families | Median Income |
| No Earners | 4 (5.6%) | $0 |
| 1 Earner | 9 (12.7%) | $72,813 |
| 2 Earners | 58 (81.7%) | $95,556 |
| 3+ Earners | 0 (0.0%) | $0 |
| Total | 71 (100.0%) | $85,625 |
Household Income in Kit Carson
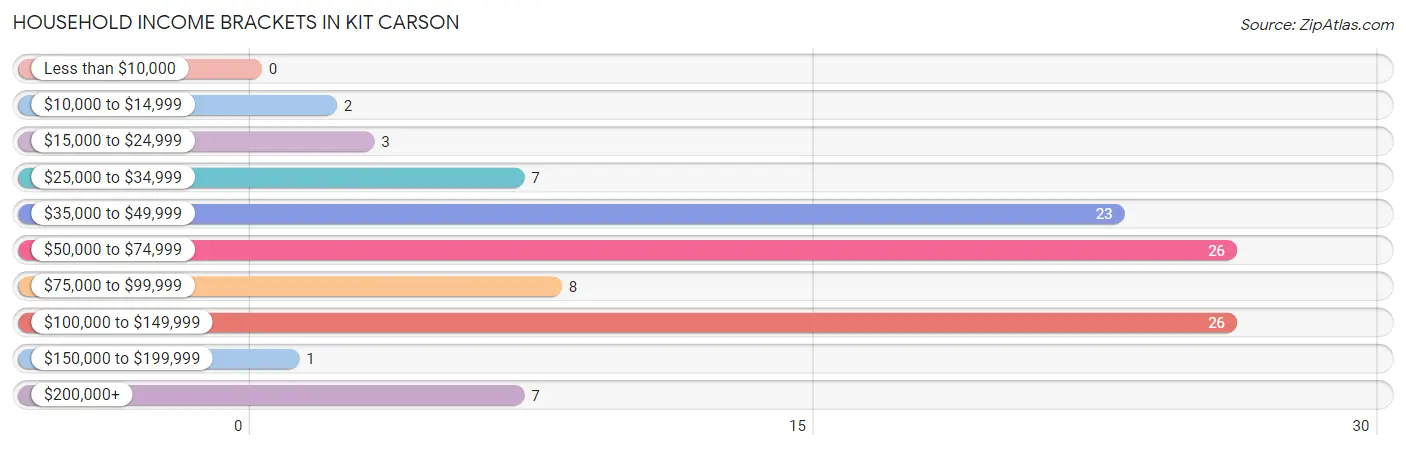
Household Income Brackets in Kit Carson
With 26 households falling in the category, the $50,000 to $74,999 income range is the most frequent in Kit Carson, accounting for 25.2% of all households.
| Income Bracket | # Households | % Households |
| Less than $10,000 | 0 | 0.0% |
| $10,000 to $14,999 | 2 | 1.9% |
| $15,000 to $24,999 | 3 | 2.9% |
| $25,000 to $34,999 | 7 | 6.8% |
| $35,000 to $49,999 | 23 | 22.3% |
| $50,000 to $74,999 | 26 | 25.2% |
| $75,000 to $99,999 | 8 | 7.8% |
| $100,000 to $149,999 | 26 | 25.2% |
| $150,000 to $199,999 | 1 | 1.0% |
| $200,000+ | 7 | 6.8% |
Household Income by Householder Age in Kit Carson
The median household income in Kit Carson is $54,792, with the highest median household income of $117,639 found in the 25 to 44 years age bracket for the primary householder. A total of 48 households (46.6%) fall into this category. Meanwhile, the 15 to 24 years age bracket for the primary householder has the lowest median household income of $0, with 3 households (2.9%) in this group.
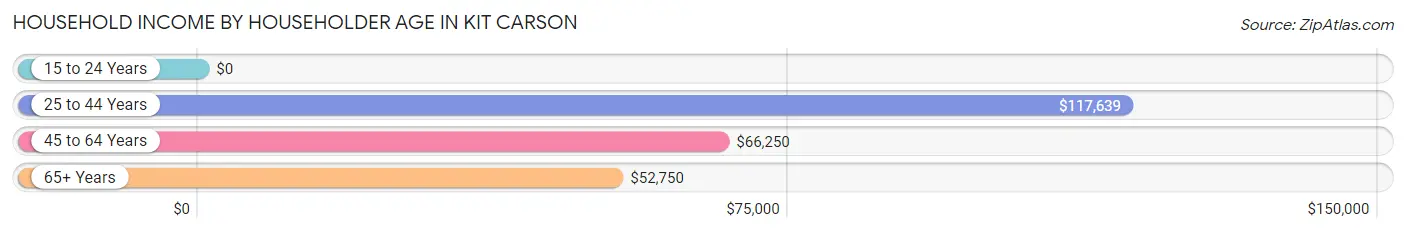
| Income Bracket | # Households | Median Income |
| 15 to 24 Years | 3 (2.9%) | $0 |
| 25 to 44 Years | 48 (46.6%) | $117,639 |
| 45 to 64 Years | 26 (25.2%) | $66,250 |
| 65+ Years | 26 (25.2%) | $52,750 |
| Total | 103 (100.0%) | $54,792 |
Poverty in Kit Carson
Income Below Poverty by Sex and Age in Kit Carson
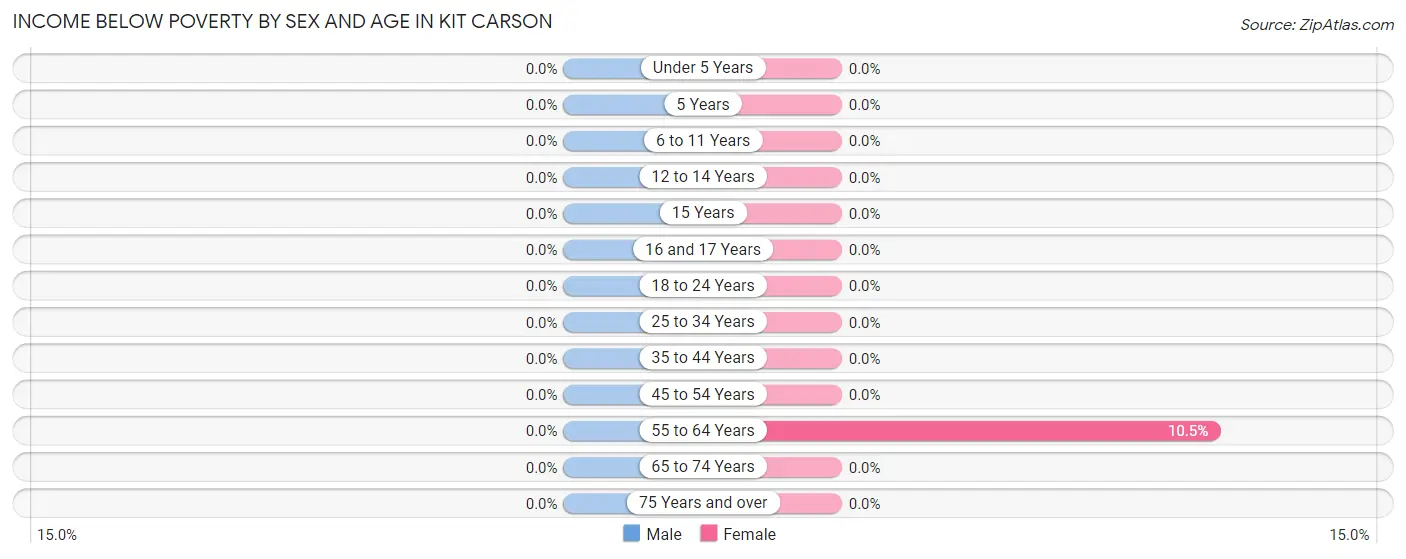
| Age Bracket | Male | Female |
| Under 5 Years | 0 (0.0%) | 0 (0.0%) |
| 5 Years | 0 (0.0%) | 0 (0.0%) |
| 6 to 11 Years | 0 (0.0%) | 0 (0.0%) |
| 12 to 14 Years | 0 (0.0%) | 0 (0.0%) |
| 15 Years | 0 (0.0%) | 0 (0.0%) |
| 16 and 17 Years | 0 (0.0%) | 0 (0.0%) |
| 18 to 24 Years | 0 (0.0%) | 0 (0.0%) |
| 25 to 34 Years | 0 (0.0%) | 0 (0.0%) |
| 35 to 44 Years | 0 (0.0%) | 0 (0.0%) |
| 45 to 54 Years | 0 (0.0%) | 0 (0.0%) |
| 55 to 64 Years | 0 (0.0%) | 2 (10.5%) |
| 65 to 74 Years | 0 (0.0%) | 0 (0.0%) |
| 75 Years and over | 0 (0.0%) | 0 (0.0%) |
| Total | 0 (0.0%) | 2 (2.0%) |
Income Above Poverty by Sex and Age in Kit Carson
According to the poverty statistics in Kit Carson, males aged under 5 years and females aged under 5 years are the age groups that are most secure financially, with 100.0% of males and 100.0% of females in these age groups living above the poverty line.
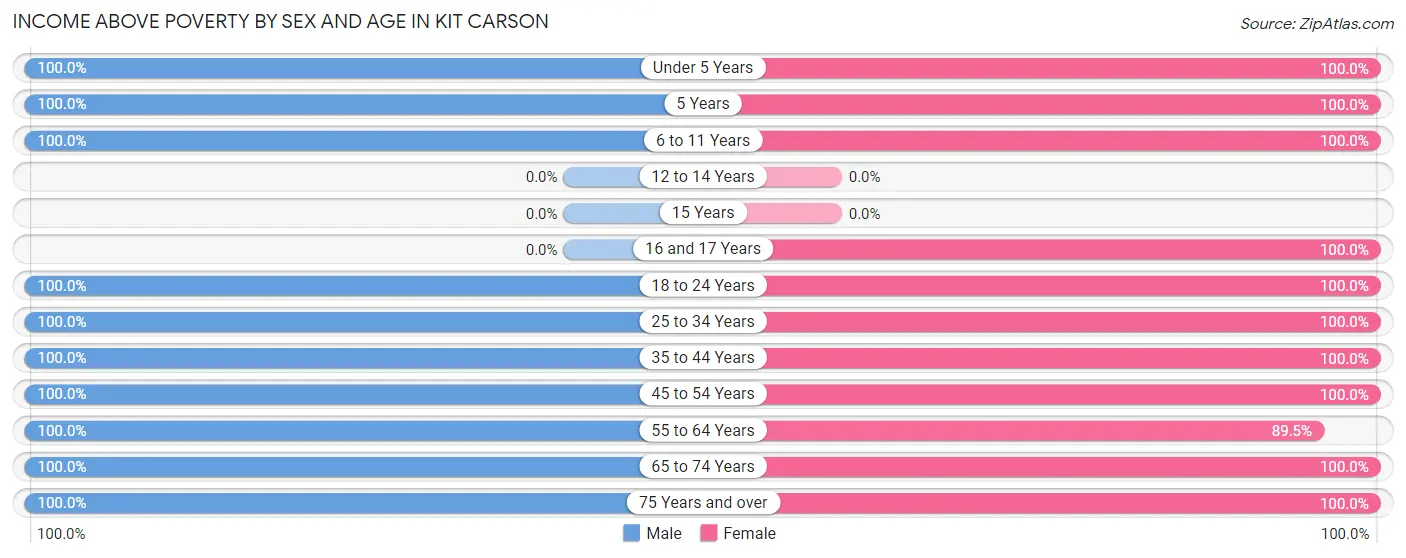
| Age Bracket | Male | Female |
| Under 5 Years | 9 (100.0%) | 2 (100.0%) |
| 5 Years | 5 (100.0%) | 1 (100.0%) |
| 6 to 11 Years | 3 (100.0%) | 11 (100.0%) |
| 12 to 14 Years | 0 (0.0%) | 0 (0.0%) |
| 15 Years | 0 (0.0%) | 0 (0.0%) |
| 16 and 17 Years | 0 (0.0%) | 12 (100.0%) |
| 18 to 24 Years | 3 (100.0%) | 10 (100.0%) |
| 25 to 34 Years | 24 (100.0%) | 10 (100.0%) |
| 35 to 44 Years | 31 (100.0%) | 12 (100.0%) |
| 45 to 54 Years | 13 (100.0%) | 6 (100.0%) |
| 55 to 64 Years | 10 (100.0%) | 17 (89.5%) |
| 65 to 74 Years | 15 (100.0%) | 10 (100.0%) |
| 75 Years and over | 6 (100.0%) | 6 (100.0%) |
| Total | 119 (100.0%) | 97 (98.0%) |
Income Below Poverty Among Married-Couple Families in Kit Carson
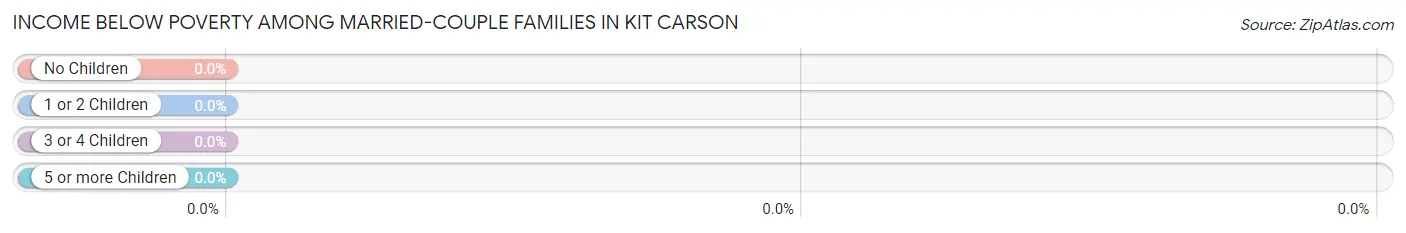
| Children | Above Poverty | Below Poverty |
| No Children | 25 (100.0%) | 0 (0.0%) |
| 1 or 2 Children | 17 (100.0%) | 0 (0.0%) |
| 3 or 4 Children | 3 (100.0%) | 0 (0.0%) |
| 5 or more Children | 0 (0.0%) | 0 (0.0%) |
| Total | 45 (100.0%) | 0 (0.0%) |
Income Below Poverty Among Single-Parent Households in Kit Carson
| Children | Single Father | Single Mother |
| No Children | 0 (0.0%) | 0 (0.0%) |
| 1 or 2 Children | 0 (0.0%) | 0 (0.0%) |
| 3 or 4 Children | 0 (0.0%) | 0 (0.0%) |
| 5 or more Children | 0 (0.0%) | 0 (0.0%) |
| Total | 0 (0.0%) | 0 (0.0%) |
Income Below Poverty Among Married-Couple vs Single-Parent Households in Kit Carson
| Children | Married-Couple Families | Single-Parent Households |
| No Children | 0 (0.0%) | 0 (0.0%) |
| 1 or 2 Children | 0 (0.0%) | 0 (0.0%) |
| 3 or 4 Children | 0 (0.0%) | 0 (0.0%) |
| 5 or more Children | 0 (0.0%) | 0 (0.0%) |
| Total | 0 (0.0%) | 0 (0.0%) |
Race in Kit Carson
The most populous races in Kit Carson are White / Caucasian (199 | 87.3%), Two or more Races (16 | 7.0%), and Black / African American (8 | 3.5%).
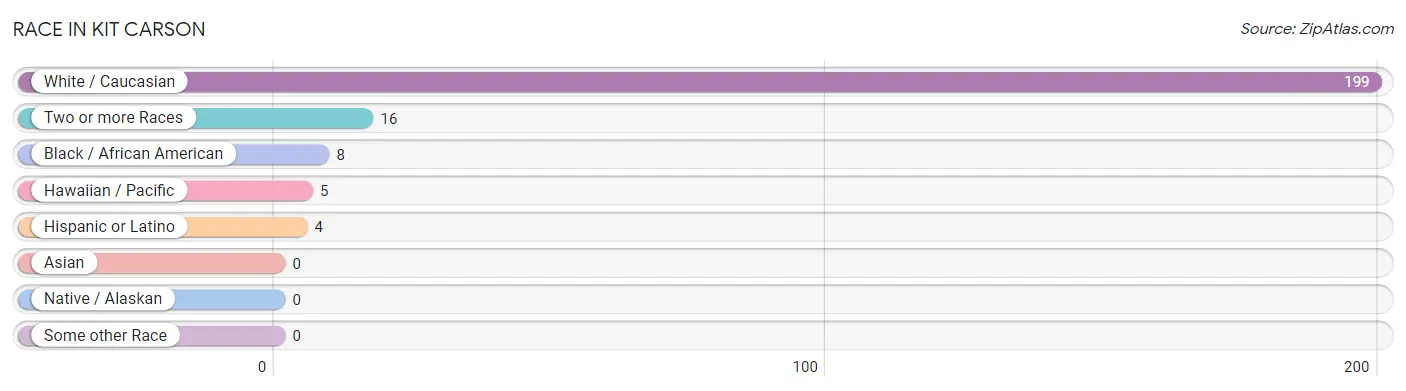
| Race | # Population | % Population |
| Asian | 0 | 0.0% |
| Black / African American | 8 | 3.5% |
| Hawaiian / Pacific | 5 | 2.2% |
| Hispanic or Latino | 4 | 1.8% |
| Native / Alaskan | 0 | 0.0% |
| White / Caucasian | 199 | 87.3% |
| Two or more Races | 16 | 7.0% |
| Some other Race | 0 | 0.0% |
| Total | 228 | 100.0% |
Ancestry in Kit Carson
The most populous ancestries reported in Kit Carson are German (104 | 45.6%), Irish (44 | 19.3%), English (21 | 9.2%), Scottish (10 | 4.4%), and Czech (8 | 3.5%), together accounting for 82.0% of all Kit Carson residents.
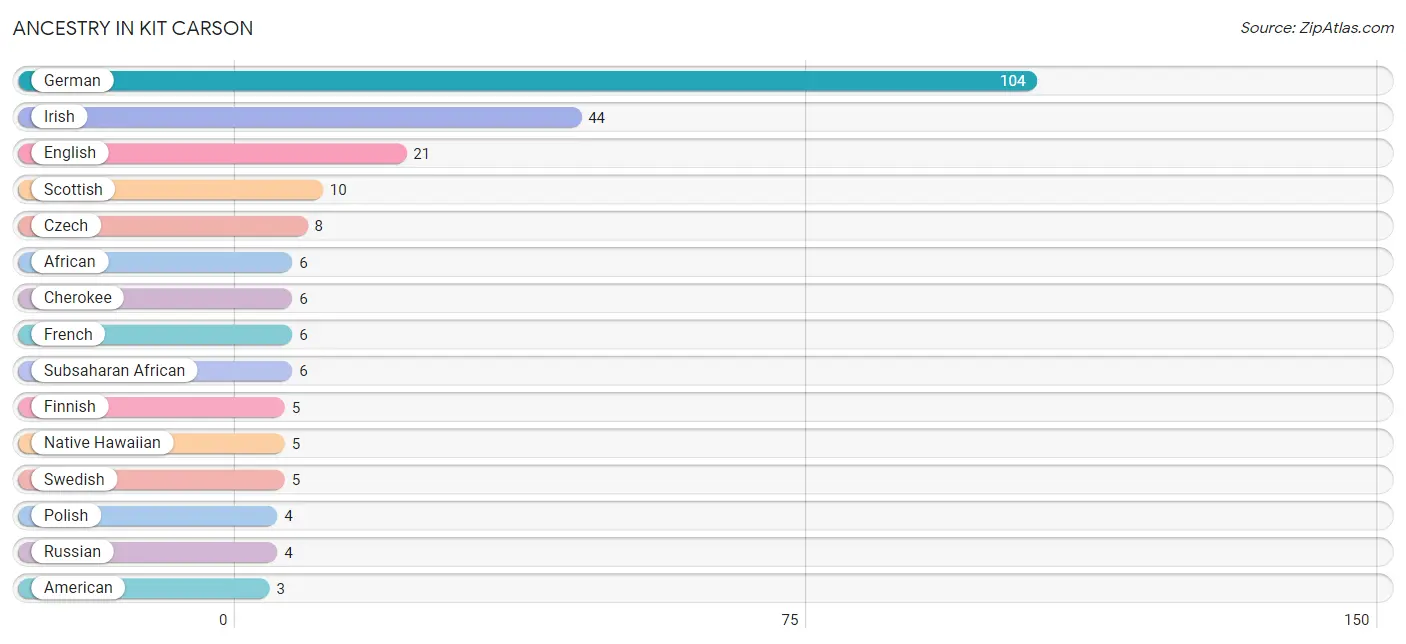
| Ancestry | # Population | % Population |
| African | 6 | 2.6% |
| American | 3 | 1.3% |
| Belgian | 2 | 0.9% |
| Blackfeet | 2 | 0.9% |
| Central American | 1 | 0.4% |
| Cherokee | 6 | 2.6% |
| Czech | 8 | 3.5% |
| Dutch | 1 | 0.4% |
| English | 21 | 9.2% |
| European | 3 | 1.3% |
| Finnish | 5 | 2.2% |
| French | 6 | 2.6% |
| German | 104 | 45.6% |
| Irish | 44 | 19.3% |
| Mexican | 2 | 0.9% |
| Native Hawaiian | 5 | 2.2% |
| Navajo | 1 | 0.4% |
| Norwegian | 3 | 1.3% |
| Panamanian | 1 | 0.4% |
| Polish | 4 | 1.8% |
| Portuguese | 1 | 0.4% |
| Russian | 4 | 1.8% |
| Scottish | 10 | 4.4% |
| Spanish | 1 | 0.4% |
| Subsaharan African | 6 | 2.6% |
| Swedish | 5 | 2.2% | View All 26 Rows |
Immigrants in Kit Carson

| Immigration Origin | # Population | % Population | View All 0 Rows |
Sex and Age in Kit Carson
Sex and Age in Kit Carson
The most populous age groups in Kit Carson are 40 to 44 Years (24 | 19.2%) for men and 15 to 19 Years (16 | 15.5%) for women.
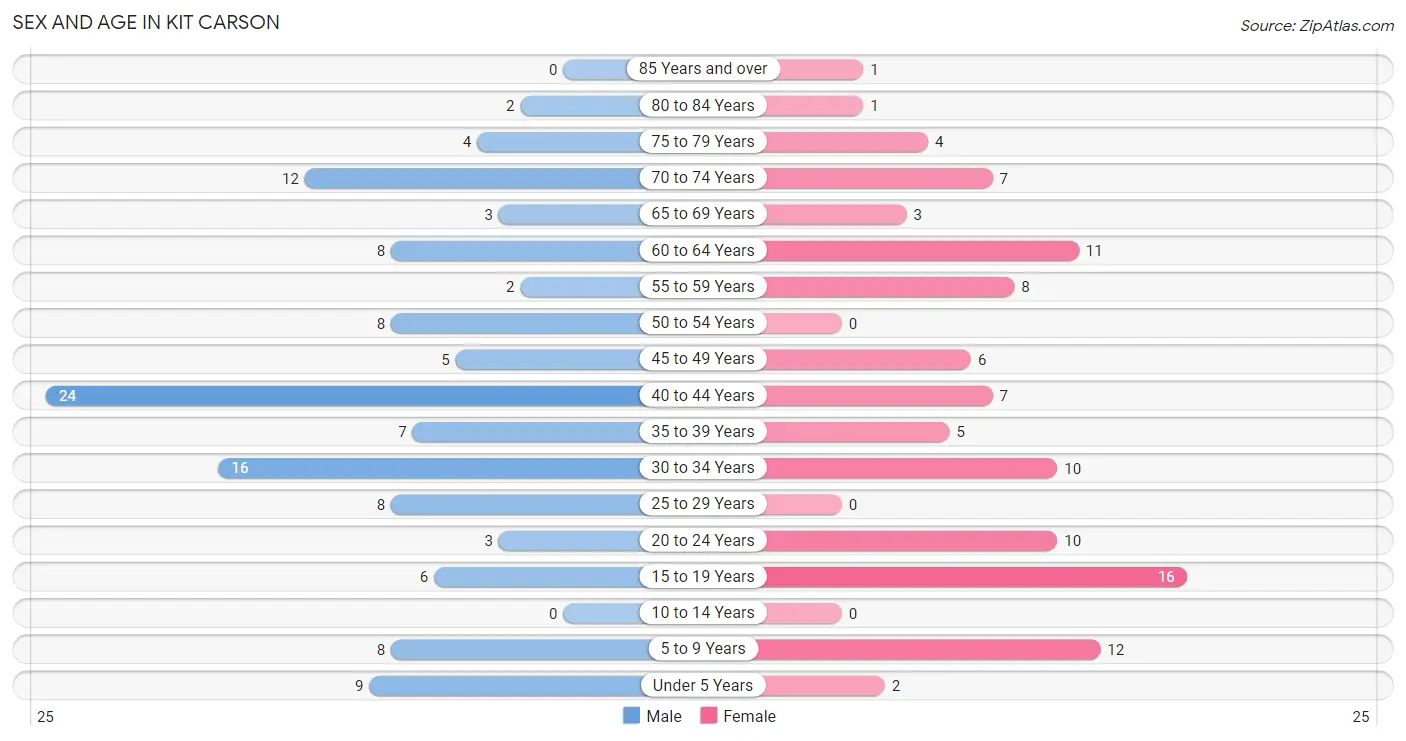
| Age Bracket | Male | Female |
| Under 5 Years | 9 (7.2%) | 2 (1.9%) |
| 5 to 9 Years | 8 (6.4%) | 12 (11.7%) |
| 10 to 14 Years | 0 (0.0%) | 0 (0.0%) |
| 15 to 19 Years | 6 (4.8%) | 16 (15.5%) |
| 20 to 24 Years | 3 (2.4%) | 10 (9.7%) |
| 25 to 29 Years | 8 (6.4%) | 0 (0.0%) |
| 30 to 34 Years | 16 (12.8%) | 10 (9.7%) |
| 35 to 39 Years | 7 (5.6%) | 5 (4.9%) |
| 40 to 44 Years | 24 (19.2%) | 7 (6.8%) |
| 45 to 49 Years | 5 (4.0%) | 6 (5.8%) |
| 50 to 54 Years | 8 (6.4%) | 0 (0.0%) |
| 55 to 59 Years | 2 (1.6%) | 8 (7.8%) |
| 60 to 64 Years | 8 (6.4%) | 11 (10.7%) |
| 65 to 69 Years | 3 (2.4%) | 3 (2.9%) |
| 70 to 74 Years | 12 (9.6%) | 7 (6.8%) |
| 75 to 79 Years | 4 (3.2%) | 4 (3.9%) |
| 80 to 84 Years | 2 (1.6%) | 1 (1.0%) |
| 85 Years and over | 0 (0.0%) | 1 (1.0%) |
| Total | 125 (100.0%) | 103 (100.0%) |
Families and Households in Kit Carson
Median Family Size in Kit Carson
The median family size in Kit Carson is 2.46 persons per family, with married-couple families (45 | 63.4%) accounting for the largest median family size of 2.96 persons per family. On the other hand, single female/mother families (8 | 11.3%) represent the smallest median family size with 1.50 persons per family.
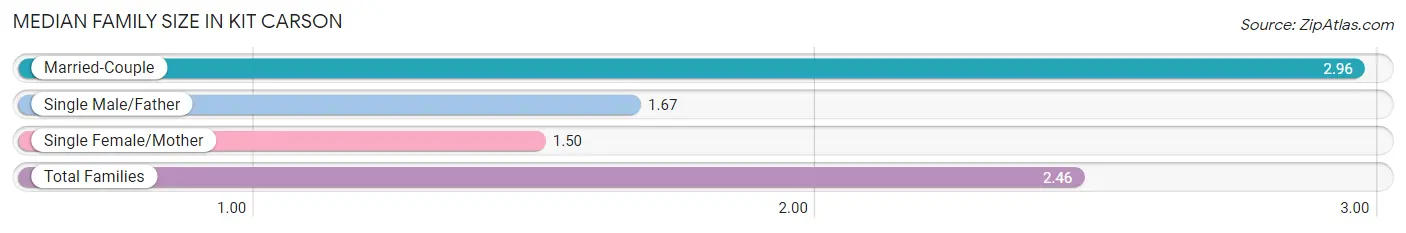
| Family Type | # Families | Family Size |
| Married-Couple | 45 (63.4%) | 2.96 |
| Single Male/Father | 18 (25.4%) | 1.67 |
| Single Female/Mother | 8 (11.3%) | 1.50 |
| Total Families | 71 (100.0%) | 2.46 |
Median Household Size in Kit Carson
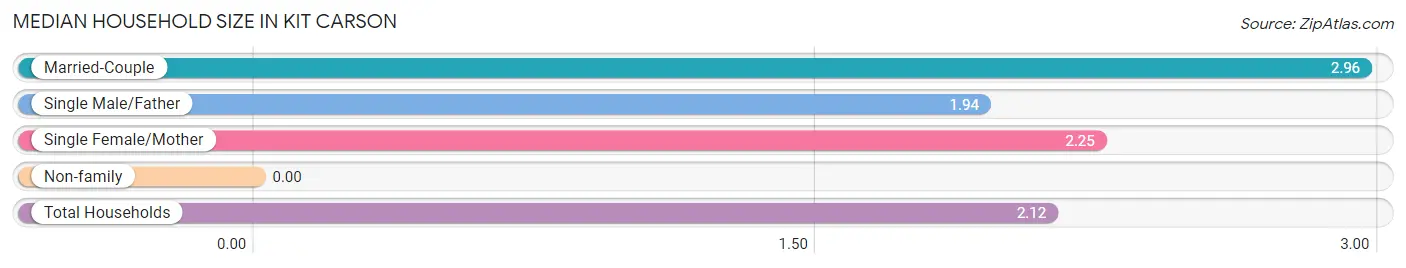
| Household Type | # Households | Household Size |
| Married-Couple | 45 (43.7%) | 2.96 |
| Single Male/Father | 18 (17.5%) | 1.94 |
| Single Female/Mother | 8 (7.8%) | 2.25 |
| Non-family | 32 (31.1%) | - |
| Total Households | 103 (100.0%) | 2.12 |
Household Size by Marriage Status in Kit Carson
Out of a total of 103 households in Kit Carson, 71 (68.9%) are family households, while 32 (31.1%) are nonfamily households. The most numerous type of family households are 3-person households, comprising 35, and the most common type of nonfamily households are 1-person households, comprising 32.
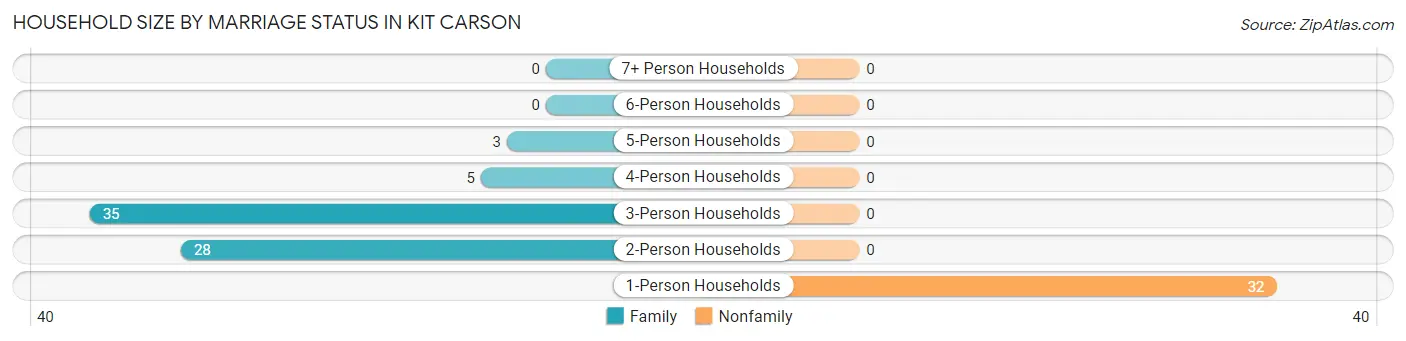
| Household Size | Family Households | Nonfamily Households |
| 1-Person Households | - | 32 (31.1%) |
| 2-Person Households | 28 (27.2%) | 0 (0.0%) |
| 3-Person Households | 35 (34.0%) | 0 (0.0%) |
| 4-Person Households | 5 (4.9%) | 0 (0.0%) |
| 5-Person Households | 3 (2.9%) | 0 (0.0%) |
| 6-Person Households | 0 (0.0%) | 0 (0.0%) |
| 7+ Person Households | 0 (0.0%) | 0 (0.0%) |
| Total | 71 (68.9%) | 32 (31.1%) |
Female Fertility in Kit Carson
Fertility by Age in Kit Carson
| Age Bracket | Women with Births | Births / 1,000 Women |
| 15 to 19 years | 0 (0.0%) | 0.0 |
| 20 to 34 years | 0 (0.0%) | 0.0 |
| 35 to 50 years | 0 (0.0%) | 0.0 |
| Total | 0 (0.0%) | 0.0 |
Fertility by Age by Marriage Status in Kit Carson
| Age Bracket | Married | Unmarried |
| 15 to 19 years | 0 (0.0%) | 0 (0.0%) |
| 20 to 34 years | 0 (0.0%) | 0 (0.0%) |
| 35 to 50 years | 0 (0.0%) | 0 (0.0%) |
| Total | 0 (0.0%) | 0 (0.0%) |
Fertility by Education in Kit Carson
| Educational Attainment | Women with Births | Births / 1,000 Women |
| Less than High School | 0 (0.0%) | 0.0 |
| High School Diploma | 0 (0.0%) | 0.0 |
| College or Associate's Degree | 0 (0.0%) | 0.0 |
| Bachelor's Degree | 0 (0.0%) | 0.0 |
| Graduate Degree | 0 (0.0%) | 0.0 |
| Total | 0 (0.0%) | 0.0 |
Fertility by Education by Marriage Status in Kit Carson
| Educational Attainment | Married | Unmarried |
| Less than High School | 0 (0.0%) | 0 (0.0%) |
| High School Diploma | 0 (0.0%) | 0 (0.0%) |
| College or Associate's Degree | 0 (0.0%) | 0 (0.0%) |
| Bachelor's Degree | 0 (0.0%) | 0 (0.0%) |
| Graduate Degree | 0 (0.0%) | 0 (0.0%) |
| Total | 0 (0.0%) | 0 (0.0%) |
Employment Characteristics in Kit Carson
Employment by Class of Employer in Kit Carson
Among the 132 employed individuals in Kit Carson, private company employees (61 | 46.2%), local government employees (25 | 18.9%), and self-employed (not incorporated) (16 | 12.1%) make up the most common classes of employment.
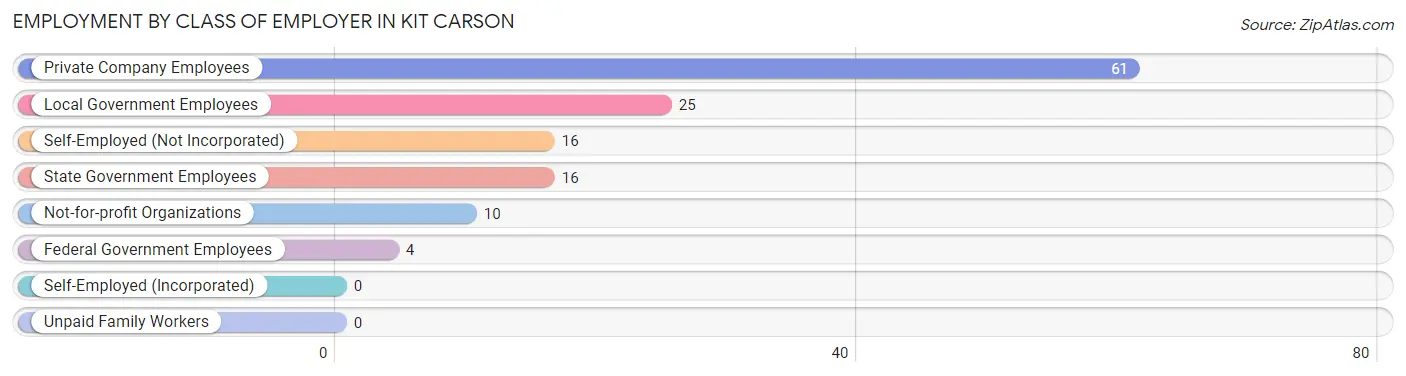
| Employer Class | # Employees | % Employees |
| Private Company Employees | 61 | 46.2% |
| Self-Employed (Incorporated) | 0 | 0.0% |
| Self-Employed (Not Incorporated) | 16 | 12.1% |
| Not-for-profit Organizations | 10 | 7.6% |
| Local Government Employees | 25 | 18.9% |
| State Government Employees | 16 | 12.1% |
| Federal Government Employees | 4 | 3.0% |
| Unpaid Family Workers | 0 | 0.0% |
| Total | 132 | 100.0% |
Employment Status by Age in Kit Carson
According to the labor force statistics for Kit Carson, out of the total population over 16 years of age (196), 72.4% or 142 individuals are in the labor force, with 2.8% or 4 of them unemployed. The age group with the highest labor force participation rate is 20 to 24 years, with 100.0% or 13 individuals in the labor force. Within the labor force, the 35 to 44 years age range has the highest percentage of unemployed individuals, with 7.0% or 3 of them being unemployed.
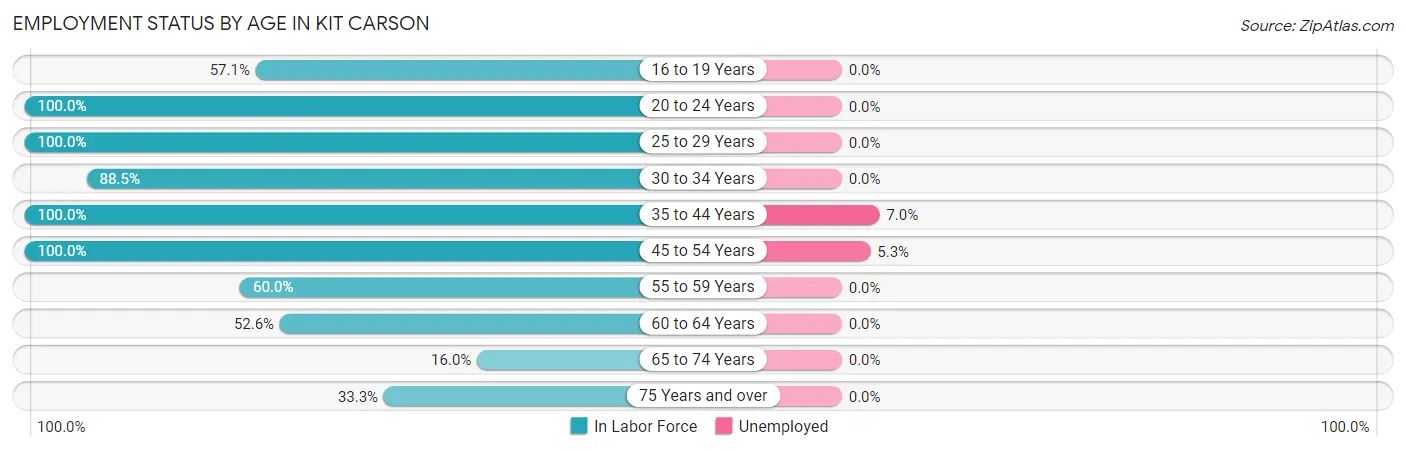
| Age Bracket | In Labor Force | Unemployed |
| 16 to 19 Years | 12 (57.1%) | 0 (0.0%) |
| 20 to 24 Years | 13 (100.0%) | 0 (0.0%) |
| 25 to 29 Years | 8 (100.0%) | 0 (0.0%) |
| 30 to 34 Years | 23 (88.5%) | 0 (0.0%) |
| 35 to 44 Years | 43 (100.0%) | 3 (7.0%) |
| 45 to 54 Years | 19 (100.0%) | 1 (5.3%) |
| 55 to 59 Years | 6 (60.0%) | 0 (0.0%) |
| 60 to 64 Years | 10 (52.6%) | 0 (0.0%) |
| 65 to 74 Years | 4 (16.0%) | 0 (0.0%) |
| 75 Years and over | 4 (33.3%) | 0 (0.0%) |
| Total | 142 (72.4%) | 4 (2.8%) |
Employment Status by Educational Attainment in Kit Carson
According to labor force statistics for Kit Carson, 87.2% of individuals (109) out of the total population between 25 and 64 years of age (125) are in the labor force, with 3.7% or 4 of them being unemployed. The group with the highest labor force participation rate are those with the educational attainment of bachelor's degree or higher, with 100.0% or 38 individuals in the labor force. Within the labor force, individuals with high school diploma education have the highest percentage of unemployment, with 6.7% or 1 of them being unemployed.
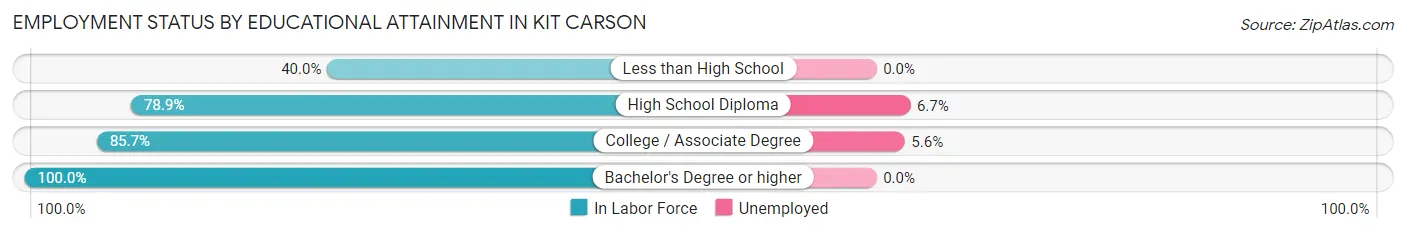
| Educational Attainment | In Labor Force | Unemployed |
| Less than High School | 2 (40.0%) | 0 (0.0%) |
| High School Diploma | 15 (78.9%) | 1 (6.7%) |
| College / Associate Degree | 54 (85.7%) | 4 (5.6%) |
| Bachelor's Degree or higher | 38 (100.0%) | 0 (0.0%) |
| Total | 109 (87.2%) | 5 (3.7%) |
Employment Occupations by Sex in Kit Carson
Management, Business, Science and Arts Occupations
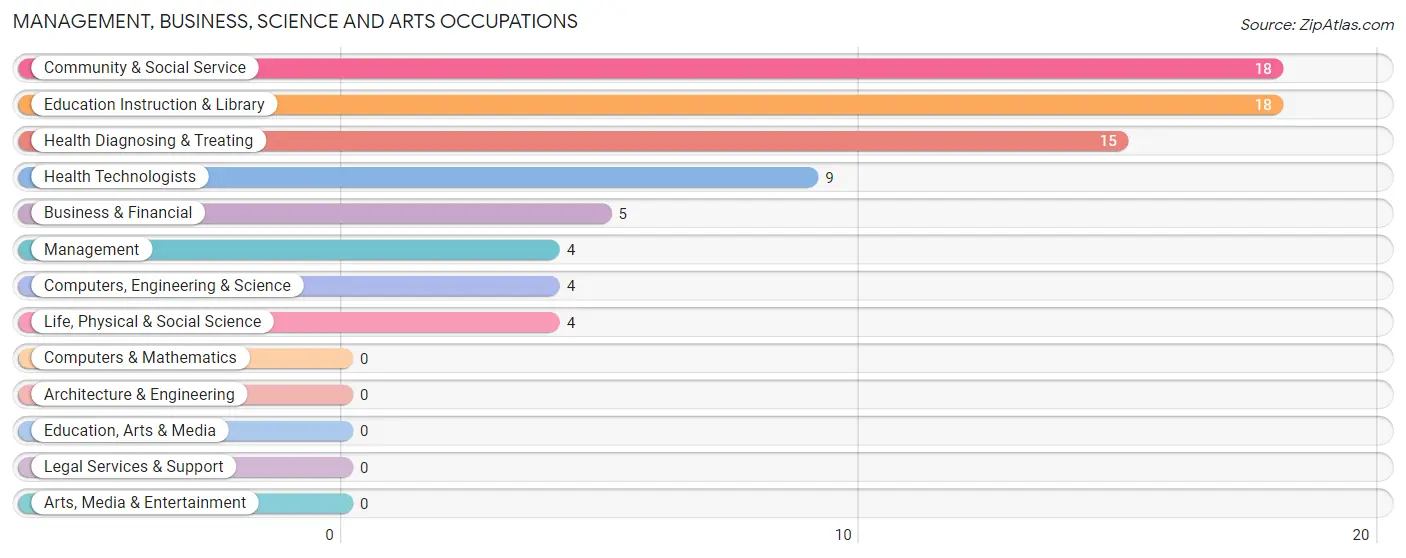
The most common Management, Business, Science and Arts occupations in Kit Carson are Community & Social Service (18 | 13.0%), Education Instruction & Library (18 | 13.0%), Health Diagnosing & Treating (15 | 10.9%), Health Technologists (9 | 6.5%), and Business & Financial (5 | 3.6%).
Management, Business, Science and Arts Occupations by Sex
Within the Management, Business, Science and Arts occupations in Kit Carson, the most male-oriented occupations are Management (100.0%), Computers, Engineering & Science (100.0%), and Life, Physical & Social Science (100.0%), while the most female-oriented occupations are Business & Financial (100.0%), Health Technologists (100.0%), and Community & Social Service (61.1%).
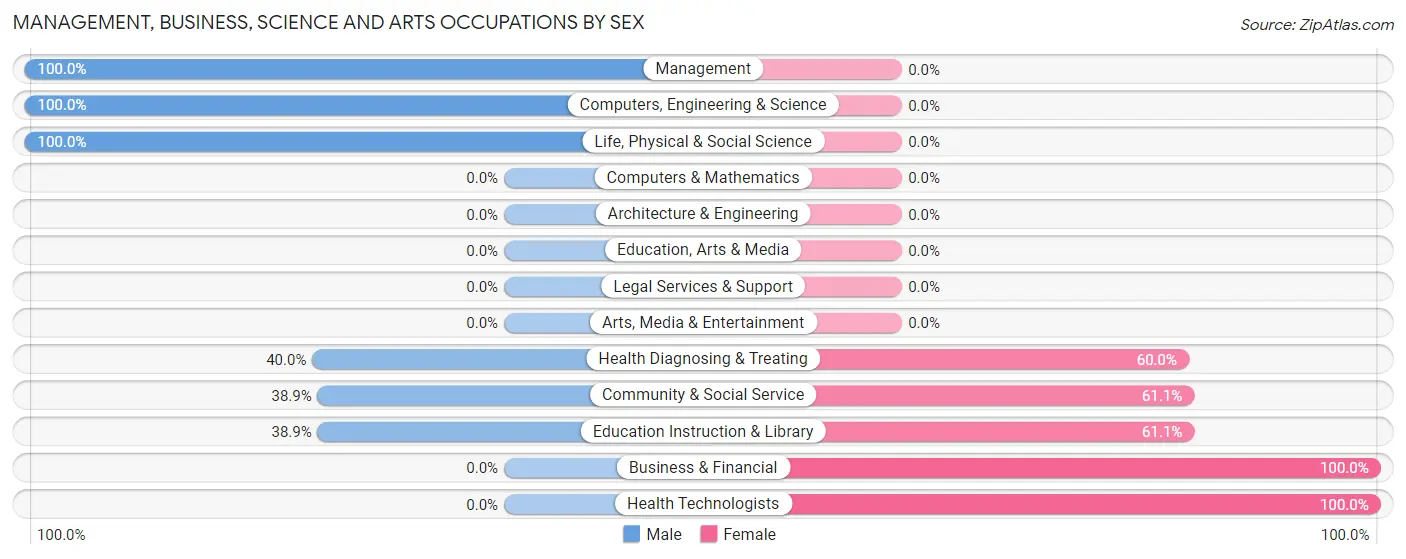
| Occupation | Male | Female |
| Management | 4 (100.0%) | 0 (0.0%) |
| Business & Financial | 0 (0.0%) | 5 (100.0%) |
| Computers, Engineering & Science | 4 (100.0%) | 0 (0.0%) |
| Computers & Mathematics | 0 (0.0%) | 0 (0.0%) |
| Architecture & Engineering | 0 (0.0%) | 0 (0.0%) |
| Life, Physical & Social Science | 4 (100.0%) | 0 (0.0%) |
| Community & Social Service | 7 (38.9%) | 11 (61.1%) |
| Education, Arts & Media | 0 (0.0%) | 0 (0.0%) |
| Legal Services & Support | 0 (0.0%) | 0 (0.0%) |
| Education Instruction & Library | 7 (38.9%) | 11 (61.1%) |
| Arts, Media & Entertainment | 0 (0.0%) | 0 (0.0%) |
| Health Diagnosing & Treating | 6 (40.0%) | 9 (60.0%) |
| Health Technologists | 0 (0.0%) | 9 (100.0%) |
| Total (Category) | 21 (45.7%) | 25 (54.3%) |
| Total (Overall) | 79 (57.3%) | 59 (42.7%) |
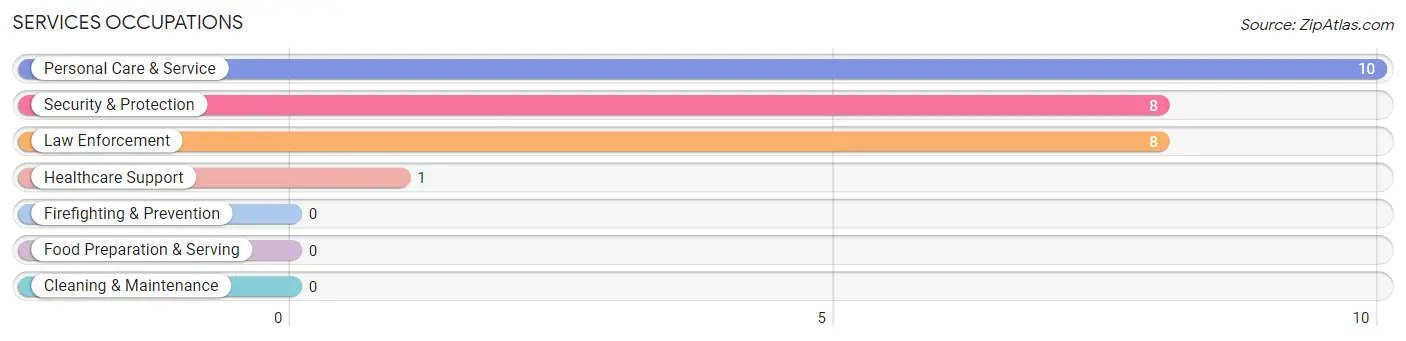
Services Occupations
The most common Services occupations in Kit Carson are Personal Care & Service (10 | 7.2%), Security & Protection (8 | 5.8%), Law Enforcement (8 | 5.8%), and Healthcare Support (1 | 0.7%).
Services Occupations by Sex
Within the Services occupations in Kit Carson, the most male-oriented occupations are Security & Protection (100.0%), and Law Enforcement (100.0%), while the most female-oriented occupations are Healthcare Support (100.0%), and Personal Care & Service (100.0%).
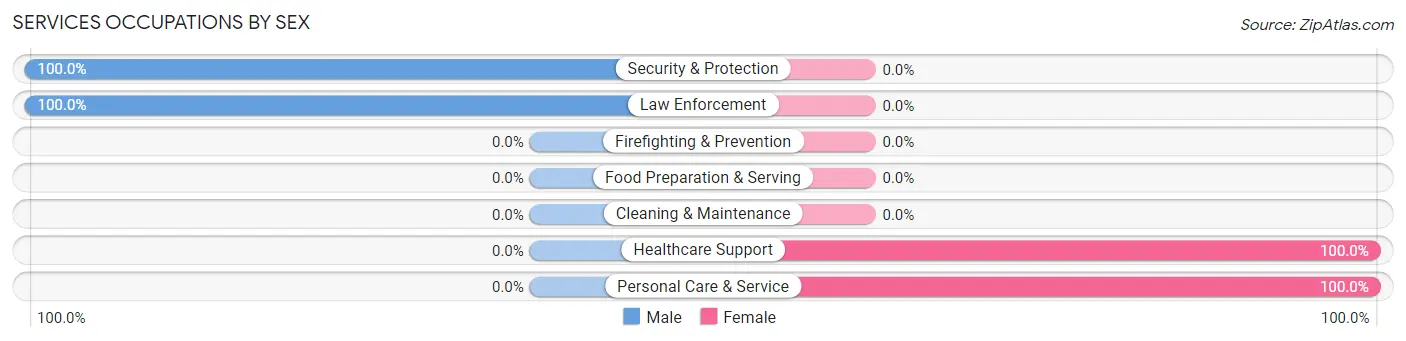
| Occupation | Male | Female |
| Healthcare Support | 0 (0.0%) | 1 (100.0%) |
| Security & Protection | 8 (100.0%) | 0 (0.0%) |
| Firefighting & Prevention | 0 (0.0%) | 0 (0.0%) |
| Law Enforcement | 8 (100.0%) | 0 (0.0%) |
| Food Preparation & Serving | 0 (0.0%) | 0 (0.0%) |
| Cleaning & Maintenance | 0 (0.0%) | 0 (0.0%) |
| Personal Care & Service | 0 (0.0%) | 10 (100.0%) |
| Total (Category) | 8 (42.1%) | 11 (57.9%) |
| Total (Overall) | 79 (57.3%) | 59 (42.7%) |
Sales and Office Occupations
The most common Sales and Office occupations in Kit Carson are Sales & Related (7 | 5.1%), and Office & Administration (6 | 4.3%).
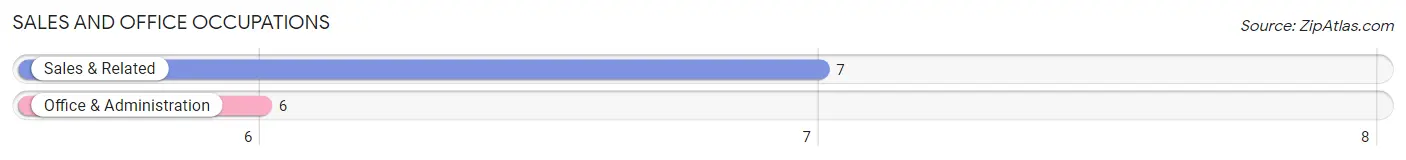
Sales and Office Occupations by Sex
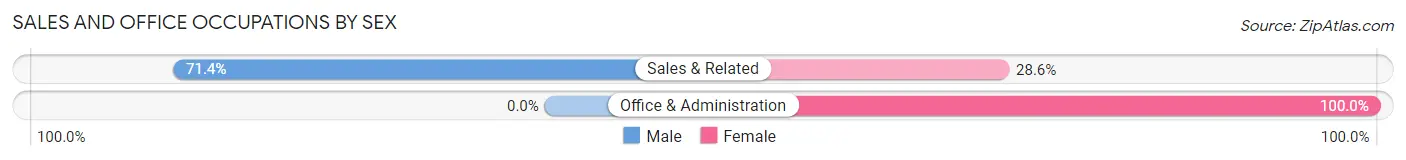
| Occupation | Male | Female |
| Sales & Related | 5 (71.4%) | 2 (28.6%) |
| Office & Administration | 0 (0.0%) | 6 (100.0%) |
| Total (Category) | 5 (38.5%) | 8 (61.5%) |
| Total (Overall) | 79 (57.3%) | 59 (42.7%) |
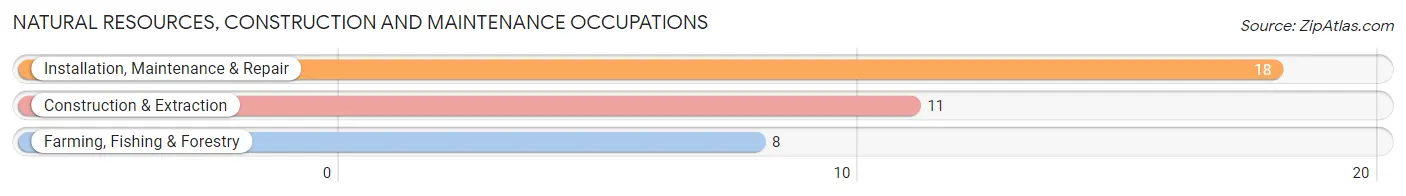
Natural Resources, Construction and Maintenance Occupations
The most common Natural Resources, Construction and Maintenance occupations in Kit Carson are Installation, Maintenance & Repair (18 | 13.0%), Construction & Extraction (11 | 8.0%), and Farming, Fishing & Forestry (8 | 5.8%).
Natural Resources, Construction and Maintenance Occupations by Sex
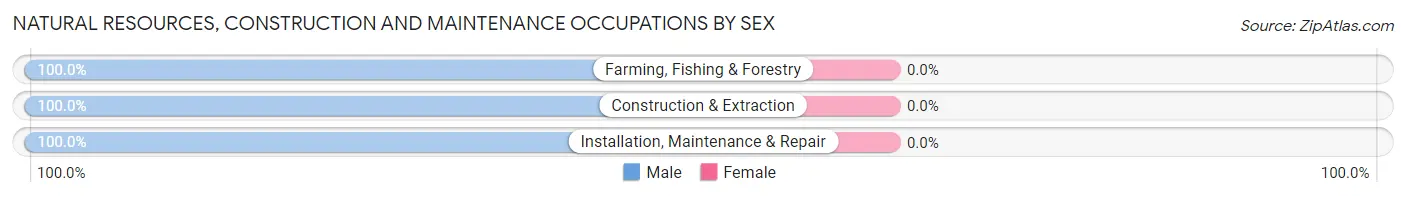
| Occupation | Male | Female |
| Farming, Fishing & Forestry | 8 (100.0%) | 0 (0.0%) |
| Construction & Extraction | 11 (100.0%) | 0 (0.0%) |
| Installation, Maintenance & Repair | 18 (100.0%) | 0 (0.0%) |
| Total (Category) | 37 (100.0%) | 0 (0.0%) |
| Total (Overall) | 79 (57.3%) | 59 (42.7%) |
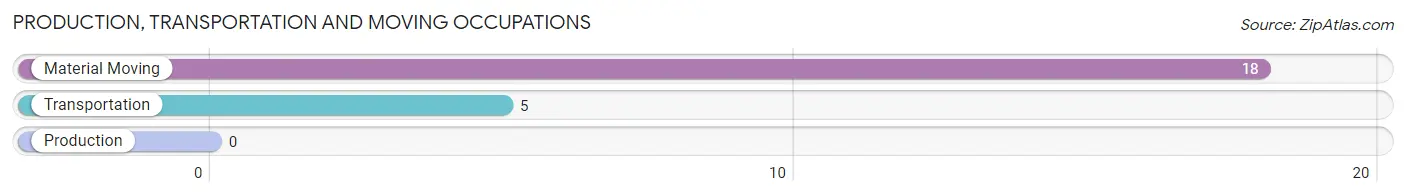
Production, Transportation and Moving Occupations
The most common Production, Transportation and Moving occupations in Kit Carson are Material Moving (18 | 13.0%), and Transportation (5 | 3.6%).
Production, Transportation and Moving Occupations by Sex
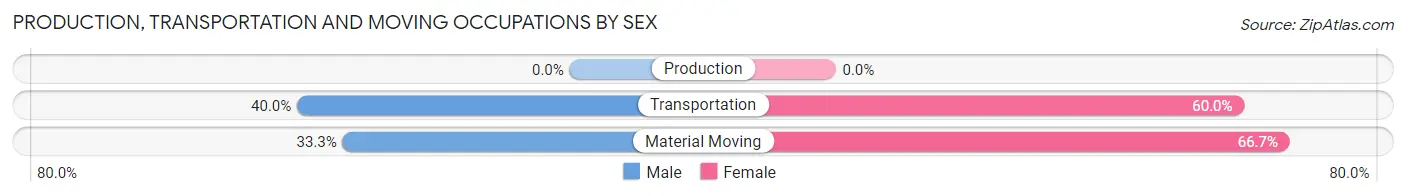
| Occupation | Male | Female |
| Production | 0 (0.0%) | 0 (0.0%) |
| Transportation | 2 (40.0%) | 3 (60.0%) |
| Material Moving | 6 (33.3%) | 12 (66.7%) |
| Total (Category) | 8 (34.8%) | 15 (65.2%) |
| Total (Overall) | 79 (57.3%) | 59 (42.7%) |
Employment Industries by Sex in Kit Carson
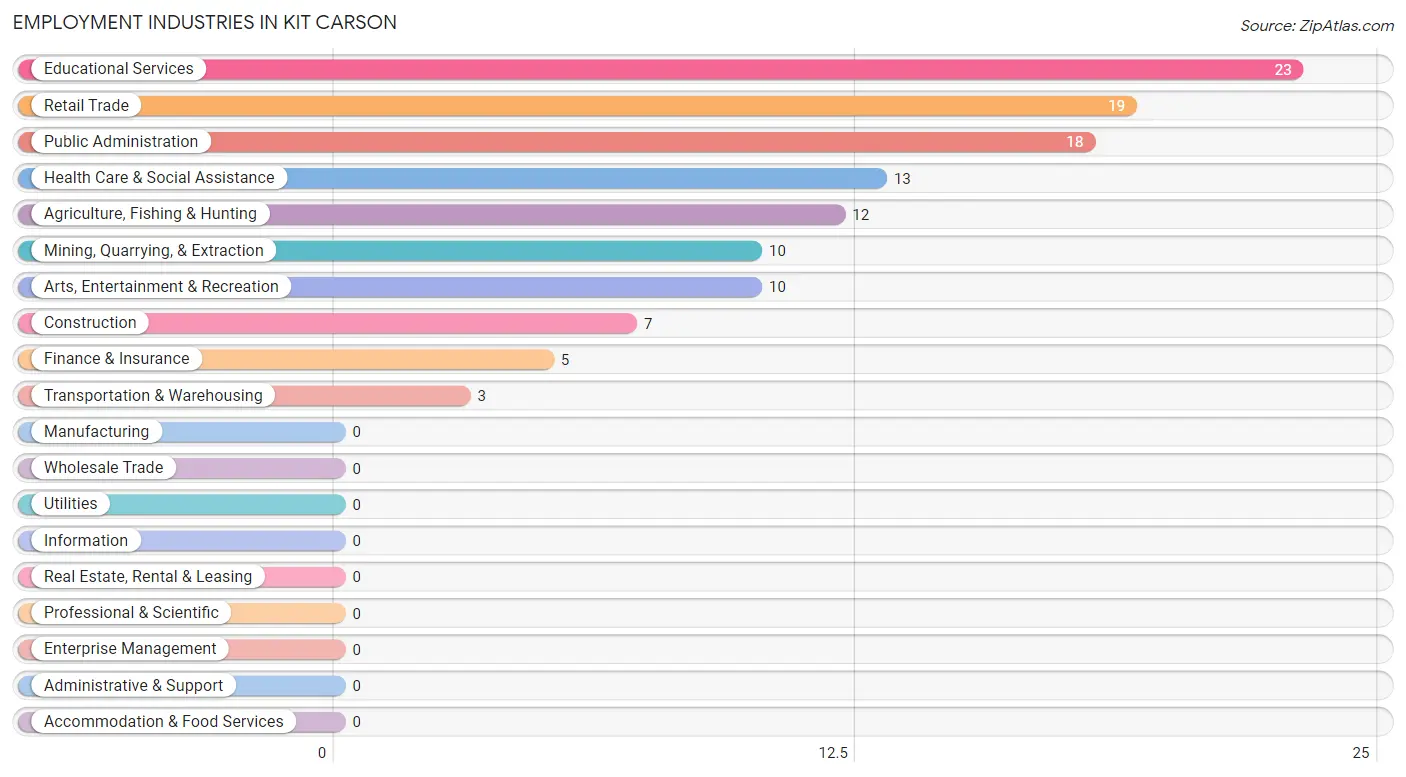
Employment Industries in Kit Carson
The major employment industries in Kit Carson include Educational Services (23 | 16.7%), Retail Trade (19 | 13.8%), Public Administration (18 | 13.0%), Health Care & Social Assistance (13 | 9.4%), and Agriculture, Fishing & Hunting (12 | 8.7%).
Employment Industries by Sex in Kit Carson
The Kit Carson industries that see more men than women are Agriculture, Fishing & Hunting (100.0%), Mining, Quarrying, & Extraction (100.0%), and Construction (100.0%), whereas the industries that tend to have a higher number of women are Finance & Insurance (100.0%), Health Care & Social Assistance (100.0%), and Arts, Entertainment & Recreation (100.0%).
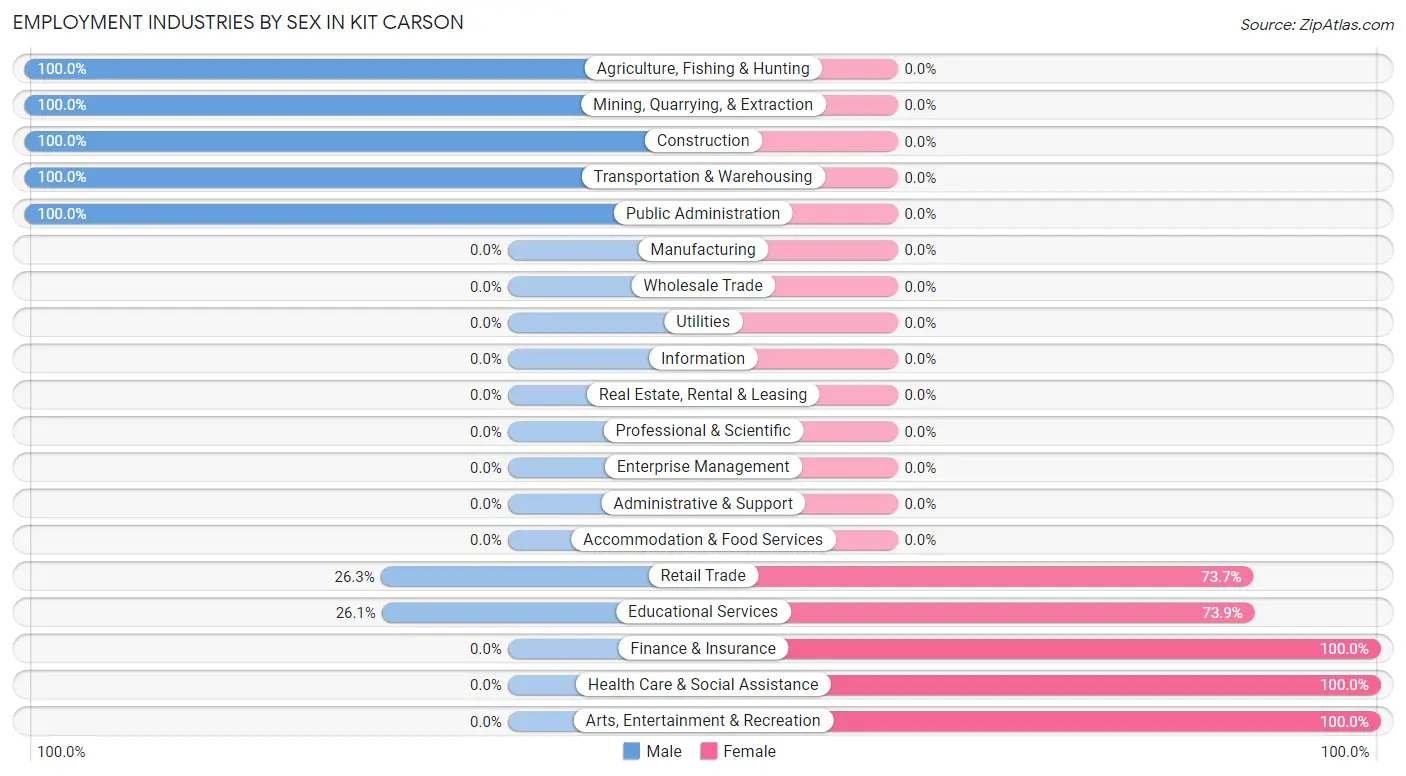
| Industry | Male | Female |
| Agriculture, Fishing & Hunting | 12 (100.0%) | 0 (0.0%) |
| Mining, Quarrying, & Extraction | 10 (100.0%) | 0 (0.0%) |
| Construction | 7 (100.0%) | 0 (0.0%) |
| Manufacturing | 0 (0.0%) | 0 (0.0%) |
| Wholesale Trade | 0 (0.0%) | 0 (0.0%) |
| Retail Trade | 5 (26.3%) | 14 (73.7%) |
| Transportation & Warehousing | 3 (100.0%) | 0 (0.0%) |
| Utilities | 0 (0.0%) | 0 (0.0%) |
| Information | 0 (0.0%) | 0 (0.0%) |
| Finance & Insurance | 0 (0.0%) | 5 (100.0%) |
| Real Estate, Rental & Leasing | 0 (0.0%) | 0 (0.0%) |
| Professional & Scientific | 0 (0.0%) | 0 (0.0%) |
| Enterprise Management | 0 (0.0%) | 0 (0.0%) |
| Administrative & Support | 0 (0.0%) | 0 (0.0%) |
| Educational Services | 6 (26.1%) | 17 (73.9%) |
| Health Care & Social Assistance | 0 (0.0%) | 13 (100.0%) |
| Arts, Entertainment & Recreation | 0 (0.0%) | 10 (100.0%) |
| Accommodation & Food Services | 0 (0.0%) | 0 (0.0%) |
| Public Administration | 18 (100.0%) | 0 (0.0%) |
| Total | 79 (57.3%) | 59 (42.7%) |
Education in Kit Carson
School Enrollment in Kit Carson
The most common levels of schooling among the 44 students in Kit Carson are high school (21 | 47.7%), elementary school (11 | 25.0%), and nursery / preschool (9 | 20.4%).
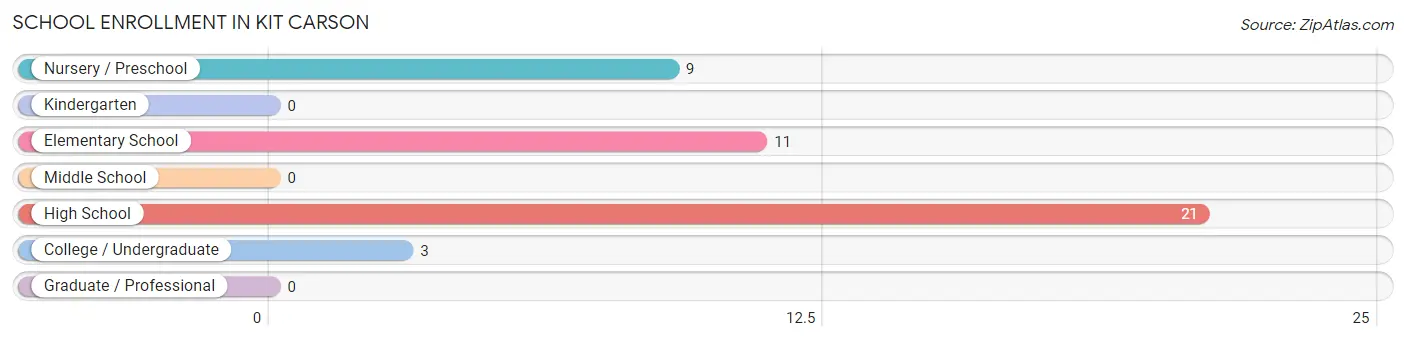
| School Level | # Students | % Students |
| Nursery / Preschool | 9 | 20.4% |
| Kindergarten | 0 | 0.0% |
| Elementary School | 11 | 25.0% |
| Middle School | 0 | 0.0% |
| High School | 21 | 47.7% |
| College / Undergraduate | 3 | 6.8% |
| Graduate / Professional | 0 | 0.0% |
| Total | 44 | 100.0% |
School Enrollment by Age by Funding Source in Kit Carson
Out of a total of 44 students who are enrolled in schools in Kit Carson, 5 (11.4%) attend a private institution, while the remaining 39 (88.6%) are enrolled in public schools. The age group of 18 to 19 year olds has the highest likelihood of being enrolled in private schools, with 2 (100.0% in the age bracket) enrolled. Conversely, the age group of 5 to 9 year old has the lowest likelihood of being enrolled in a private school, with 20 (100.0% in the age bracket) attending a public institution.
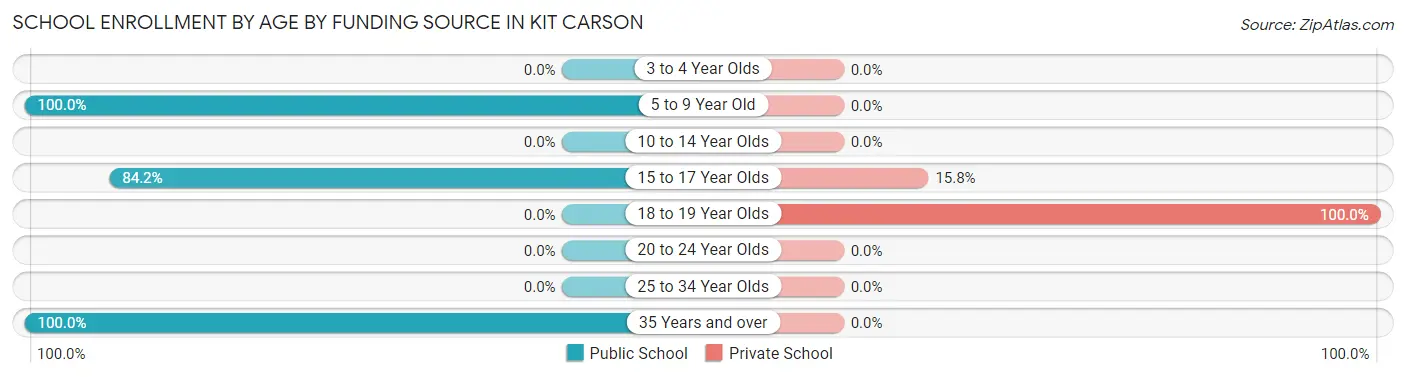
| Age Bracket | Public School | Private School |
| 3 to 4 Year Olds | 0 (0.0%) | 0 (0.0%) |
| 5 to 9 Year Old | 20 (100.0%) | 0 (0.0%) |
| 10 to 14 Year Olds | 0 (0.0%) | 0 (0.0%) |
| 15 to 17 Year Olds | 16 (84.2%) | 3 (15.8%) |
| 18 to 19 Year Olds | 0 (0.0%) | 2 (100.0%) |
| 20 to 24 Year Olds | 0 (0.0%) | 0 (0.0%) |
| 25 to 34 Year Olds | 0 (0.0%) | 0 (0.0%) |
| 35 Years and over | 3 (100.0%) | 0 (0.0%) |
| Total | 39 (88.6%) | 5 (11.4%) |
Educational Attainment by Field of Study in Kit Carson
Bio, nature & agricultural (13 | 25.0%), education (13 | 25.0%), engineering (10 | 19.2%), liberal arts & history (6 | 11.5%), and arts & humanities (5 | 9.6%) are the most common fields of study among 52 individuals in Kit Carson who have obtained a bachelor's degree or higher.
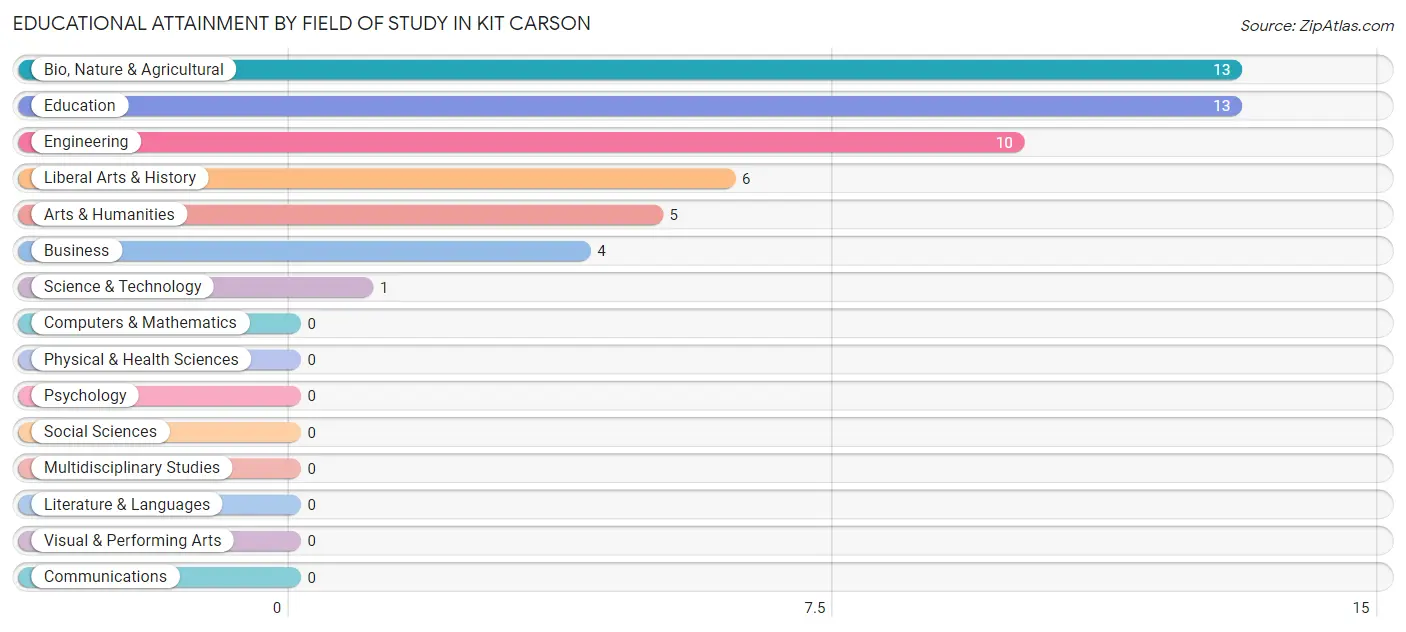
| Field of Study | # Graduates | % Graduates |
| Computers & Mathematics | 0 | 0.0% |
| Bio, Nature & Agricultural | 13 | 25.0% |
| Physical & Health Sciences | 0 | 0.0% |
| Psychology | 0 | 0.0% |
| Social Sciences | 0 | 0.0% |
| Engineering | 10 | 19.2% |
| Multidisciplinary Studies | 0 | 0.0% |
| Science & Technology | 1 | 1.9% |
| Business | 4 | 7.7% |
| Education | 13 | 25.0% |
| Literature & Languages | 0 | 0.0% |
| Liberal Arts & History | 6 | 11.5% |
| Visual & Performing Arts | 0 | 0.0% |
| Communications | 0 | 0.0% |
| Arts & Humanities | 5 | 9.6% |
| Total | 52 | 100.0% |
Transportation & Commute in Kit Carson
Vehicle Availability by Sex in Kit Carson
The most prevalent vehicle ownership categories in Kit Carson are males with 2 vehicles (26, accounting for 34.7%) and females with 2 vehicles (23, making up 45.6%).
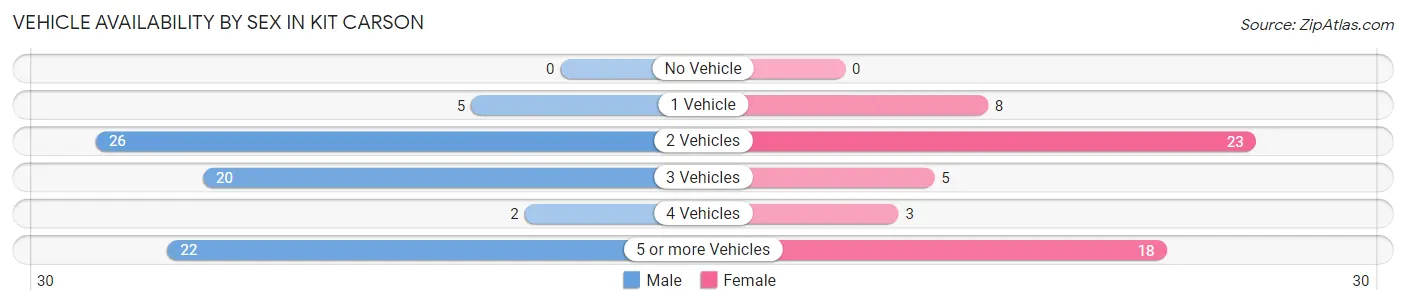
| Vehicles Available | Male | Female |
| No Vehicle | 0 (0.0%) | 0 (0.0%) |
| 1 Vehicle | 5 (6.7%) | 8 (14.0%) |
| 2 Vehicles | 26 (34.7%) | 23 (40.4%) |
| 3 Vehicles | 20 (26.7%) | 5 (8.8%) |
| 4 Vehicles | 2 (2.7%) | 3 (5.3%) |
| 5 or more Vehicles | 22 (29.3%) | 18 (31.6%) |
| Total | 75 (100.0%) | 57 (100.0%) |
Commute Time in Kit Carson
The most frequently occuring commute durations in Kit Carson are 30 to 34 minutes (48 commuters, 36.9%), less than 5 minutes (35 commuters, 26.9%), and 25 to 29 minutes (23 commuters, 17.7%).
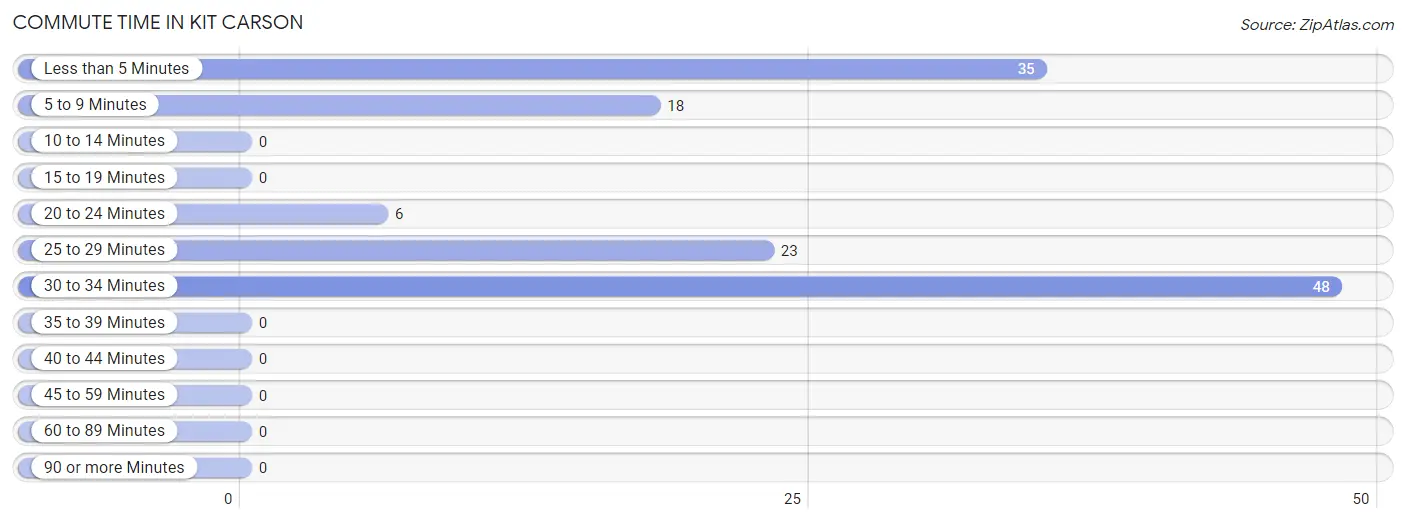
| Commute Time | # Commuters | % Commuters |
| Less than 5 Minutes | 35 | 26.9% |
| 5 to 9 Minutes | 18 | 13.9% |
| 10 to 14 Minutes | 0 | 0.0% |
| 15 to 19 Minutes | 0 | 0.0% |
| 20 to 24 Minutes | 6 | 4.6% |
| 25 to 29 Minutes | 23 | 17.7% |
| 30 to 34 Minutes | 48 | 36.9% |
| 35 to 39 Minutes | 0 | 0.0% |
| 40 to 44 Minutes | 0 | 0.0% |
| 45 to 59 Minutes | 0 | 0.0% |
| 60 to 89 Minutes | 0 | 0.0% |
| 90 or more Minutes | 0 | 0.0% |
Commute Time by Sex in Kit Carson
The most common commute times in Kit Carson are 30 to 34 minutes (28 commuters, 38.4%) for males and 30 to 34 minutes (20 commuters, 35.1%) for females.
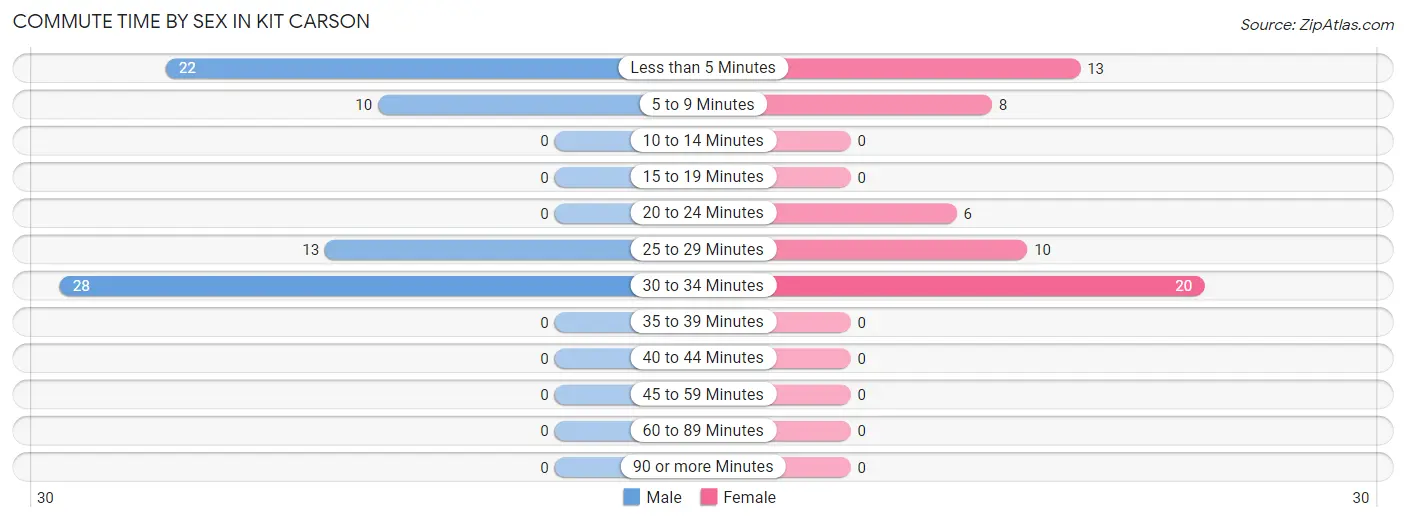
| Commute Time | Male | Female |
| Less than 5 Minutes | 22 (30.1%) | 13 (22.8%) |
| 5 to 9 Minutes | 10 (13.7%) | 8 (14.0%) |
| 10 to 14 Minutes | 0 (0.0%) | 0 (0.0%) |
| 15 to 19 Minutes | 0 (0.0%) | 0 (0.0%) |
| 20 to 24 Minutes | 0 (0.0%) | 6 (10.5%) |
| 25 to 29 Minutes | 13 (17.8%) | 10 (17.5%) |
| 30 to 34 Minutes | 28 (38.4%) | 20 (35.1%) |
| 35 to 39 Minutes | 0 (0.0%) | 0 (0.0%) |
| 40 to 44 Minutes | 0 (0.0%) | 0 (0.0%) |
| 45 to 59 Minutes | 0 (0.0%) | 0 (0.0%) |
| 60 to 89 Minutes | 0 (0.0%) | 0 (0.0%) |
| 90 or more Minutes | 0 (0.0%) | 0 (0.0%) |
Time of Departure to Work by Sex in Kit Carson
The most frequent times of departure to work in Kit Carson are 12:00 AM to 4:59 AM (18, 24.7%) for males and 6:30 AM to 6:59 AM (17, 29.8%) for females.
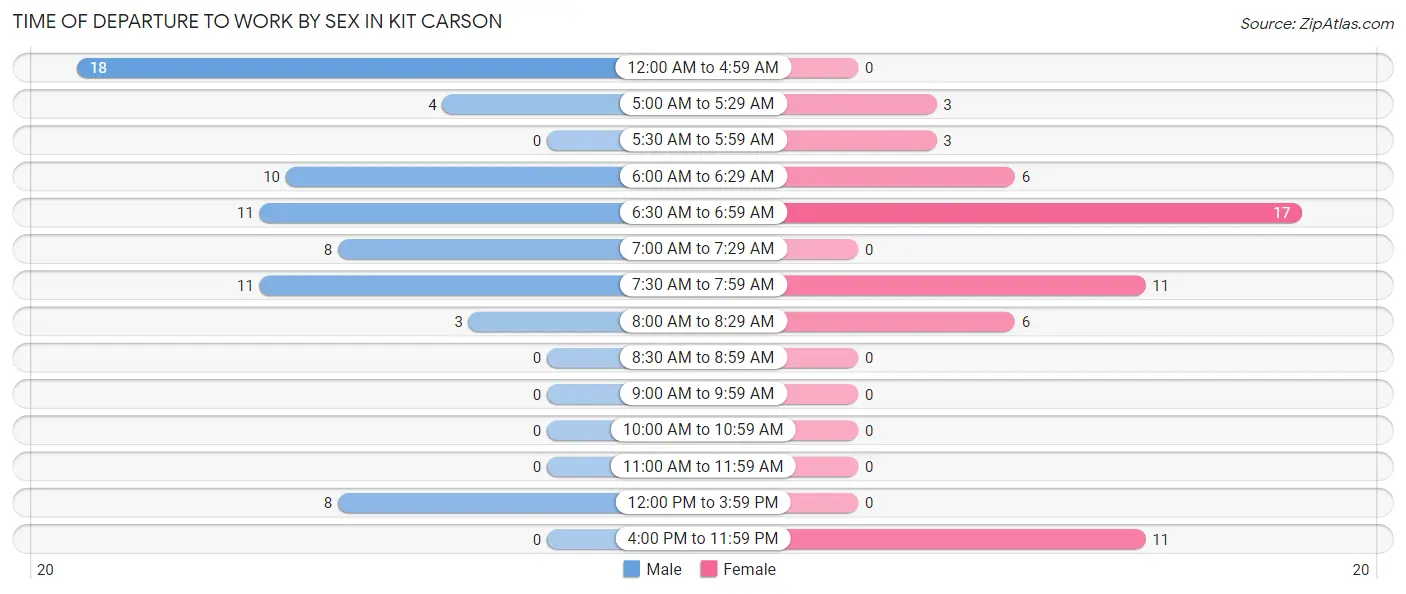
| Time of Departure | Male | Female |
| 12:00 AM to 4:59 AM | 18 (24.7%) | 0 (0.0%) |
| 5:00 AM to 5:29 AM | 4 (5.5%) | 3 (5.3%) |
| 5:30 AM to 5:59 AM | 0 (0.0%) | 3 (5.3%) |
| 6:00 AM to 6:29 AM | 10 (13.7%) | 6 (10.5%) |
| 6:30 AM to 6:59 AM | 11 (15.1%) | 17 (29.8%) |
| 7:00 AM to 7:29 AM | 8 (11.0%) | 0 (0.0%) |
| 7:30 AM to 7:59 AM | 11 (15.1%) | 11 (19.3%) |
| 8:00 AM to 8:29 AM | 3 (4.1%) | 6 (10.5%) |
| 8:30 AM to 8:59 AM | 0 (0.0%) | 0 (0.0%) |
| 9:00 AM to 9:59 AM | 0 (0.0%) | 0 (0.0%) |
| 10:00 AM to 10:59 AM | 0 (0.0%) | 0 (0.0%) |
| 11:00 AM to 11:59 AM | 0 (0.0%) | 0 (0.0%) |
| 12:00 PM to 3:59 PM | 8 (11.0%) | 0 (0.0%) |
| 4:00 PM to 11:59 PM | 0 (0.0%) | 11 (19.3%) |
| Total | 73 (100.0%) | 57 (100.0%) |
Housing Occupancy in Kit Carson
Occupancy by Ownership in Kit Carson
Of the total 103 dwellings in Kit Carson, owner-occupied units account for 73 (70.9%), while renter-occupied units make up 30 (29.1%).
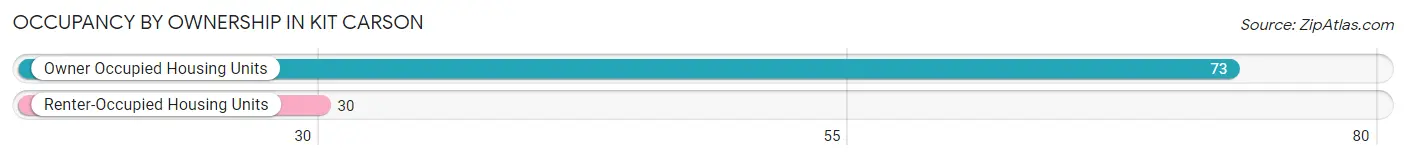
| Occupancy | # Housing Units | % Housing Units |
| Owner Occupied Housing Units | 73 | 70.9% |
| Renter-Occupied Housing Units | 30 | 29.1% |
| Total Occupied Housing Units | 103 | 100.0% |
Occupancy by Household Size in Kit Carson
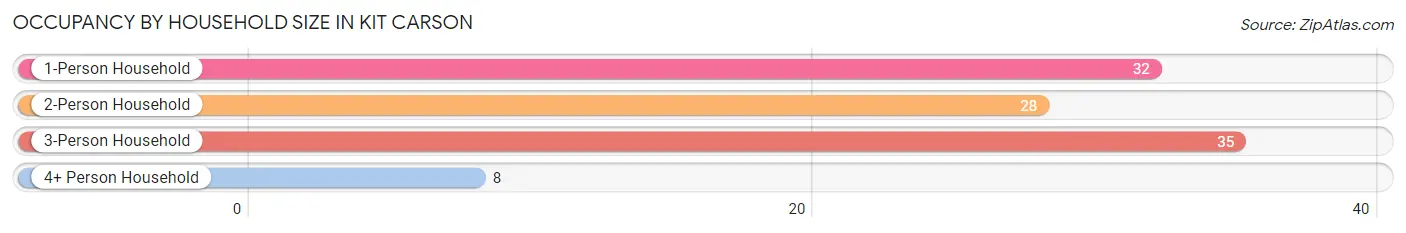
| Household Size | # Housing Units | % Housing Units |
| 1-Person Household | 32 | 31.1% |
| 2-Person Household | 28 | 27.2% |
| 3-Person Household | 35 | 34.0% |
| 4+ Person Household | 8 | 7.8% |
| Total Housing Units | 103 | 100.0% |
Occupancy by Ownership by Household Size in Kit Carson
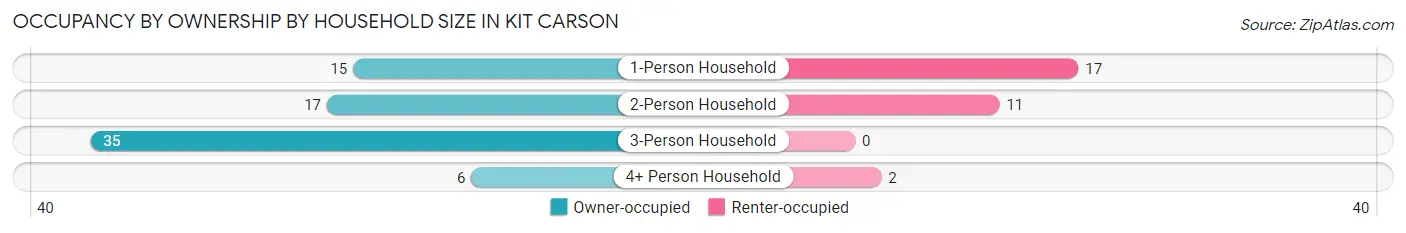
| Household Size | Owner-occupied | Renter-occupied |
| 1-Person Household | 15 (46.9%) | 17 (53.1%) |
| 2-Person Household | 17 (60.7%) | 11 (39.3%) |
| 3-Person Household | 35 (100.0%) | 0 (0.0%) |
| 4+ Person Household | 6 (75.0%) | 2 (25.0%) |
| Total Housing Units | 73 (70.9%) | 30 (29.1%) |
Occupancy by Educational Attainment in Kit Carson
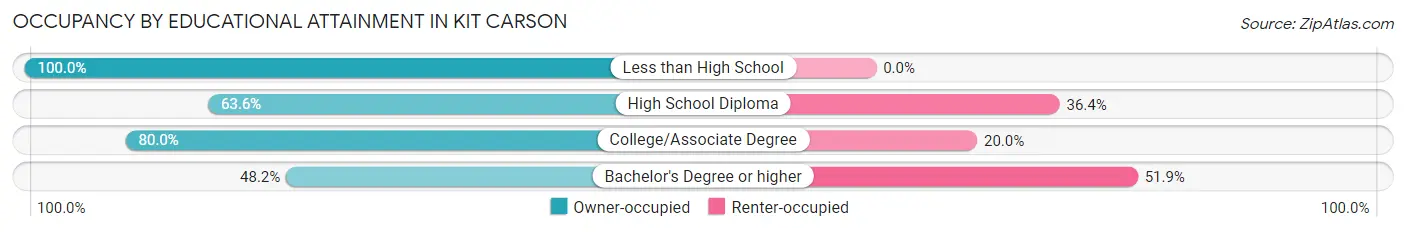
| Household Size | Owner-occupied | Renter-occupied |
| Less than High School | 5 (100.0%) | 0 (0.0%) |
| High School Diploma | 7 (63.6%) | 4 (36.4%) |
| College/Associate Degree | 48 (80.0%) | 12 (20.0%) |
| Bachelor's Degree or higher | 13 (48.1%) | 14 (51.8%) |
Occupancy by Age of Householder in Kit Carson
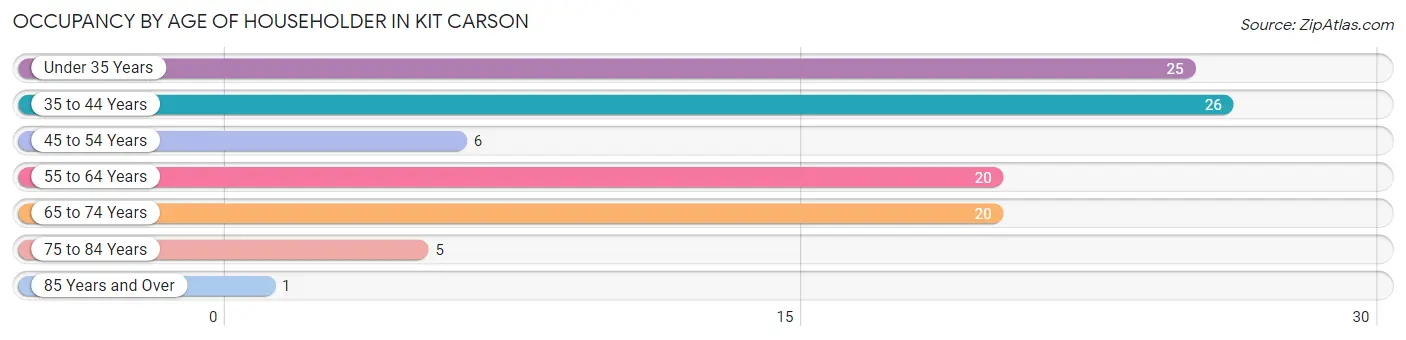
| Age Bracket | # Households | % Households |
| Under 35 Years | 25 | 24.3% |
| 35 to 44 Years | 26 | 25.2% |
| 45 to 54 Years | 6 | 5.8% |
| 55 to 64 Years | 20 | 19.4% |
| 65 to 74 Years | 20 | 19.4% |
| 75 to 84 Years | 5 | 4.9% |
| 85 Years and Over | 1 | 1.0% |
| Total | 103 | 100.0% |
Housing Finances in Kit Carson
Median Income by Occupancy in Kit Carson
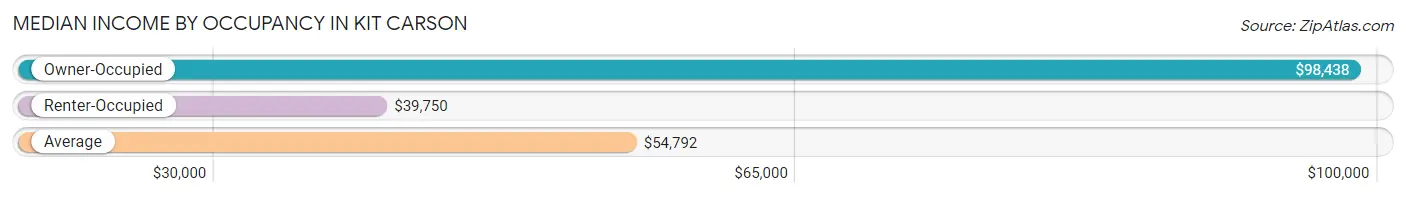
| Occupancy Type | # Households | Median Income |
| Owner-Occupied | 73 (70.9%) | $98,438 |
| Renter-Occupied | 30 (29.1%) | $39,750 |
| Average | 103 (100.0%) | $54,792 |
Occupancy by Householder Income Bracket in Kit Carson
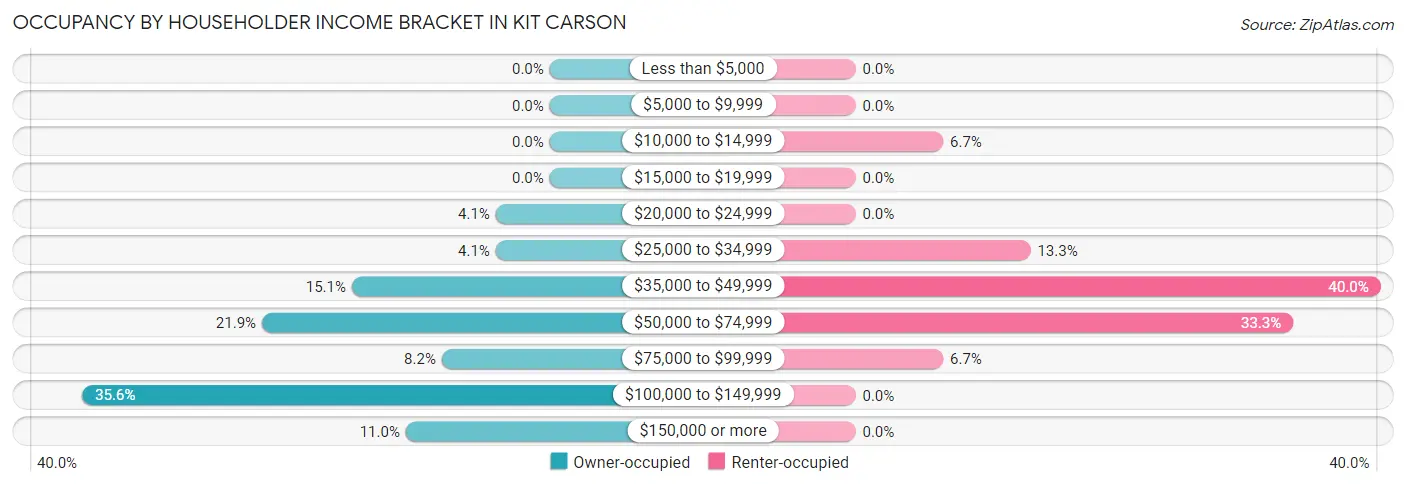
| Income Bracket | Owner-occupied | Renter-occupied |
| Less than $5,000 | 0 (0.0%) | 0 (0.0%) |
| $5,000 to $9,999 | 0 (0.0%) | 0 (0.0%) |
| $10,000 to $14,999 | 0 (0.0%) | 2 (6.7%) |
| $15,000 to $19,999 | 0 (0.0%) | 0 (0.0%) |
| $20,000 to $24,999 | 3 (4.1%) | 0 (0.0%) |
| $25,000 to $34,999 | 3 (4.1%) | 4 (13.3%) |
| $35,000 to $49,999 | 11 (15.1%) | 12 (40.0%) |
| $50,000 to $74,999 | 16 (21.9%) | 10 (33.3%) |
| $75,000 to $99,999 | 6 (8.2%) | 2 (6.7%) |
| $100,000 to $149,999 | 26 (35.6%) | 0 (0.0%) |
| $150,000 or more | 8 (11.0%) | 0 (0.0%) |
| Total | 73 (100.0%) | 30 (100.0%) |
Monthly Housing Cost Tiers in Kit Carson
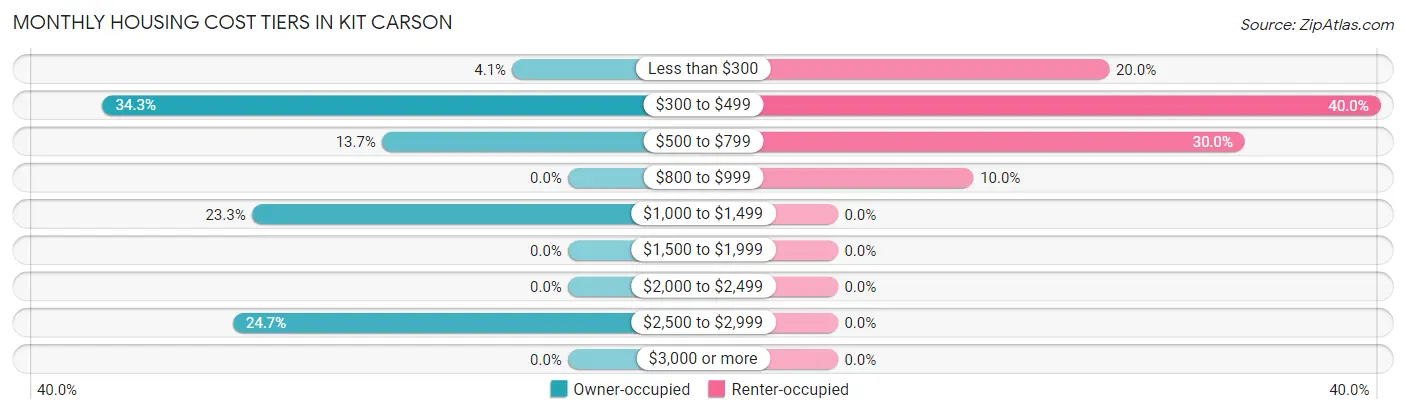
| Monthly Cost | Owner-occupied | Renter-occupied |
| Less than $300 | 3 (4.1%) | 6 (20.0%) |
| $300 to $499 | 25 (34.3%) | 12 (40.0%) |
| $500 to $799 | 10 (13.7%) | 9 (30.0%) |
| $800 to $999 | 0 (0.0%) | 3 (10.0%) |
| $1,000 to $1,499 | 17 (23.3%) | 0 (0.0%) |
| $1,500 to $1,999 | 0 (0.0%) | 0 (0.0%) |
| $2,000 to $2,499 | 0 (0.0%) | 0 (0.0%) |
| $2,500 to $2,999 | 18 (24.7%) | 0 (0.0%) |
| $3,000 or more | 0 (0.0%) | 0 (0.0%) |
| Total | 73 (100.0%) | 30 (100.0%) |
Physical Housing Characteristics in Kit Carson
Housing Structures in Kit Carson
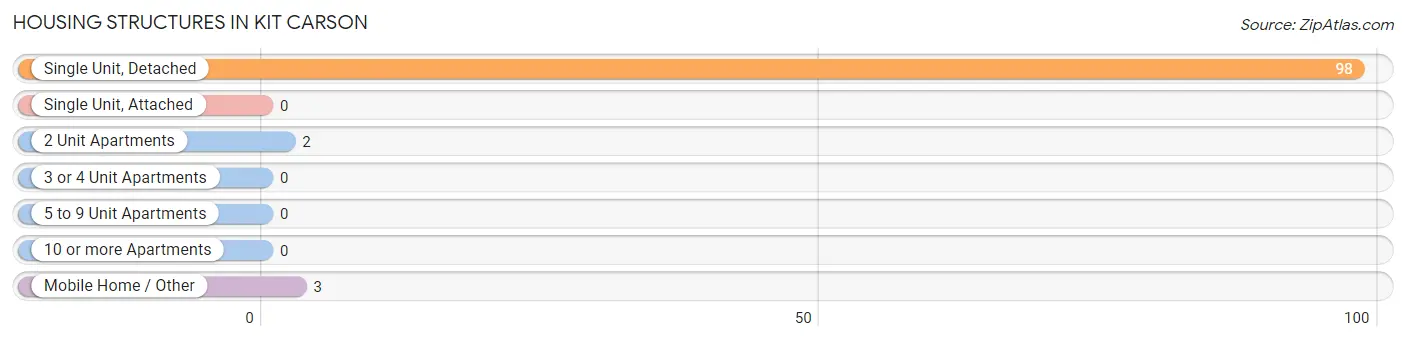
| Structure Type | # Housing Units | % Housing Units |
| Single Unit, Detached | 98 | 95.2% |
| Single Unit, Attached | 0 | 0.0% |
| 2 Unit Apartments | 2 | 1.9% |
| 3 or 4 Unit Apartments | 0 | 0.0% |
| 5 to 9 Unit Apartments | 0 | 0.0% |
| 10 or more Apartments | 0 | 0.0% |
| Mobile Home / Other | 3 | 2.9% |
| Total | 103 | 100.0% |
Housing Structures by Occupancy in Kit Carson
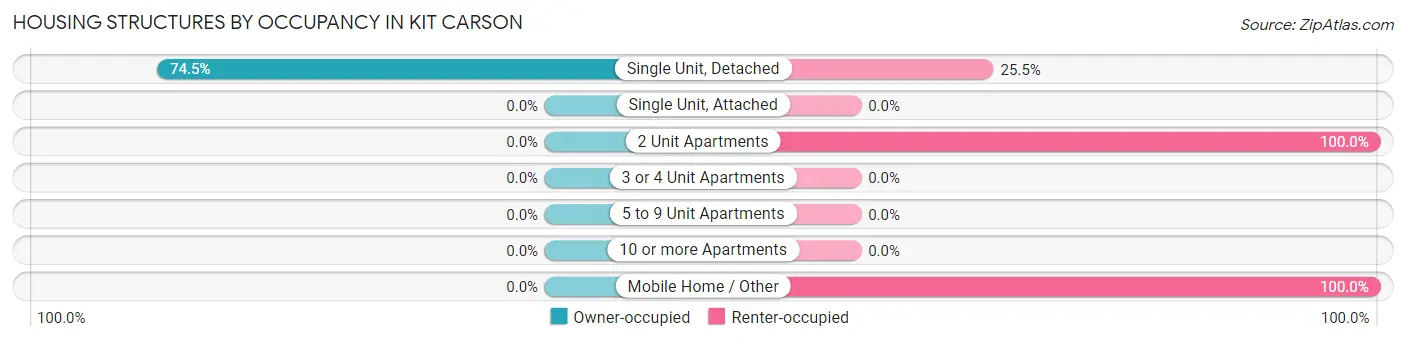
| Structure Type | Owner-occupied | Renter-occupied |
| Single Unit, Detached | 73 (74.5%) | 25 (25.5%) |
| Single Unit, Attached | 0 (0.0%) | 0 (0.0%) |
| 2 Unit Apartments | 0 (0.0%) | 2 (100.0%) |
| 3 or 4 Unit Apartments | 0 (0.0%) | 0 (0.0%) |
| 5 to 9 Unit Apartments | 0 (0.0%) | 0 (0.0%) |
| 10 or more Apartments | 0 (0.0%) | 0 (0.0%) |
| Mobile Home / Other | 0 (0.0%) | 3 (100.0%) |
| Total | 73 (70.9%) | 30 (29.1%) |
Housing Structures by Number of Rooms in Kit Carson
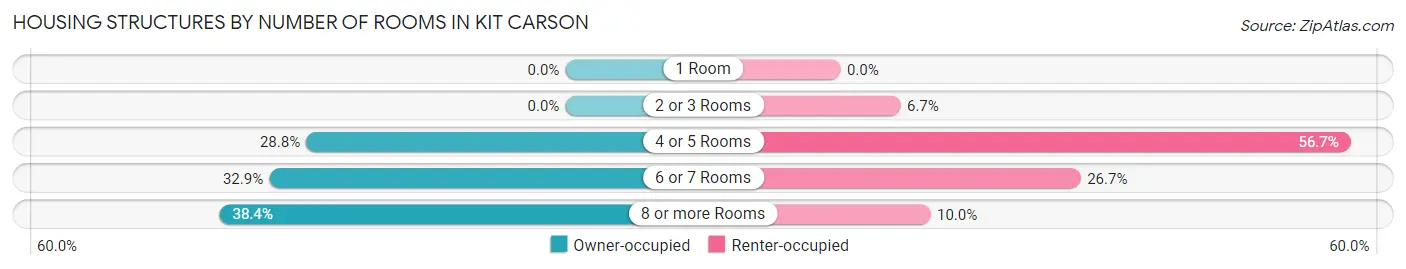
| Number of Rooms | Owner-occupied | Renter-occupied |
| 1 Room | 0 (0.0%) | 0 (0.0%) |
| 2 or 3 Rooms | 0 (0.0%) | 2 (6.7%) |
| 4 or 5 Rooms | 21 (28.8%) | 17 (56.7%) |
| 6 or 7 Rooms | 24 (32.9%) | 8 (26.7%) |
| 8 or more Rooms | 28 (38.4%) | 3 (10.0%) |
| Total | 73 (100.0%) | 30 (100.0%) |
Housing Structure by Heating Type in Kit Carson
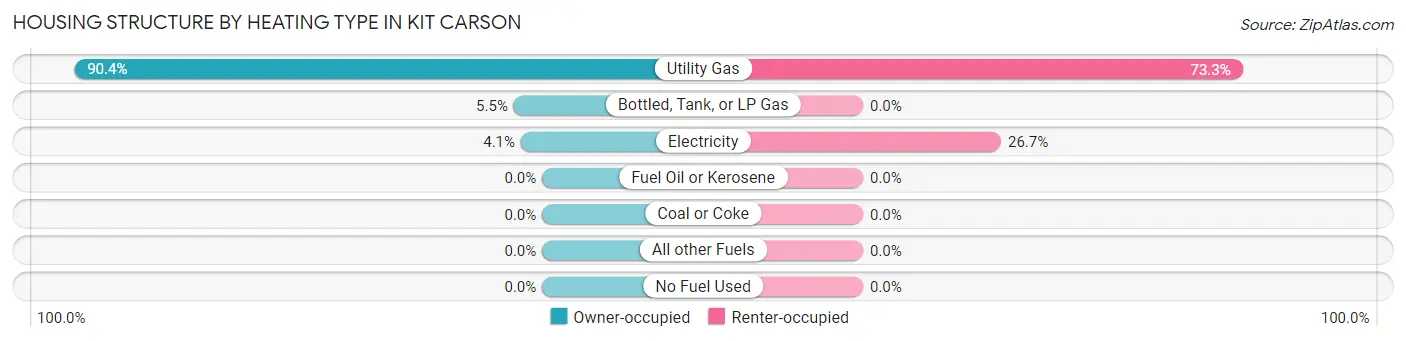
| Heating Type | Owner-occupied | Renter-occupied |
| Utility Gas | 66 (90.4%) | 22 (73.3%) |
| Bottled, Tank, or LP Gas | 4 (5.5%) | 0 (0.0%) |
| Electricity | 3 (4.1%) | 8 (26.7%) |
| Fuel Oil or Kerosene | 0 (0.0%) | 0 (0.0%) |
| Coal or Coke | 0 (0.0%) | 0 (0.0%) |
| All other Fuels | 0 (0.0%) | 0 (0.0%) |
| No Fuel Used | 0 (0.0%) | 0 (0.0%) |
| Total | 73 (100.0%) | 30 (100.0%) |
Household Vehicle Usage in Kit Carson
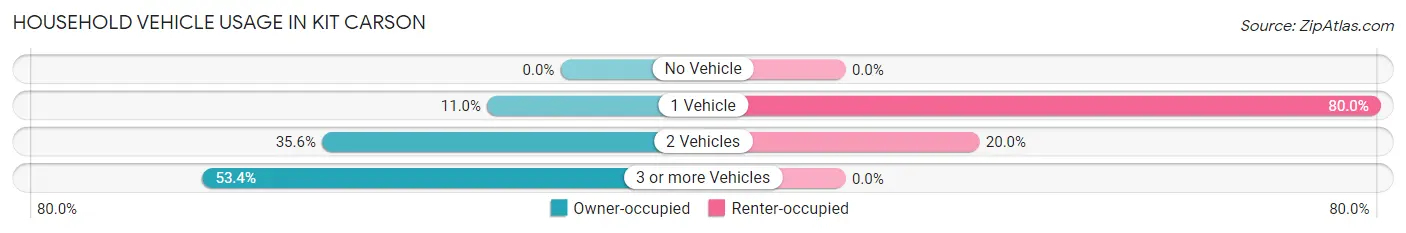
| Vehicles per Household | Owner-occupied | Renter-occupied |
| No Vehicle | 0 (0.0%) | 0 (0.0%) |
| 1 Vehicle | 8 (11.0%) | 24 (80.0%) |
| 2 Vehicles | 26 (35.6%) | 6 (20.0%) |
| 3 or more Vehicles | 39 (53.4%) | 0 (0.0%) |
| Total | 73 (100.0%) | 30 (100.0%) |
Real Estate & Mortgages in Kit Carson
Real Estate and Mortgage Overview in Kit Carson
| Characteristic | Without Mortgage | With Mortgage |
| Housing Units | 28 | 45 |
| Median Property Value | $141,700 | $0 |
| Median Household Income | - | - |
| Monthly Housing Costs | $400 | $0 |
| Real Estate Taxes | $440 | $0 |
Property Value by Mortgage Status in Kit Carson
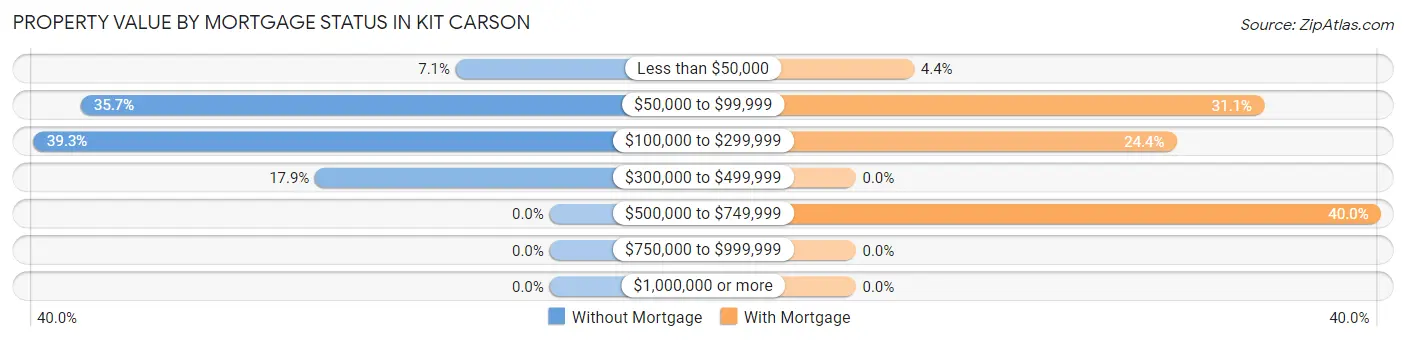
| Property Value | Without Mortgage | With Mortgage |
| Less than $50,000 | 2 (7.1%) | 2 (4.4%) |
| $50,000 to $99,999 | 10 (35.7%) | 14 (31.1%) |
| $100,000 to $299,999 | 11 (39.3%) | 11 (24.4%) |
| $300,000 to $499,999 | 5 (17.9%) | 0 (0.0%) |
| $500,000 to $749,999 | 0 (0.0%) | 18 (40.0%) |
| $750,000 to $999,999 | 0 (0.0%) | 0 (0.0%) |
| $1,000,000 or more | 0 (0.0%) | 0 (0.0%) |
| Total | 28 (100.0%) | 45 (100.0%) |
Household Income by Mortgage Status in Kit Carson
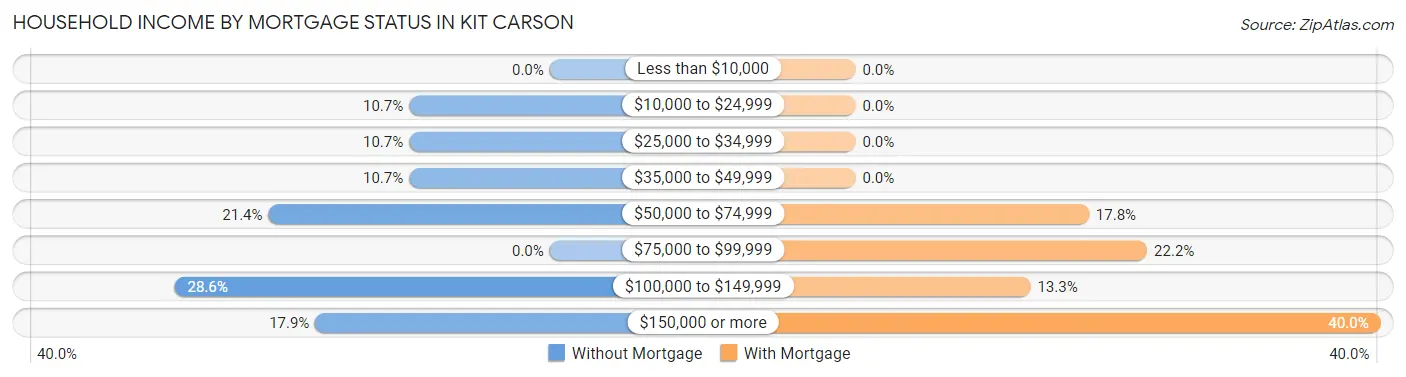
| Household Income | Without Mortgage | With Mortgage |
| Less than $10,000 | 0 (0.0%) | 0 (0.0%) |
| $10,000 to $24,999 | 3 (10.7%) | 0 (0.0%) |
| $25,000 to $34,999 | 3 (10.7%) | 0 (0.0%) |
| $35,000 to $49,999 | 3 (10.7%) | 0 (0.0%) |
| $50,000 to $74,999 | 6 (21.4%) | 8 (17.8%) |
| $75,000 to $99,999 | 0 (0.0%) | 10 (22.2%) |
| $100,000 to $149,999 | 8 (28.6%) | 6 (13.3%) |
| $150,000 or more | 5 (17.9%) | 18 (40.0%) |
| Total | 28 (100.0%) | 45 (100.0%) |
Property Value to Household Income Ratio in Kit Carson
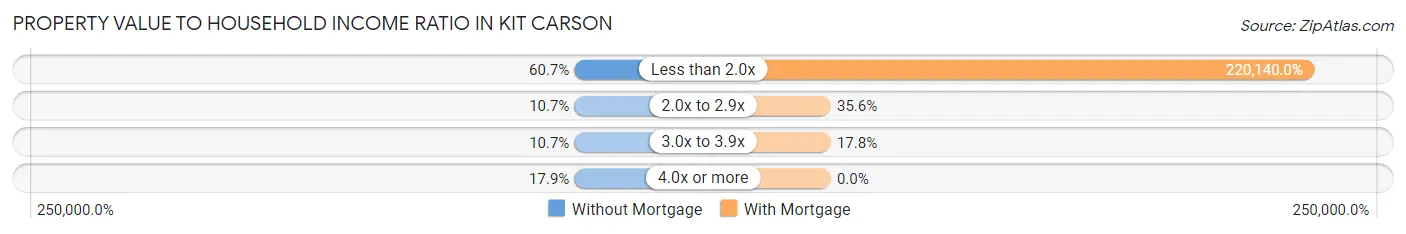
| Value-to-Income Ratio | Without Mortgage | With Mortgage |
| Less than 2.0x | 17 (60.7%) | 99,063 (220,140.0%) |
| 2.0x to 2.9x | 3 (10.7%) | 16 (35.6%) |
| 3.0x to 3.9x | 3 (10.7%) | 8 (17.8%) |
| 4.0x or more | 5 (17.9%) | 0 (0.0%) |
| Total | 28 (100.0%) | 45 (100.0%) |
Real Estate Taxes by Mortgage Status in Kit Carson
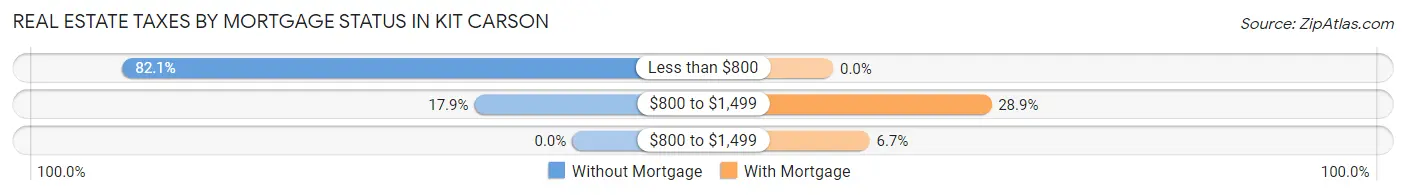
| Property Taxes | Without Mortgage | With Mortgage |
| Less than $800 | 23 (82.1%) | 0 (0.0%) |
| $800 to $1,499 | 5 (17.9%) | 13 (28.9%) |
| $800 to $1,499 | 0 (0.0%) | 3 (6.7%) |
| Total | 28 (100.0%) | 45 (100.0%) |
Health & Disability in Kit Carson
Health Insurance Coverage by Age in Kit Carson
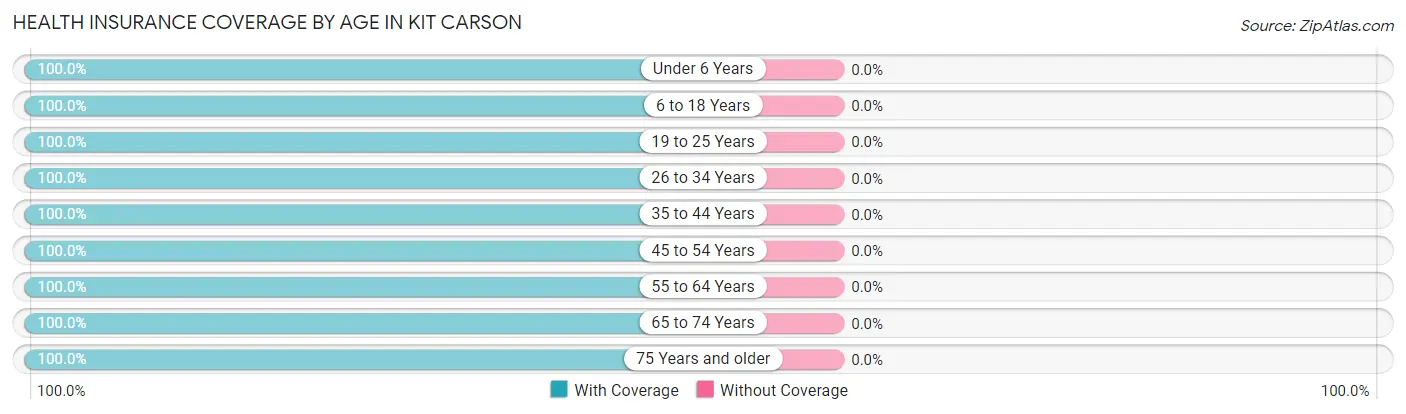
| Age Bracket | With Coverage | Without Coverage |
| Under 6 Years | 17 (100.0%) | 0 (0.0%) |
| 6 to 18 Years | 26 (100.0%) | 0 (0.0%) |
| 19 to 25 Years | 21 (100.0%) | 0 (0.0%) |
| 26 to 34 Years | 26 (100.0%) | 0 (0.0%) |
| 35 to 44 Years | 43 (100.0%) | 0 (0.0%) |
| 45 to 54 Years | 19 (100.0%) | 0 (0.0%) |
| 55 to 64 Years | 29 (100.0%) | 0 (0.0%) |
| 65 to 74 Years | 25 (100.0%) | 0 (0.0%) |
| 75 Years and older | 12 (100.0%) | 0 (0.0%) |
| Total | 218 (100.0%) | 0 (0.0%) |
Health Insurance Coverage by Citizenship Status in Kit Carson
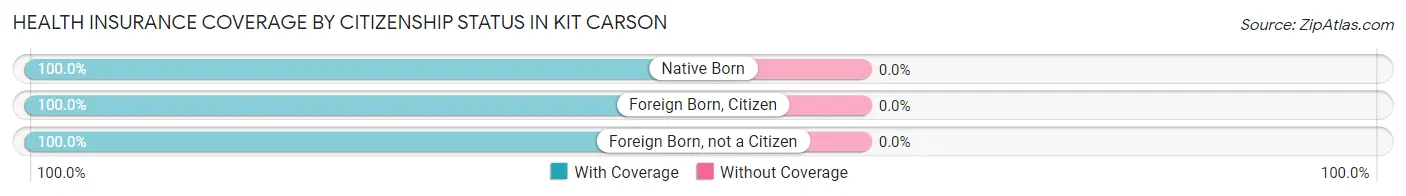
| Citizenship Status | With Coverage | Without Coverage |
| Native Born | 17 (100.0%) | 0 (0.0%) |
| Foreign Born, Citizen | 26 (100.0%) | 0 (0.0%) |
| Foreign Born, not a Citizen | 21 (100.0%) | 0 (0.0%) |
Health Insurance Coverage by Household Income in Kit Carson
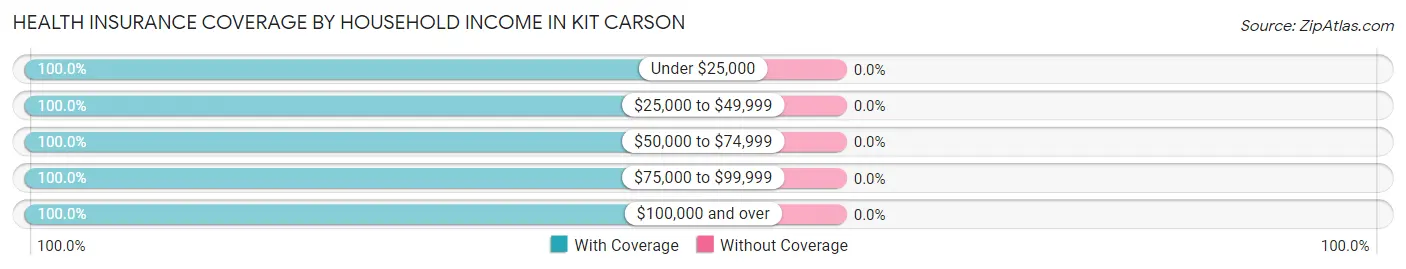
| Household Income | With Coverage | Without Coverage |
| Under $25,000 | 5 (100.0%) | 0 (0.0%) |
| $25,000 to $49,999 | 70 (100.0%) | 0 (0.0%) |
| $50,000 to $74,999 | 47 (100.0%) | 0 (0.0%) |
| $75,000 to $99,999 | 24 (100.0%) | 0 (0.0%) |
| $100,000 and over | 72 (100.0%) | 0 (0.0%) |
Public vs Private Health Insurance Coverage by Age in Kit Carson
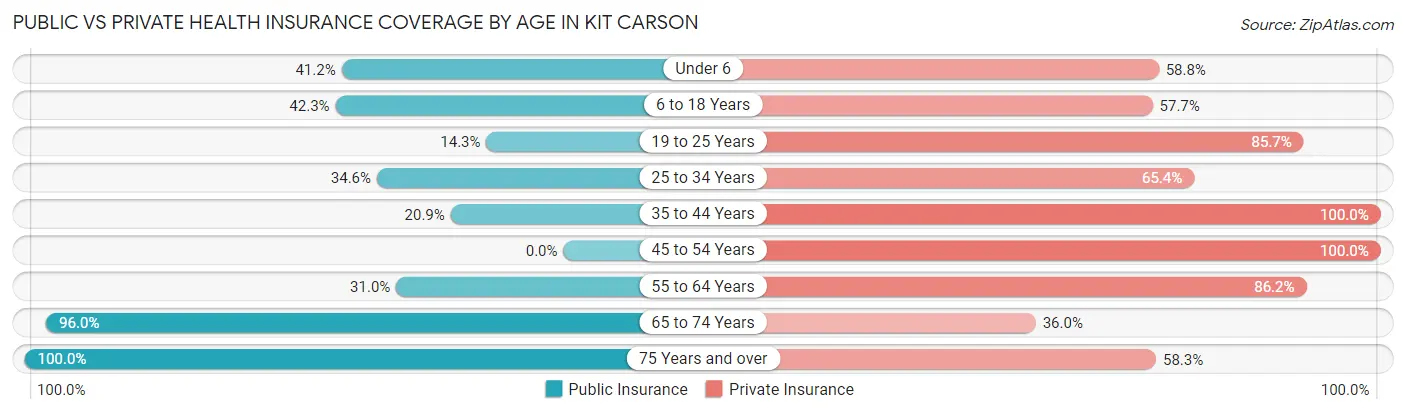
| Age Bracket | Public Insurance | Private Insurance |
| Under 6 | 7 (41.2%) | 10 (58.8%) |
| 6 to 18 Years | 11 (42.3%) | 15 (57.7%) |
| 19 to 25 Years | 3 (14.3%) | 18 (85.7%) |
| 25 to 34 Years | 9 (34.6%) | 17 (65.4%) |
| 35 to 44 Years | 9 (20.9%) | 43 (100.0%) |
| 45 to 54 Years | 0 (0.0%) | 19 (100.0%) |
| 55 to 64 Years | 9 (31.0%) | 25 (86.2%) |
| 65 to 74 Years | 24 (96.0%) | 9 (36.0%) |
| 75 Years and over | 12 (100.0%) | 7 (58.3%) |
| Total | 84 (38.5%) | 163 (74.8%) |
Disability Status by Sex by Age in Kit Carson
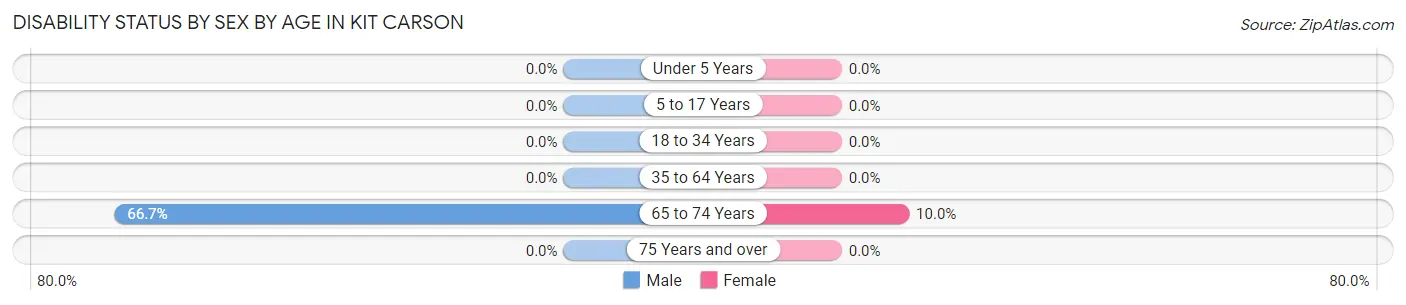
| Age Bracket | Male | Female |
| Under 5 Years | 0 (0.0%) | 0 (0.0%) |
| 5 to 17 Years | 0 (0.0%) | 0 (0.0%) |
| 18 to 34 Years | 0 (0.0%) | 0 (0.0%) |
| 35 to 64 Years | 0 (0.0%) | 0 (0.0%) |
| 65 to 74 Years | 10 (66.7%) | 1 (10.0%) |
| 75 Years and over | 0 (0.0%) | 0 (0.0%) |
Disability Class by Sex by Age in Kit Carson
Disability Class: Hearing Difficulty
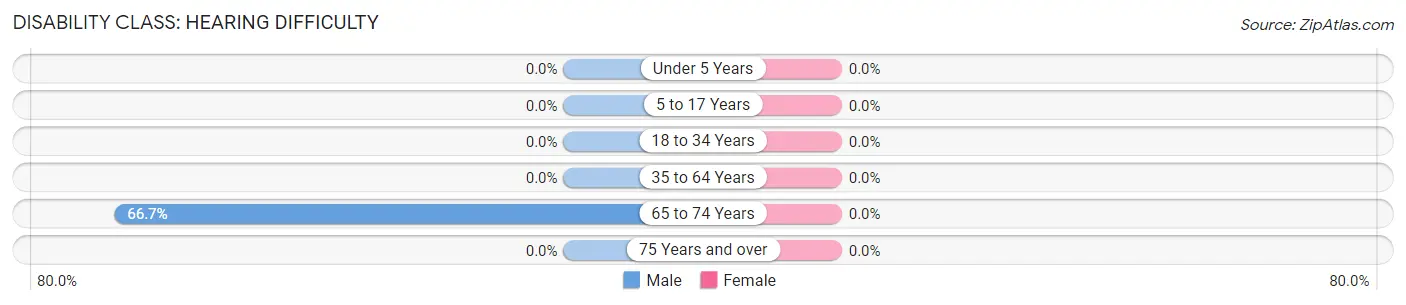
| Age Bracket | Male | Female |
| Under 5 Years | 0 (0.0%) | 0 (0.0%) |
| 5 to 17 Years | 0 (0.0%) | 0 (0.0%) |
| 18 to 34 Years | 0 (0.0%) | 0 (0.0%) |
| 35 to 64 Years | 0 (0.0%) | 0 (0.0%) |
| 65 to 74 Years | 10 (66.7%) | 0 (0.0%) |
| 75 Years and over | 0 (0.0%) | 0 (0.0%) |
Disability Class: Vision Difficulty
| Age Bracket | Male | Female |
| Under 5 Years | 0 (0.0%) | 0 (0.0%) |
| 5 to 17 Years | 0 (0.0%) | 0 (0.0%) |
| 18 to 34 Years | 0 (0.0%) | 0 (0.0%) |
| 35 to 64 Years | 0 (0.0%) | 0 (0.0%) |
| 65 to 74 Years | 0 (0.0%) | 0 (0.0%) |
| 75 Years and over | 0 (0.0%) | 0 (0.0%) |
Disability Class: Cognitive Difficulty
| Age Bracket | Male | Female |
| 5 to 17 Years | 0 (0.0%) | 0 (0.0%) |
| 18 to 34 Years | 0 (0.0%) | 0 (0.0%) |
| 35 to 64 Years | 0 (0.0%) | 0 (0.0%) |
| 65 to 74 Years | 0 (0.0%) | 0 (0.0%) |
| 75 Years and over | 0 (0.0%) | 0 (0.0%) |
Disability Class: Ambulatory Difficulty
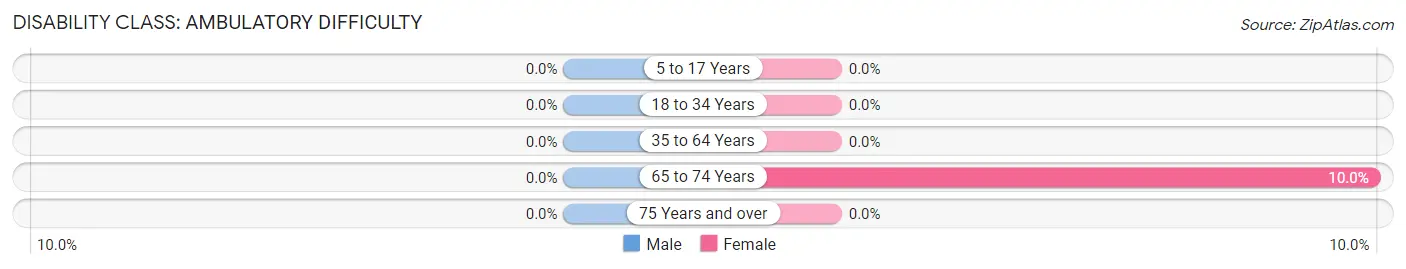
| Age Bracket | Male | Female |
| 5 to 17 Years | 0 (0.0%) | 0 (0.0%) |
| 18 to 34 Years | 0 (0.0%) | 0 (0.0%) |
| 35 to 64 Years | 0 (0.0%) | 0 (0.0%) |
| 65 to 74 Years | 0 (0.0%) | 1 (10.0%) |
| 75 Years and over | 0 (0.0%) | 0 (0.0%) |
Disability Class: Self-Care Difficulty
| Age Bracket | Male | Female |
| 5 to 17 Years | 0 (0.0%) | 0 (0.0%) |
| 18 to 34 Years | 0 (0.0%) | 0 (0.0%) |
| 35 to 64 Years | 0 (0.0%) | 0 (0.0%) |
| 65 to 74 Years | 0 (0.0%) | 0 (0.0%) |
| 75 Years and over | 0 (0.0%) | 0 (0.0%) |
Technology Access in Kit Carson
Computing Device Access in Kit Carson
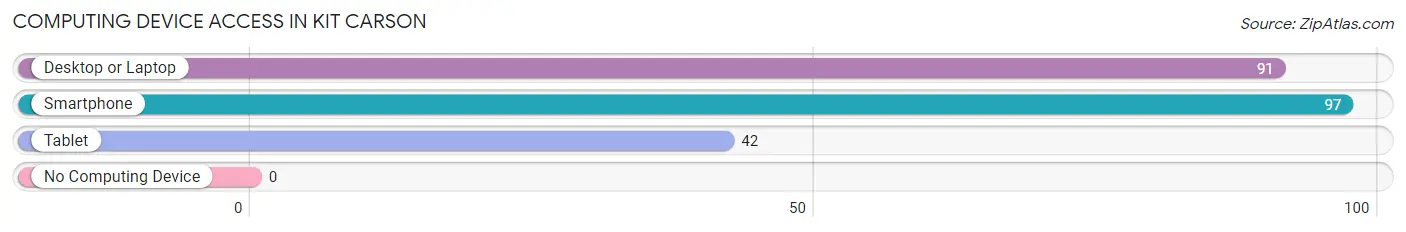
| Device Type | # Households | % Households |
| Desktop or Laptop | 91 | 88.3% |
| Smartphone | 97 | 94.2% |
| Tablet | 42 | 40.8% |
| No Computing Device | 0 | 0.0% |
| Total | 103 | 100.0% |
Internet Access in Kit Carson
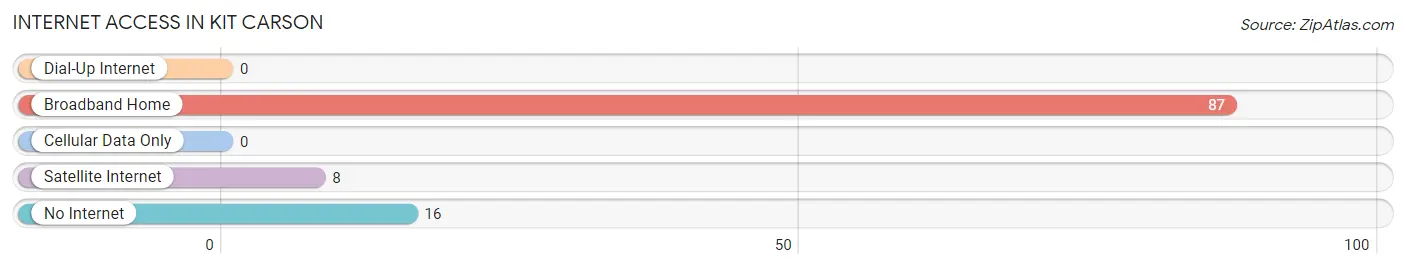
| Internet Type | # Households | % Households |
| Dial-Up Internet | 0 | 0.0% |
| Broadband Home | 87 | 84.5% |
| Cellular Data Only | 0 | 0.0% |
| Satellite Internet | 8 | 7.8% |
| No Internet | 16 | 15.5% |
| Total | 103 | 100.0% |
Kit Carson Summary
Carson, Colorado is a small town located in the foothills of the Rocky Mountains in the state of Colorado. It is located in the northern part of the state, about 25 miles south of the Wyoming border. The town was founded in 1864 and named after the famous frontiersman, Kit Carson. The town has a population of about 1,000 people and is known for its small-town charm and outdoor recreation opportunities.
Geography
Carson is located in the foothills of the Rocky Mountains in northern Colorado. It is situated at an elevation of 6,845 feet above sea level. The town is surrounded by mountains and is located in a valley. The nearest major city is Denver, which is about 90 miles away. The town is located in the South Platte River Valley and is close to the Cache La Poudre River.
Climate
Carson has a semi-arid climate with hot summers and cold winters. The average high temperature in the summer is around 85 degrees Fahrenheit and the average low temperature in the winter is around 10 degrees Fahrenheit. The town receives an average of 16 inches of precipitation per year.
Demographics
As of the 2010 census, the population of Carson was 1,000 people. The racial makeup of the town was 97.2% White, 0.2% African American, 0.2% Native American, 0.2% Asian, 0.2% from other races, and 1.2% from two or more races. Hispanic or Latino of any race were 1.2% of the population.
Economy
Carson is a small town with a limited economy. The town is home to a few small businesses, including a grocery store, a hardware store, and a few restaurants. The town is also home to a few small farms and ranches. The town is also a popular destination for outdoor recreation, such as camping, fishing, and hiking.
History
Carson was founded in 1864 and named after the famous frontiersman, Kit Carson. The town was originally a mining town and was home to several gold and silver mines. The town was also home to a few small businesses, such as a general store and a saloon. The town was also home to a few small farms and ranches.
In the late 1800s, the town began to decline as the mining industry declined. The town was nearly abandoned by the early 1900s. In the 1950s, the town began to experience a resurgence as people began to move to the area for its outdoor recreation opportunities. The town has since become a popular destination for outdoor recreation and is home to a few small businesses.
Common Questions
What is Per Capita Income in Kit Carson?
Per Capita income in Kit Carson is $39,930.
What is the Median Family Income in Kit Carson?
Median Family Income in Kit Carson is $85,625.
What is the Median Household income in Kit Carson?
Median Household Income in Kit Carson is $54,792.
What is Inequality or Gini Index in Kit Carson?
Inequality or Gini Index in Kit Carson is 0.36.
What is the Total Population of Kit Carson?
Total Population of Kit Carson is 228.
What is the Total Male Population of Kit Carson?
Total Male Population of Kit Carson is 125.
What is the Total Female Population of Kit Carson?
Total Female Population of Kit Carson is 103.
What is the Ratio of Males per 100 Females in Kit Carson?
There are 121.36 Males per 100 Females in Kit Carson.
What is the Ratio of Females per 100 Males in Kit Carson?
There are 82.40 Females per 100 Males in Kit Carson.
What is the Median Population Age in Kit Carson?
Median Population Age in Kit Carson is 42.0 Years.
What is the Average Family Size in Kit Carson
Average Family Size in Kit Carson is 2.5 People.
What is the Average Household Size in Kit Carson
Average Household Size in Kit Carson is 2.1 People.
How Large is the Labor Force in Kit Carson?
There are 142 People in the Labor Forcein in Kit Carson.
What is the Percentage of People in the Labor Force in Kit Carson?
72.4% of People are in the Labor Force in Kit Carson.
What is the Unemployment Rate in Kit Carson?
Unemployment Rate in Kit Carson is 2.8%.