Zip Codes with the Highest Percentage of Population Employed in Agriculture, Fishing & Hunting in Golden, CO
RELATED REPORTS & OPTIONS
Agriculture, Fishing & Hunting
Golden
Compare Zip Codes
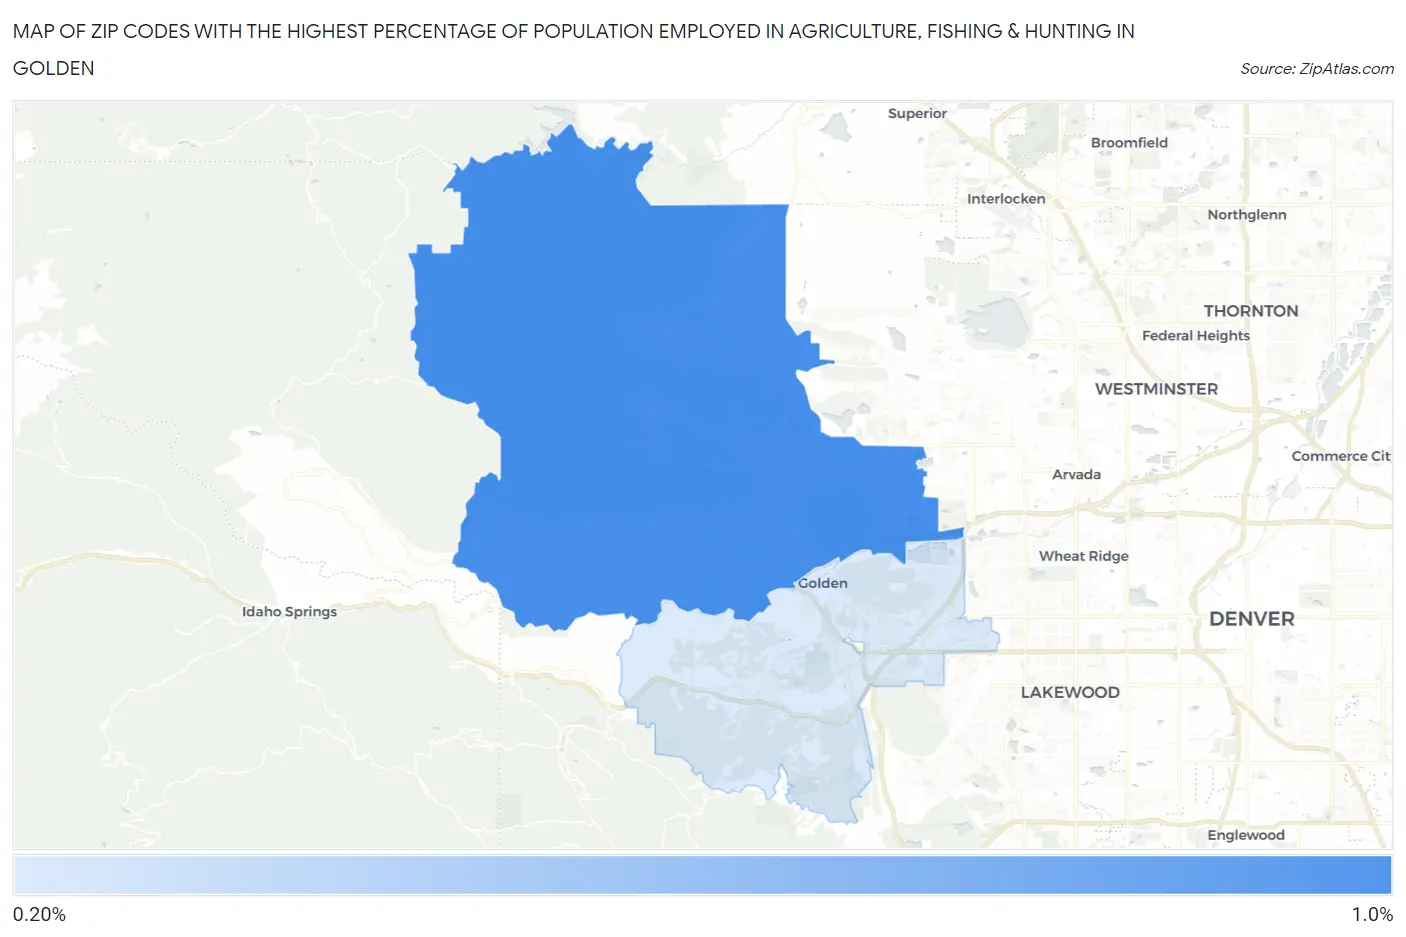
Map of Zip Codes with the Highest Percentage of Population Employed in Agriculture, Fishing & Hunting in Golden
0.0%
1.0%
Zip Codes with the Highest Percentage of Population Employed in Agriculture, Fishing & Hunting in Golden, CO
| Zip Code | % Employed | vs State | vs National | |
| 1. | 80403 | 0.91% | 1.1%(-0.236)#290 | 1.2%(-0.288)#16,652 |
| 2. | 80401 | 0.26% | 1.1%(-0.891)#393 | 1.2%(-0.943)#21,693 |
1
Common Questions
What are the Top Zip Codes with the Highest Percentage of Population Employed in Agriculture, Fishing & Hunting in Golden, CO?
Top Zip Codes with the Highest Percentage of Population Employed in Agriculture, Fishing & Hunting in Golden, CO are:
What zip code has the Highest Percentage of Population Employed in Agriculture, Fishing & Hunting in Golden, CO?
80403 has the Highest Percentage of Population Employed in Agriculture, Fishing & Hunting in Golden, CO with 0.91%.
What is the Percentage of Population Employed in Agriculture, Fishing & Hunting in Golden, CO?
Percentage of Population Employed in Agriculture, Fishing & Hunting in Golden is 0.34%.
What is the Percentage of Population Employed in Agriculture, Fishing & Hunting in Colorado?
Percentage of Population Employed in Agriculture, Fishing & Hunting in Colorado is 1.1%.
What is the Percentage of Population Employed in Agriculture, Fishing & Hunting in the United States?
Percentage of Population Employed in Agriculture, Fishing & Hunting in the United States is 1.2%.