Genoa, CO Map & Demographics
Genoa Map
Genoa Overview
$30,633
PER CAPITA INCOME
$47,917
AVG FAMILY INCOME
$46,250
AVG HOUSEHOLD INCOME
44.6%
WAGE / INCOME GAP [ % ]
55.4¢/ $1
WAGE / INCOME GAP [ $ ]
0.40
INEQUALITY / GINI INDEX
126
TOTAL POPULATION
68
MALE POPULATION
58
FEMALE POPULATION
117.24
MALES / 100 FEMALES
85.29
FEMALES / 100 MALES
52.0
MEDIAN AGE
2.3
AVG FAMILY SIZE
1.5
AVG HOUSEHOLD SIZE
62
LABOR FORCE [ PEOPLE ]
56.9%
PERCENT IN LABOR FORCE
Genoa Zip Codes
Genoa Area Codes
Income in Genoa
Income Overview in Genoa
Per Capita Income in Genoa is $30,633, while median incomes of families and households are $47,917 and $46,250 respectively.
| Characteristic | Number | Measure |
| Per Capita Income | 126 | $30,633 |
| Median Family Income | 27 | $47,917 |
| Mean Family Income | 27 | $53,396 |
| Median Household Income | 83 | $46,250 |
| Mean Household Income | 83 | $50,200 |
| Income Deficit | 27 | $0 |
| Wage / Income Gap (%) | 126 | 44.56% |
| Wage / Income Gap ($) | 126 | 55.44¢ per $1 |
| Gini / Inequality Index | 126 | 0.40 |
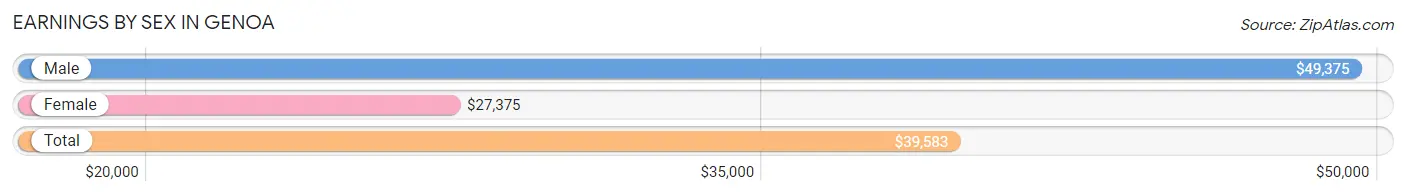
Earnings by Sex in Genoa
Average Earnings in Genoa are $39,583, $49,375 for men and $27,375 for women, a difference of 44.6%.
| Sex | Number | Average Earnings |
| Male | 38 (56.7%) | $49,375 |
| Female | 29 (43.3%) | $27,375 |
| Total | 67 (100.0%) | $39,583 |
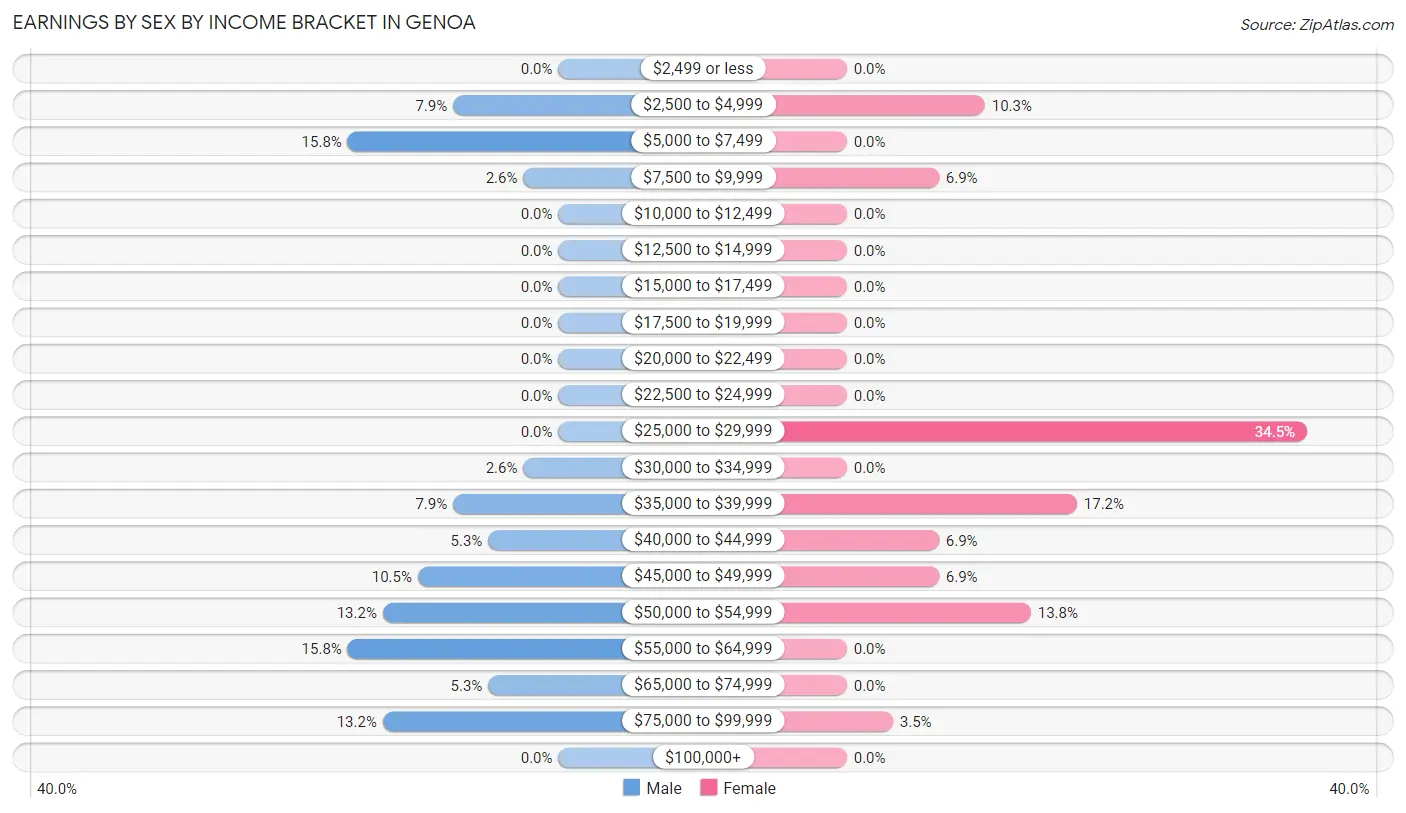
Earnings by Sex by Income Bracket in Genoa
The most common earnings brackets in Genoa are $5,000 to $7,499 for men (6 | 15.8%) and $25,000 to $29,999 for women (10 | 34.5%).
| Income | Male | Female |
| $2,499 or less | 0 (0.0%) | 0 (0.0%) |
| $2,500 to $4,999 | 3 (7.9%) | 3 (10.3%) |
| $5,000 to $7,499 | 6 (15.8%) | 0 (0.0%) |
| $7,500 to $9,999 | 1 (2.6%) | 2 (6.9%) |
| $10,000 to $12,499 | 0 (0.0%) | 0 (0.0%) |
| $12,500 to $14,999 | 0 (0.0%) | 0 (0.0%) |
| $15,000 to $17,499 | 0 (0.0%) | 0 (0.0%) |
| $17,500 to $19,999 | 0 (0.0%) | 0 (0.0%) |
| $20,000 to $22,499 | 0 (0.0%) | 0 (0.0%) |
| $22,500 to $24,999 | 0 (0.0%) | 0 (0.0%) |
| $25,000 to $29,999 | 0 (0.0%) | 10 (34.5%) |
| $30,000 to $34,999 | 1 (2.6%) | 0 (0.0%) |
| $35,000 to $39,999 | 3 (7.9%) | 5 (17.2%) |
| $40,000 to $44,999 | 2 (5.3%) | 2 (6.9%) |
| $45,000 to $49,999 | 4 (10.5%) | 2 (6.9%) |
| $50,000 to $54,999 | 5 (13.2%) | 4 (13.8%) |
| $55,000 to $64,999 | 6 (15.8%) | 0 (0.0%) |
| $65,000 to $74,999 | 2 (5.3%) | 0 (0.0%) |
| $75,000 to $99,999 | 5 (13.2%) | 1 (3.5%) |
| $100,000+ | 0 (0.0%) | 0 (0.0%) |
| Total | 38 (100.0%) | 29 (100.0%) |
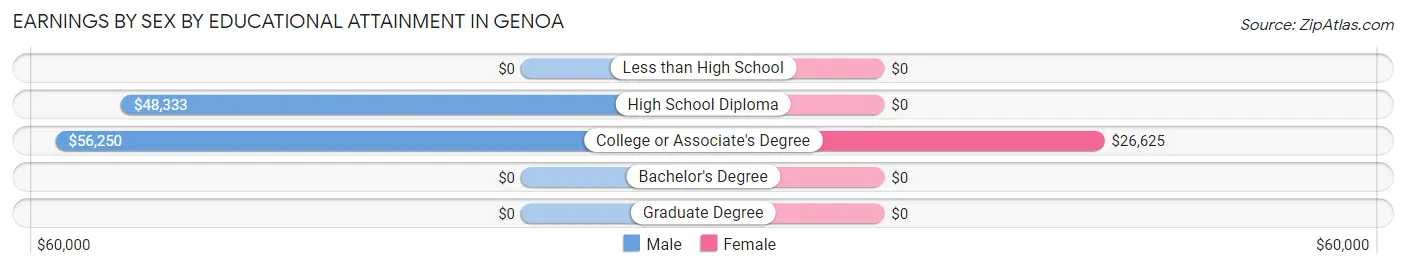
Earnings by Sex by Educational Attainment in Genoa
Average earnings in Genoa are $50,500 for men and $31,250 for women, a difference of 38.1%. Men with an educational attainment of college or associate's degree enjoy the highest average annual earnings of $56,250, while those with high school diploma education earn the least with $48,333. Women with an educational attainment of college or associate's degree earn the most with the average annual earnings of $26,625, while those with college or associate's degree education have the smallest earnings of $26,625.
| Educational Attainment | Male Income | Female Income |
| Less than High School | - | - |
| High School Diploma | $48,333 | $0 |
| College or Associate's Degree | $56,250 | $26,625 |
| Bachelor's Degree | - | - |
| Graduate Degree | - | - |
| Total | $50,500 | $31,250 |
Family Income in Genoa
Family Income Brackets in Genoa
According to the Genoa family income data, there are 10 families falling into the $25,000 to $34,999 income range, which is the most common income bracket and makes up 37.0% of all families.
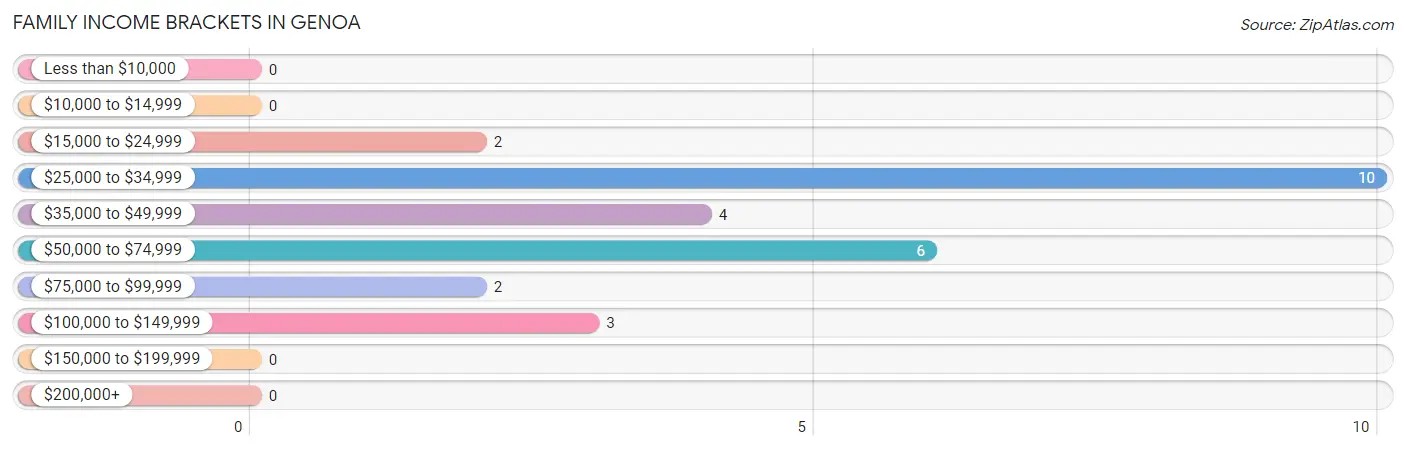
| Income Bracket | # Families | % Families |
| Less than $10,000 | 0 | 0.0% |
| $10,000 to $14,999 | 0 | 0.0% |
| $15,000 to $24,999 | 2 | 7.4% |
| $25,000 to $34,999 | 10 | 37.0% |
| $35,000 to $49,999 | 4 | 14.8% |
| $50,000 to $74,999 | 6 | 22.2% |
| $75,000 to $99,999 | 2 | 7.4% |
| $100,000 to $149,999 | 3 | 11.1% |
| $150,000 to $199,999 | 0 | 0.0% |
| $200,000+ | 0 | 0.0% |
Family Income by Famaliy Size in Genoa
2-person families (13 | 48.1%) account for the highest median family income in Genoa with $65,313 per family, while 2-person families (13 | 48.1%) have the highest median income of $32,656 per family member.
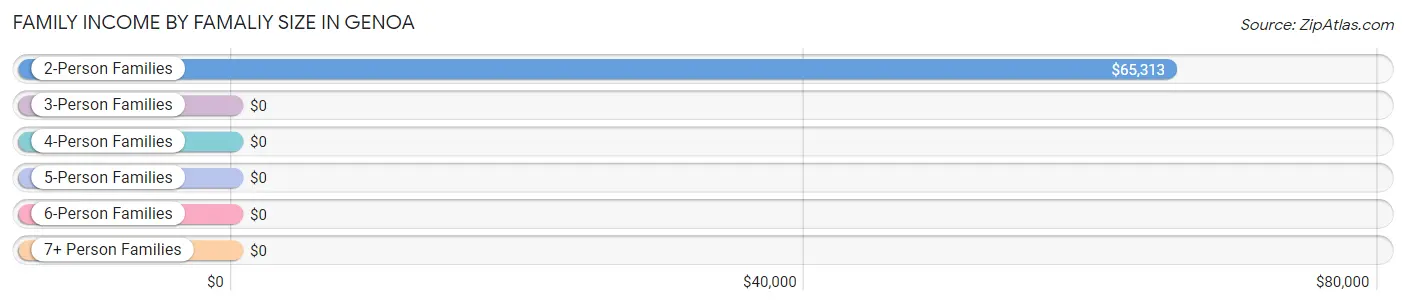
| Income Bracket | # Families | Median Income |
| 2-Person Families | 13 (48.1%) | $65,313 |
| 3-Person Families | 1 (3.7%) | $0 |
| 4-Person Families | 11 (40.7%) | $0 |
| 5-Person Families | 2 (7.4%) | $0 |
| 6-Person Families | 0 (0.0%) | $0 |
| 7+ Person Families | 0 (0.0%) | $0 |
| Total | 27 (100.0%) | $47,917 |
Family Income by Number of Earners in Genoa
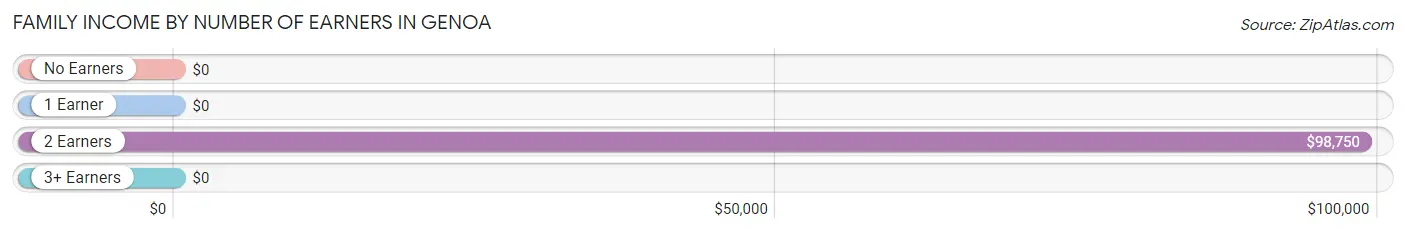
| Number of Earners | # Families | Median Income |
| No Earners | 3 (11.1%) | $0 |
| 1 Earner | 18 (66.7%) | $0 |
| 2 Earners | 4 (14.8%) | $98,750 |
| 3+ Earners | 2 (7.4%) | $0 |
| Total | 27 (100.0%) | $47,917 |
Household Income in Genoa
Household Income Brackets in Genoa
With 16 households falling in the category, the $50,000 to $74,999 income range is the most frequent in Genoa, accounting for 19.3% of all households.
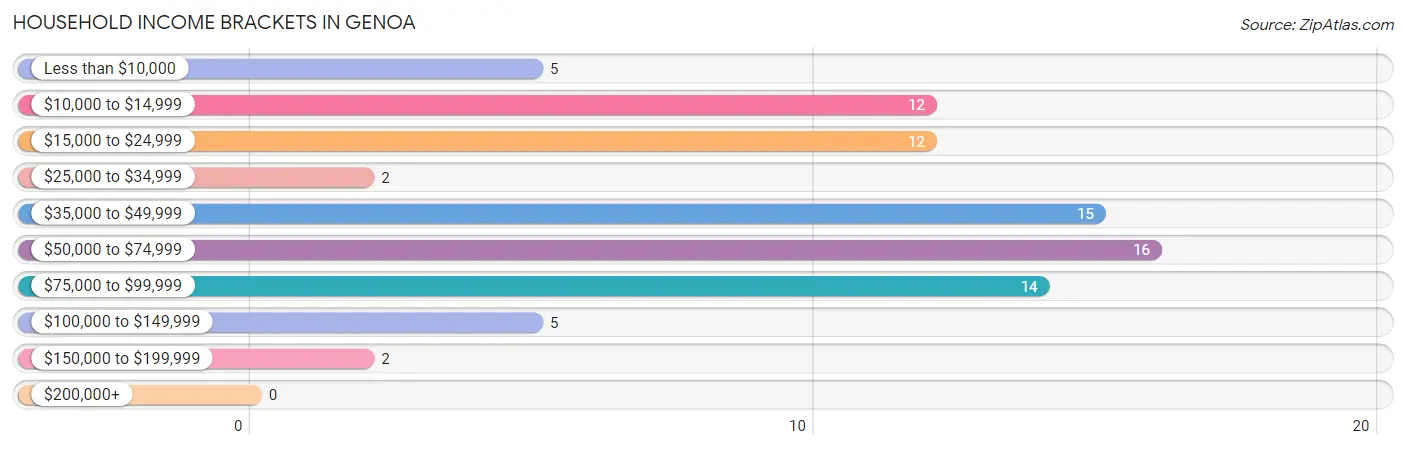
| Income Bracket | # Households | % Households |
| Less than $10,000 | 5 | 6.0% |
| $10,000 to $14,999 | 12 | 14.5% |
| $15,000 to $24,999 | 12 | 14.5% |
| $25,000 to $34,999 | 2 | 2.4% |
| $35,000 to $49,999 | 15 | 18.1% |
| $50,000 to $74,999 | 16 | 19.3% |
| $75,000 to $99,999 | 14 | 16.9% |
| $100,000 to $149,999 | 5 | 6.0% |
| $150,000 to $199,999 | 2 | 2.4% |
| $200,000+ | 0 | 0.0% |
Household Income by Householder Age in Genoa
The median household income in Genoa is $46,250, with the highest median household income of $78,594 found in the 25 to 44 years age bracket for the primary householder. A total of 13 households (15.7%) fall into this category.
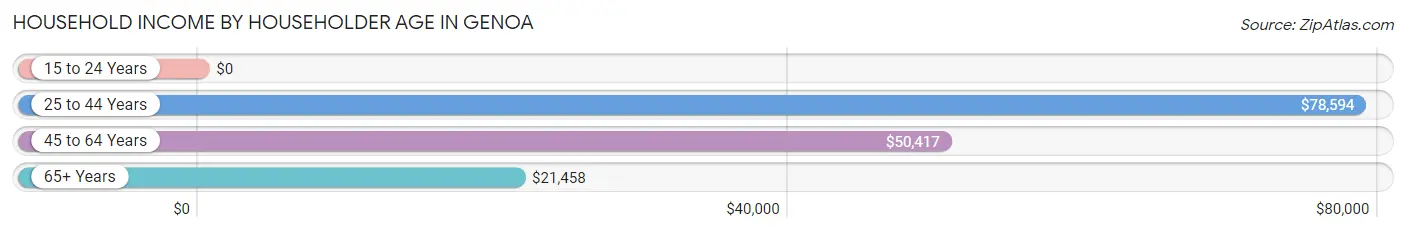
| Income Bracket | # Households | Median Income |
| 15 to 24 Years | 0 (0.0%) | $0 |
| 25 to 44 Years | 13 (15.7%) | $78,594 |
| 45 to 64 Years | 47 (56.6%) | $50,417 |
| 65+ Years | 23 (27.7%) | $21,458 |
| Total | 83 (100.0%) | $46,250 |
Poverty in Genoa
Income Below Poverty by Sex and Age in Genoa
With 27.9% poverty level for males and 34.5% for females among the residents of Genoa, 5 year old males and 25 to 34 year old females are the most vulnerable to poverty, with 3 males (100.0%) and 8 females (80.0%) in their respective age groups living below the poverty level.
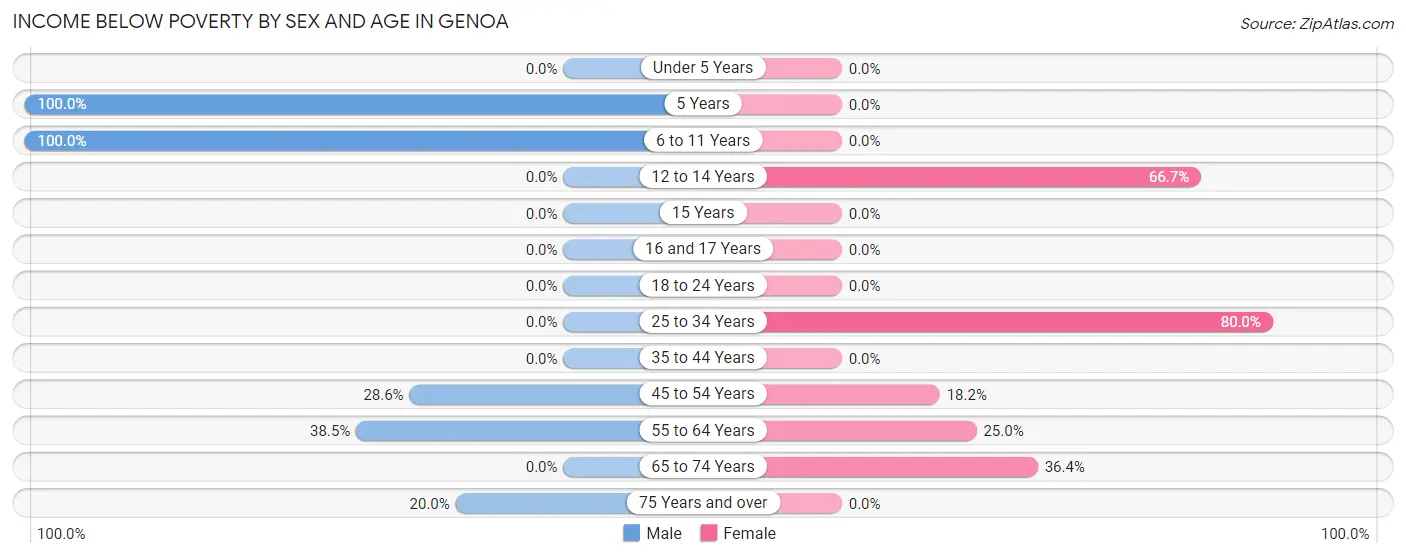
| Age Bracket | Male | Female |
| Under 5 Years | 0 (0.0%) | 0 (0.0%) |
| 5 Years | 3 (100.0%) | 0 (0.0%) |
| 6 to 11 Years | 3 (100.0%) | 0 (0.0%) |
| 12 to 14 Years | 0 (0.0%) | 4 (66.7%) |
| 15 Years | 0 (0.0%) | 0 (0.0%) |
| 16 and 17 Years | 0 (0.0%) | 0 (0.0%) |
| 18 to 24 Years | 0 (0.0%) | 0 (0.0%) |
| 25 to 34 Years | 0 (0.0%) | 8 (80.0%) |
| 35 to 44 Years | 0 (0.0%) | 0 (0.0%) |
| 45 to 54 Years | 6 (28.6%) | 2 (18.2%) |
| 55 to 64 Years | 5 (38.5%) | 2 (25.0%) |
| 65 to 74 Years | 0 (0.0%) | 4 (36.4%) |
| 75 Years and over | 2 (20.0%) | 0 (0.0%) |
| Total | 19 (27.9%) | 20 (34.5%) |
Income Above Poverty by Sex and Age in Genoa
According to the poverty statistics in Genoa, males aged 16 and 17 years and females aged under 5 years are the age groups that are most secure financially, with 100.0% of males and 100.0% of females in these age groups living above the poverty line.
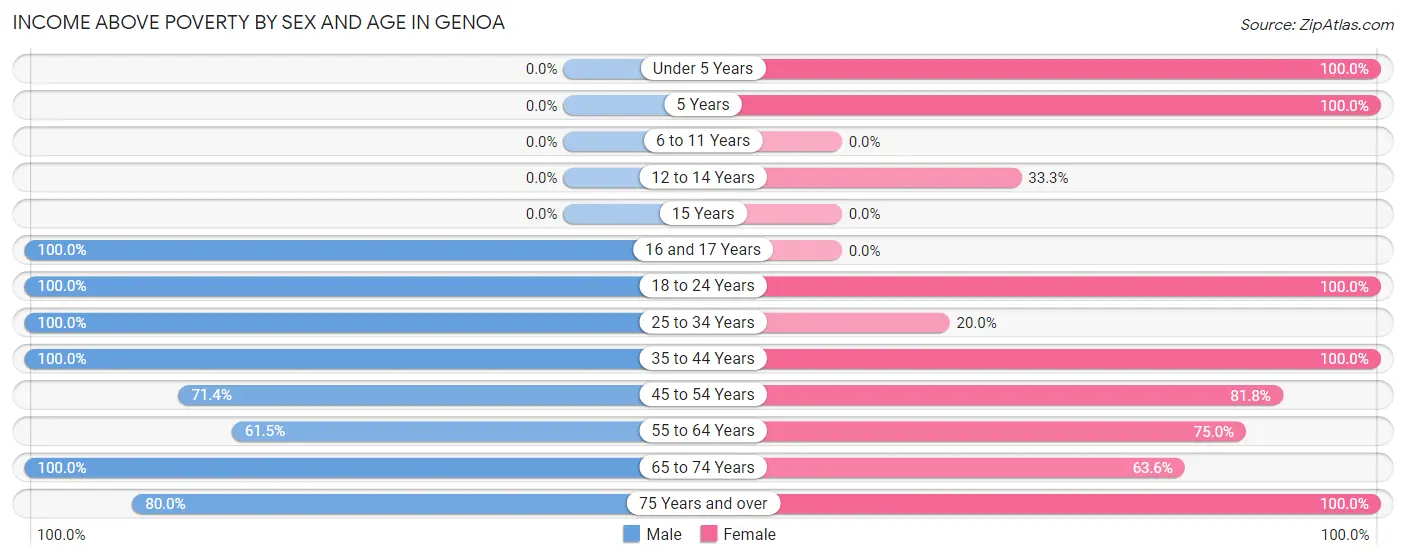
| Age Bracket | Male | Female |
| Under 5 Years | 0 (0.0%) | 3 (100.0%) |
| 5 Years | 0 (0.0%) | 2 (100.0%) |
| 6 to 11 Years | 0 (0.0%) | 0 (0.0%) |
| 12 to 14 Years | 0 (0.0%) | 2 (33.3%) |
| 15 Years | 0 (0.0%) | 0 (0.0%) |
| 16 and 17 Years | 3 (100.0%) | 0 (0.0%) |
| 18 to 24 Years | 1 (100.0%) | 1 (100.0%) |
| 25 to 34 Years | 9 (100.0%) | 2 (20.0%) |
| 35 to 44 Years | 1 (100.0%) | 2 (100.0%) |
| 45 to 54 Years | 15 (71.4%) | 9 (81.8%) |
| 55 to 64 Years | 8 (61.5%) | 6 (75.0%) |
| 65 to 74 Years | 4 (100.0%) | 7 (63.6%) |
| 75 Years and over | 8 (80.0%) | 4 (100.0%) |
| Total | 49 (72.1%) | 38 (65.5%) |
Income Below Poverty Among Married-Couple Families in Genoa
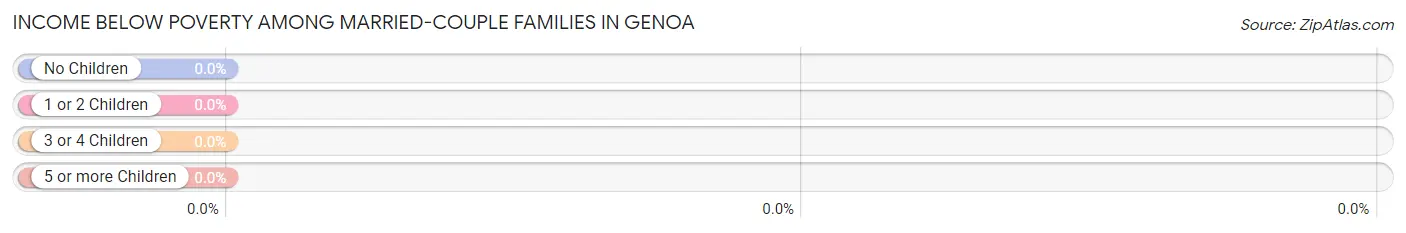
| Children | Above Poverty | Below Poverty |
| No Children | 8 (100.0%) | 0 (0.0%) |
| 1 or 2 Children | 5 (100.0%) | 0 (0.0%) |
| 3 or 4 Children | 0 (0.0%) | 0 (0.0%) |
| 5 or more Children | 0 (0.0%) | 0 (0.0%) |
| Total | 13 (100.0%) | 0 (0.0%) |
Income Below Poverty Among Single-Parent Households in Genoa
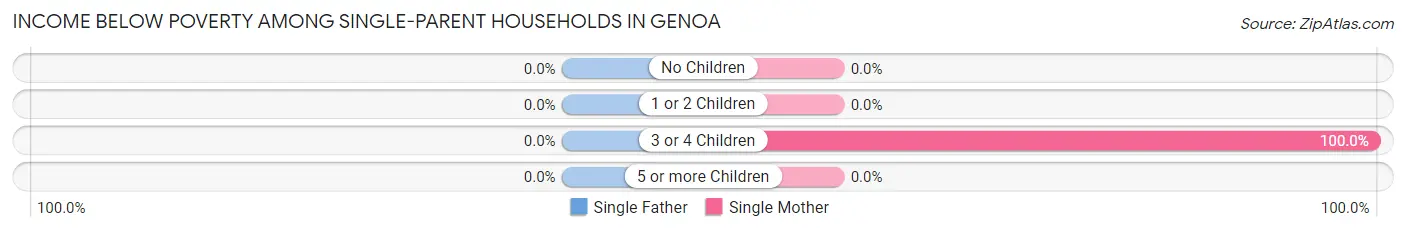
| Children | Single Father | Single Mother |
| No Children | 0 (0.0%) | 0 (0.0%) |
| 1 or 2 Children | 0 (0.0%) | 0 (0.0%) |
| 3 or 4 Children | 0 (0.0%) | 8 (100.0%) |
| 5 or more Children | 0 (0.0%) | 0 (0.0%) |
| Total | 0 (0.0%) | 8 (57.1%) |
Income Below Poverty Among Married-Couple vs Single-Parent Households in Genoa
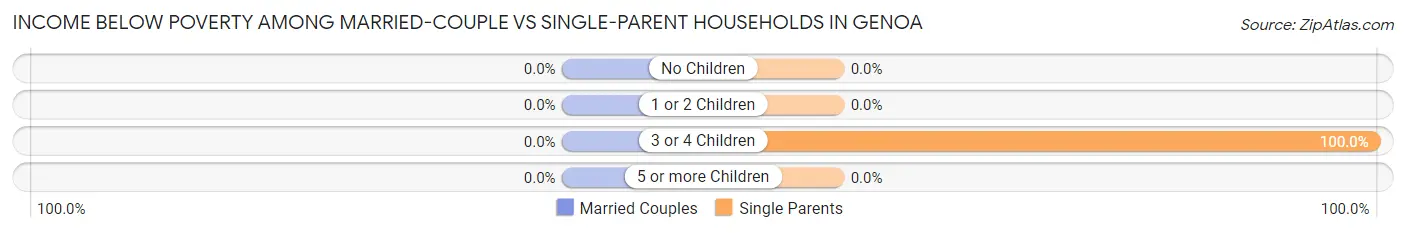
| Children | Married-Couple Families | Single-Parent Households |
| No Children | 0 (0.0%) | 0 (0.0%) |
| 1 or 2 Children | 0 (0.0%) | 0 (0.0%) |
| 3 or 4 Children | 0 (0.0%) | 8 (100.0%) |
| 5 or more Children | 0 (0.0%) | 0 (0.0%) |
| Total | 0 (0.0%) | 8 (57.1%) |
Race in Genoa
The most populous races in Genoa are White / Caucasian (123 | 97.6%), and Two or more Races (3 | 2.4%).
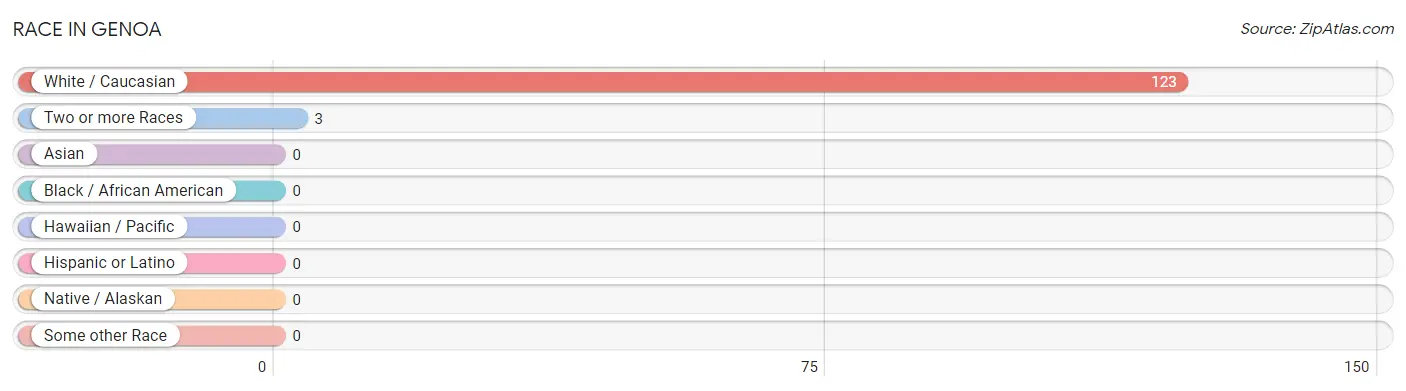
| Race | # Population | % Population |
| Asian | 0 | 0.0% |
| Black / African American | 0 | 0.0% |
| Hawaiian / Pacific | 0 | 0.0% |
| Hispanic or Latino | 0 | 0.0% |
| Native / Alaskan | 0 | 0.0% |
| White / Caucasian | 123 | 97.6% |
| Two or more Races | 3 | 2.4% |
| Some other Race | 0 | 0.0% |
| Total | 126 | 100.0% |
Ancestry in Genoa
The most populous ancestries reported in Genoa are German (24 | 19.1%), Swedish (10 | 7.9%), French (6 | 4.8%), American (5 | 4.0%), and English (5 | 4.0%), together accounting for 39.7% of all Genoa residents.
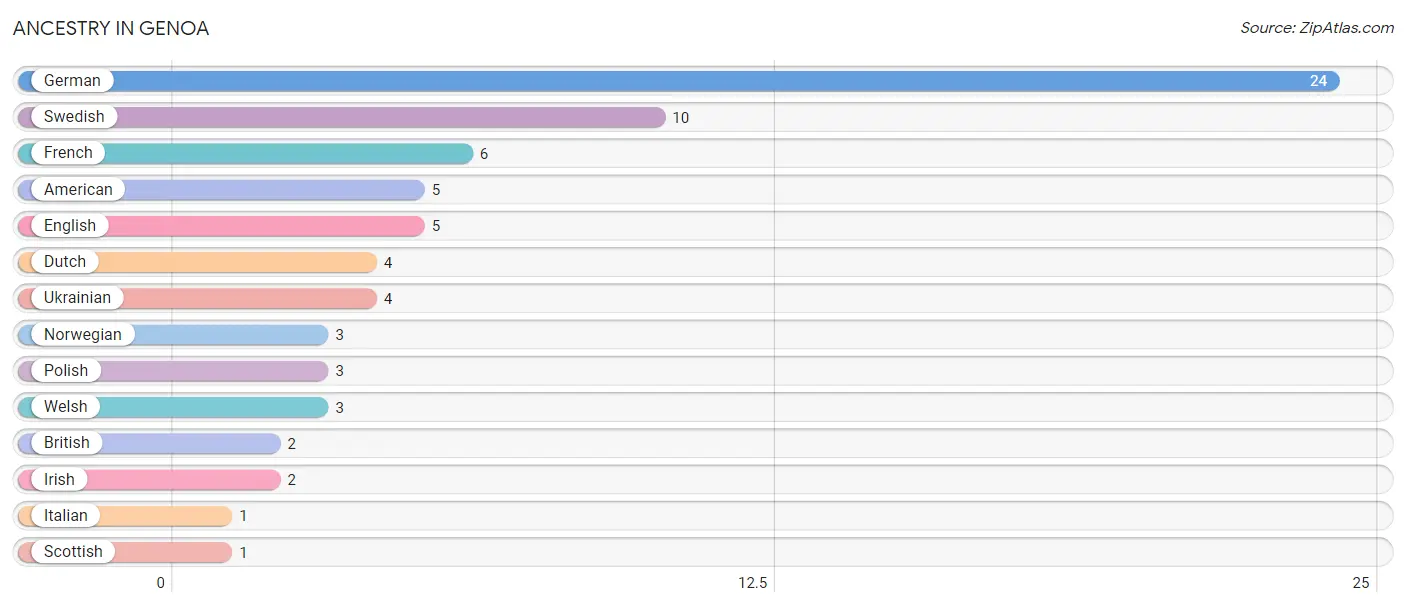
| Ancestry | # Population | % Population |
| American | 5 | 4.0% |
| British | 2 | 1.6% |
| Dutch | 4 | 3.2% |
| English | 5 | 4.0% |
| French | 6 | 4.8% |
| German | 24 | 19.1% |
| Irish | 2 | 1.6% |
| Italian | 1 | 0.8% |
| Norwegian | 3 | 2.4% |
| Polish | 3 | 2.4% |
| Scottish | 1 | 0.8% |
| Swedish | 10 | 7.9% |
| Ukrainian | 4 | 3.2% |
| Welsh | 3 | 2.4% | View All 14 Rows |
Immigrants in Genoa

| Immigration Origin | # Population | % Population | View All 0 Rows |
Sex and Age in Genoa
Sex and Age in Genoa
The most populous age groups in Genoa are 50 to 54 Years (15 | 22.1%) for men and 70 to 74 Years (10 | 17.2%) for women.
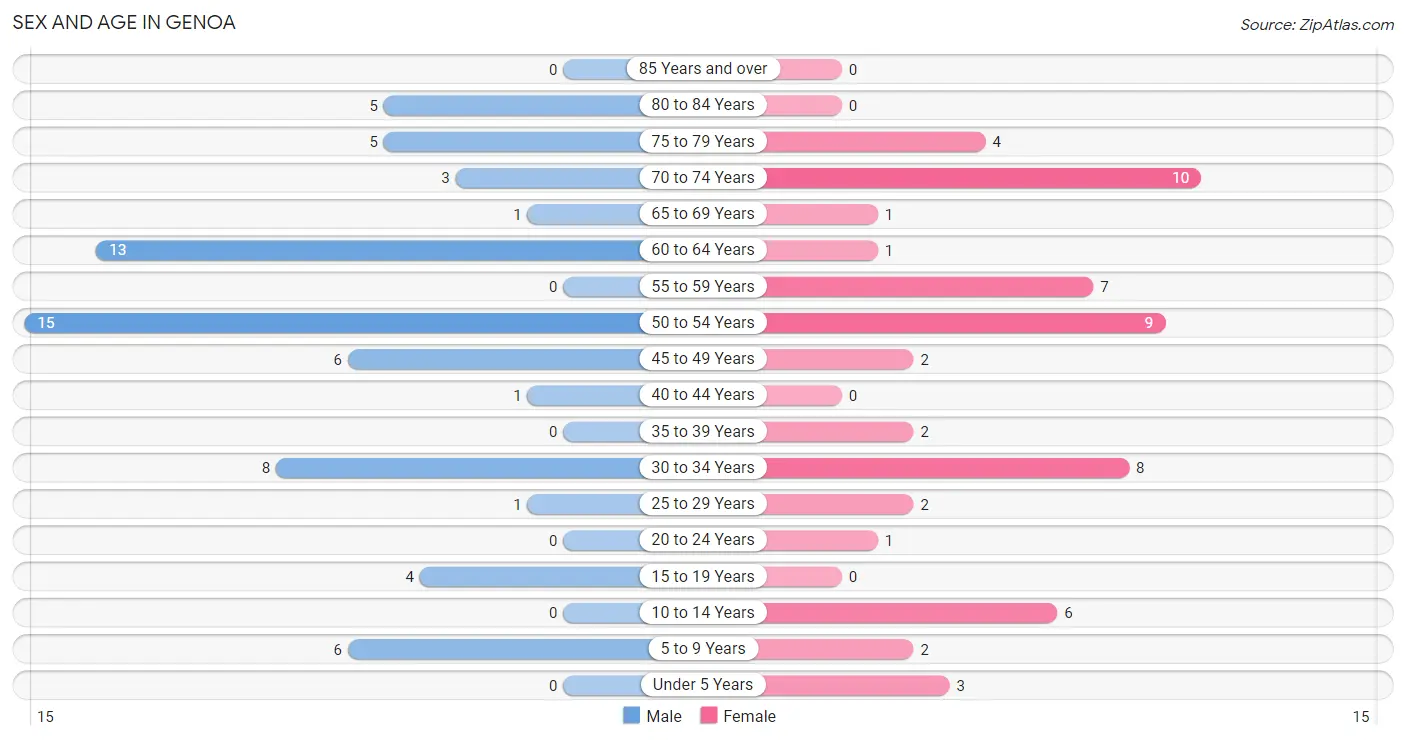
| Age Bracket | Male | Female |
| Under 5 Years | 0 (0.0%) | 3 (5.2%) |
| 5 to 9 Years | 6 (8.8%) | 2 (3.5%) |
| 10 to 14 Years | 0 (0.0%) | 6 (10.3%) |
| 15 to 19 Years | 4 (5.9%) | 0 (0.0%) |
| 20 to 24 Years | 0 (0.0%) | 1 (1.7%) |
| 25 to 29 Years | 1 (1.5%) | 2 (3.5%) |
| 30 to 34 Years | 8 (11.8%) | 8 (13.8%) |
| 35 to 39 Years | 0 (0.0%) | 2 (3.5%) |
| 40 to 44 Years | 1 (1.5%) | 0 (0.0%) |
| 45 to 49 Years | 6 (8.8%) | 2 (3.5%) |
| 50 to 54 Years | 15 (22.1%) | 9 (15.5%) |
| 55 to 59 Years | 0 (0.0%) | 7 (12.1%) |
| 60 to 64 Years | 13 (19.1%) | 1 (1.7%) |
| 65 to 69 Years | 1 (1.5%) | 1 (1.7%) |
| 70 to 74 Years | 3 (4.4%) | 10 (17.2%) |
| 75 to 79 Years | 5 (7.3%) | 4 (6.9%) |
| 80 to 84 Years | 5 (7.3%) | 0 (0.0%) |
| 85 Years and over | 0 (0.0%) | 0 (0.0%) |
| Total | 68 (100.0%) | 58 (100.0%) |
Families and Households in Genoa
Median Family Size in Genoa
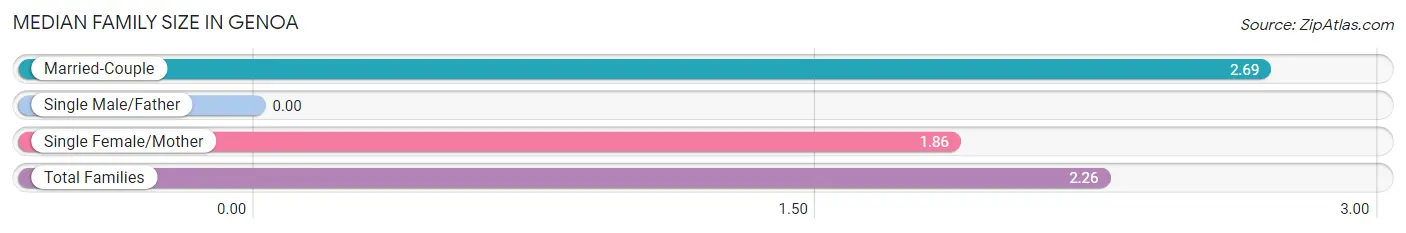
| Family Type | # Families | Family Size |
| Married-Couple | 13 (48.1%) | 2.69 |
| Single Male/Father | 0 (0.0%) | - |
| Single Female/Mother | 14 (51.8%) | 1.86 |
| Total Families | 27 (100.0%) | 2.26 |
Median Household Size in Genoa
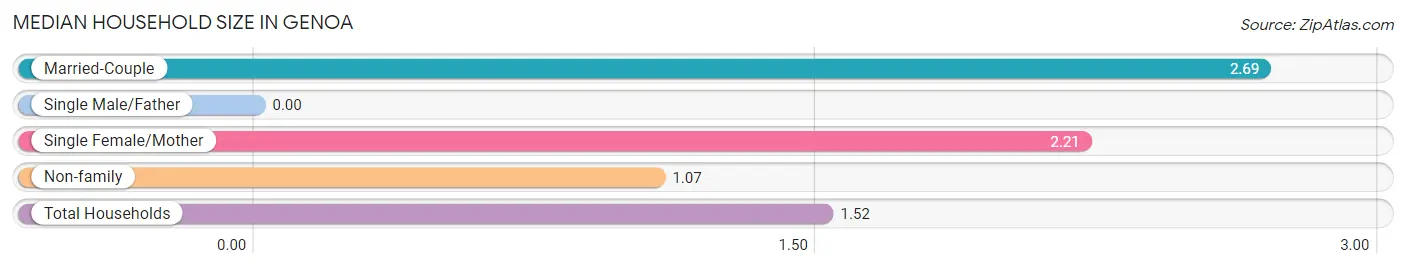
| Household Type | # Households | Household Size |
| Married-Couple | 13 (15.7%) | 2.69 |
| Single Male/Father | 0 (0.0%) | - |
| Single Female/Mother | 14 (16.9%) | 2.21 |
| Non-family | 56 (67.5%) | 1.07 |
| Total Households | 83 (100.0%) | 1.52 |
Household Size by Marriage Status in Genoa
Out of a total of 83 households in Genoa, 27 (32.5%) are family households, while 56 (67.5%) are nonfamily households. The most numerous type of family households are 2-person households, comprising 13, and the most common type of nonfamily households are 1-person households, comprising 52.
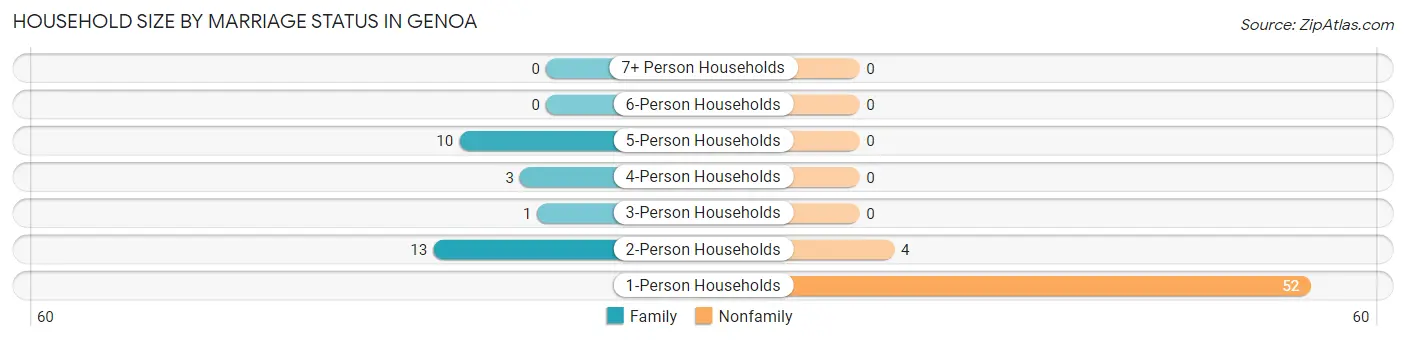
| Household Size | Family Households | Nonfamily Households |
| 1-Person Households | - | 52 (62.6%) |
| 2-Person Households | 13 (15.7%) | 4 (4.8%) |
| 3-Person Households | 1 (1.2%) | 0 (0.0%) |
| 4-Person Households | 3 (3.6%) | 0 (0.0%) |
| 5-Person Households | 10 (12.0%) | 0 (0.0%) |
| 6-Person Households | 0 (0.0%) | 0 (0.0%) |
| 7+ Person Households | 0 (0.0%) | 0 (0.0%) |
| Total | 27 (32.5%) | 56 (67.5%) |
Female Fertility in Genoa
Fertility by Age in Genoa
| Age Bracket | Women with Births | Births / 1,000 Women |
| 15 to 19 years | 0 (0.0%) | 0.0 |
| 20 to 34 years | 0 (0.0%) | 0.0 |
| 35 to 50 years | 0 (0.0%) | 0.0 |
| Total | 0 (0.0%) | 0.0 |
Fertility by Age by Marriage Status in Genoa
| Age Bracket | Married | Unmarried |
| 15 to 19 years | 0 (0.0%) | 0 (0.0%) |
| 20 to 34 years | 0 (0.0%) | 0 (0.0%) |
| 35 to 50 years | 0 (0.0%) | 0 (0.0%) |
| Total | 0 (0.0%) | 0 (0.0%) |
Fertility by Education in Genoa
| Educational Attainment | Women with Births | Births / 1,000 Women |
| Less than High School | 0 (0.0%) | 0.0 |
| High School Diploma | 0 (0.0%) | 0.0 |
| College or Associate's Degree | 0 (0.0%) | 0.0 |
| Bachelor's Degree | 0 (0.0%) | 0.0 |
| Graduate Degree | 0 (0.0%) | 0.0 |
| Total | 0 (0.0%) | 0.0 |
Fertility by Education by Marriage Status in Genoa
| Educational Attainment | Married | Unmarried |
| Less than High School | 0 (0.0%) | 0 (0.0%) |
| High School Diploma | 0 (0.0%) | 0 (0.0%) |
| College or Associate's Degree | 0 (0.0%) | 0 (0.0%) |
| Bachelor's Degree | 0 (0.0%) | 0 (0.0%) |
| Graduate Degree | 0 (0.0%) | 0 (0.0%) |
| Total | 0 (0.0%) | 0 (0.0%) |
Employment Characteristics in Genoa
Employment by Class of Employer in Genoa
Among the 62 employed individuals in Genoa, private company employees (33 | 53.2%), self-employed (not incorporated) (13 | 21.0%), and not-for-profit organizations (6 | 9.7%) make up the most common classes of employment.
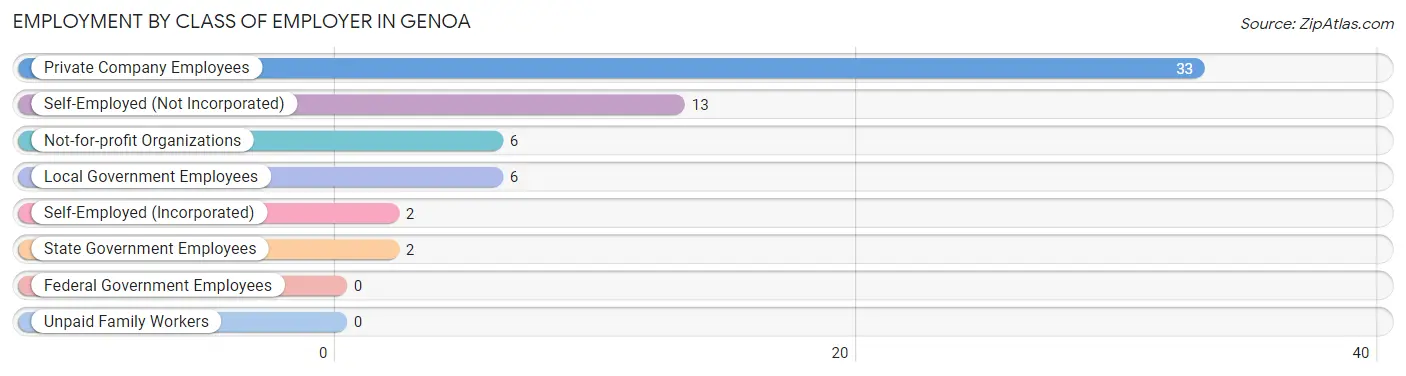
| Employer Class | # Employees | % Employees |
| Private Company Employees | 33 | 53.2% |
| Self-Employed (Incorporated) | 2 | 3.2% |
| Self-Employed (Not Incorporated) | 13 | 21.0% |
| Not-for-profit Organizations | 6 | 9.7% |
| Local Government Employees | 6 | 9.7% |
| State Government Employees | 2 | 3.2% |
| Federal Government Employees | 0 | 0.0% |
| Unpaid Family Workers | 0 | 0.0% |
| Total | 62 | 100.0% |
Employment Status by Age in Genoa
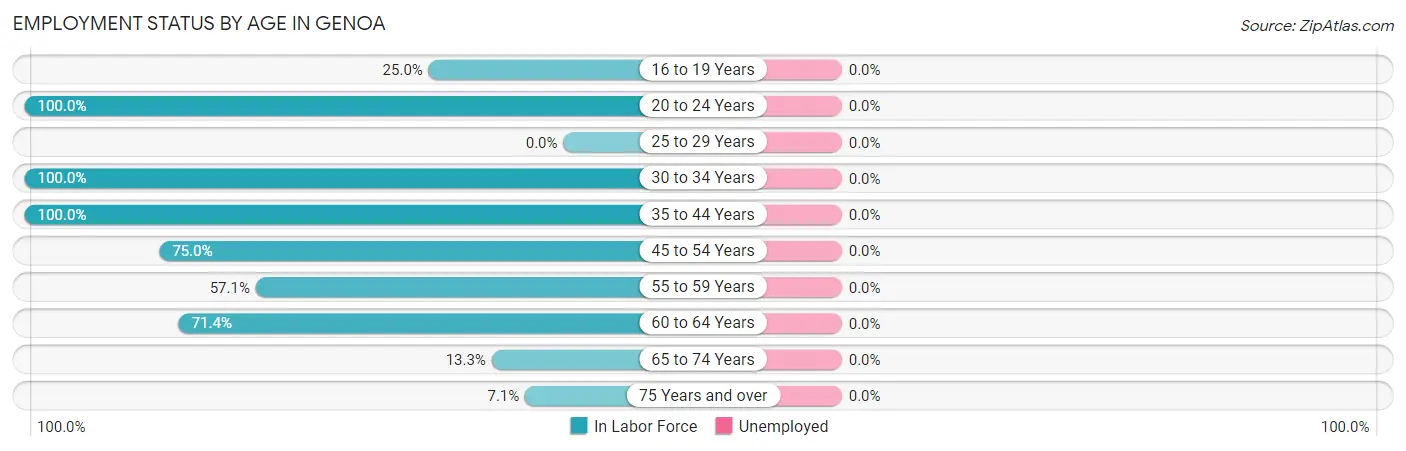
| Age Bracket | In Labor Force | Unemployed |
| 16 to 19 Years | 1 (25.0%) | 0 (0.0%) |
| 20 to 24 Years | 1 (100.0%) | 0 (0.0%) |
| 25 to 29 Years | 0 (0.0%) | 0 (0.0%) |
| 30 to 34 Years | 16 (100.0%) | 0 (0.0%) |
| 35 to 44 Years | 3 (100.0%) | 0 (0.0%) |
| 45 to 54 Years | 24 (75.0%) | 0 (0.0%) |
| 55 to 59 Years | 4 (57.1%) | 0 (0.0%) |
| 60 to 64 Years | 10 (71.4%) | 0 (0.0%) |
| 65 to 74 Years | 2 (13.3%) | 0 (0.0%) |
| 75 Years and over | 1 (7.1%) | 0 (0.0%) |
| Total | 62 (56.9%) | 0 (0.0%) |
Employment Status by Educational Attainment in Genoa
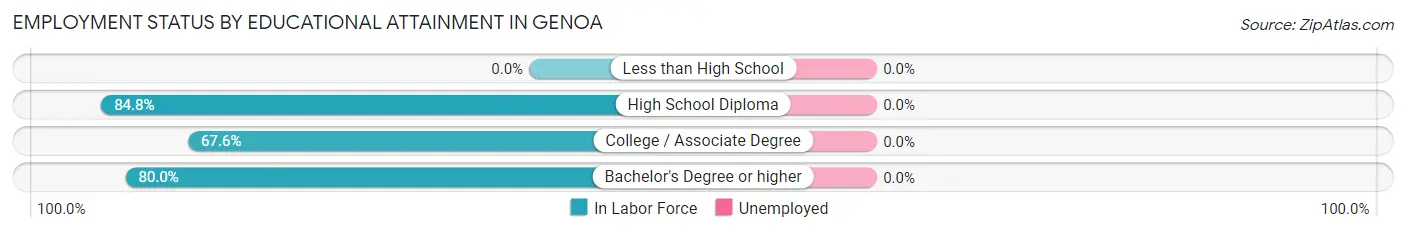
| Educational Attainment | In Labor Force | Unemployed |
| Less than High School | 0 (0.0%) | 0 (0.0%) |
| High School Diploma | 28 (84.8%) | 0 (0.0%) |
| College / Associate Degree | 25 (67.6%) | 0 (0.0%) |
| Bachelor's Degree or higher | 4 (80.0%) | 0 (0.0%) |
| Total | 57 (76.0%) | 0 (0.0%) |
Employment Occupations by Sex in Genoa
Management, Business, Science and Arts Occupations
The most common Management, Business, Science and Arts occupations in Genoa are Management (6 | 9.7%), Health Diagnosing & Treating (5 | 8.1%), Community & Social Service (1 | 1.6%), and Education Instruction & Library (1 | 1.6%).
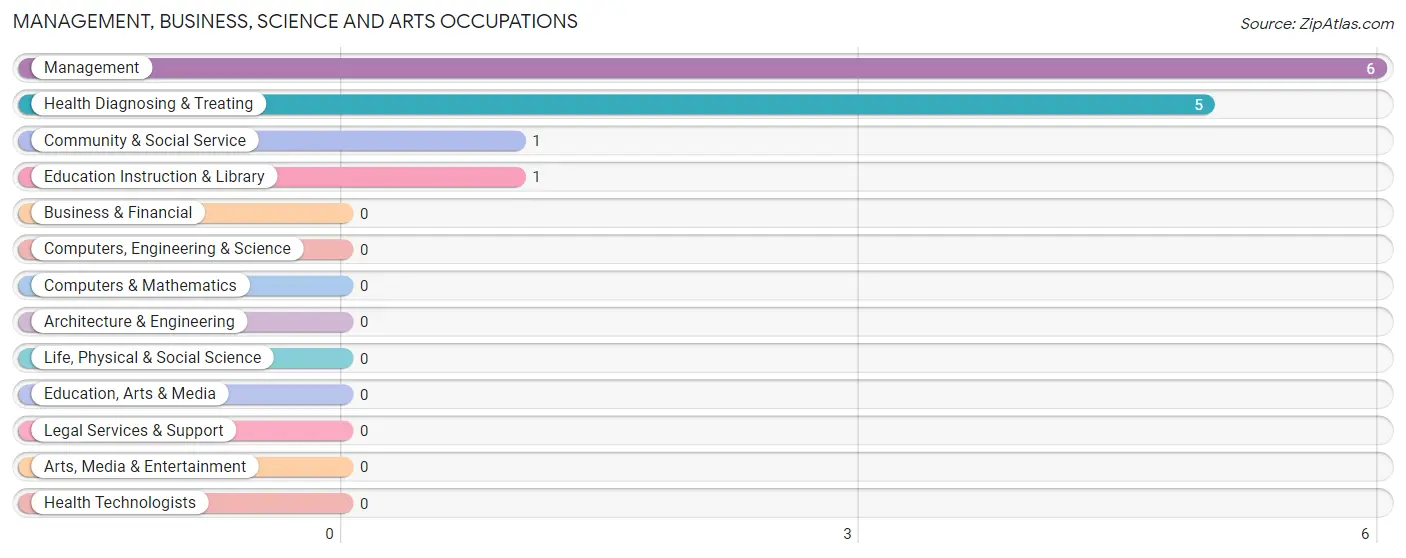
Management, Business, Science and Arts Occupations by Sex
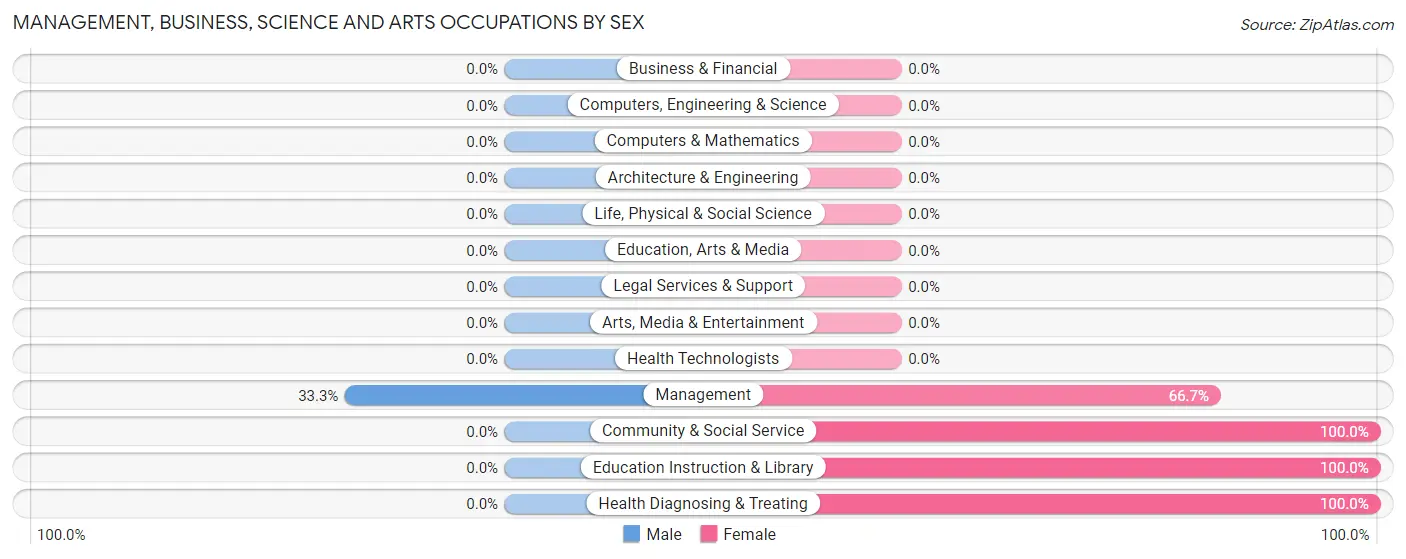
| Occupation | Male | Female |
| Management | 2 (33.3%) | 4 (66.7%) |
| Business & Financial | 0 (0.0%) | 0 (0.0%) |
| Computers, Engineering & Science | 0 (0.0%) | 0 (0.0%) |
| Computers & Mathematics | 0 (0.0%) | 0 (0.0%) |
| Architecture & Engineering | 0 (0.0%) | 0 (0.0%) |
| Life, Physical & Social Science | 0 (0.0%) | 0 (0.0%) |
| Community & Social Service | 0 (0.0%) | 1 (100.0%) |
| Education, Arts & Media | 0 (0.0%) | 0 (0.0%) |
| Legal Services & Support | 0 (0.0%) | 0 (0.0%) |
| Education Instruction & Library | 0 (0.0%) | 1 (100.0%) |
| Arts, Media & Entertainment | 0 (0.0%) | 0 (0.0%) |
| Health Diagnosing & Treating | 0 (0.0%) | 5 (100.0%) |
| Health Technologists | 0 (0.0%) | 0 (0.0%) |
| Total (Category) | 2 (16.7%) | 10 (83.3%) |
| Total (Overall) | 33 (53.2%) | 29 (46.8%) |
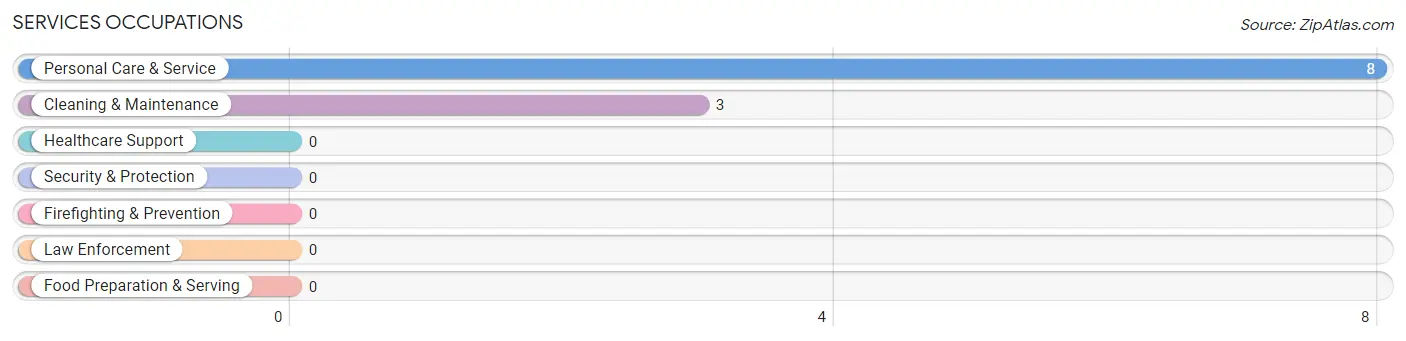
Services Occupations
The most common Services occupations in Genoa are Personal Care & Service (8 | 12.9%), and Cleaning & Maintenance (3 | 4.8%).
Services Occupations by Sex
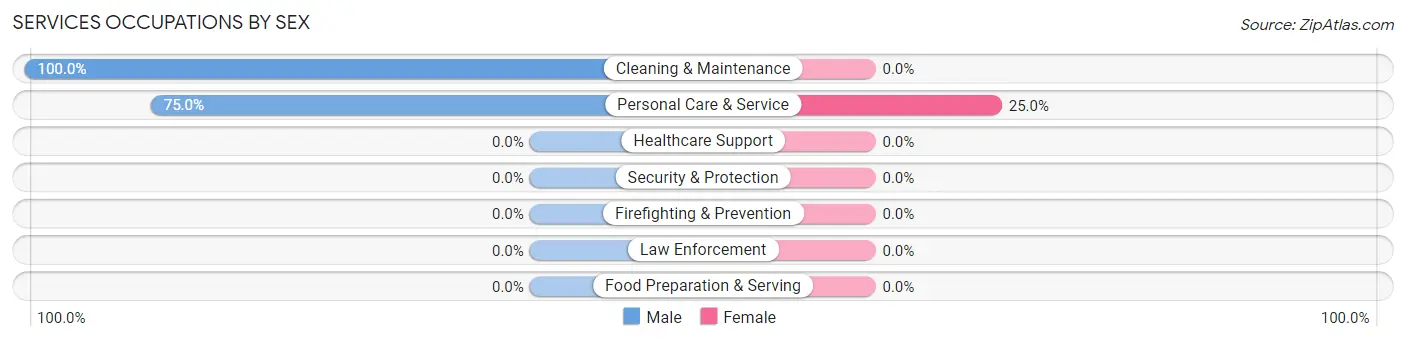
| Occupation | Male | Female |
| Healthcare Support | 0 (0.0%) | 0 (0.0%) |
| Security & Protection | 0 (0.0%) | 0 (0.0%) |
| Firefighting & Prevention | 0 (0.0%) | 0 (0.0%) |
| Law Enforcement | 0 (0.0%) | 0 (0.0%) |
| Food Preparation & Serving | 0 (0.0%) | 0 (0.0%) |
| Cleaning & Maintenance | 3 (100.0%) | 0 (0.0%) |
| Personal Care & Service | 6 (75.0%) | 2 (25.0%) |
| Total (Category) | 9 (81.8%) | 2 (18.2%) |
| Total (Overall) | 33 (53.2%) | 29 (46.8%) |
Sales and Office Occupations
The most common Sales and Office occupations in Genoa are Office & Administration (11 | 17.7%), and Sales & Related (10 | 16.1%).

Sales and Office Occupations by Sex

| Occupation | Male | Female |
| Sales & Related | 2 (20.0%) | 8 (80.0%) |
| Office & Administration | 2 (18.2%) | 9 (81.8%) |
| Total (Category) | 4 (19.1%) | 17 (80.9%) |
| Total (Overall) | 33 (53.2%) | 29 (46.8%) |
Natural Resources, Construction and Maintenance Occupations
The most common Natural Resources, Construction and Maintenance occupations in Genoa are Construction & Extraction (10 | 16.1%), and Installation, Maintenance & Repair (5 | 8.1%).
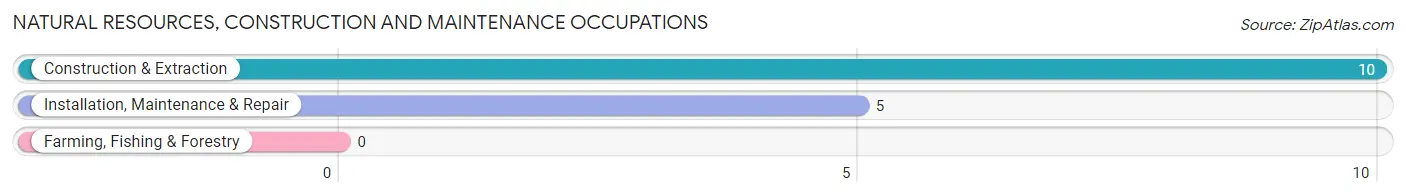
Natural Resources, Construction and Maintenance Occupations by Sex
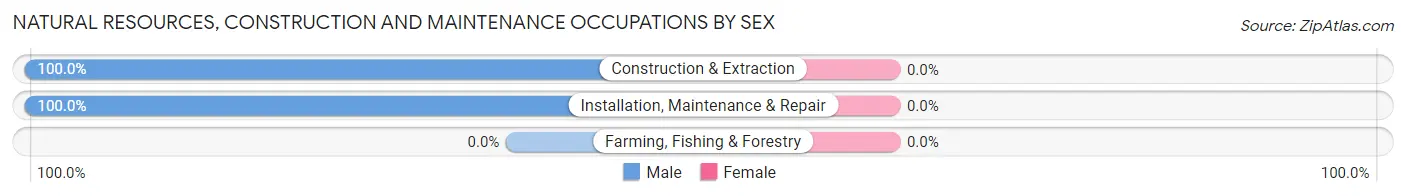
| Occupation | Male | Female |
| Farming, Fishing & Forestry | 0 (0.0%) | 0 (0.0%) |
| Construction & Extraction | 10 (100.0%) | 0 (0.0%) |
| Installation, Maintenance & Repair | 5 (100.0%) | 0 (0.0%) |
| Total (Category) | 15 (100.0%) | 0 (0.0%) |
| Total (Overall) | 33 (53.2%) | 29 (46.8%) |
Production, Transportation and Moving Occupations
The most common Production, Transportation and Moving occupations in Genoa are Production (2 | 3.2%), and Transportation (1 | 1.6%).
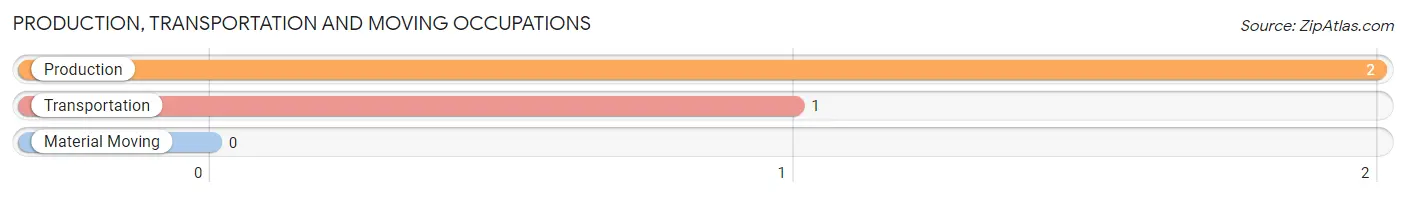
Production, Transportation and Moving Occupations by Sex
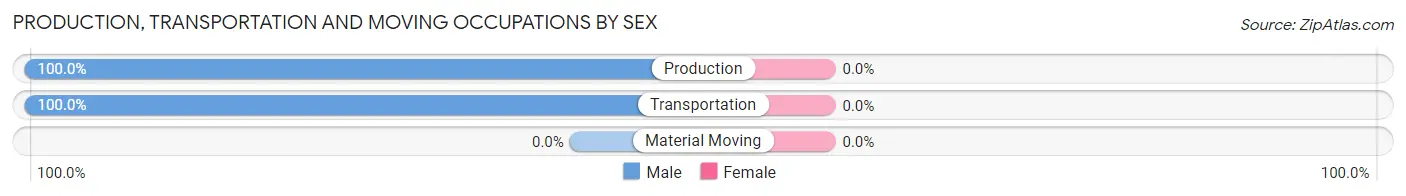
| Occupation | Male | Female |
| Production | 2 (100.0%) | 0 (0.0%) |
| Transportation | 1 (100.0%) | 0 (0.0%) |
| Material Moving | 0 (0.0%) | 0 (0.0%) |
| Total (Category) | 3 (100.0%) | 0 (0.0%) |
| Total (Overall) | 33 (53.2%) | 29 (46.8%) |
Employment Industries by Sex in Genoa
Employment Industries in Genoa
The major employment industries in Genoa include Health Care & Social Assistance (12 | 19.4%), Construction (11 | 17.7%), Retail Trade (8 | 12.9%), Agriculture, Fishing & Hunting (6 | 9.7%), and Finance & Insurance (6 | 9.7%).
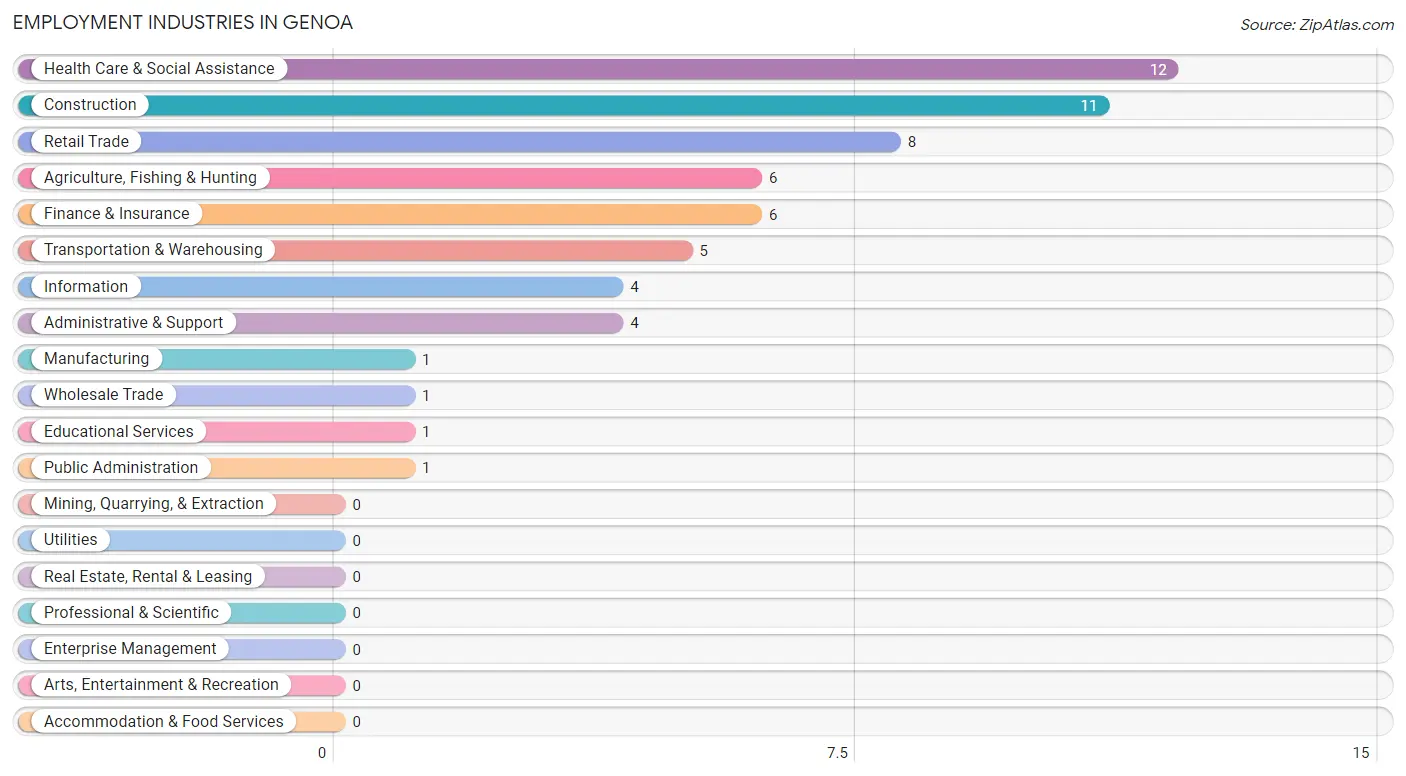
Employment Industries by Sex in Genoa
The Genoa industries that see more men than women are Agriculture, Fishing & Hunting (100.0%), Construction (100.0%), and Manufacturing (100.0%), whereas the industries that tend to have a higher number of women are Retail Trade (100.0%), Information (100.0%), and Educational Services (100.0%).
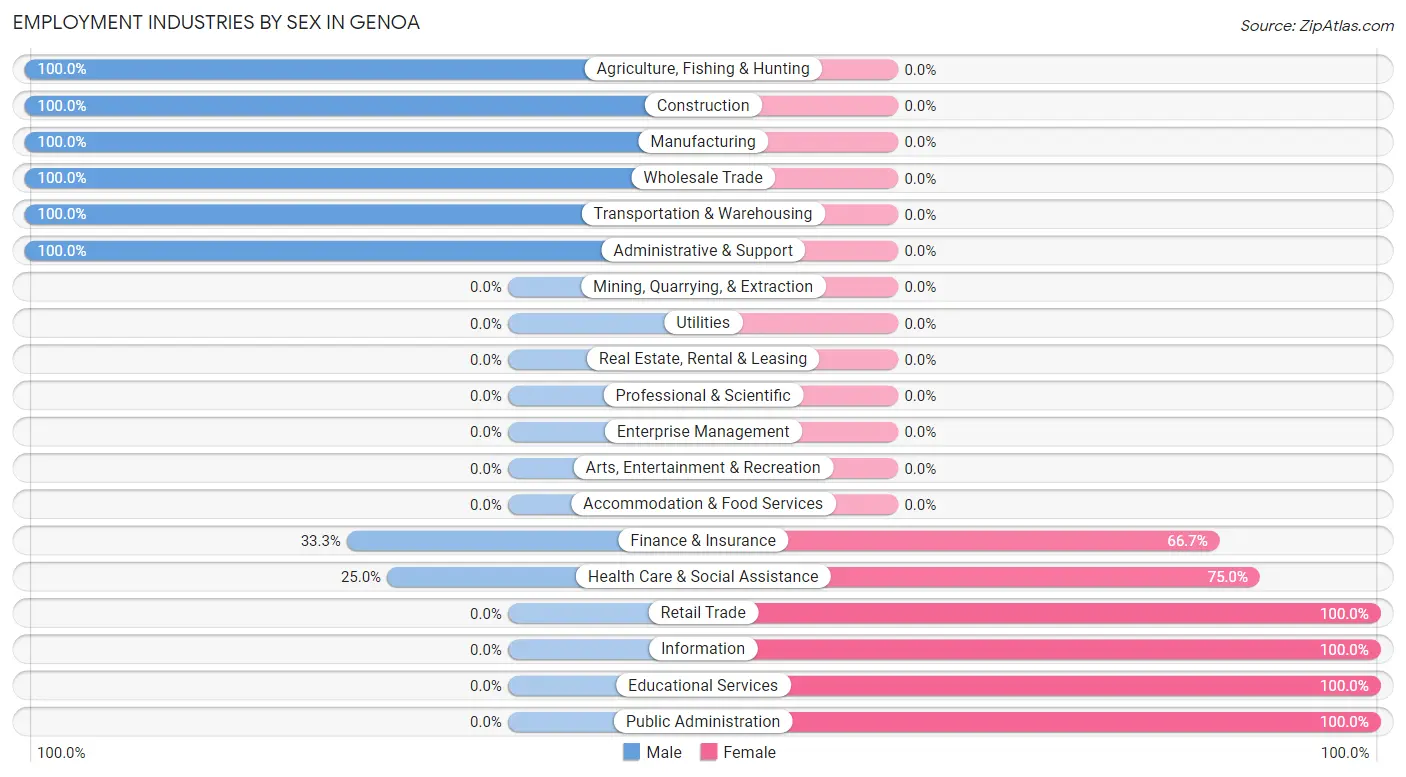
| Industry | Male | Female |
| Agriculture, Fishing & Hunting | 6 (100.0%) | 0 (0.0%) |
| Mining, Quarrying, & Extraction | 0 (0.0%) | 0 (0.0%) |
| Construction | 11 (100.0%) | 0 (0.0%) |
| Manufacturing | 1 (100.0%) | 0 (0.0%) |
| Wholesale Trade | 1 (100.0%) | 0 (0.0%) |
| Retail Trade | 0 (0.0%) | 8 (100.0%) |
| Transportation & Warehousing | 5 (100.0%) | 0 (0.0%) |
| Utilities | 0 (0.0%) | 0 (0.0%) |
| Information | 0 (0.0%) | 4 (100.0%) |
| Finance & Insurance | 2 (33.3%) | 4 (66.7%) |
| Real Estate, Rental & Leasing | 0 (0.0%) | 0 (0.0%) |
| Professional & Scientific | 0 (0.0%) | 0 (0.0%) |
| Enterprise Management | 0 (0.0%) | 0 (0.0%) |
| Administrative & Support | 4 (100.0%) | 0 (0.0%) |
| Educational Services | 0 (0.0%) | 1 (100.0%) |
| Health Care & Social Assistance | 3 (25.0%) | 9 (75.0%) |
| Arts, Entertainment & Recreation | 0 (0.0%) | 0 (0.0%) |
| Accommodation & Food Services | 0 (0.0%) | 0 (0.0%) |
| Public Administration | 0 (0.0%) | 1 (100.0%) |
| Total | 33 (53.2%) | 29 (46.8%) |
Education in Genoa
School Enrollment in Genoa
The most common levels of schooling among the 20 students in Genoa are high school (6 | 30.0%), middle school (4 | 20.0%), and kindergarten (3 | 15.0%).
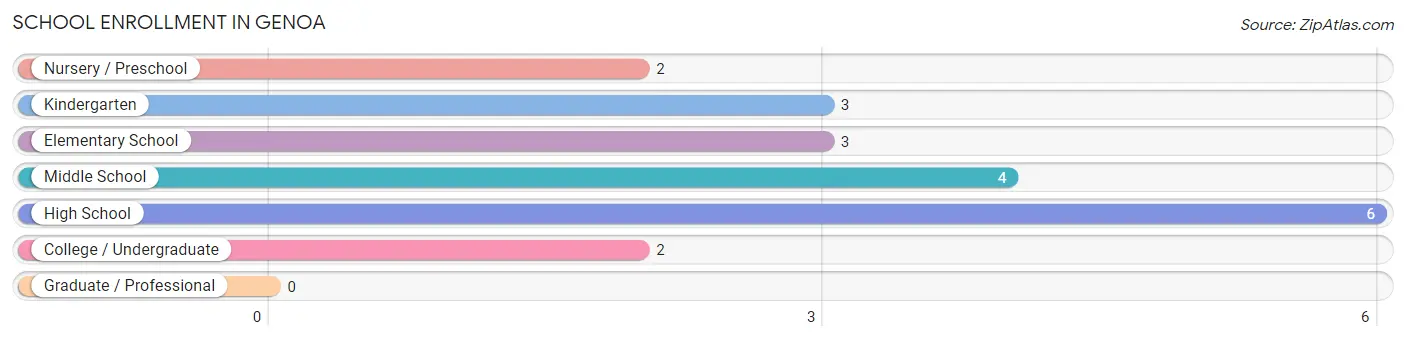
| School Level | # Students | % Students |
| Nursery / Preschool | 2 | 10.0% |
| Kindergarten | 3 | 15.0% |
| Elementary School | 3 | 15.0% |
| Middle School | 4 | 20.0% |
| High School | 6 | 30.0% |
| College / Undergraduate | 2 | 10.0% |
| Graduate / Professional | 0 | 0.0% |
| Total | 20 | 100.0% |
School Enrollment by Age by Funding Source in Genoa
Out of a total of 20 students who are enrolled in schools in Genoa, 2 (10.0%) attend a private institution, while the remaining 18 (90.0%) are enrolled in public schools. The age group of 5 to 9 year old has the highest likelihood of being enrolled in private schools, with 2 (25.0% in the age bracket) enrolled. Conversely, the age group of 10 to 14 year olds has the lowest likelihood of being enrolled in a private school, with 6 (100.0% in the age bracket) attending a public institution.
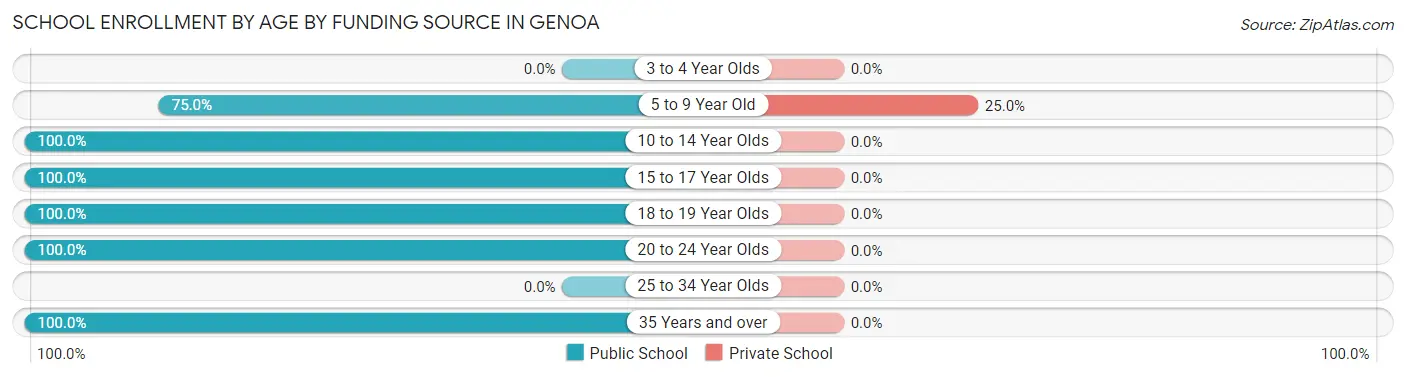
| Age Bracket | Public School | Private School |
| 3 to 4 Year Olds | 0 (0.0%) | 0 (0.0%) |
| 5 to 9 Year Old | 6 (75.0%) | 2 (25.0%) |
| 10 to 14 Year Olds | 6 (100.0%) | 0 (0.0%) |
| 15 to 17 Year Olds | 3 (100.0%) | 0 (0.0%) |
| 18 to 19 Year Olds | 1 (100.0%) | 0 (0.0%) |
| 20 to 24 Year Olds | 1 (100.0%) | 0 (0.0%) |
| 25 to 34 Year Olds | 0 (0.0%) | 0 (0.0%) |
| 35 Years and over | 1 (100.0%) | 0 (0.0%) |
| Total | 18 (90.0%) | 2 (10.0%) |
Educational Attainment by Field of Study in Genoa
Visual & performing arts (7 | 41.2%), business (4 | 23.5%), engineering (2 | 11.8%), arts & humanities (2 | 11.8%), and bio, nature & agricultural (1 | 5.9%) are the most common fields of study among 17 individuals in Genoa who have obtained a bachelor's degree or higher.
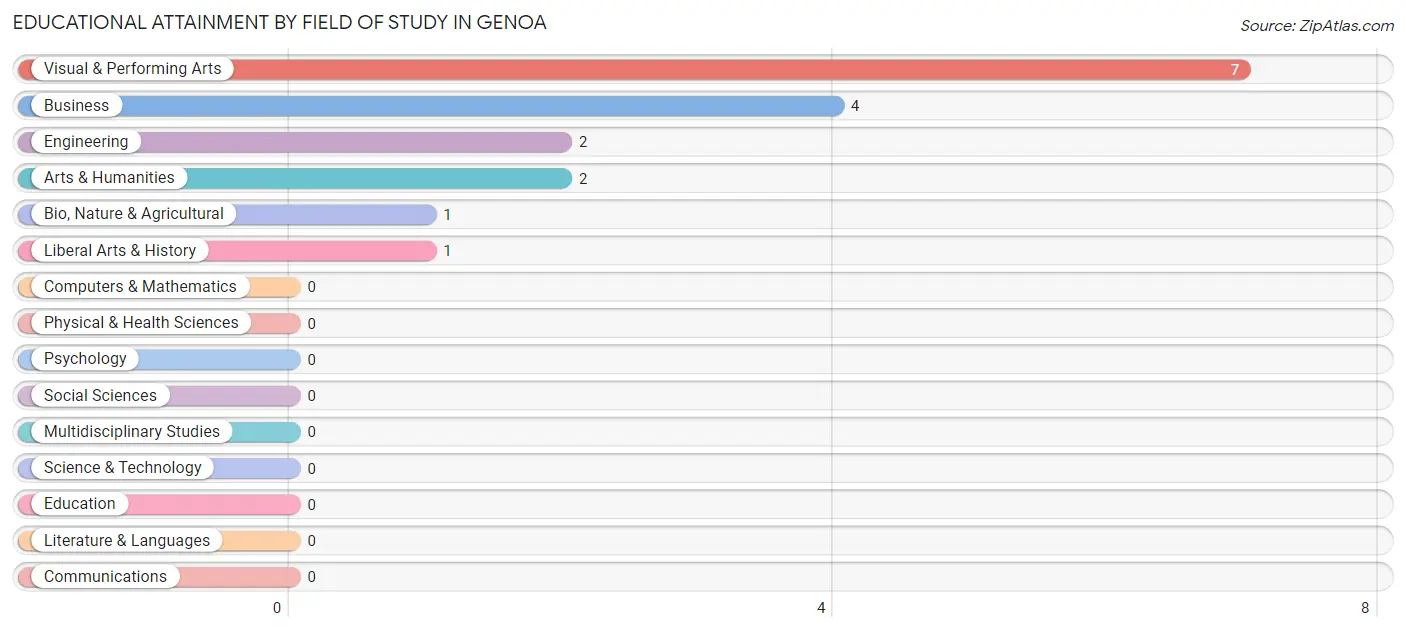
| Field of Study | # Graduates | % Graduates |
| Computers & Mathematics | 0 | 0.0% |
| Bio, Nature & Agricultural | 1 | 5.9% |
| Physical & Health Sciences | 0 | 0.0% |
| Psychology | 0 | 0.0% |
| Social Sciences | 0 | 0.0% |
| Engineering | 2 | 11.8% |
| Multidisciplinary Studies | 0 | 0.0% |
| Science & Technology | 0 | 0.0% |
| Business | 4 | 23.5% |
| Education | 0 | 0.0% |
| Literature & Languages | 0 | 0.0% |
| Liberal Arts & History | 1 | 5.9% |
| Visual & Performing Arts | 7 | 41.2% |
| Communications | 0 | 0.0% |
| Arts & Humanities | 2 | 11.8% |
| Total | 17 | 100.0% |
Transportation & Commute in Genoa
Vehicle Availability by Sex in Genoa
The most prevalent vehicle ownership categories in Genoa are males with 3 vehicles (18, accounting for 54.5%) and females with 3 vehicles (12, making up 62.1%).
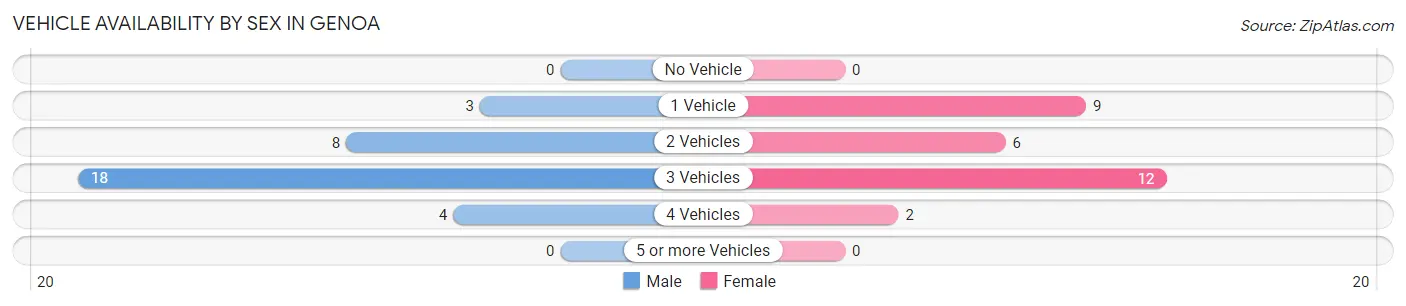
| Vehicles Available | Male | Female |
| No Vehicle | 0 (0.0%) | 0 (0.0%) |
| 1 Vehicle | 3 (9.1%) | 9 (31.0%) |
| 2 Vehicles | 8 (24.2%) | 6 (20.7%) |
| 3 Vehicles | 18 (54.5%) | 12 (41.4%) |
| 4 Vehicles | 4 (12.1%) | 2 (6.9%) |
| 5 or more Vehicles | 0 (0.0%) | 0 (0.0%) |
| Total | 33 (100.0%) | 29 (100.0%) |
Commute Time in Genoa
The most frequently occuring commute durations in Genoa are 15 to 19 minutes (15 commuters, 25.4%), 20 to 24 minutes (12 commuters, 20.3%), and 10 to 14 minutes (9 commuters, 15.2%).
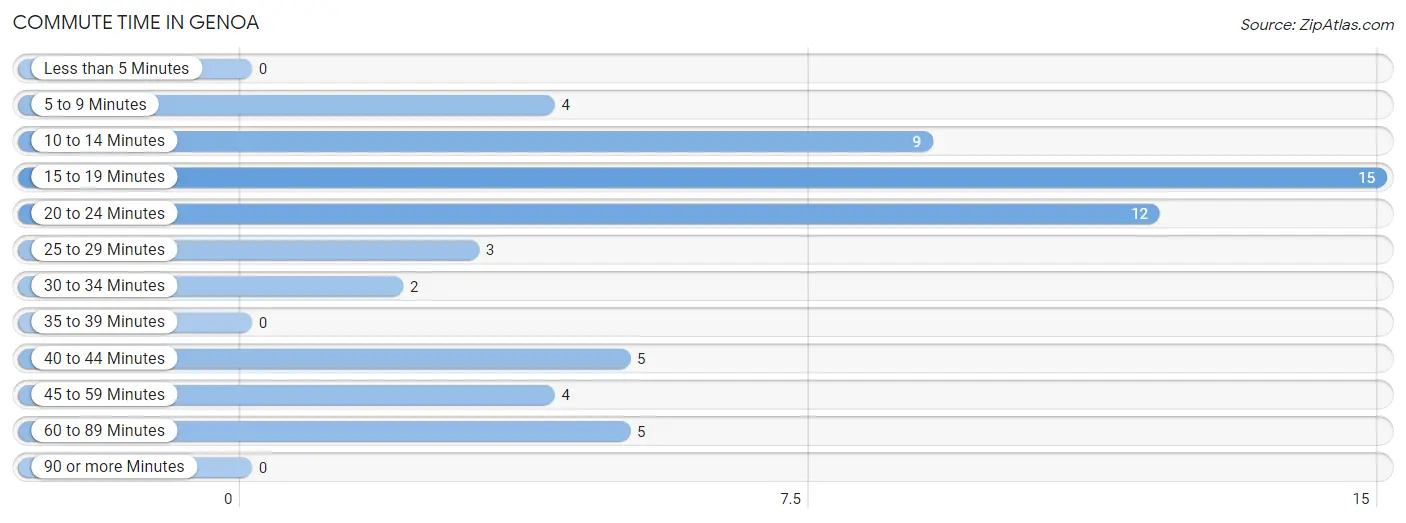
| Commute Time | # Commuters | % Commuters |
| Less than 5 Minutes | 0 | 0.0% |
| 5 to 9 Minutes | 4 | 6.8% |
| 10 to 14 Minutes | 9 | 15.2% |
| 15 to 19 Minutes | 15 | 25.4% |
| 20 to 24 Minutes | 12 | 20.3% |
| 25 to 29 Minutes | 3 | 5.1% |
| 30 to 34 Minutes | 2 | 3.4% |
| 35 to 39 Minutes | 0 | 0.0% |
| 40 to 44 Minutes | 5 | 8.5% |
| 45 to 59 Minutes | 4 | 6.8% |
| 60 to 89 Minutes | 5 | 8.5% |
| 90 or more Minutes | 0 | 0.0% |
Commute Time by Sex in Genoa
The most common commute times in Genoa are 10 to 14 minutes (6 commuters, 18.2%) for males and 20 to 24 minutes (10 commuters, 38.5%) for females.
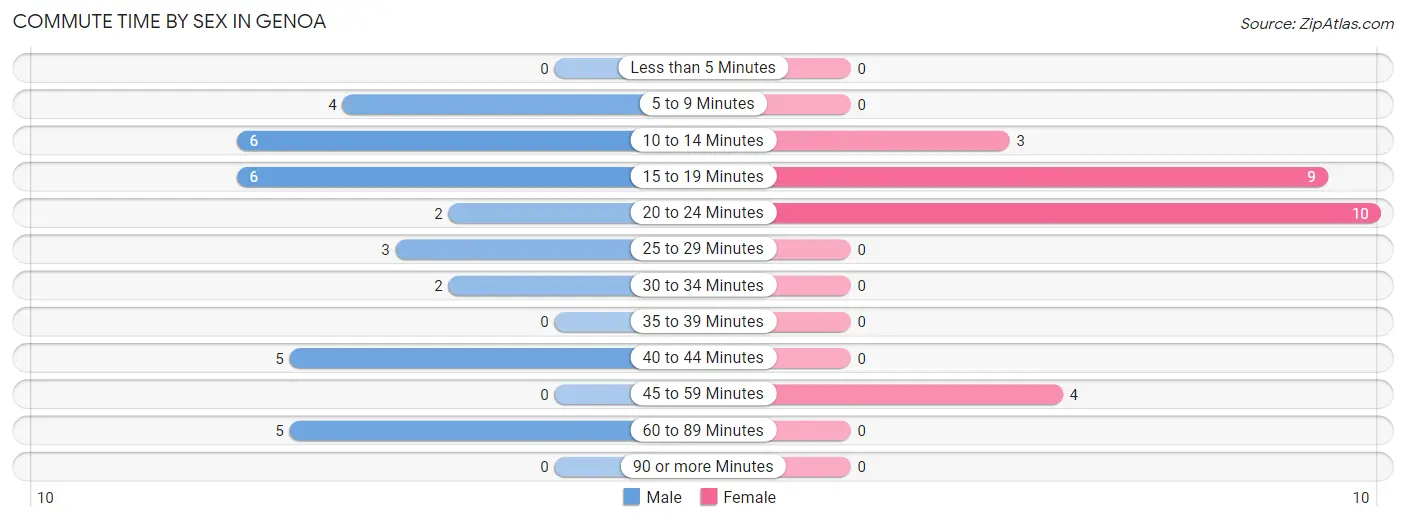
| Commute Time | Male | Female |
| Less than 5 Minutes | 0 (0.0%) | 0 (0.0%) |
| 5 to 9 Minutes | 4 (12.1%) | 0 (0.0%) |
| 10 to 14 Minutes | 6 (18.2%) | 3 (11.5%) |
| 15 to 19 Minutes | 6 (18.2%) | 9 (34.6%) |
| 20 to 24 Minutes | 2 (6.1%) | 10 (38.5%) |
| 25 to 29 Minutes | 3 (9.1%) | 0 (0.0%) |
| 30 to 34 Minutes | 2 (6.1%) | 0 (0.0%) |
| 35 to 39 Minutes | 0 (0.0%) | 0 (0.0%) |
| 40 to 44 Minutes | 5 (15.1%) | 0 (0.0%) |
| 45 to 59 Minutes | 0 (0.0%) | 4 (15.4%) |
| 60 to 89 Minutes | 5 (15.1%) | 0 (0.0%) |
| 90 or more Minutes | 0 (0.0%) | 0 (0.0%) |
Time of Departure to Work by Sex in Genoa
The most frequent times of departure to work in Genoa are 7:30 AM to 7:59 AM (10, 30.3%) for males and 7:30 AM to 7:59 AM (15, 57.7%) for females.
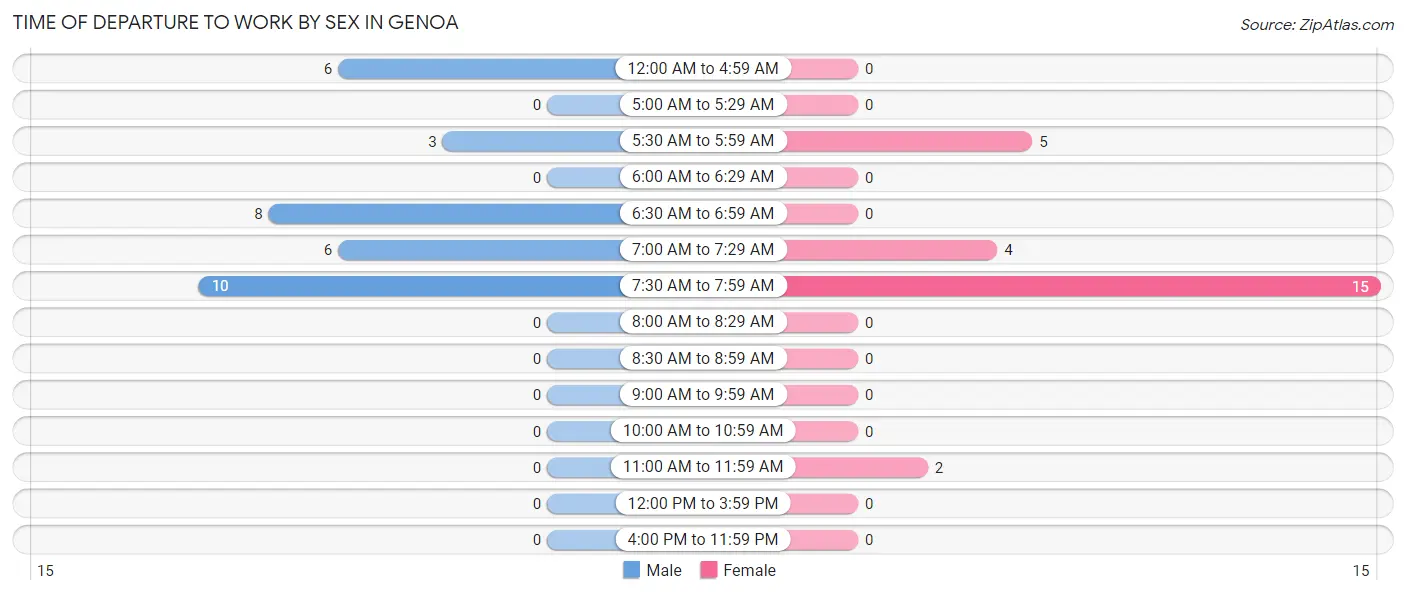
| Time of Departure | Male | Female |
| 12:00 AM to 4:59 AM | 6 (18.2%) | 0 (0.0%) |
| 5:00 AM to 5:29 AM | 0 (0.0%) | 0 (0.0%) |
| 5:30 AM to 5:59 AM | 3 (9.1%) | 5 (19.2%) |
| 6:00 AM to 6:29 AM | 0 (0.0%) | 0 (0.0%) |
| 6:30 AM to 6:59 AM | 8 (24.2%) | 0 (0.0%) |
| 7:00 AM to 7:29 AM | 6 (18.2%) | 4 (15.4%) |
| 7:30 AM to 7:59 AM | 10 (30.3%) | 15 (57.7%) |
| 8:00 AM to 8:29 AM | 0 (0.0%) | 0 (0.0%) |
| 8:30 AM to 8:59 AM | 0 (0.0%) | 0 (0.0%) |
| 9:00 AM to 9:59 AM | 0 (0.0%) | 0 (0.0%) |
| 10:00 AM to 10:59 AM | 0 (0.0%) | 0 (0.0%) |
| 11:00 AM to 11:59 AM | 0 (0.0%) | 2 (7.7%) |
| 12:00 PM to 3:59 PM | 0 (0.0%) | 0 (0.0%) |
| 4:00 PM to 11:59 PM | 0 (0.0%) | 0 (0.0%) |
| Total | 33 (100.0%) | 26 (100.0%) |
Housing Occupancy in Genoa
Occupancy by Ownership in Genoa
Of the total 83 dwellings in Genoa, owner-occupied units account for 48 (57.8%), while renter-occupied units make up 35 (42.2%).
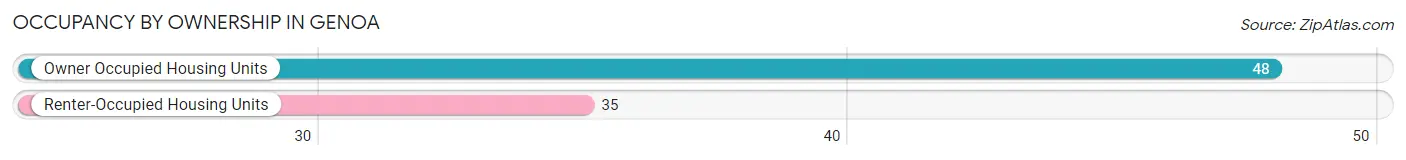
| Occupancy | # Housing Units | % Housing Units |
| Owner Occupied Housing Units | 48 | 57.8% |
| Renter-Occupied Housing Units | 35 | 42.2% |
| Total Occupied Housing Units | 83 | 100.0% |
Occupancy by Household Size in Genoa
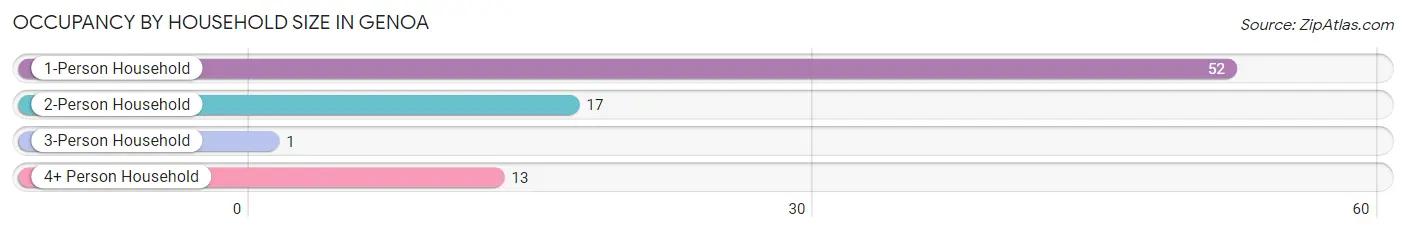
| Household Size | # Housing Units | % Housing Units |
| 1-Person Household | 52 | 62.6% |
| 2-Person Household | 17 | 20.5% |
| 3-Person Household | 1 | 1.2% |
| 4+ Person Household | 13 | 15.7% |
| Total Housing Units | 83 | 100.0% |
Occupancy by Ownership by Household Size in Genoa
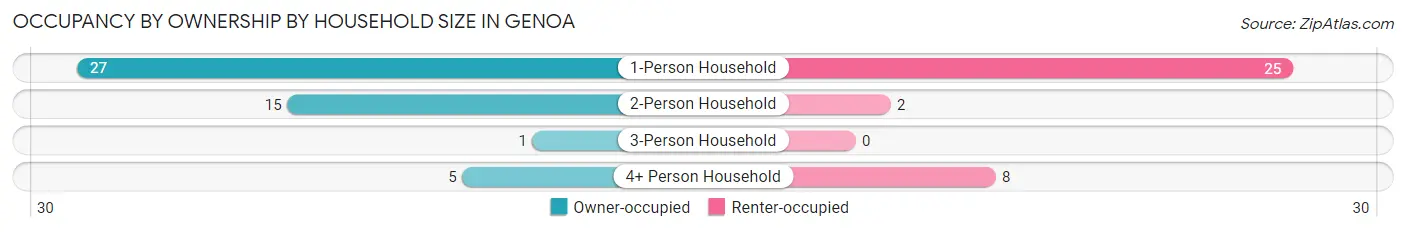
| Household Size | Owner-occupied | Renter-occupied |
| 1-Person Household | 27 (51.9%) | 25 (48.1%) |
| 2-Person Household | 15 (88.2%) | 2 (11.8%) |
| 3-Person Household | 1 (100.0%) | 0 (0.0%) |
| 4+ Person Household | 5 (38.5%) | 8 (61.5%) |
| Total Housing Units | 48 (57.8%) | 35 (42.2%) |
Occupancy by Educational Attainment in Genoa
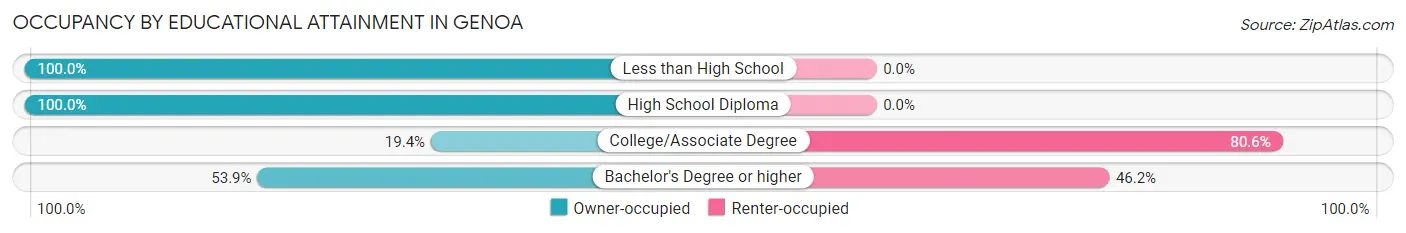
| Household Size | Owner-occupied | Renter-occupied |
| Less than High School | 4 (100.0%) | 0 (0.0%) |
| High School Diploma | 30 (100.0%) | 0 (0.0%) |
| College/Associate Degree | 7 (19.4%) | 29 (80.6%) |
| Bachelor's Degree or higher | 7 (53.8%) | 6 (46.2%) |
Occupancy by Age of Householder in Genoa
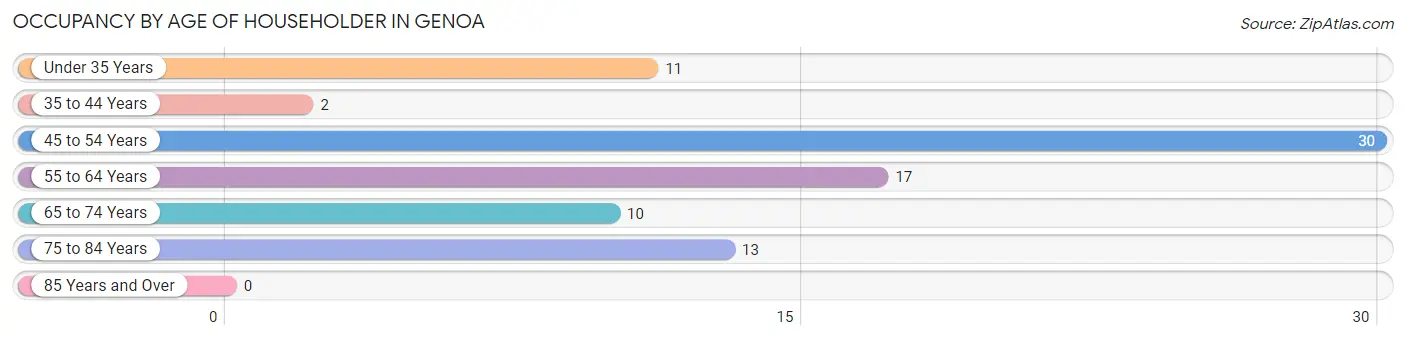
| Age Bracket | # Households | % Households |
| Under 35 Years | 11 | 13.3% |
| 35 to 44 Years | 2 | 2.4% |
| 45 to 54 Years | 30 | 36.1% |
| 55 to 64 Years | 17 | 20.5% |
| 65 to 74 Years | 10 | 12.0% |
| 75 to 84 Years | 13 | 15.7% |
| 85 Years and Over | 0 | 0.0% |
| Total | 83 | 100.0% |
Housing Finances in Genoa
Median Income by Occupancy in Genoa
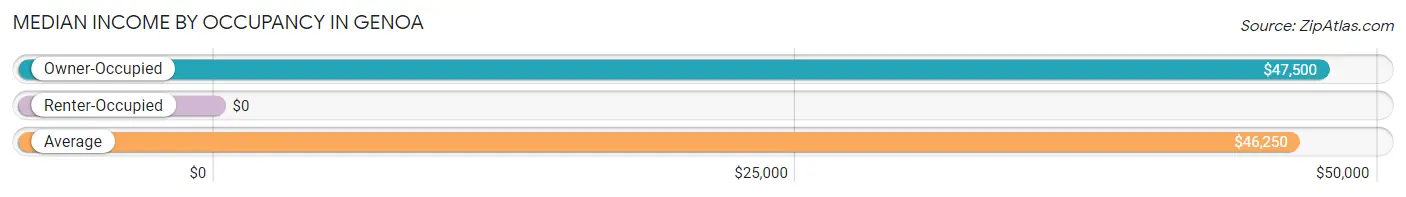
| Occupancy Type | # Households | Median Income |
| Owner-Occupied | 48 (57.8%) | $47,500 |
| Renter-Occupied | 35 (42.2%) | $0 |
| Average | 83 (100.0%) | $46,250 |
Occupancy by Householder Income Bracket in Genoa
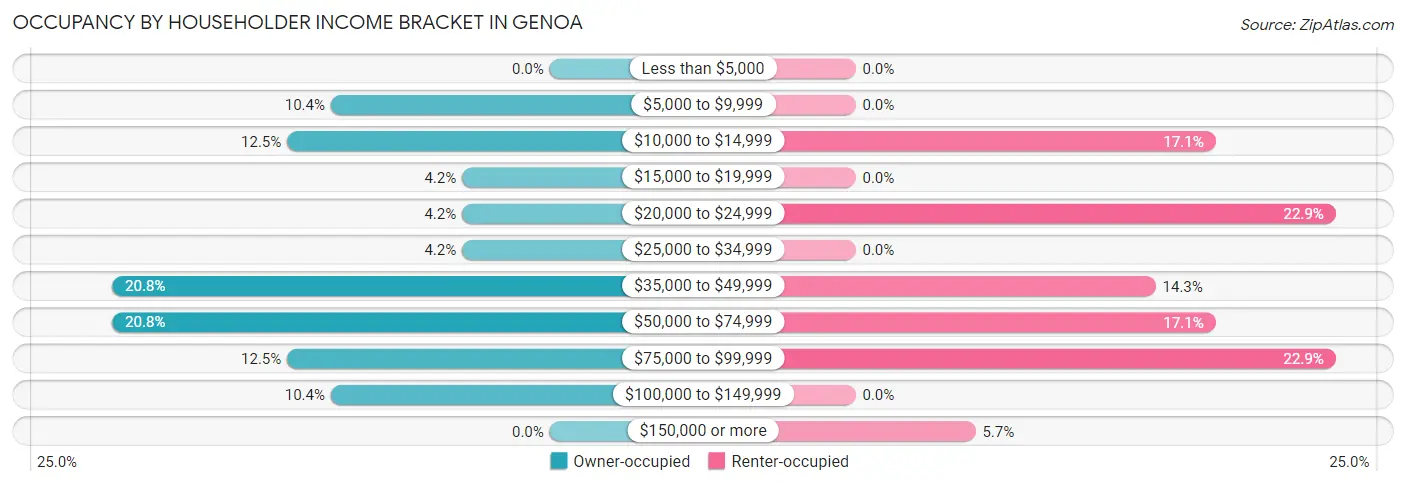
| Income Bracket | Owner-occupied | Renter-occupied |
| Less than $5,000 | 0 (0.0%) | 0 (0.0%) |
| $5,000 to $9,999 | 5 (10.4%) | 0 (0.0%) |
| $10,000 to $14,999 | 6 (12.5%) | 6 (17.1%) |
| $15,000 to $19,999 | 2 (4.2%) | 0 (0.0%) |
| $20,000 to $24,999 | 2 (4.2%) | 8 (22.9%) |
| $25,000 to $34,999 | 2 (4.2%) | 0 (0.0%) |
| $35,000 to $49,999 | 10 (20.8%) | 5 (14.3%) |
| $50,000 to $74,999 | 10 (20.8%) | 6 (17.1%) |
| $75,000 to $99,999 | 6 (12.5%) | 8 (22.9%) |
| $100,000 to $149,999 | 5 (10.4%) | 0 (0.0%) |
| $150,000 or more | 0 (0.0%) | 2 (5.7%) |
| Total | 48 (100.0%) | 35 (100.0%) |
Monthly Housing Cost Tiers in Genoa
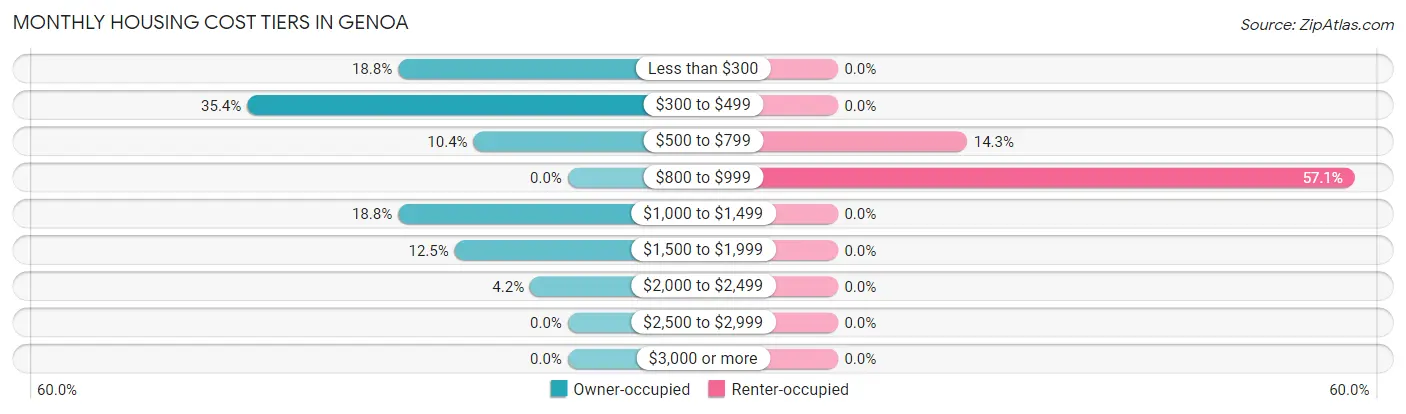
| Monthly Cost | Owner-occupied | Renter-occupied |
| Less than $300 | 9 (18.8%) | 0 (0.0%) |
| $300 to $499 | 17 (35.4%) | 0 (0.0%) |
| $500 to $799 | 5 (10.4%) | 5 (14.3%) |
| $800 to $999 | 0 (0.0%) | 20 (57.1%) |
| $1,000 to $1,499 | 9 (18.8%) | 0 (0.0%) |
| $1,500 to $1,999 | 6 (12.5%) | 0 (0.0%) |
| $2,000 to $2,499 | 2 (4.2%) | 0 (0.0%) |
| $2,500 to $2,999 | 0 (0.0%) | 0 (0.0%) |
| $3,000 or more | 0 (0.0%) | 0 (0.0%) |
| Total | 48 (100.0%) | 35 (100.0%) |
Physical Housing Characteristics in Genoa
Housing Structures in Genoa
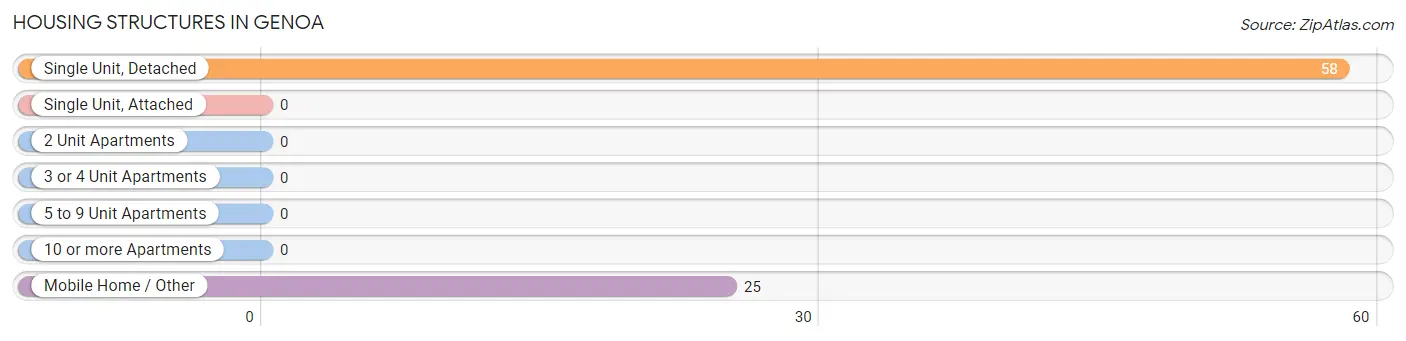
| Structure Type | # Housing Units | % Housing Units |
| Single Unit, Detached | 58 | 69.9% |
| Single Unit, Attached | 0 | 0.0% |
| 2 Unit Apartments | 0 | 0.0% |
| 3 or 4 Unit Apartments | 0 | 0.0% |
| 5 to 9 Unit Apartments | 0 | 0.0% |
| 10 or more Apartments | 0 | 0.0% |
| Mobile Home / Other | 25 | 30.1% |
| Total | 83 | 100.0% |
Housing Structures by Occupancy in Genoa
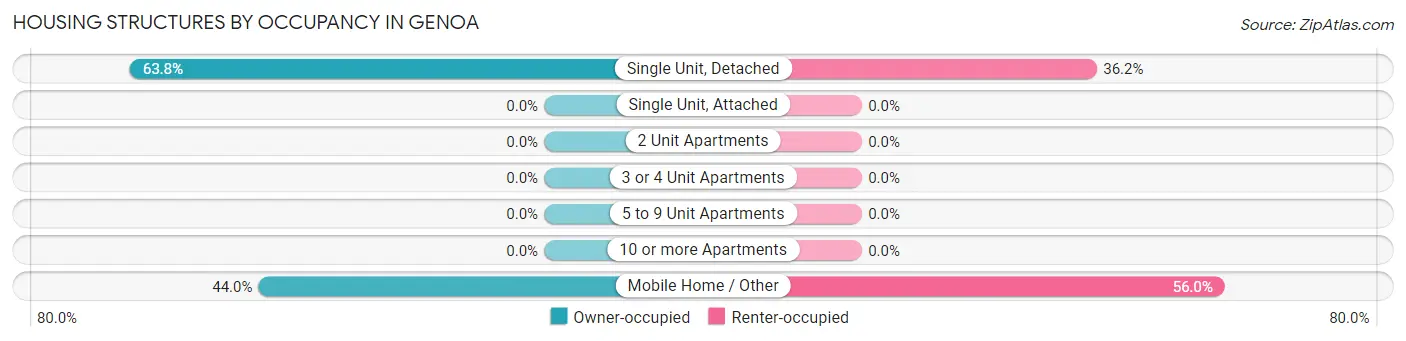
| Structure Type | Owner-occupied | Renter-occupied |
| Single Unit, Detached | 37 (63.8%) | 21 (36.2%) |
| Single Unit, Attached | 0 (0.0%) | 0 (0.0%) |
| 2 Unit Apartments | 0 (0.0%) | 0 (0.0%) |
| 3 or 4 Unit Apartments | 0 (0.0%) | 0 (0.0%) |
| 5 to 9 Unit Apartments | 0 (0.0%) | 0 (0.0%) |
| 10 or more Apartments | 0 (0.0%) | 0 (0.0%) |
| Mobile Home / Other | 11 (44.0%) | 14 (56.0%) |
| Total | 48 (57.8%) | 35 (42.2%) |
Housing Structures by Number of Rooms in Genoa
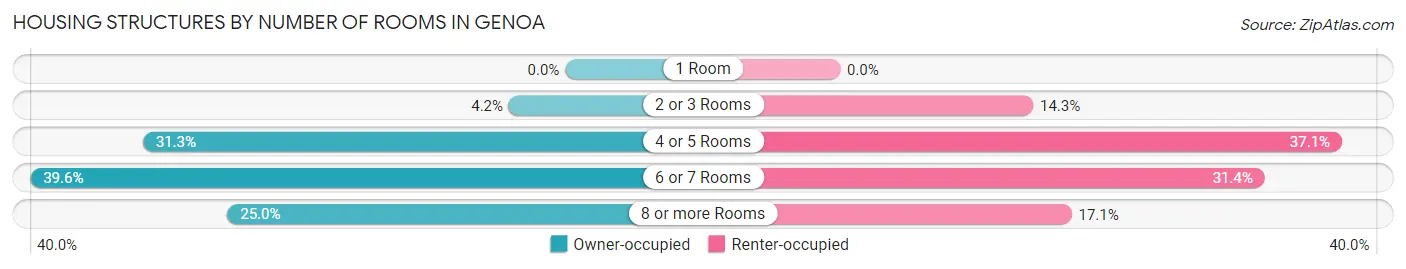
| Number of Rooms | Owner-occupied | Renter-occupied |
| 1 Room | 0 (0.0%) | 0 (0.0%) |
| 2 or 3 Rooms | 2 (4.2%) | 5 (14.3%) |
| 4 or 5 Rooms | 15 (31.2%) | 13 (37.1%) |
| 6 or 7 Rooms | 19 (39.6%) | 11 (31.4%) |
| 8 or more Rooms | 12 (25.0%) | 6 (17.1%) |
| Total | 48 (100.0%) | 35 (100.0%) |
Housing Structure by Heating Type in Genoa
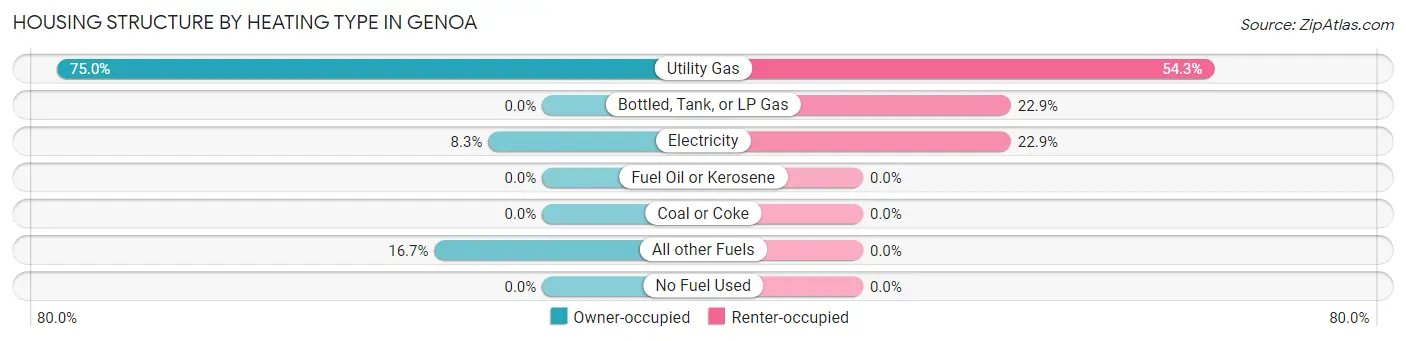
| Heating Type | Owner-occupied | Renter-occupied |
| Utility Gas | 36 (75.0%) | 19 (54.3%) |
| Bottled, Tank, or LP Gas | 0 (0.0%) | 8 (22.9%) |
| Electricity | 4 (8.3%) | 8 (22.9%) |
| Fuel Oil or Kerosene | 0 (0.0%) | 0 (0.0%) |
| Coal or Coke | 0 (0.0%) | 0 (0.0%) |
| All other Fuels | 8 (16.7%) | 0 (0.0%) |
| No Fuel Used | 0 (0.0%) | 0 (0.0%) |
| Total | 48 (100.0%) | 35 (100.0%) |
Household Vehicle Usage in Genoa
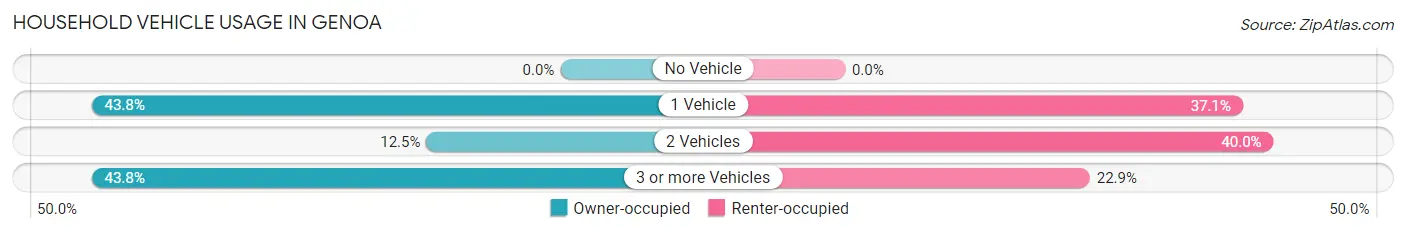
| Vehicles per Household | Owner-occupied | Renter-occupied |
| No Vehicle | 0 (0.0%) | 0 (0.0%) |
| 1 Vehicle | 21 (43.8%) | 13 (37.1%) |
| 2 Vehicles | 6 (12.5%) | 14 (40.0%) |
| 3 or more Vehicles | 21 (43.8%) | 8 (22.9%) |
| Total | 48 (100.0%) | 35 (100.0%) |
Real Estate & Mortgages in Genoa
Real Estate and Mortgage Overview in Genoa
| Characteristic | Without Mortgage | With Mortgage |
| Housing Units | 31 | 17 |
| Median Property Value | $56,300 | $195,800 |
| Median Household Income | - | - |
| Monthly Housing Costs | $333 | $0 |
| Real Estate Taxes | $310 | $0 |
Property Value by Mortgage Status in Genoa
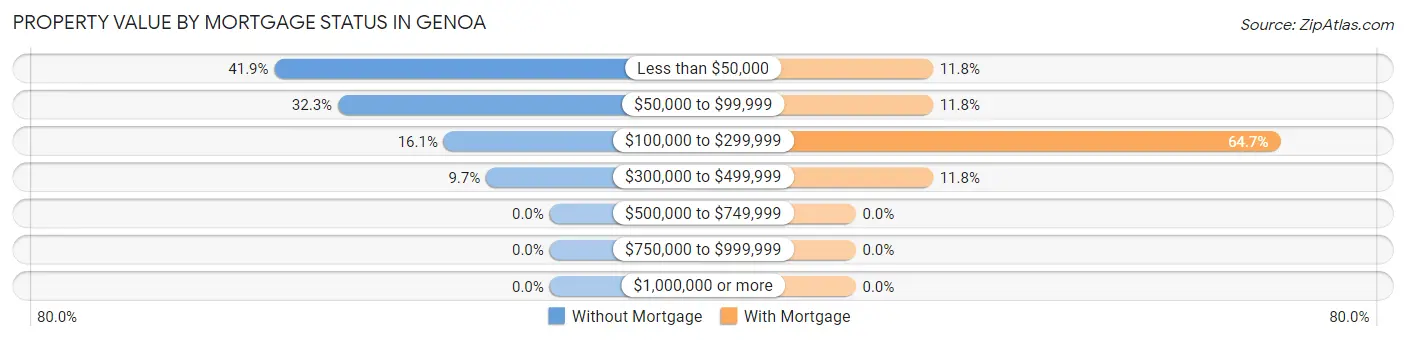
| Property Value | Without Mortgage | With Mortgage |
| Less than $50,000 | 13 (41.9%) | 2 (11.8%) |
| $50,000 to $99,999 | 10 (32.3%) | 2 (11.8%) |
| $100,000 to $299,999 | 5 (16.1%) | 11 (64.7%) |
| $300,000 to $499,999 | 3 (9.7%) | 2 (11.8%) |
| $500,000 to $749,999 | 0 (0.0%) | 0 (0.0%) |
| $750,000 to $999,999 | 0 (0.0%) | 0 (0.0%) |
| $1,000,000 or more | 0 (0.0%) | 0 (0.0%) |
| Total | 31 (100.0%) | 17 (100.0%) |
Household Income by Mortgage Status in Genoa
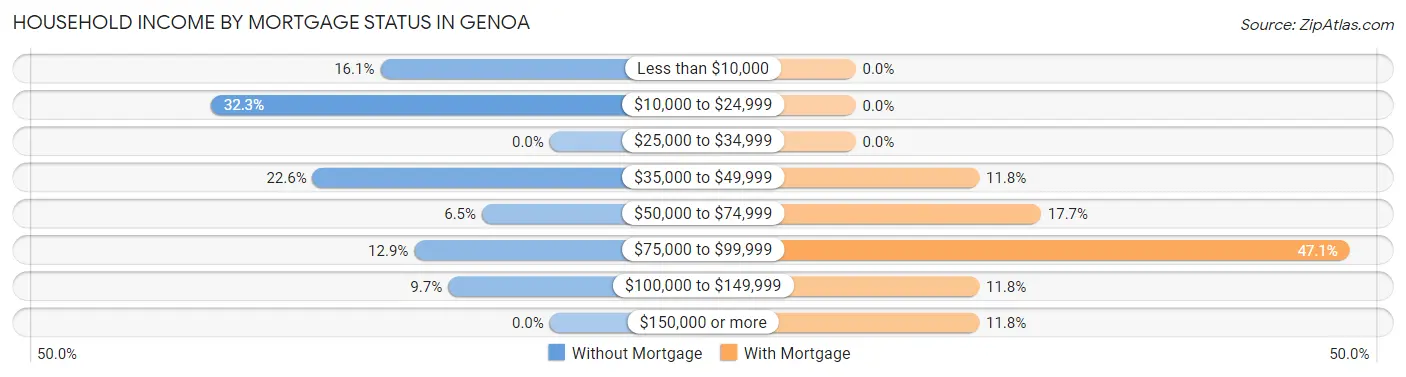
| Household Income | Without Mortgage | With Mortgage |
| Less than $10,000 | 5 (16.1%) | 0 (0.0%) |
| $10,000 to $24,999 | 10 (32.3%) | 0 (0.0%) |
| $25,000 to $34,999 | 0 (0.0%) | 0 (0.0%) |
| $35,000 to $49,999 | 7 (22.6%) | 2 (11.8%) |
| $50,000 to $74,999 | 2 (6.5%) | 3 (17.6%) |
| $75,000 to $99,999 | 4 (12.9%) | 8 (47.1%) |
| $100,000 to $149,999 | 3 (9.7%) | 2 (11.8%) |
| $150,000 or more | 0 (0.0%) | 2 (11.8%) |
| Total | 31 (100.0%) | 17 (100.0%) |
Property Value to Household Income Ratio in Genoa
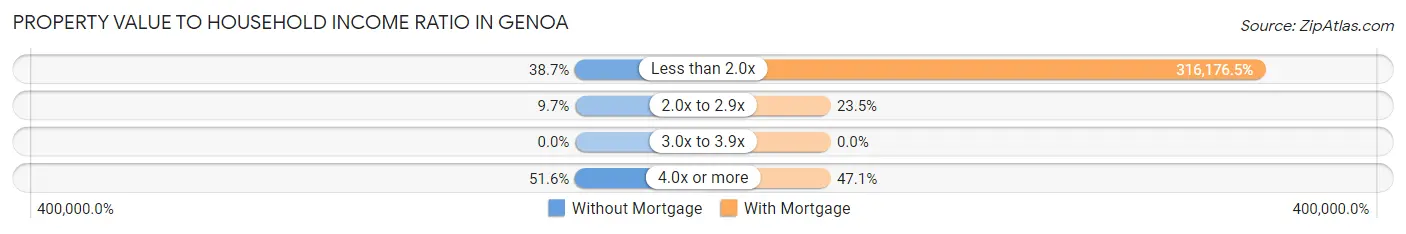
| Value-to-Income Ratio | Without Mortgage | With Mortgage |
| Less than 2.0x | 12 (38.7%) | 53,750 (316,176.5%) |
| 2.0x to 2.9x | 3 (9.7%) | 4 (23.5%) |
| 3.0x to 3.9x | 0 (0.0%) | 0 (0.0%) |
| 4.0x or more | 16 (51.6%) | 8 (47.1%) |
| Total | 31 (100.0%) | 17 (100.0%) |
Real Estate Taxes by Mortgage Status in Genoa
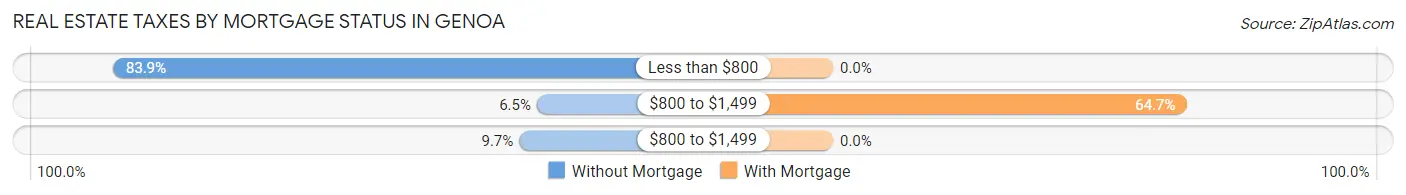
| Property Taxes | Without Mortgage | With Mortgage |
| Less than $800 | 26 (83.9%) | 0 (0.0%) |
| $800 to $1,499 | 2 (6.5%) | 11 (64.7%) |
| $800 to $1,499 | 3 (9.7%) | 0 (0.0%) |
| Total | 31 (100.0%) | 17 (100.0%) |
Health & Disability in Genoa
Health Insurance Coverage by Age in Genoa
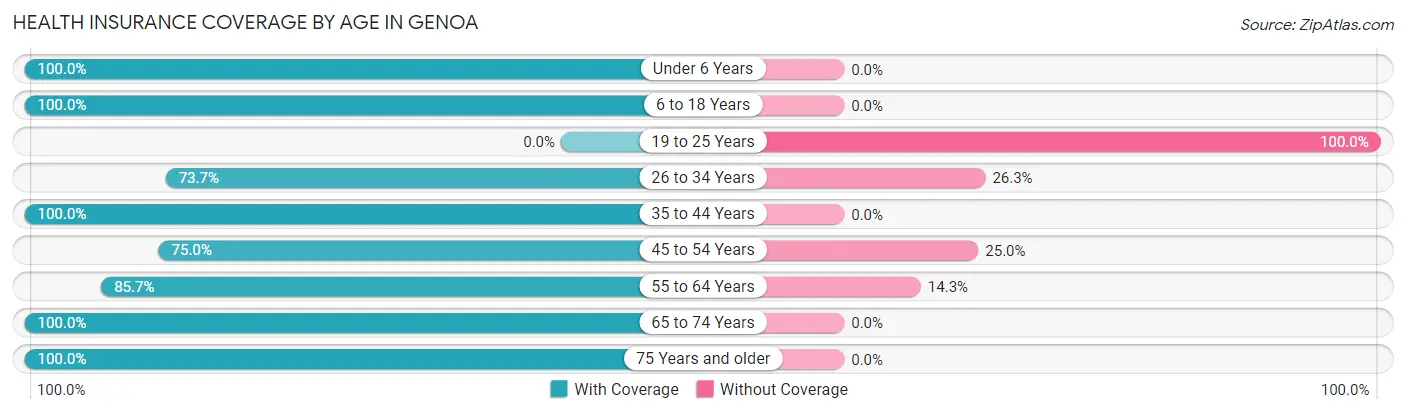
| Age Bracket | With Coverage | Without Coverage |
| Under 6 Years | 8 (100.0%) | 0 (0.0%) |
| 6 to 18 Years | 13 (100.0%) | 0 (0.0%) |
| 19 to 25 Years | 0 (0.0%) | 1 (100.0%) |
| 26 to 34 Years | 14 (73.7%) | 5 (26.3%) |
| 35 to 44 Years | 3 (100.0%) | 0 (0.0%) |
| 45 to 54 Years | 24 (75.0%) | 8 (25.0%) |
| 55 to 64 Years | 18 (85.7%) | 3 (14.3%) |
| 65 to 74 Years | 15 (100.0%) | 0 (0.0%) |
| 75 Years and older | 14 (100.0%) | 0 (0.0%) |
| Total | 109 (86.5%) | 17 (13.5%) |
Health Insurance Coverage by Citizenship Status in Genoa
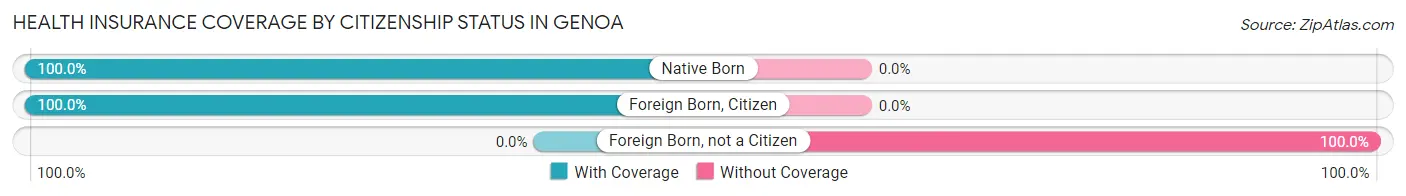
| Citizenship Status | With Coverage | Without Coverage |
| Native Born | 8 (100.0%) | 0 (0.0%) |
| Foreign Born, Citizen | 13 (100.0%) | 0 (0.0%) |
| Foreign Born, not a Citizen | 0 (0.0%) | 1 (100.0%) |
Health Insurance Coverage by Household Income in Genoa
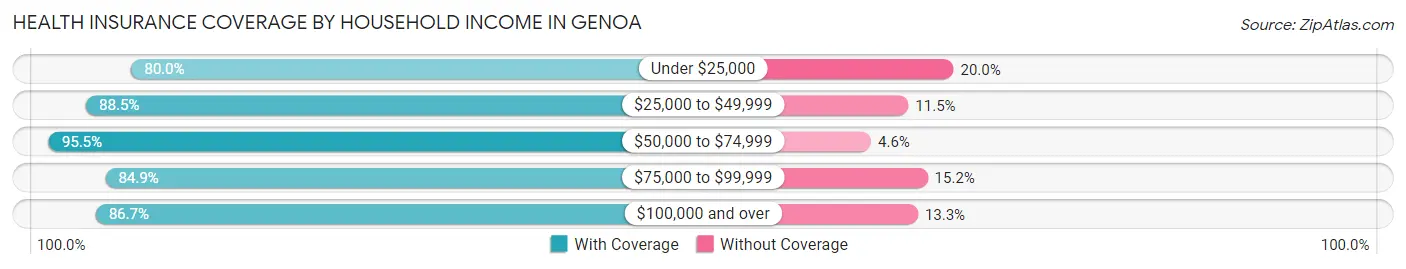
| Household Income | With Coverage | Without Coverage |
| Under $25,000 | 24 (80.0%) | 6 (20.0%) |
| $25,000 to $49,999 | 23 (88.5%) | 3 (11.5%) |
| $50,000 to $74,999 | 21 (95.5%) | 1 (4.5%) |
| $75,000 to $99,999 | 28 (84.9%) | 5 (15.1%) |
| $100,000 and over | 13 (86.7%) | 2 (13.3%) |
Public vs Private Health Insurance Coverage by Age in Genoa
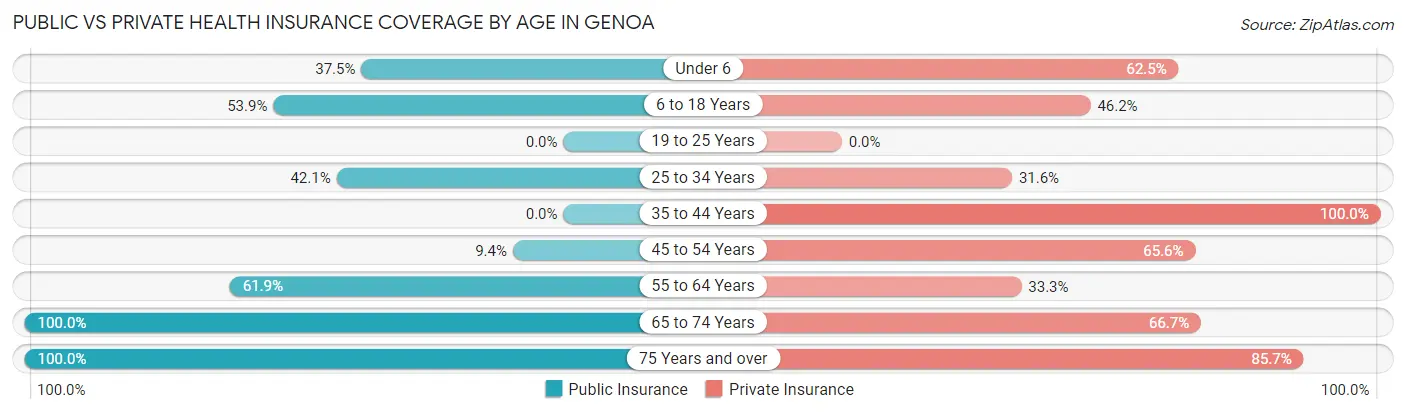
| Age Bracket | Public Insurance | Private Insurance |
| Under 6 | 3 (37.5%) | 5 (62.5%) |
| 6 to 18 Years | 7 (53.8%) | 6 (46.2%) |
| 19 to 25 Years | 0 (0.0%) | 0 (0.0%) |
| 25 to 34 Years | 8 (42.1%) | 6 (31.6%) |
| 35 to 44 Years | 0 (0.0%) | 3 (100.0%) |
| 45 to 54 Years | 3 (9.4%) | 21 (65.6%) |
| 55 to 64 Years | 13 (61.9%) | 7 (33.3%) |
| 65 to 74 Years | 15 (100.0%) | 10 (66.7%) |
| 75 Years and over | 14 (100.0%) | 12 (85.7%) |
| Total | 63 (50.0%) | 70 (55.6%) |
Disability Status by Sex by Age in Genoa
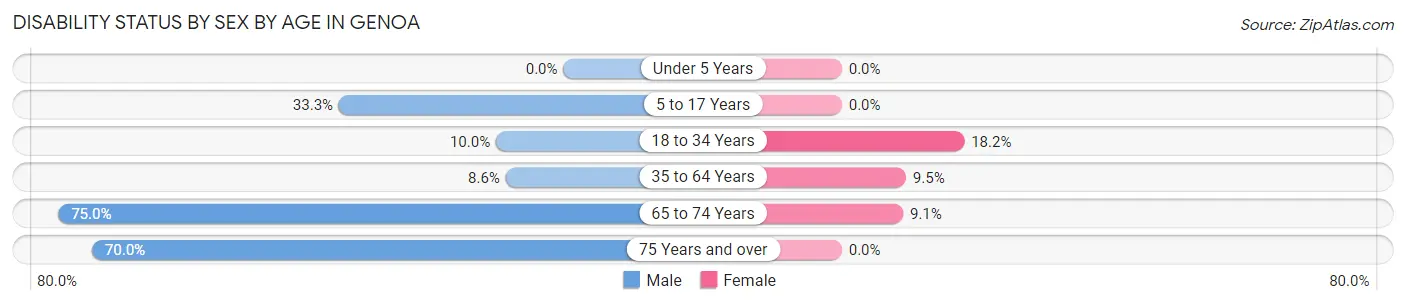
| Age Bracket | Male | Female |
| Under 5 Years | 0 (0.0%) | 0 (0.0%) |
| 5 to 17 Years | 3 (33.3%) | 0 (0.0%) |
| 18 to 34 Years | 1 (10.0%) | 2 (18.2%) |
| 35 to 64 Years | 3 (8.6%) | 2 (9.5%) |
| 65 to 74 Years | 3 (75.0%) | 1 (9.1%) |
| 75 Years and over | 7 (70.0%) | 0 (0.0%) |
Disability Class by Sex by Age in Genoa
Disability Class: Hearing Difficulty
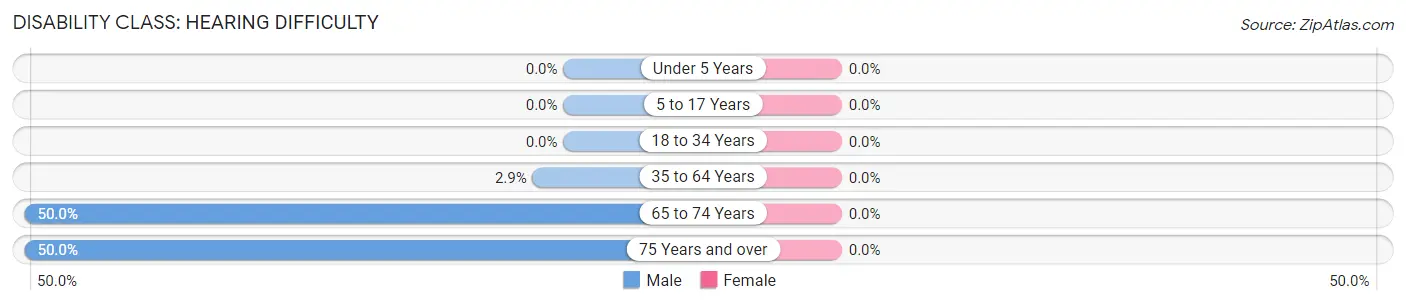
| Age Bracket | Male | Female |
| Under 5 Years | 0 (0.0%) | 0 (0.0%) |
| 5 to 17 Years | 0 (0.0%) | 0 (0.0%) |
| 18 to 34 Years | 0 (0.0%) | 0 (0.0%) |
| 35 to 64 Years | 1 (2.9%) | 0 (0.0%) |
| 65 to 74 Years | 2 (50.0%) | 0 (0.0%) |
| 75 Years and over | 5 (50.0%) | 0 (0.0%) |
Disability Class: Vision Difficulty
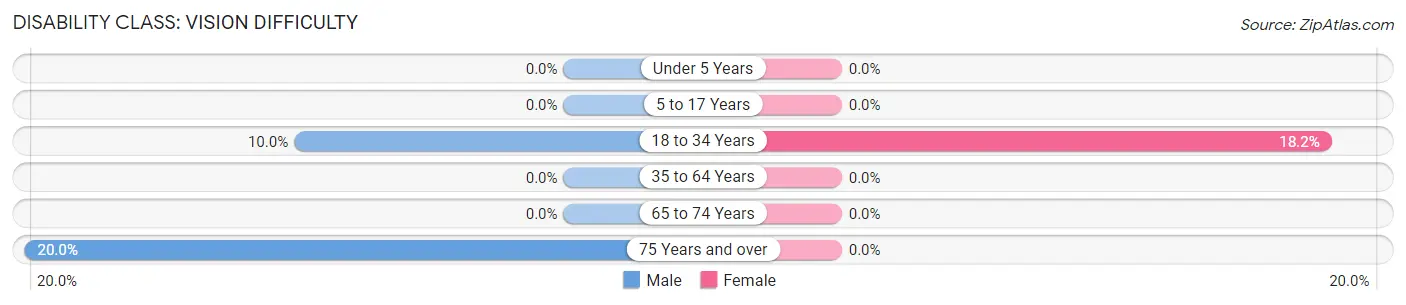
| Age Bracket | Male | Female |
| Under 5 Years | 0 (0.0%) | 0 (0.0%) |
| 5 to 17 Years | 0 (0.0%) | 0 (0.0%) |
| 18 to 34 Years | 1 (10.0%) | 2 (18.2%) |
| 35 to 64 Years | 0 (0.0%) | 0 (0.0%) |
| 65 to 74 Years | 0 (0.0%) | 0 (0.0%) |
| 75 Years and over | 2 (20.0%) | 0 (0.0%) |
Disability Class: Cognitive Difficulty
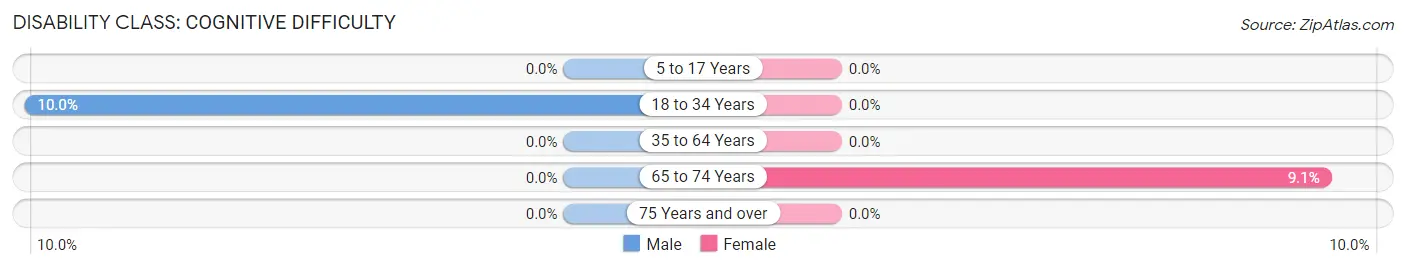
| Age Bracket | Male | Female |
| 5 to 17 Years | 0 (0.0%) | 0 (0.0%) |
| 18 to 34 Years | 1 (10.0%) | 0 (0.0%) |
| 35 to 64 Years | 0 (0.0%) | 0 (0.0%) |
| 65 to 74 Years | 0 (0.0%) | 1 (9.1%) |
| 75 Years and over | 0 (0.0%) | 0 (0.0%) |
Disability Class: Ambulatory Difficulty
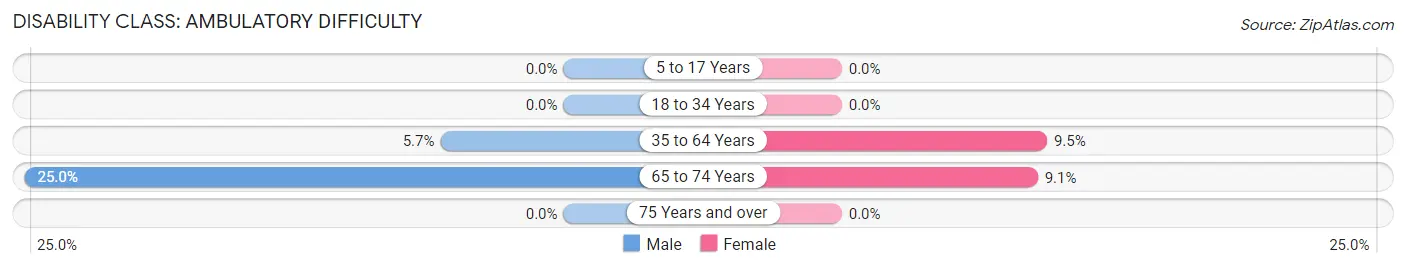
| Age Bracket | Male | Female |
| 5 to 17 Years | 0 (0.0%) | 0 (0.0%) |
| 18 to 34 Years | 0 (0.0%) | 0 (0.0%) |
| 35 to 64 Years | 2 (5.7%) | 2 (9.5%) |
| 65 to 74 Years | 1 (25.0%) | 1 (9.1%) |
| 75 Years and over | 0 (0.0%) | 0 (0.0%) |
Disability Class: Self-Care Difficulty
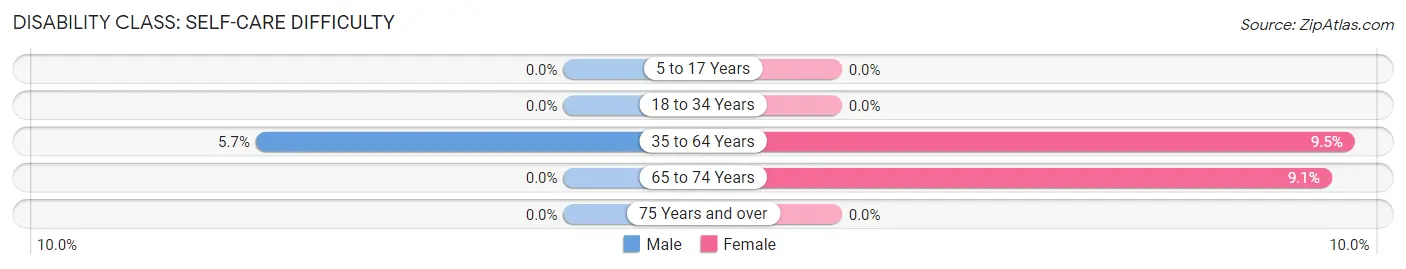
| Age Bracket | Male | Female |
| 5 to 17 Years | 0 (0.0%) | 0 (0.0%) |
| 18 to 34 Years | 0 (0.0%) | 0 (0.0%) |
| 35 to 64 Years | 2 (5.7%) | 2 (9.5%) |
| 65 to 74 Years | 0 (0.0%) | 1 (9.1%) |
| 75 Years and over | 0 (0.0%) | 0 (0.0%) |
Technology Access in Genoa
Computing Device Access in Genoa
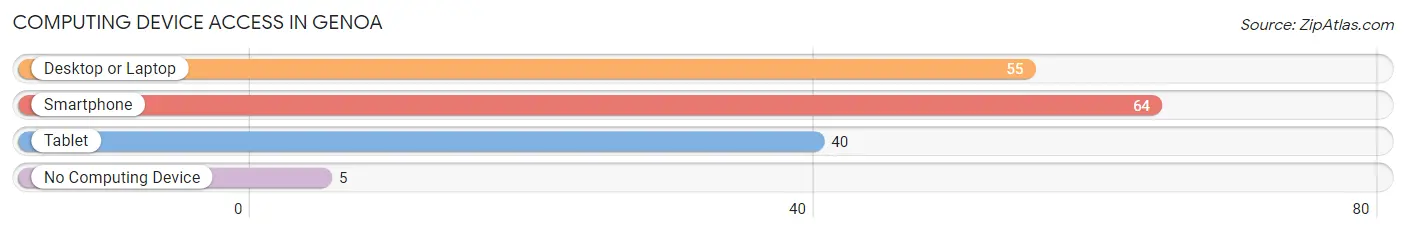
| Device Type | # Households | % Households |
| Desktop or Laptop | 55 | 66.3% |
| Smartphone | 64 | 77.1% |
| Tablet | 40 | 48.2% |
| No Computing Device | 5 | 6.0% |
| Total | 83 | 100.0% |
Internet Access in Genoa
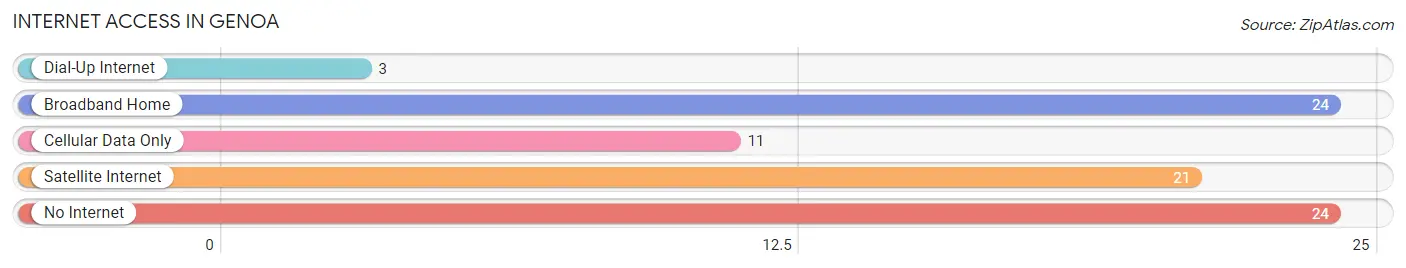
| Internet Type | # Households | % Households |
| Dial-Up Internet | 3 | 3.6% |
| Broadband Home | 24 | 28.9% |
| Cellular Data Only | 11 | 13.3% |
| Satellite Internet | 21 | 25.3% |
| No Internet | 24 | 28.9% |
| Total | 83 | 100.0% |
Genoa Summary
Genoa, Colorado is a small town located in Lincoln County, Colorado. It is situated in the foothills of the Rocky Mountains, approximately 25 miles east of Denver. The town was founded in 1871 and has a population of approximately 500 people.
Geography
Genoa is located in the foothills of the Rocky Mountains, at an elevation of 6,000 feet. The town is situated on the banks of the South Platte River, which flows through the area. The town is surrounded by rolling hills and open plains, with the Rocky Mountains to the west. The climate in Genoa is semi-arid, with hot summers and cold winters.
History
Genoa was founded in 1871 by a group of settlers from the Midwest. The town was named after Genoa, Italy, and was originally intended to be a farming community. The town quickly grew, and by the early 1900s, it had become a popular tourist destination. The town was home to several hotels, restaurants, and other businesses.
In the late 1800s, Genoa was a popular stop on the Denver and Rio Grande Railroad. The railroad brought many visitors to the town, and it also provided a way for the town's residents to travel to other parts of the state.
Economy
The economy of Genoa is largely based on tourism and agriculture. The town is home to several small businesses, including restaurants, hotels, and retail stores. The town also has a small manufacturing sector, which produces a variety of products, including furniture and clothing.
Agriculture is an important part of the local economy. The town is home to several farms, which produce a variety of crops, including wheat, corn, and hay. The town also has a small livestock industry, which produces beef, pork, and poultry.
Demographics
As of the 2010 census, the population of Genoa was 498. The town is predominantly white, with a small Hispanic population. The median household income in Genoa is $45,000, and the median home value is $150,000.
Genoa is a small, close-knit community. The town is home to several churches, and the residents are very involved in the local community. The town is also home to several parks and recreational areas, which provide a variety of activities for residents and visitors alike.
Genoa is a unique and charming town, with a rich history and a vibrant economy. The town is a great place to live, work, and visit, and it is sure to remain a popular destination for years to come.
Common Questions
What is Per Capita Income in Genoa?
Per Capita income in Genoa is $30,633.
What is the Median Family Income in Genoa?
Median Family Income in Genoa is $47,917.
What is the Median Household income in Genoa?
Median Household Income in Genoa is $46,250.
What is Income or Wage Gap in Genoa?
Income or Wage Gap in Genoa is 44.6%.
Women in Genoa earn 55.4 cents for every dollar earned by a man.
What is Inequality or Gini Index in Genoa?
Inequality or Gini Index in Genoa is 0.40.
What is the Total Population of Genoa?
Total Population of Genoa is 126.
What is the Total Male Population of Genoa?
Total Male Population of Genoa is 68.
What is the Total Female Population of Genoa?
Total Female Population of Genoa is 58.
What is the Ratio of Males per 100 Females in Genoa?
There are 117.24 Males per 100 Females in Genoa.
What is the Ratio of Females per 100 Males in Genoa?
There are 85.29 Females per 100 Males in Genoa.
What is the Median Population Age in Genoa?
Median Population Age in Genoa is 52.0 Years.
What is the Average Family Size in Genoa
Average Family Size in Genoa is 2.3 People.
What is the Average Household Size in Genoa
Average Household Size in Genoa is 1.5 People.
How Large is the Labor Force in Genoa?
There are 62 People in the Labor Forcein in Genoa.
What is the Percentage of People in the Labor Force in Genoa?
56.9% of People are in the Labor Force in Genoa.