Elbert, CO Map & Demographics
Elbert Map
Elbert Overview
$38,008
PER CAPITA INCOME
$53,500
AVG FAMILY INCOME
$54,500
AVG HOUSEHOLD INCOME
14.6%
WAGE / INCOME GAP [ % ]
85.4¢/ $1
WAGE / INCOME GAP [ $ ]
0.34
INEQUALITY / GINI INDEX
203
TOTAL POPULATION
104
MALE POPULATION
99
FEMALE POPULATION
105.05
MALES / 100 FEMALES
95.19
FEMALES / 100 MALES
37.2
MEDIAN AGE
2.7
AVG FAMILY SIZE
2.1
AVG HOUSEHOLD SIZE
112
LABOR FORCE [ PEOPLE ]
65.9%
PERCENT IN LABOR FORCE
3.6%
UNEMPLOYMENT RATE
Elbert Zip Codes
Elbert Area Codes
Income in Elbert
Income Overview in Elbert
Per Capita Income in Elbert is $38,008, while median incomes of families and households are $53,500 and $54,500 respectively.
| Characteristic | Number | Measure |
| Per Capita Income | 203 | $38,008 |
| Median Family Income | 60 | $53,500 |
| Mean Family Income | 60 | $84,778 |
| Median Household Income | 98 | $54,500 |
| Mean Household Income | 98 | $74,981 |
| Income Deficit | 60 | $0 |
| Wage / Income Gap (%) | 203 | 14.56% |
| Wage / Income Gap ($) | 203 | 85.44¢ per $1 |
| Gini / Inequality Index | 203 | 0.34 |
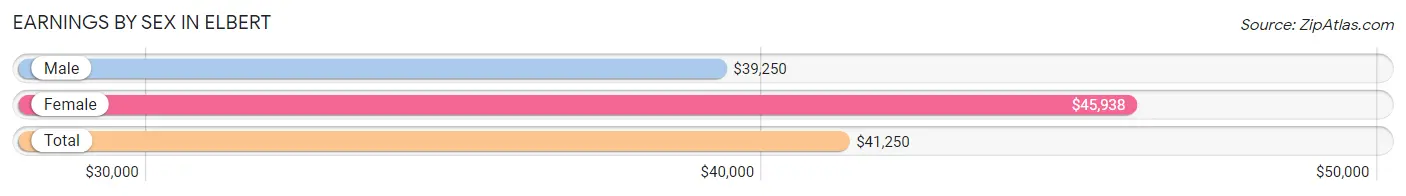
Earnings by Sex in Elbert
Average Earnings in Elbert are $41,250, $39,250 for men and $45,938 for women, a difference of 14.6%.
| Sex | Number | Average Earnings |
| Male | 83 (70.3%) | $39,250 |
| Female | 35 (29.7%) | $45,938 |
| Total | 118 (100.0%) | $41,250 |
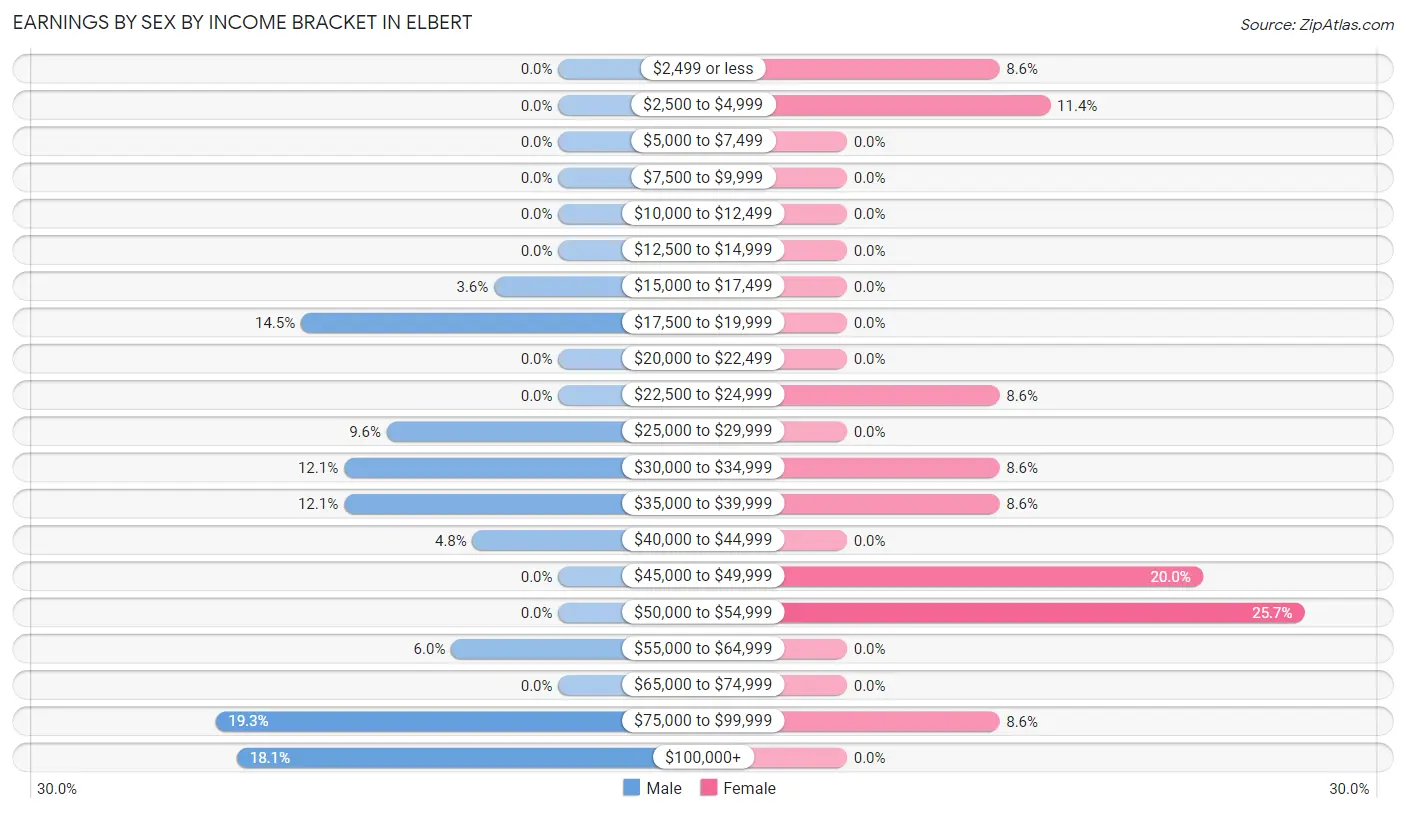
Earnings by Sex by Income Bracket in Elbert
The most common earnings brackets in Elbert are $75,000 to $99,999 for men (16 | 19.3%) and $50,000 to $54,999 for women (9 | 25.7%).
| Income | Male | Female |
| $2,499 or less | 0 (0.0%) | 3 (8.6%) |
| $2,500 to $4,999 | 0 (0.0%) | 4 (11.4%) |
| $5,000 to $7,499 | 0 (0.0%) | 0 (0.0%) |
| $7,500 to $9,999 | 0 (0.0%) | 0 (0.0%) |
| $10,000 to $12,499 | 0 (0.0%) | 0 (0.0%) |
| $12,500 to $14,999 | 0 (0.0%) | 0 (0.0%) |
| $15,000 to $17,499 | 3 (3.6%) | 0 (0.0%) |
| $17,500 to $19,999 | 12 (14.5%) | 0 (0.0%) |
| $20,000 to $22,499 | 0 (0.0%) | 0 (0.0%) |
| $22,500 to $24,999 | 0 (0.0%) | 3 (8.6%) |
| $25,000 to $29,999 | 8 (9.6%) | 0 (0.0%) |
| $30,000 to $34,999 | 10 (12.0%) | 3 (8.6%) |
| $35,000 to $39,999 | 10 (12.0%) | 3 (8.6%) |
| $40,000 to $44,999 | 4 (4.8%) | 0 (0.0%) |
| $45,000 to $49,999 | 0 (0.0%) | 7 (20.0%) |
| $50,000 to $54,999 | 0 (0.0%) | 9 (25.7%) |
| $55,000 to $64,999 | 5 (6.0%) | 0 (0.0%) |
| $65,000 to $74,999 | 0 (0.0%) | 0 (0.0%) |
| $75,000 to $99,999 | 16 (19.3%) | 3 (8.6%) |
| $100,000+ | 15 (18.1%) | 0 (0.0%) |
| Total | 83 (100.0%) | 35 (100.0%) |
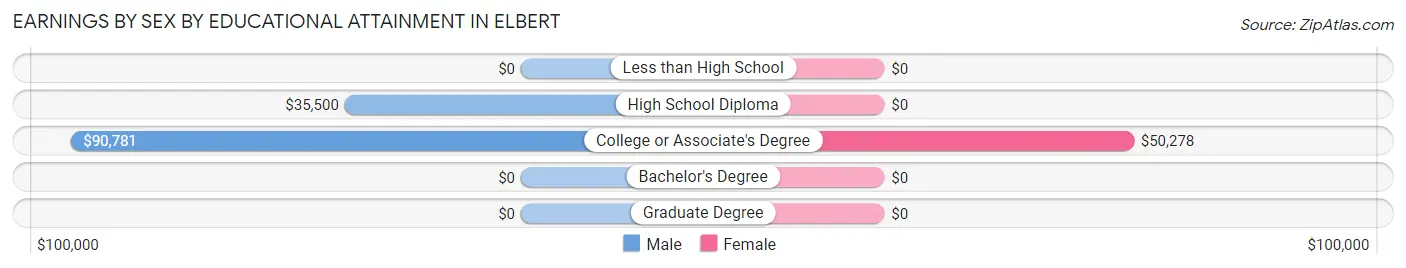
Earnings by Sex by Educational Attainment in Elbert
Average earnings in Elbert are $64,500 for men and $47,188 for women, a difference of 26.8%. Men with an educational attainment of college or associate's degree enjoy the highest average annual earnings of $90,781, while those with high school diploma education earn the least with $35,500. Women with an educational attainment of college or associate's degree earn the most with the average annual earnings of $50,278, while those with college or associate's degree education have the smallest earnings of $50,278.
| Educational Attainment | Male Income | Female Income |
| Less than High School | - | - |
| High School Diploma | $35,500 | $0 |
| College or Associate's Degree | $90,781 | $50,278 |
| Bachelor's Degree | - | - |
| Graduate Degree | - | - |
| Total | $64,500 | $47,188 |
Family Income in Elbert
Family Income Brackets in Elbert
According to the Elbert family income data, there are 21 families falling into the $50,000 to $74,999 income range, which is the most common income bracket and makes up 35.0% of all families.

| Income Bracket | # Families | % Families |
| Less than $10,000 | 0 | 0.0% |
| $10,000 to $14,999 | 0 | 0.0% |
| $15,000 to $24,999 | 0 | 0.0% |
| $25,000 to $34,999 | 0 | 0.0% |
| $35,000 to $49,999 | 19 | 31.7% |
| $50,000 to $74,999 | 21 | 35.0% |
| $75,000 to $99,999 | 4 | 6.7% |
| $100,000 to $149,999 | 3 | 5.0% |
| $150,000 to $199,999 | 10 | 16.7% |
| $200,000+ | 3 | 5.0% |
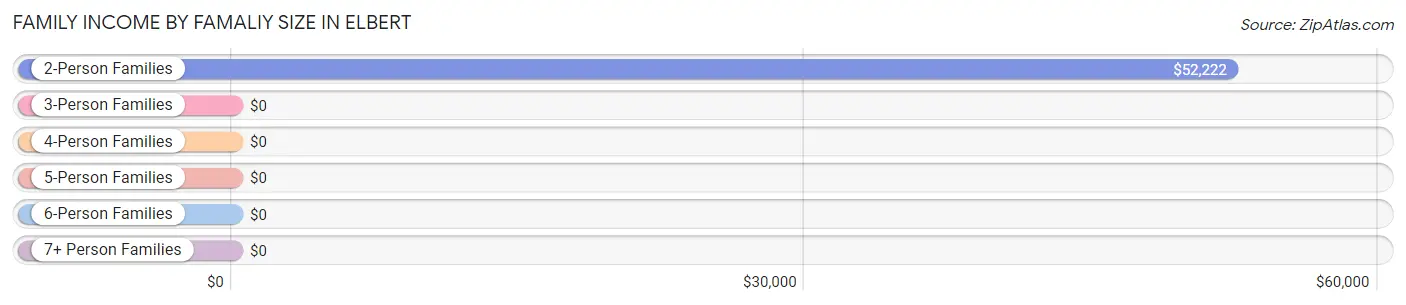
Family Income by Famaliy Size in Elbert
2-person families (34 | 56.7%) account for the highest median family income in Elbert with $52,222 per family, while 2-person families (34 | 56.7%) have the highest median income of $26,111 per family member.
| Income Bracket | # Families | Median Income |
| 2-Person Families | 34 (56.7%) | $52,222 |
| 3-Person Families | 20 (33.3%) | $0 |
| 4-Person Families | 0 (0.0%) | $0 |
| 5-Person Families | 6 (10.0%) | $0 |
| 6-Person Families | 0 (0.0%) | $0 |
| 7+ Person Families | 0 (0.0%) | $0 |
| Total | 60 (100.0%) | $53,500 |
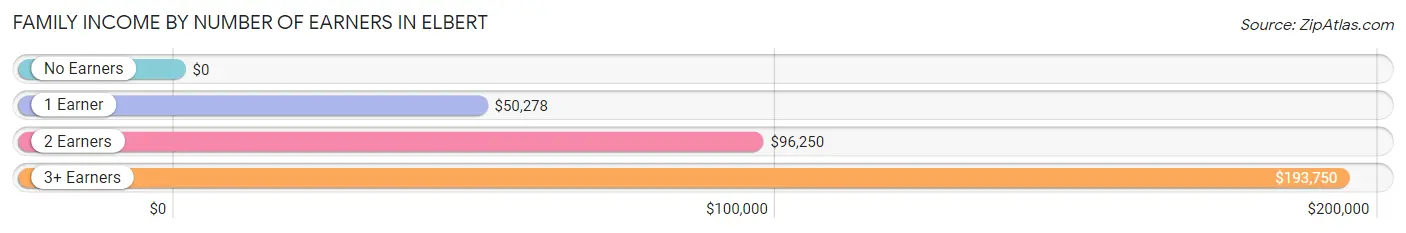
Family Income by Number of Earners in Elbert
| Number of Earners | # Families | Median Income |
| No Earners | 9 (15.0%) | $0 |
| 1 Earner | 32 (53.3%) | $50,278 |
| 2 Earners | 10 (16.7%) | $96,250 |
| 3+ Earners | 9 (15.0%) | $193,750 |
| Total | 60 (100.0%) | $53,500 |
Household Income in Elbert
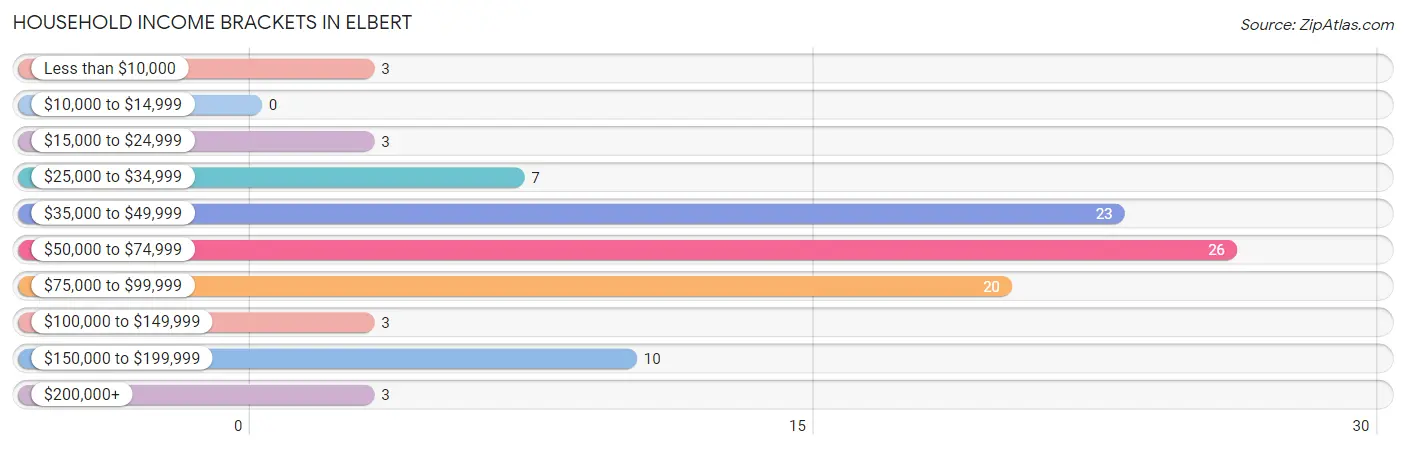
Household Income Brackets in Elbert
With 26 households falling in the category, the $50,000 to $74,999 income range is the most frequent in Elbert, accounting for 26.5% of all households.
| Income Bracket | # Households | % Households |
| Less than $10,000 | 3 | 3.1% |
| $10,000 to $14,999 | 0 | 0.0% |
| $15,000 to $24,999 | 3 | 3.1% |
| $25,000 to $34,999 | 7 | 7.1% |
| $35,000 to $49,999 | 23 | 23.5% |
| $50,000 to $74,999 | 26 | 26.5% |
| $75,000 to $99,999 | 20 | 20.4% |
| $100,000 to $149,999 | 3 | 3.1% |
| $150,000 to $199,999 | 10 | 10.2% |
| $200,000+ | 3 | 3.1% |
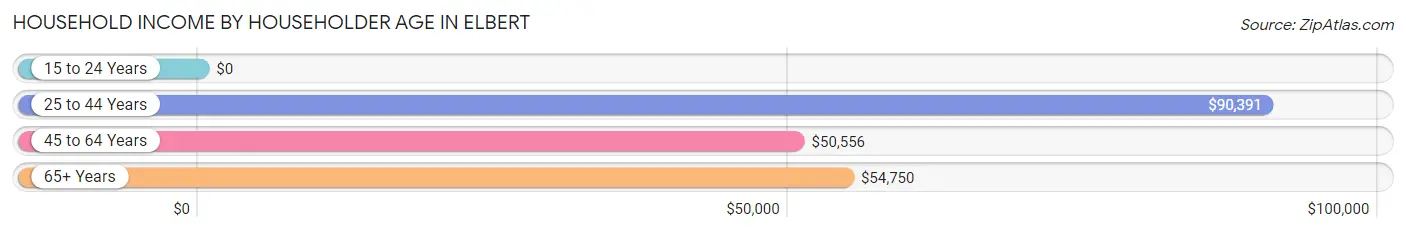
Household Income by Householder Age in Elbert
The median household income in Elbert is $54,500, with the highest median household income of $90,391 found in the 25 to 44 years age bracket for the primary householder. A total of 33 households (33.7%) fall into this category.
| Income Bracket | # Households | Median Income |
| 15 to 24 Years | 0 (0.0%) | $0 |
| 25 to 44 Years | 33 (33.7%) | $90,391 |
| 45 to 64 Years | 40 (40.8%) | $50,556 |
| 65+ Years | 25 (25.5%) | $54,750 |
| Total | 98 (100.0%) | $54,500 |
Poverty in Elbert
Income Below Poverty by Sex and Age in Elbert
With 1.9% poverty level for males and 3.0% for females among the residents of Elbert, 18 to 24 year old males and 25 to 34 year old females are the most vulnerable to poverty, with 2 males (9.5%) and 3 females (21.4%) in their respective age groups living below the poverty level.
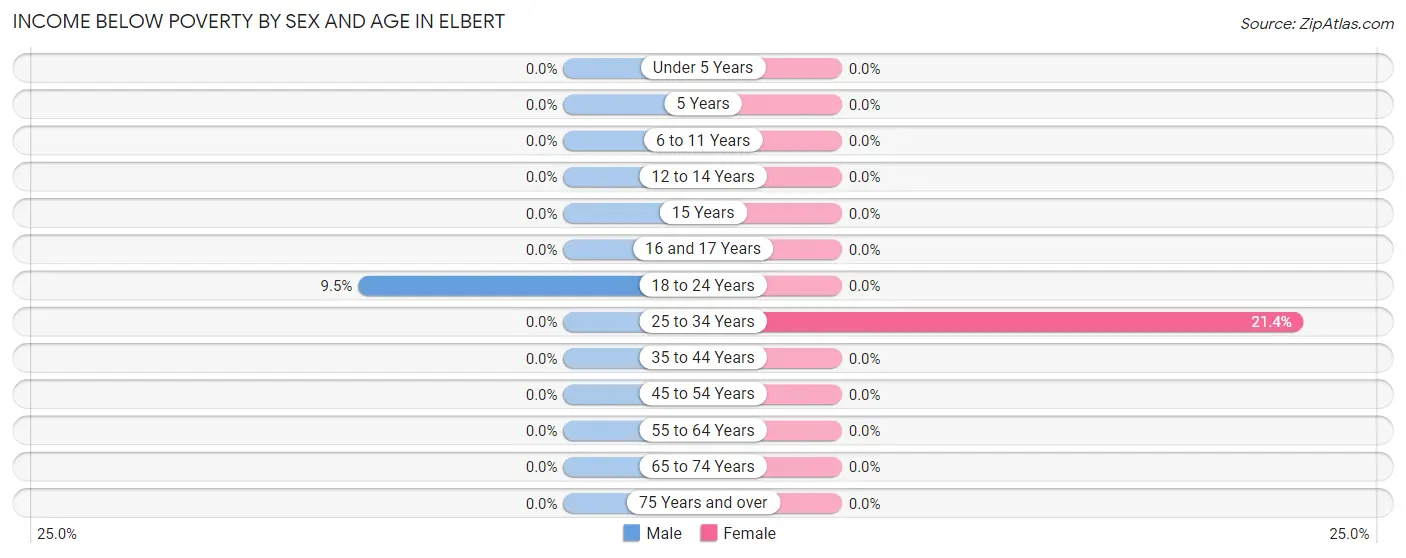
| Age Bracket | Male | Female |
| Under 5 Years | 0 (0.0%) | 0 (0.0%) |
| 5 Years | 0 (0.0%) | 0 (0.0%) |
| 6 to 11 Years | 0 (0.0%) | 0 (0.0%) |
| 12 to 14 Years | 0 (0.0%) | 0 (0.0%) |
| 15 Years | 0 (0.0%) | 0 (0.0%) |
| 16 and 17 Years | 0 (0.0%) | 0 (0.0%) |
| 18 to 24 Years | 2 (9.5%) | 0 (0.0%) |
| 25 to 34 Years | 0 (0.0%) | 3 (21.4%) |
| 35 to 44 Years | 0 (0.0%) | 0 (0.0%) |
| 45 to 54 Years | 0 (0.0%) | 0 (0.0%) |
| 55 to 64 Years | 0 (0.0%) | 0 (0.0%) |
| 65 to 74 Years | 0 (0.0%) | 0 (0.0%) |
| 75 Years and over | 0 (0.0%) | 0 (0.0%) |
| Total | 2 (1.9%) | 3 (3.0%) |
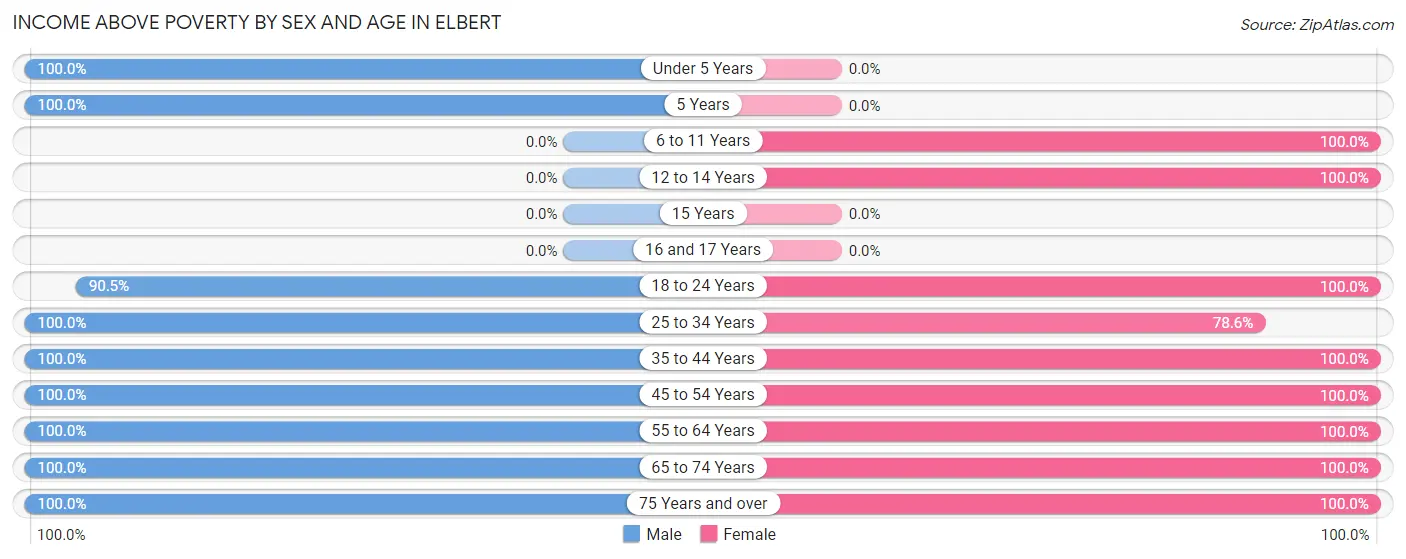
Income Above Poverty by Sex and Age in Elbert
According to the poverty statistics in Elbert, males aged under 5 years and females aged 6 to 11 years are the age groups that are most secure financially, with 100.0% of males and 100.0% of females in these age groups living above the poverty line.
| Age Bracket | Male | Female |
| Under 5 Years | 3 (100.0%) | 0 (0.0%) |
| 5 Years | 7 (100.0%) | 0 (0.0%) |
| 6 to 11 Years | 0 (0.0%) | 6 (100.0%) |
| 12 to 14 Years | 0 (0.0%) | 17 (100.0%) |
| 15 Years | 0 (0.0%) | 0 (0.0%) |
| 16 and 17 Years | 0 (0.0%) | 0 (0.0%) |
| 18 to 24 Years | 19 (90.5%) | 4 (100.0%) |
| 25 to 34 Years | 28 (100.0%) | 11 (78.6%) |
| 35 to 44 Years | 5 (100.0%) | 3 (100.0%) |
| 45 to 54 Years | 4 (100.0%) | 13 (100.0%) |
| 55 to 64 Years | 11 (100.0%) | 28 (100.0%) |
| 65 to 74 Years | 20 (100.0%) | 6 (100.0%) |
| 75 Years and over | 5 (100.0%) | 8 (100.0%) |
| Total | 102 (98.1%) | 96 (97.0%) |
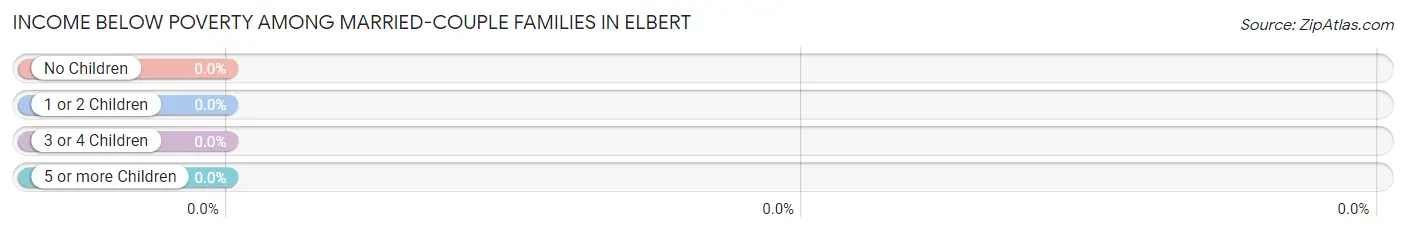
Income Below Poverty Among Married-Couple Families in Elbert
| Children | Above Poverty | Below Poverty |
| No Children | 31 (100.0%) | 0 (0.0%) |
| 1 or 2 Children | 7 (100.0%) | 0 (0.0%) |
| 3 or 4 Children | 3 (100.0%) | 0 (0.0%) |
| 5 or more Children | 0 (0.0%) | 0 (0.0%) |
| Total | 41 (100.0%) | 0 (0.0%) |
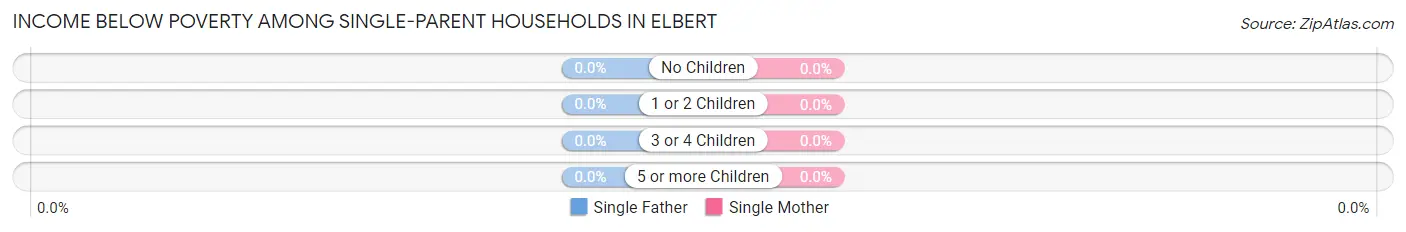
Income Below Poverty Among Single-Parent Households in Elbert
| Children | Single Father | Single Mother |
| No Children | 0 (0.0%) | 0 (0.0%) |
| 1 or 2 Children | 0 (0.0%) | 0 (0.0%) |
| 3 or 4 Children | 0 (0.0%) | 0 (0.0%) |
| 5 or more Children | 0 (0.0%) | 0 (0.0%) |
| Total | 0 (0.0%) | 0 (0.0%) |
Income Below Poverty Among Married-Couple vs Single-Parent Households in Elbert
| Children | Married-Couple Families | Single-Parent Households |
| No Children | 0 (0.0%) | 0 (0.0%) |
| 1 or 2 Children | 0 (0.0%) | 0 (0.0%) |
| 3 or 4 Children | 0 (0.0%) | 0 (0.0%) |
| 5 or more Children | 0 (0.0%) | 0 (0.0%) |
| Total | 0 (0.0%) | 0 (0.0%) |
Race in Elbert
The most populous races in Elbert are White / Caucasian (200 | 98.5%), Hispanic or Latino (17 | 8.4%), and Two or more Races (3 | 1.5%).
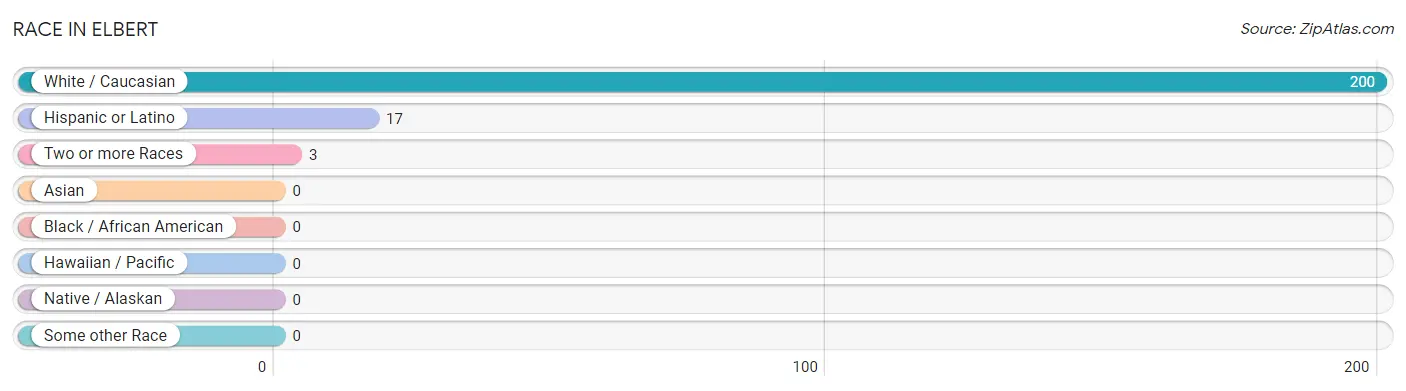
| Race | # Population | % Population |
| Asian | 0 | 0.0% |
| Black / African American | 0 | 0.0% |
| Hawaiian / Pacific | 0 | 0.0% |
| Hispanic or Latino | 17 | 8.4% |
| Native / Alaskan | 0 | 0.0% |
| White / Caucasian | 200 | 98.5% |
| Two or more Races | 3 | 1.5% |
| Some other Race | 0 | 0.0% |
| Total | 203 | 100.0% |
Ancestry in Elbert
The most populous ancestries reported in Elbert are German (46 | 22.7%), Irish (40 | 19.7%), English (28 | 13.8%), Mexican (17 | 8.4%), and Scotch-Irish (15 | 7.4%), together accounting for 71.9% of all Elbert residents.
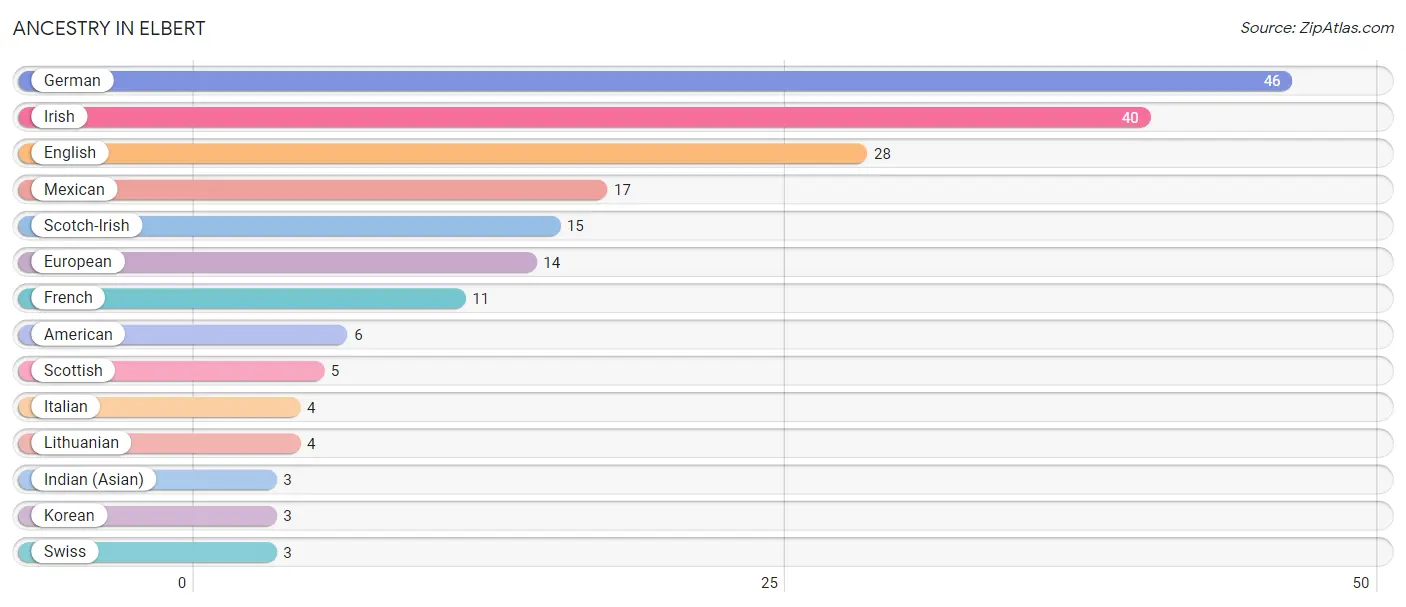
| Ancestry | # Population | % Population |
| American | 6 | 3.0% |
| English | 28 | 13.8% |
| European | 14 | 6.9% |
| French | 11 | 5.4% |
| German | 46 | 22.7% |
| Indian (Asian) | 3 | 1.5% |
| Irish | 40 | 19.7% |
| Italian | 4 | 2.0% |
| Korean | 3 | 1.5% |
| Lithuanian | 4 | 2.0% |
| Mexican | 17 | 8.4% |
| Scotch-Irish | 15 | 7.4% |
| Scottish | 5 | 2.5% |
| Swiss | 3 | 1.5% | View All 14 Rows |
Immigrants in Elbert

| Immigration Origin | # Population | % Population | View All 0 Rows |
Sex and Age in Elbert
Sex and Age in Elbert
The most populous age groups in Elbert are 30 to 34 Years (21 | 20.2%) for men and 10 to 14 Years (20 | 20.2%) for women.
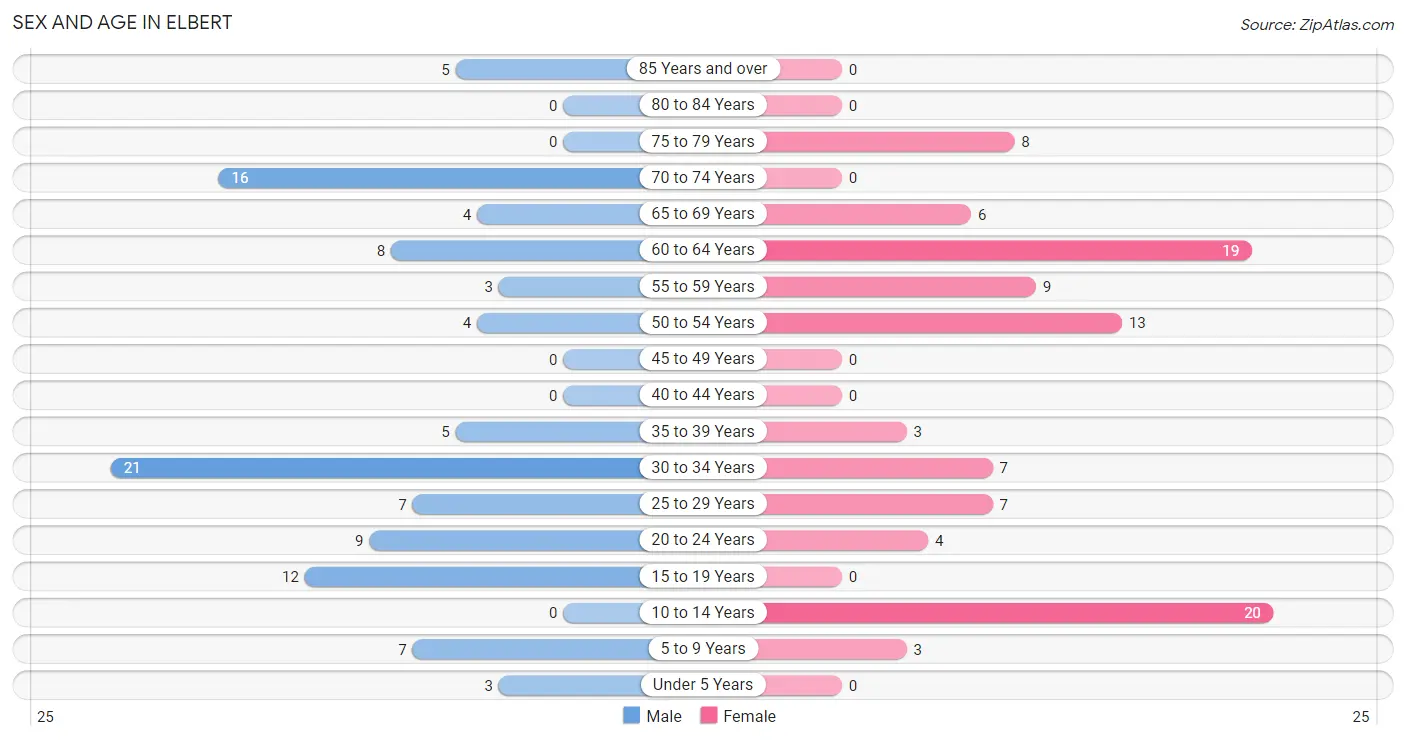
| Age Bracket | Male | Female |
| Under 5 Years | 3 (2.9%) | 0 (0.0%) |
| 5 to 9 Years | 7 (6.7%) | 3 (3.0%) |
| 10 to 14 Years | 0 (0.0%) | 20 (20.2%) |
| 15 to 19 Years | 12 (11.5%) | 0 (0.0%) |
| 20 to 24 Years | 9 (8.6%) | 4 (4.0%) |
| 25 to 29 Years | 7 (6.7%) | 7 (7.1%) |
| 30 to 34 Years | 21 (20.2%) | 7 (7.1%) |
| 35 to 39 Years | 5 (4.8%) | 3 (3.0%) |
| 40 to 44 Years | 0 (0.0%) | 0 (0.0%) |
| 45 to 49 Years | 0 (0.0%) | 0 (0.0%) |
| 50 to 54 Years | 4 (3.8%) | 13 (13.1%) |
| 55 to 59 Years | 3 (2.9%) | 9 (9.1%) |
| 60 to 64 Years | 8 (7.7%) | 19 (19.2%) |
| 65 to 69 Years | 4 (3.8%) | 6 (6.1%) |
| 70 to 74 Years | 16 (15.4%) | 0 (0.0%) |
| 75 to 79 Years | 0 (0.0%) | 8 (8.1%) |
| 80 to 84 Years | 0 (0.0%) | 0 (0.0%) |
| 85 Years and over | 5 (4.8%) | 0 (0.0%) |
| Total | 104 (100.0%) | 99 (100.0%) |
Families and Households in Elbert
Median Family Size in Elbert
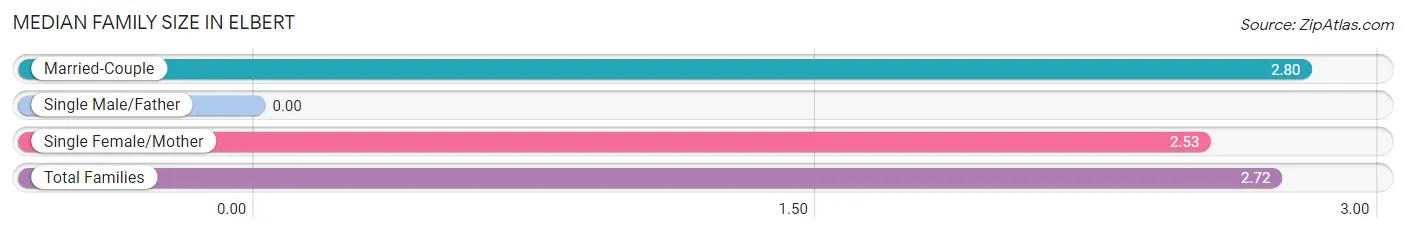
| Family Type | # Families | Family Size |
| Married-Couple | 41 (68.3%) | 2.80 |
| Single Male/Father | 0 (0.0%) | - |
| Single Female/Mother | 19 (31.7%) | 2.53 |
| Total Families | 60 (100.0%) | 2.72 |
Median Household Size in Elbert
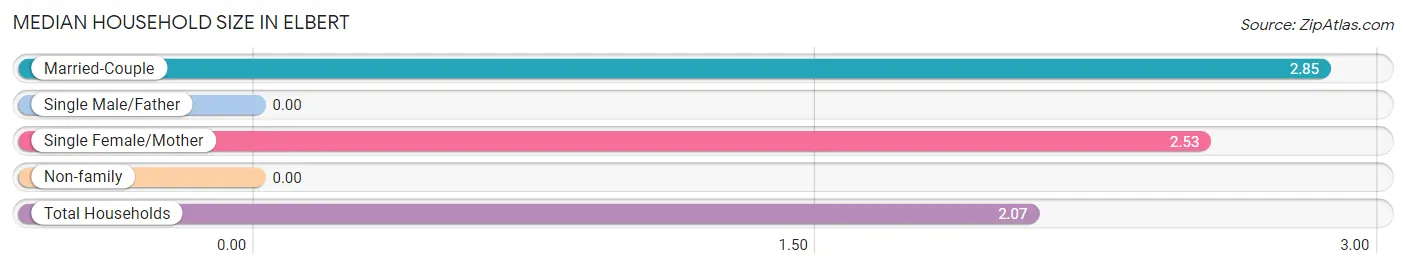
| Household Type | # Households | Household Size |
| Married-Couple | 41 (41.8%) | 2.85 |
| Single Male/Father | 0 (0.0%) | - |
| Single Female/Mother | 19 (19.4%) | 2.53 |
| Non-family | 38 (38.8%) | - |
| Total Households | 98 (100.0%) | 2.07 |
Household Size by Marriage Status in Elbert
Out of a total of 98 households in Elbert, 60 (61.2%) are family households, while 38 (38.8%) are nonfamily households. The most numerous type of family households are 2-person households, comprising 34, and the most common type of nonfamily households are 1-person households, comprising 38.
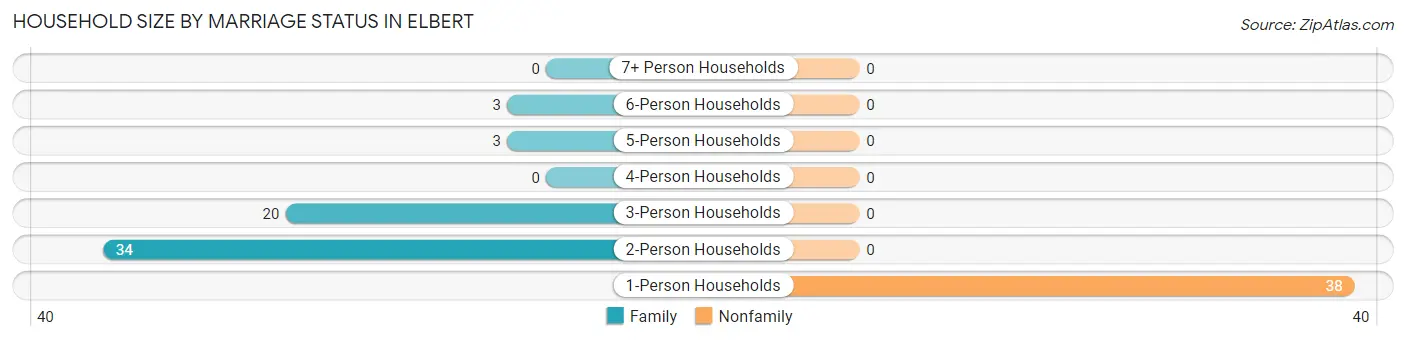
| Household Size | Family Households | Nonfamily Households |
| 1-Person Households | - | 38 (38.8%) |
| 2-Person Households | 34 (34.7%) | 0 (0.0%) |
| 3-Person Households | 20 (20.4%) | 0 (0.0%) |
| 4-Person Households | 0 (0.0%) | 0 (0.0%) |
| 5-Person Households | 3 (3.1%) | 0 (0.0%) |
| 6-Person Households | 3 (3.1%) | 0 (0.0%) |
| 7+ Person Households | 0 (0.0%) | 0 (0.0%) |
| Total | 60 (61.2%) | 38 (38.8%) |
Female Fertility in Elbert
Fertility by Age in Elbert
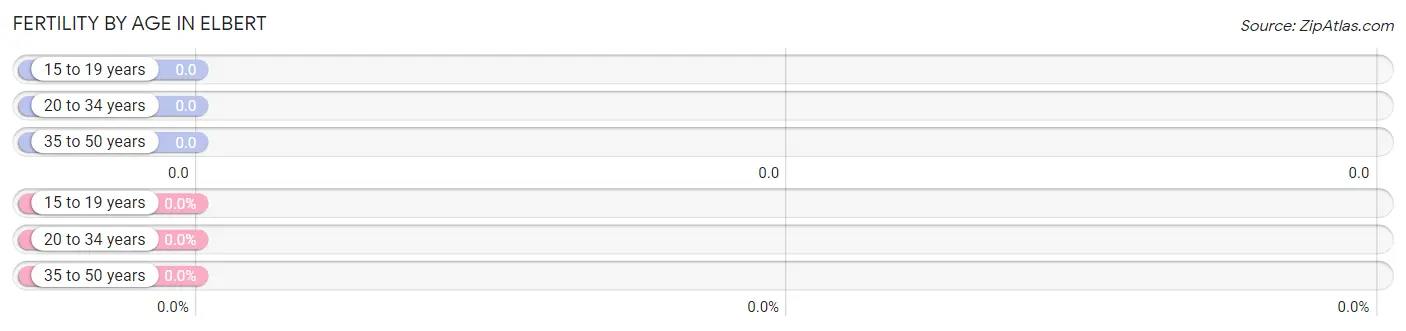
| Age Bracket | Women with Births | Births / 1,000 Women |
| 15 to 19 years | 0 (0.0%) | 0.0 |
| 20 to 34 years | 0 (0.0%) | 0.0 |
| 35 to 50 years | 0 (0.0%) | 0.0 |
| Total | 0 (0.0%) | 0.0 |
Fertility by Age by Marriage Status in Elbert
| Age Bracket | Married | Unmarried |
| 15 to 19 years | 0 (0.0%) | 0 (0.0%) |
| 20 to 34 years | 0 (0.0%) | 0 (0.0%) |
| 35 to 50 years | 0 (0.0%) | 0 (0.0%) |
| Total | 0 (0.0%) | 0 (0.0%) |
Fertility by Education in Elbert
| Educational Attainment | Women with Births | Births / 1,000 Women |
| Less than High School | 0 (0.0%) | 0.0 |
| High School Diploma | 0 (0.0%) | 0.0 |
| College or Associate's Degree | 0 (0.0%) | 0.0 |
| Bachelor's Degree | 0 (0.0%) | 0.0 |
| Graduate Degree | 0 (0.0%) | 0.0 |
| Total | 0 (0.0%) | 0.0 |
Fertility by Education by Marriage Status in Elbert
| Educational Attainment | Married | Unmarried |
| Less than High School | 0 (0.0%) | 0 (0.0%) |
| High School Diploma | 0 (0.0%) | 0 (0.0%) |
| College or Associate's Degree | 0 (0.0%) | 0 (0.0%) |
| Bachelor's Degree | 0 (0.0%) | 0 (0.0%) |
| Graduate Degree | 0 (0.0%) | 0 (0.0%) |
| Total | 0 (0.0%) | 0 (0.0%) |
Employment Characteristics in Elbert
Employment by Class of Employer in Elbert
Among the 108 employed individuals in Elbert, private company employees (96 | 88.9%), self-employed (incorporated) (3 | 2.8%), and not-for-profit organizations (3 | 2.8%) make up the most common classes of employment.
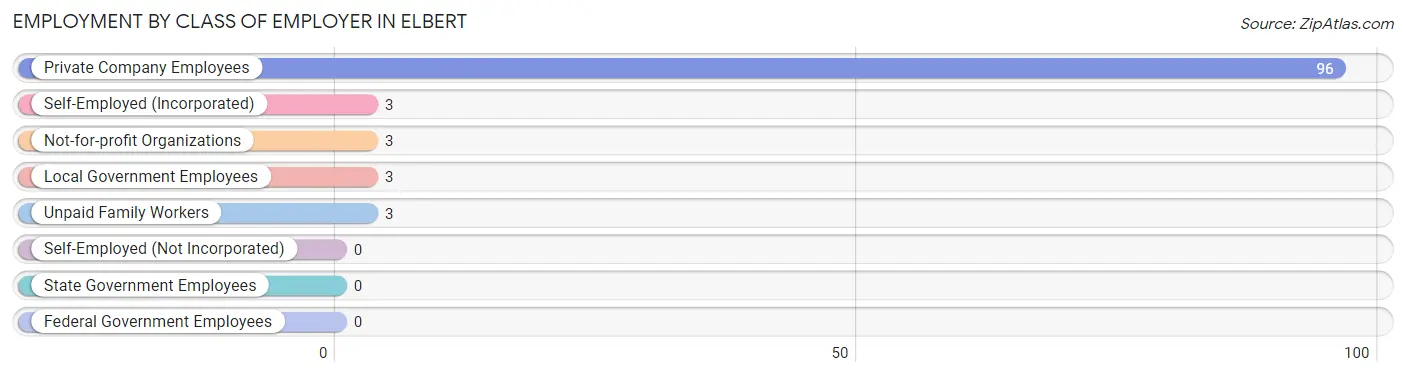
| Employer Class | # Employees | % Employees |
| Private Company Employees | 96 | 88.9% |
| Self-Employed (Incorporated) | 3 | 2.8% |
| Self-Employed (Not Incorporated) | 0 | 0.0% |
| Not-for-profit Organizations | 3 | 2.8% |
| Local Government Employees | 3 | 2.8% |
| State Government Employees | 0 | 0.0% |
| Federal Government Employees | 0 | 0.0% |
| Unpaid Family Workers | 3 | 2.8% |
| Total | 108 | 100.0% |
Employment Status by Age in Elbert
According to the labor force statistics for Elbert, out of the total population over 16 years of age (170), 65.9% or 112 individuals are in the labor force, with 3.6% or 4 of them unemployed. The age group with the highest labor force participation rate is 16 to 19 years, with 100.0% or 12 individuals in the labor force. Within the labor force, the 65 to 74 years age range has the highest percentage of unemployed individuals, with 25.0% or 4 of them being unemployed.
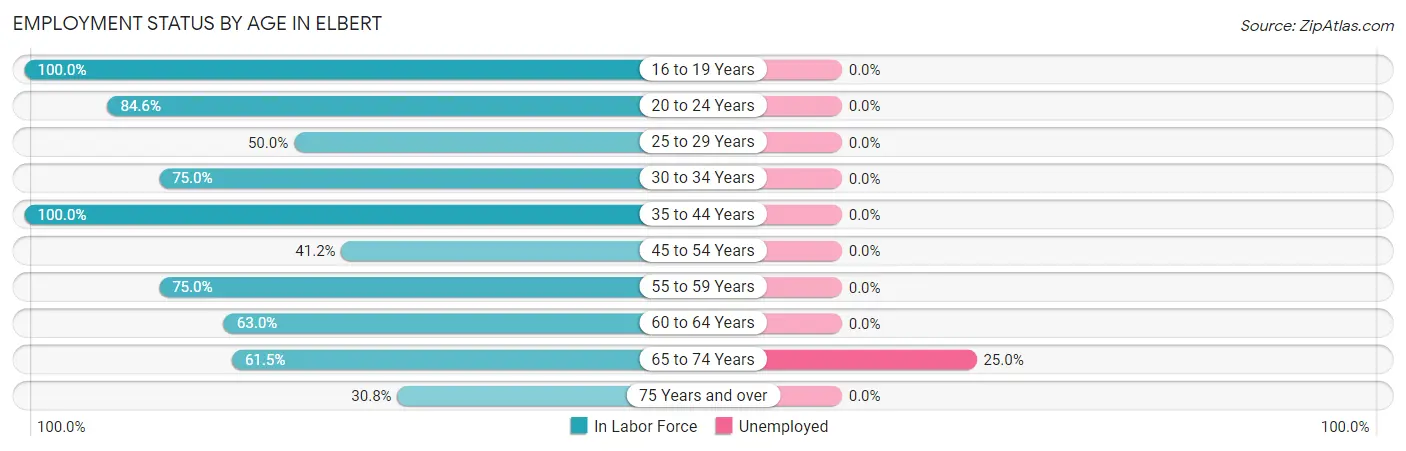
| Age Bracket | In Labor Force | Unemployed |
| 16 to 19 Years | 12 (100.0%) | 0 (0.0%) |
| 20 to 24 Years | 11 (84.6%) | 0 (0.0%) |
| 25 to 29 Years | 7 (50.0%) | 0 (0.0%) |
| 30 to 34 Years | 21 (75.0%) | 0 (0.0%) |
| 35 to 44 Years | 8 (100.0%) | 0 (0.0%) |
| 45 to 54 Years | 7 (41.2%) | 0 (0.0%) |
| 55 to 59 Years | 9 (75.0%) | 0 (0.0%) |
| 60 to 64 Years | 17 (63.0%) | 0 (0.0%) |
| 65 to 74 Years | 16 (61.5%) | 4 (25.0%) |
| 75 Years and over | 4 (30.8%) | 0 (0.0%) |
| Total | 112 (65.9%) | 4 (3.6%) |
Employment Status by Educational Attainment in Elbert
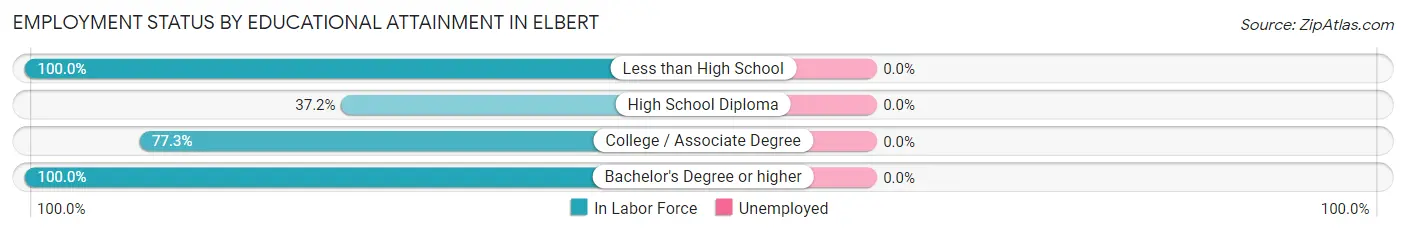
| Educational Attainment | In Labor Force | Unemployed |
| Less than High School | 5 (100.0%) | 0 (0.0%) |
| High School Diploma | 16 (37.2%) | 0 (0.0%) |
| College / Associate Degree | 34 (77.3%) | 0 (0.0%) |
| Bachelor's Degree or higher | 14 (100.0%) | 0 (0.0%) |
| Total | 69 (65.1%) | 0 (0.0%) |
Employment Occupations by Sex in Elbert
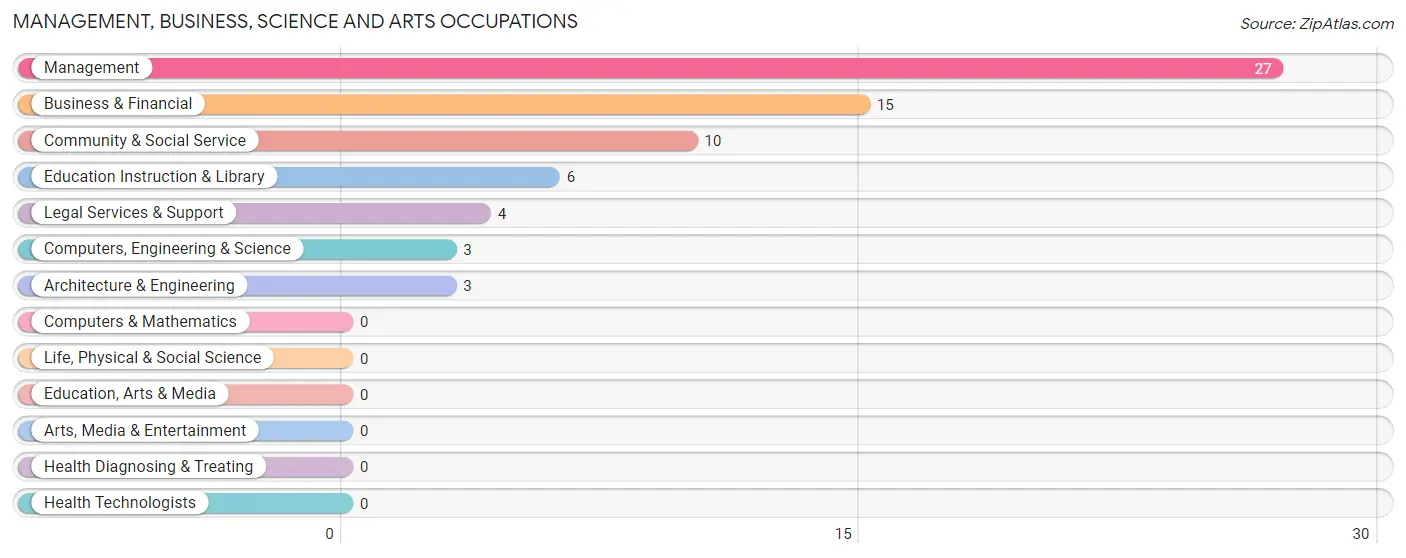
Management, Business, Science and Arts Occupations
The most common Management, Business, Science and Arts occupations in Elbert are Management (27 | 25.0%), Business & Financial (15 | 13.9%), Community & Social Service (10 | 9.3%), Education Instruction & Library (6 | 5.6%), and Legal Services & Support (4 | 3.7%).
Management, Business, Science and Arts Occupations by Sex
Within the Management, Business, Science and Arts occupations in Elbert, the most male-oriented occupations are Computers, Engineering & Science (100.0%), Architecture & Engineering (100.0%), and Management (88.9%), while the most female-oriented occupations are Community & Social Service (100.0%), Legal Services & Support (100.0%), and Education Instruction & Library (100.0%).
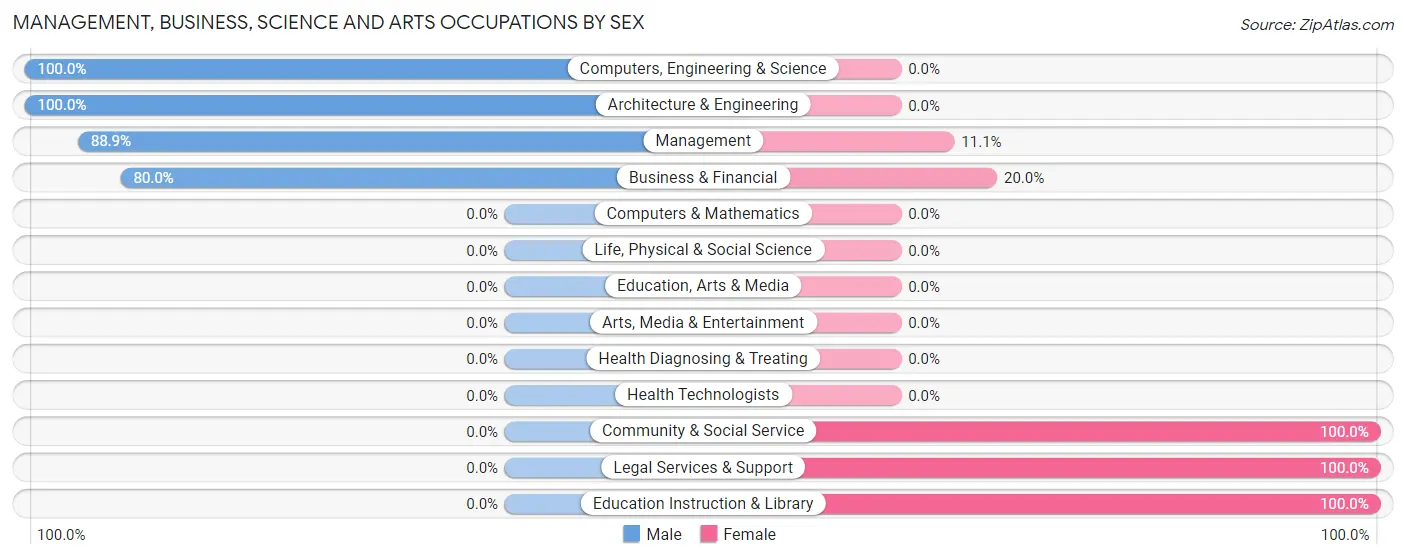
| Occupation | Male | Female |
| Management | 24 (88.9%) | 3 (11.1%) |
| Business & Financial | 12 (80.0%) | 3 (20.0%) |
| Computers, Engineering & Science | 3 (100.0%) | 0 (0.0%) |
| Computers & Mathematics | 0 (0.0%) | 0 (0.0%) |
| Architecture & Engineering | 3 (100.0%) | 0 (0.0%) |
| Life, Physical & Social Science | 0 (0.0%) | 0 (0.0%) |
| Community & Social Service | 0 (0.0%) | 10 (100.0%) |
| Education, Arts & Media | 0 (0.0%) | 0 (0.0%) |
| Legal Services & Support | 0 (0.0%) | 4 (100.0%) |
| Education Instruction & Library | 0 (0.0%) | 6 (100.0%) |
| Arts, Media & Entertainment | 0 (0.0%) | 0 (0.0%) |
| Health Diagnosing & Treating | 0 (0.0%) | 0 (0.0%) |
| Health Technologists | 0 (0.0%) | 0 (0.0%) |
| Total (Category) | 39 (70.9%) | 16 (29.1%) |
| Total (Overall) | 76 (70.4%) | 32 (29.6%) |
Services Occupations
Services Occupations by Sex
| Occupation | Male | Female |
| Healthcare Support | 0 (0.0%) | 0 (0.0%) |
| Security & Protection | 0 (0.0%) | 0 (0.0%) |
| Firefighting & Prevention | 0 (0.0%) | 0 (0.0%) |
| Law Enforcement | 0 (0.0%) | 0 (0.0%) |
| Food Preparation & Serving | 0 (0.0%) | 0 (0.0%) |
| Cleaning & Maintenance | 0 (0.0%) | 0 (0.0%) |
| Personal Care & Service | 0 (0.0%) | 0 (0.0%) |
| Total (Category) | 0 (0.0%) | 0 (0.0%) |
| Total (Overall) | 76 (70.4%) | 32 (29.6%) |
Sales and Office Occupations
The most common Sales and Office occupations in Elbert are Office & Administration (12 | 11.1%), and Sales & Related (3 | 2.8%).
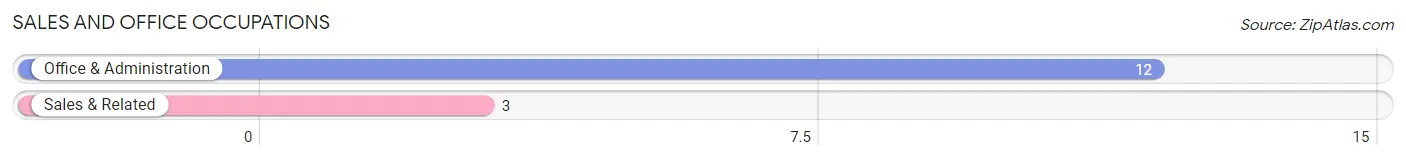
Sales and Office Occupations by Sex

| Occupation | Male | Female |
| Sales & Related | 3 (100.0%) | 0 (0.0%) |
| Office & Administration | 0 (0.0%) | 12 (100.0%) |
| Total (Category) | 3 (20.0%) | 12 (80.0%) |
| Total (Overall) | 76 (70.4%) | 32 (29.6%) |
Natural Resources, Construction and Maintenance Occupations
The most common Natural Resources, Construction and Maintenance occupations in Elbert are Construction & Extraction (16 | 14.8%), and Installation, Maintenance & Repair (13 | 12.0%).
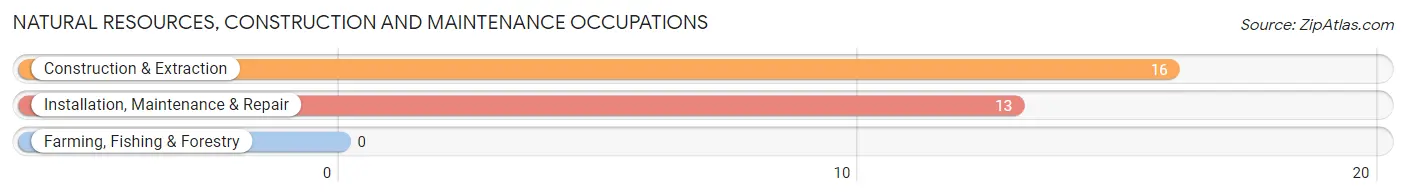
Natural Resources, Construction and Maintenance Occupations by Sex
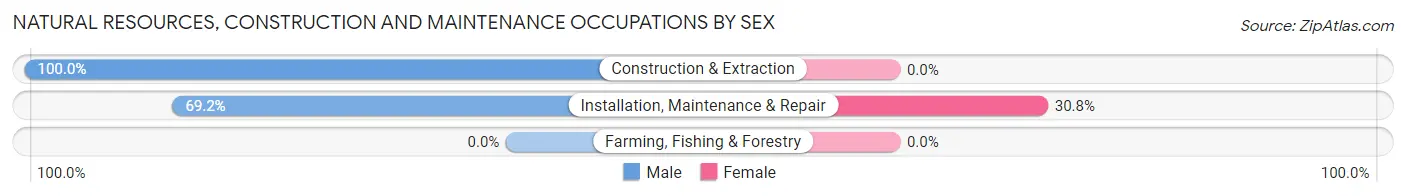
| Occupation | Male | Female |
| Farming, Fishing & Forestry | 0 (0.0%) | 0 (0.0%) |
| Construction & Extraction | 16 (100.0%) | 0 (0.0%) |
| Installation, Maintenance & Repair | 9 (69.2%) | 4 (30.8%) |
| Total (Category) | 25 (86.2%) | 4 (13.8%) |
| Total (Overall) | 76 (70.4%) | 32 (29.6%) |
Production, Transportation and Moving Occupations
The most common Production, Transportation and Moving occupations in Elbert are Material Moving (5 | 4.6%), and Transportation (4 | 3.7%).
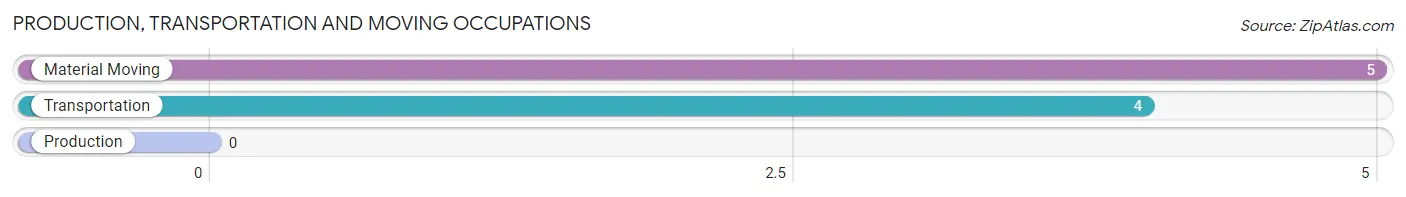
Production, Transportation and Moving Occupations by Sex
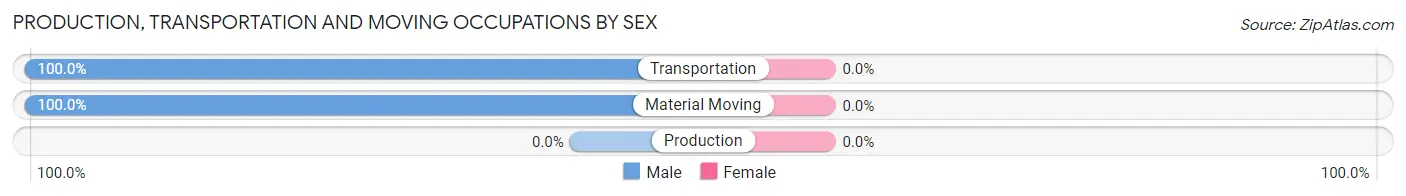
| Occupation | Male | Female |
| Production | 0 (0.0%) | 0 (0.0%) |
| Transportation | 4 (100.0%) | 0 (0.0%) |
| Material Moving | 5 (100.0%) | 0 (0.0%) |
| Total (Category) | 9 (100.0%) | 0 (0.0%) |
| Total (Overall) | 76 (70.4%) | 32 (29.6%) |
Employment Industries by Sex in Elbert
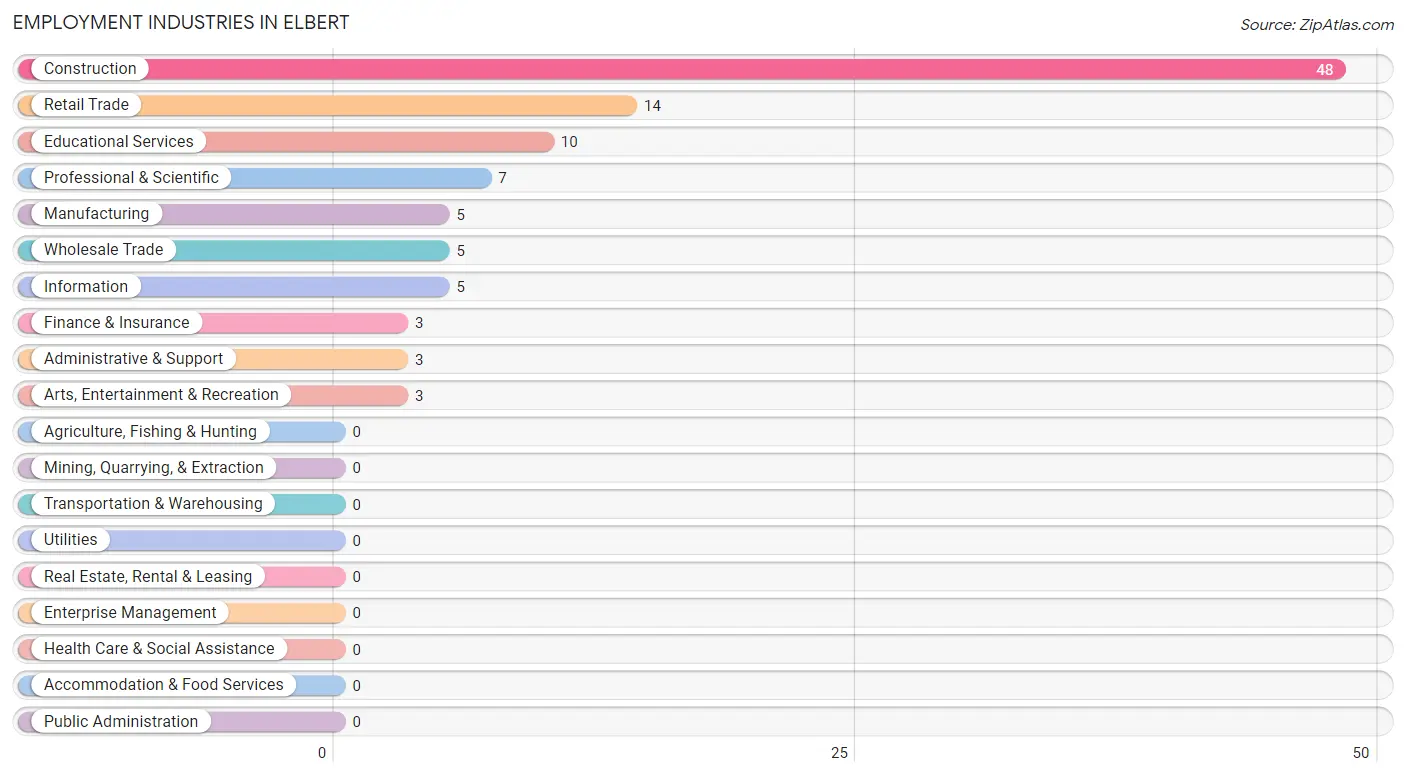
Employment Industries in Elbert
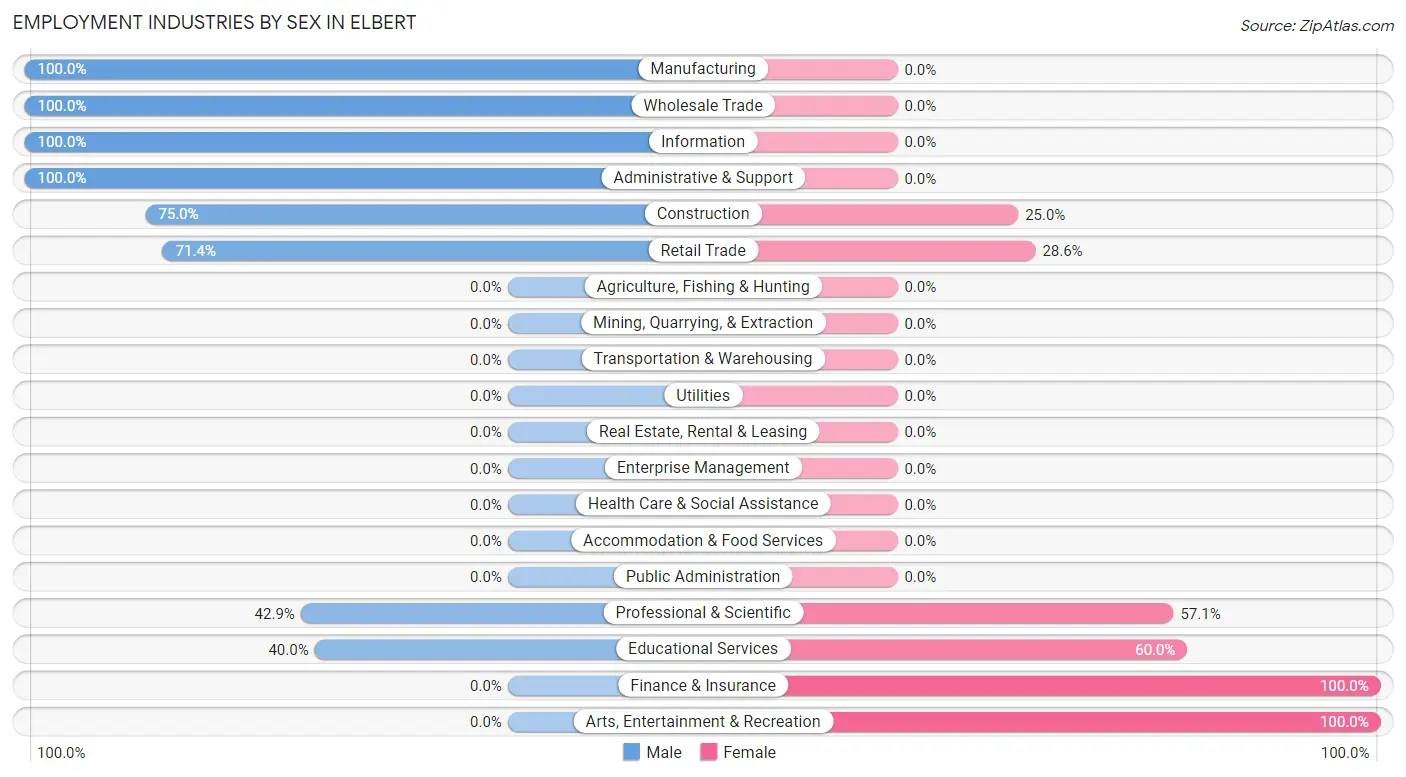
The major employment industries in Elbert include Construction (48 | 44.4%), Retail Trade (14 | 13.0%), Educational Services (10 | 9.3%), Professional & Scientific (7 | 6.5%), and Manufacturing (5 | 4.6%).
Employment Industries by Sex in Elbert
The Elbert industries that see more men than women are Manufacturing (100.0%), Wholesale Trade (100.0%), and Information (100.0%), whereas the industries that tend to have a higher number of women are Finance & Insurance (100.0%), Arts, Entertainment & Recreation (100.0%), and Educational Services (60.0%).
| Industry | Male | Female |
| Agriculture, Fishing & Hunting | 0 (0.0%) | 0 (0.0%) |
| Mining, Quarrying, & Extraction | 0 (0.0%) | 0 (0.0%) |
| Construction | 36 (75.0%) | 12 (25.0%) |
| Manufacturing | 5 (100.0%) | 0 (0.0%) |
| Wholesale Trade | 5 (100.0%) | 0 (0.0%) |
| Retail Trade | 10 (71.4%) | 4 (28.6%) |
| Transportation & Warehousing | 0 (0.0%) | 0 (0.0%) |
| Utilities | 0 (0.0%) | 0 (0.0%) |
| Information | 5 (100.0%) | 0 (0.0%) |
| Finance & Insurance | 0 (0.0%) | 3 (100.0%) |
| Real Estate, Rental & Leasing | 0 (0.0%) | 0 (0.0%) |
| Professional & Scientific | 3 (42.9%) | 4 (57.1%) |
| Enterprise Management | 0 (0.0%) | 0 (0.0%) |
| Administrative & Support | 3 (100.0%) | 0 (0.0%) |
| Educational Services | 4 (40.0%) | 6 (60.0%) |
| Health Care & Social Assistance | 0 (0.0%) | 0 (0.0%) |
| Arts, Entertainment & Recreation | 0 (0.0%) | 3 (100.0%) |
| Accommodation & Food Services | 0 (0.0%) | 0 (0.0%) |
| Public Administration | 0 (0.0%) | 0 (0.0%) |
| Total | 76 (70.4%) | 32 (29.6%) |
Education in Elbert
School Enrollment in Elbert
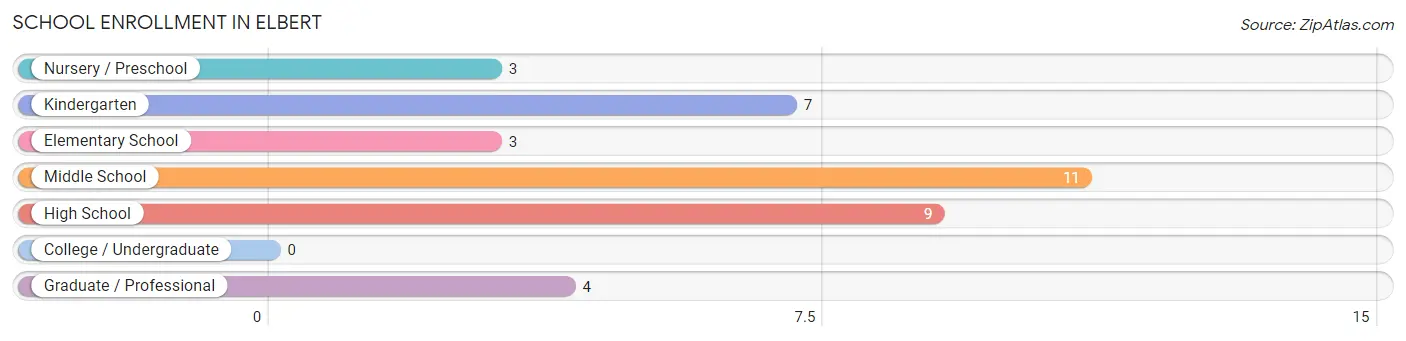
The most common levels of schooling among the 37 students in Elbert are middle school (11 | 29.7%), high school (9 | 24.3%), and kindergarten (7 | 18.9%).
| School Level | # Students | % Students |
| Nursery / Preschool | 3 | 8.1% |
| Kindergarten | 7 | 18.9% |
| Elementary School | 3 | 8.1% |
| Middle School | 11 | 29.7% |
| High School | 9 | 24.3% |
| College / Undergraduate | 0 | 0.0% |
| Graduate / Professional | 4 | 10.8% |
| Total | 37 | 100.0% |
School Enrollment by Age by Funding Source in Elbert
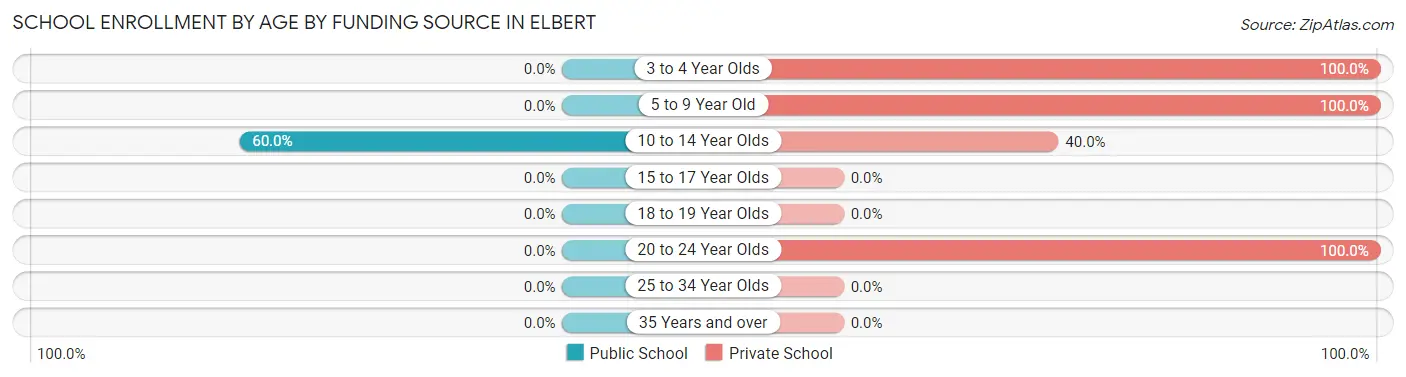
Out of a total of 37 students who are enrolled in schools in Elbert, 25 (67.6%) attend a private institution, while the remaining 12 (32.4%) are enrolled in public schools. The age group of 3 to 4 year olds has the highest likelihood of being enrolled in private schools, with 3 (100.0% in the age bracket) enrolled. Conversely, the age group of 10 to 14 year olds has the lowest likelihood of being enrolled in a private school, with 12 (60.0% in the age bracket) attending a public institution.
| Age Bracket | Public School | Private School |
| 3 to 4 Year Olds | 0 (0.0%) | 3 (100.0%) |
| 5 to 9 Year Old | 0 (0.0%) | 10 (100.0%) |
| 10 to 14 Year Olds | 12 (60.0%) | 8 (40.0%) |
| 15 to 17 Year Olds | 0 (0.0%) | 0 (0.0%) |
| 18 to 19 Year Olds | 0 (0.0%) | 0 (0.0%) |
| 20 to 24 Year Olds | 0 (0.0%) | 4 (100.0%) |
| 25 to 34 Year Olds | 0 (0.0%) | 0 (0.0%) |
| 35 Years and over | 0 (0.0%) | 0 (0.0%) |
| Total | 12 (32.4%) | 25 (67.6%) |
Educational Attainment by Field of Study in Elbert
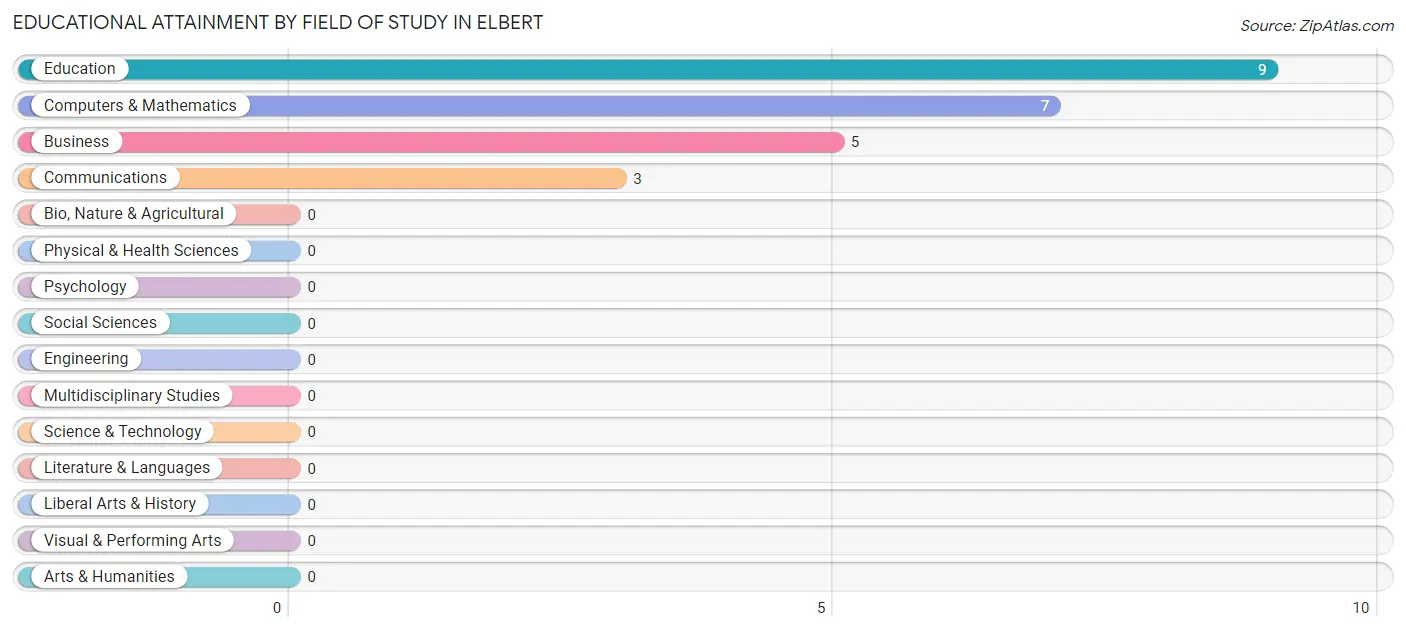
Education (9 | 37.5%), computers & mathematics (7 | 29.2%), business (5 | 20.8%), and communications (3 | 12.5%) are the most common fields of study among 24 individuals in Elbert who have obtained a bachelor's degree or higher.
| Field of Study | # Graduates | % Graduates |
| Computers & Mathematics | 7 | 29.2% |
| Bio, Nature & Agricultural | 0 | 0.0% |
| Physical & Health Sciences | 0 | 0.0% |
| Psychology | 0 | 0.0% |
| Social Sciences | 0 | 0.0% |
| Engineering | 0 | 0.0% |
| Multidisciplinary Studies | 0 | 0.0% |
| Science & Technology | 0 | 0.0% |
| Business | 5 | 20.8% |
| Education | 9 | 37.5% |
| Literature & Languages | 0 | 0.0% |
| Liberal Arts & History | 0 | 0.0% |
| Visual & Performing Arts | 0 | 0.0% |
| Communications | 3 | 12.5% |
| Arts & Humanities | 0 | 0.0% |
| Total | 24 | 100.0% |
Transportation & Commute in Elbert
Vehicle Availability by Sex in Elbert
The most prevalent vehicle ownership categories in Elbert are males with 1 vehicle (28, accounting for 36.8%) and females with 1 vehicle (4, making up 87.5%).
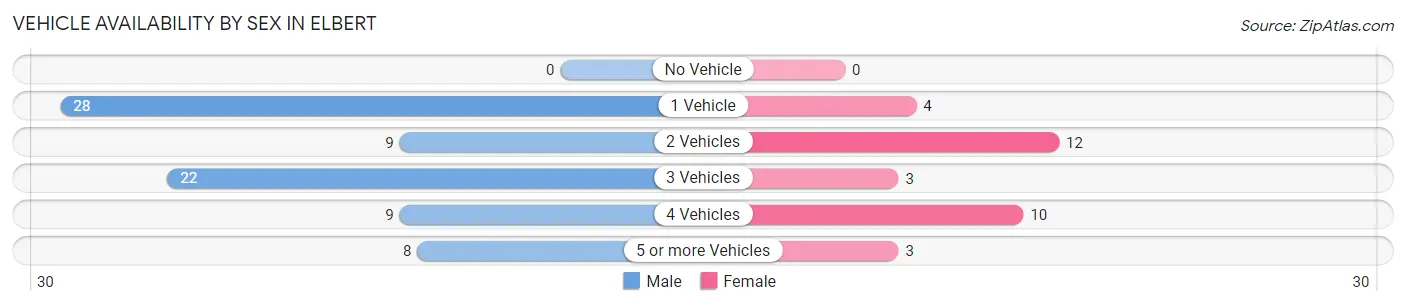
| Vehicles Available | Male | Female |
| No Vehicle | 0 (0.0%) | 0 (0.0%) |
| 1 Vehicle | 28 (36.8%) | 4 (12.5%) |
| 2 Vehicles | 9 (11.8%) | 12 (37.5%) |
| 3 Vehicles | 22 (28.9%) | 3 (9.4%) |
| 4 Vehicles | 9 (11.8%) | 10 (31.2%) |
| 5 or more Vehicles | 8 (10.5%) | 3 (9.4%) |
| Total | 76 (100.0%) | 32 (100.0%) |
Commute Time in Elbert
The most frequently occuring commute durations in Elbert are 60 to 89 minutes (25 commuters, 25.3%), 45 to 59 minutes (23 commuters, 23.2%), and 35 to 39 minutes (16 commuters, 16.2%).
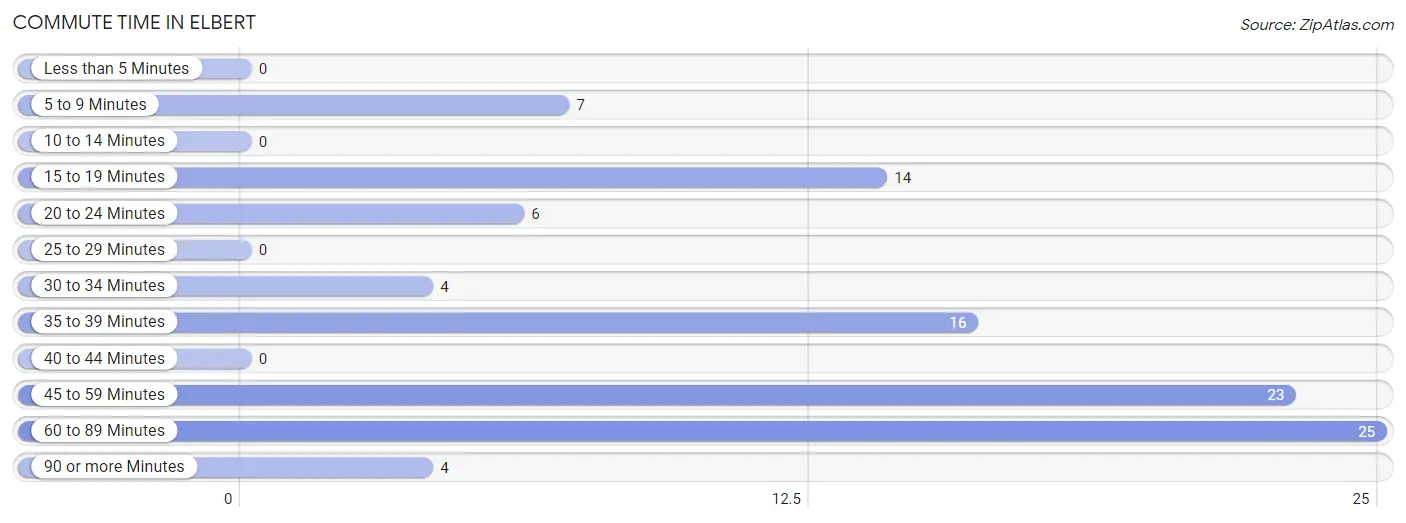
| Commute Time | # Commuters | % Commuters |
| Less than 5 Minutes | 0 | 0.0% |
| 5 to 9 Minutes | 7 | 7.1% |
| 10 to 14 Minutes | 0 | 0.0% |
| 15 to 19 Minutes | 14 | 14.1% |
| 20 to 24 Minutes | 6 | 6.1% |
| 25 to 29 Minutes | 0 | 0.0% |
| 30 to 34 Minutes | 4 | 4.0% |
| 35 to 39 Minutes | 16 | 16.2% |
| 40 to 44 Minutes | 0 | 0.0% |
| 45 to 59 Minutes | 23 | 23.2% |
| 60 to 89 Minutes | 25 | 25.3% |
| 90 or more Minutes | 4 | 4.0% |
Commute Time by Sex in Elbert
The most common commute times in Elbert are 60 to 89 minutes (22 commuters, 31.4%) for males and 45 to 59 minutes (12 commuters, 41.4%) for females.
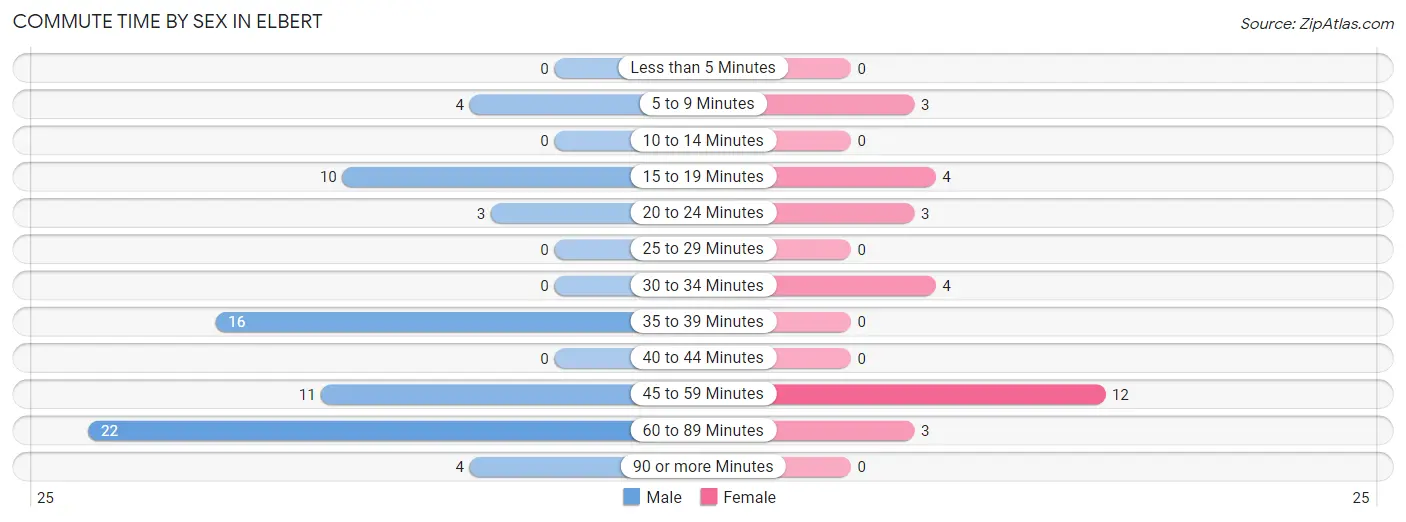
| Commute Time | Male | Female |
| Less than 5 Minutes | 0 (0.0%) | 0 (0.0%) |
| 5 to 9 Minutes | 4 (5.7%) | 3 (10.3%) |
| 10 to 14 Minutes | 0 (0.0%) | 0 (0.0%) |
| 15 to 19 Minutes | 10 (14.3%) | 4 (13.8%) |
| 20 to 24 Minutes | 3 (4.3%) | 3 (10.3%) |
| 25 to 29 Minutes | 0 (0.0%) | 0 (0.0%) |
| 30 to 34 Minutes | 0 (0.0%) | 4 (13.8%) |
| 35 to 39 Minutes | 16 (22.9%) | 0 (0.0%) |
| 40 to 44 Minutes | 0 (0.0%) | 0 (0.0%) |
| 45 to 59 Minutes | 11 (15.7%) | 12 (41.4%) |
| 60 to 89 Minutes | 22 (31.4%) | 3 (10.3%) |
| 90 or more Minutes | 4 (5.7%) | 0 (0.0%) |
Time of Departure to Work by Sex in Elbert
The most frequent times of departure to work in Elbert are 5:30 AM to 5:59 AM (20, 28.6%) for males and 7:30 AM to 7:59 AM (9, 31.0%) for females.
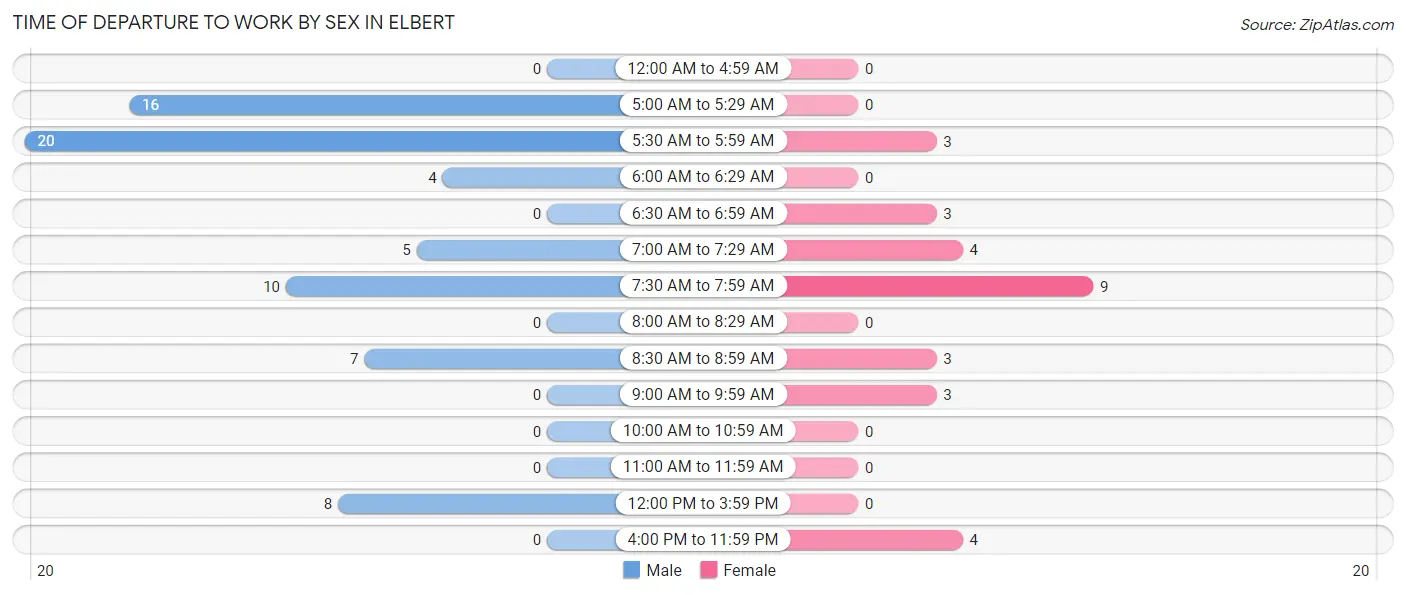
| Time of Departure | Male | Female |
| 12:00 AM to 4:59 AM | 0 (0.0%) | 0 (0.0%) |
| 5:00 AM to 5:29 AM | 16 (22.9%) | 0 (0.0%) |
| 5:30 AM to 5:59 AM | 20 (28.6%) | 3 (10.3%) |
| 6:00 AM to 6:29 AM | 4 (5.7%) | 0 (0.0%) |
| 6:30 AM to 6:59 AM | 0 (0.0%) | 3 (10.3%) |
| 7:00 AM to 7:29 AM | 5 (7.1%) | 4 (13.8%) |
| 7:30 AM to 7:59 AM | 10 (14.3%) | 9 (31.0%) |
| 8:00 AM to 8:29 AM | 0 (0.0%) | 0 (0.0%) |
| 8:30 AM to 8:59 AM | 7 (10.0%) | 3 (10.3%) |
| 9:00 AM to 9:59 AM | 0 (0.0%) | 3 (10.3%) |
| 10:00 AM to 10:59 AM | 0 (0.0%) | 0 (0.0%) |
| 11:00 AM to 11:59 AM | 0 (0.0%) | 0 (0.0%) |
| 12:00 PM to 3:59 PM | 8 (11.4%) | 0 (0.0%) |
| 4:00 PM to 11:59 PM | 0 (0.0%) | 4 (13.8%) |
| Total | 70 (100.0%) | 29 (100.0%) |
Housing Occupancy in Elbert
Occupancy by Ownership in Elbert
Of the total 98 dwellings in Elbert, owner-occupied units account for 85 (86.7%), while renter-occupied units make up 13 (13.3%).
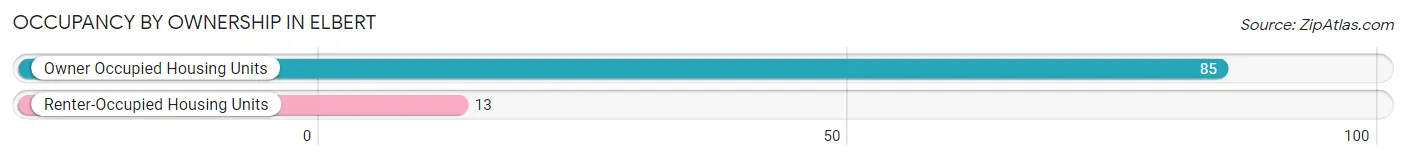
| Occupancy | # Housing Units | % Housing Units |
| Owner Occupied Housing Units | 85 | 86.7% |
| Renter-Occupied Housing Units | 13 | 13.3% |
| Total Occupied Housing Units | 98 | 100.0% |
Occupancy by Household Size in Elbert
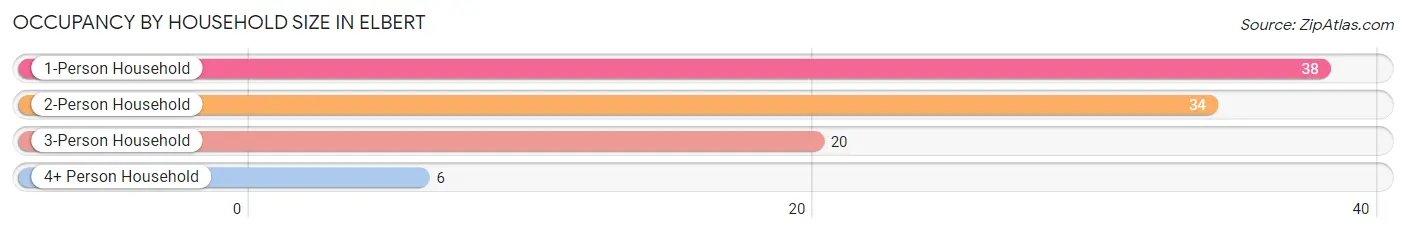
| Household Size | # Housing Units | % Housing Units |
| 1-Person Household | 38 | 38.8% |
| 2-Person Household | 34 | 34.7% |
| 3-Person Household | 20 | 20.4% |
| 4+ Person Household | 6 | 6.1% |
| Total Housing Units | 98 | 100.0% |
Occupancy by Ownership by Household Size in Elbert
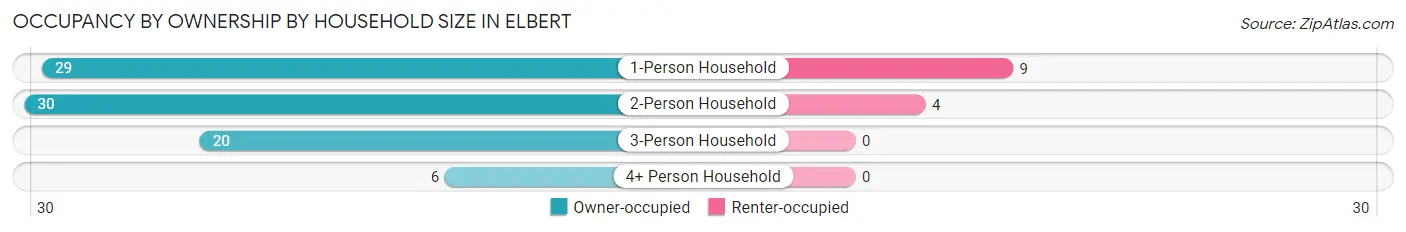
| Household Size | Owner-occupied | Renter-occupied |
| 1-Person Household | 29 (76.3%) | 9 (23.7%) |
| 2-Person Household | 30 (88.2%) | 4 (11.8%) |
| 3-Person Household | 20 (100.0%) | 0 (0.0%) |
| 4+ Person Household | 6 (100.0%) | 0 (0.0%) |
| Total Housing Units | 85 (86.7%) | 13 (13.3%) |
Occupancy by Educational Attainment in Elbert
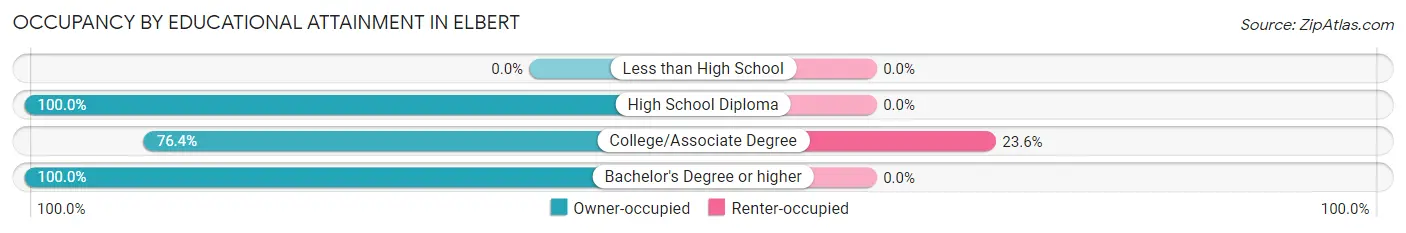
| Household Size | Owner-occupied | Renter-occupied |
| Less than High School | 0 (0.0%) | 0 (0.0%) |
| High School Diploma | 34 (100.0%) | 0 (0.0%) |
| College/Associate Degree | 42 (76.4%) | 13 (23.6%) |
| Bachelor's Degree or higher | 9 (100.0%) | 0 (0.0%) |
Occupancy by Age of Householder in Elbert
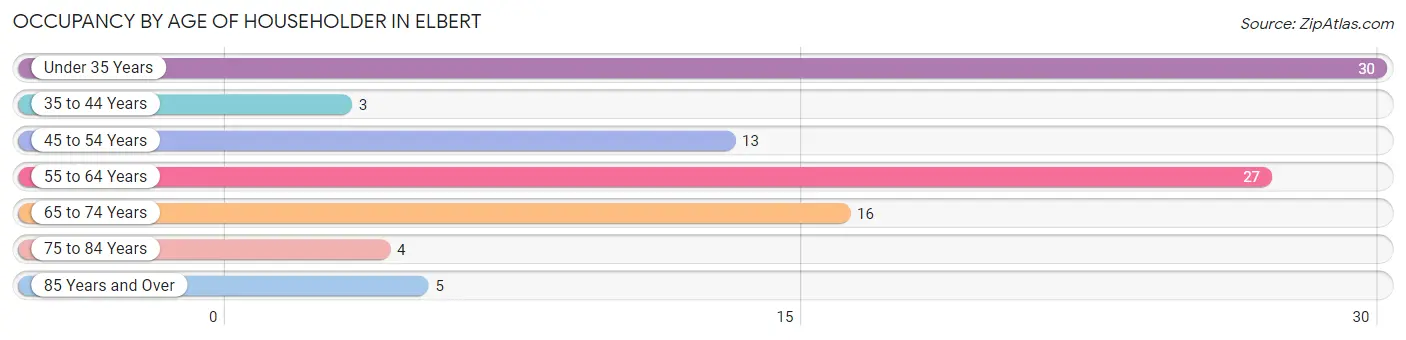
| Age Bracket | # Households | % Households |
| Under 35 Years | 30 | 30.6% |
| 35 to 44 Years | 3 | 3.1% |
| 45 to 54 Years | 13 | 13.3% |
| 55 to 64 Years | 27 | 27.6% |
| 65 to 74 Years | 16 | 16.3% |
| 75 to 84 Years | 4 | 4.1% |
| 85 Years and Over | 5 | 5.1% |
| Total | 98 | 100.0% |
Housing Finances in Elbert
Median Income by Occupancy in Elbert
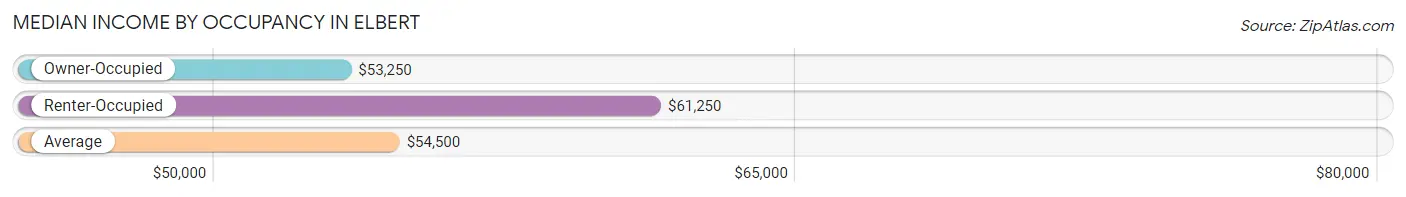
| Occupancy Type | # Households | Median Income |
| Owner-Occupied | 85 (86.7%) | $53,250 |
| Renter-Occupied | 13 (13.3%) | $61,250 |
| Average | 98 (100.0%) | $54,500 |
Occupancy by Householder Income Bracket in Elbert
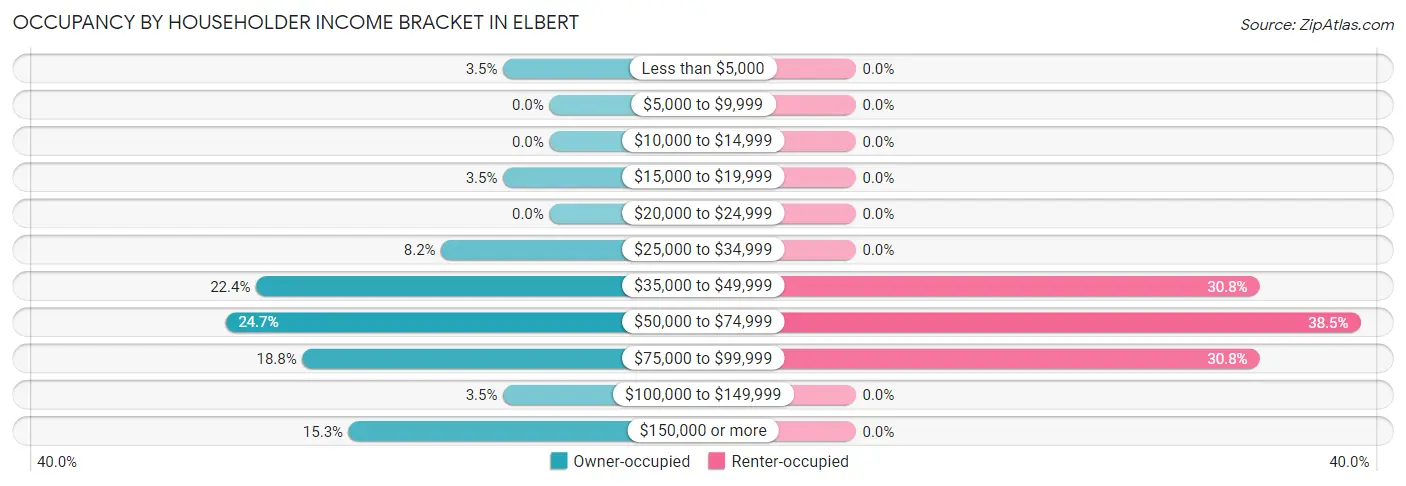
| Income Bracket | Owner-occupied | Renter-occupied |
| Less than $5,000 | 3 (3.5%) | 0 (0.0%) |
| $5,000 to $9,999 | 0 (0.0%) | 0 (0.0%) |
| $10,000 to $14,999 | 0 (0.0%) | 0 (0.0%) |
| $15,000 to $19,999 | 3 (3.5%) | 0 (0.0%) |
| $20,000 to $24,999 | 0 (0.0%) | 0 (0.0%) |
| $25,000 to $34,999 | 7 (8.2%) | 0 (0.0%) |
| $35,000 to $49,999 | 19 (22.4%) | 4 (30.8%) |
| $50,000 to $74,999 | 21 (24.7%) | 5 (38.5%) |
| $75,000 to $99,999 | 16 (18.8%) | 4 (30.8%) |
| $100,000 to $149,999 | 3 (3.5%) | 0 (0.0%) |
| $150,000 or more | 13 (15.3%) | 0 (0.0%) |
| Total | 85 (100.0%) | 13 (100.0%) |
Monthly Housing Cost Tiers in Elbert
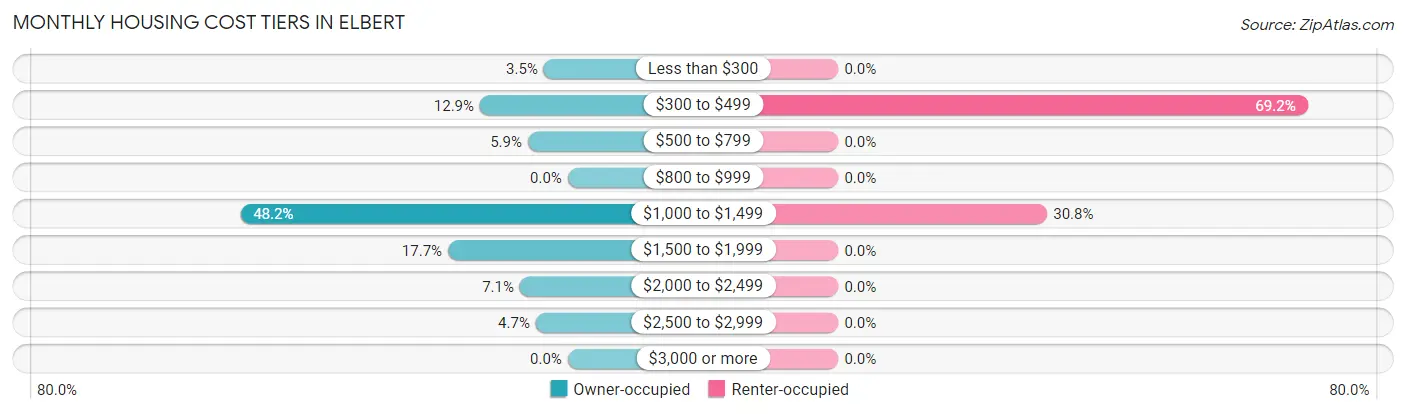
| Monthly Cost | Owner-occupied | Renter-occupied |
| Less than $300 | 3 (3.5%) | 0 (0.0%) |
| $300 to $499 | 11 (12.9%) | 9 (69.2%) |
| $500 to $799 | 5 (5.9%) | 0 (0.0%) |
| $800 to $999 | 0 (0.0%) | 0 (0.0%) |
| $1,000 to $1,499 | 41 (48.2%) | 4 (30.8%) |
| $1,500 to $1,999 | 15 (17.6%) | 0 (0.0%) |
| $2,000 to $2,499 | 6 (7.1%) | 0 (0.0%) |
| $2,500 to $2,999 | 4 (4.7%) | 0 (0.0%) |
| $3,000 or more | 0 (0.0%) | 0 (0.0%) |
| Total | 85 (100.0%) | 13 (100.0%) |
Physical Housing Characteristics in Elbert
Housing Structures in Elbert
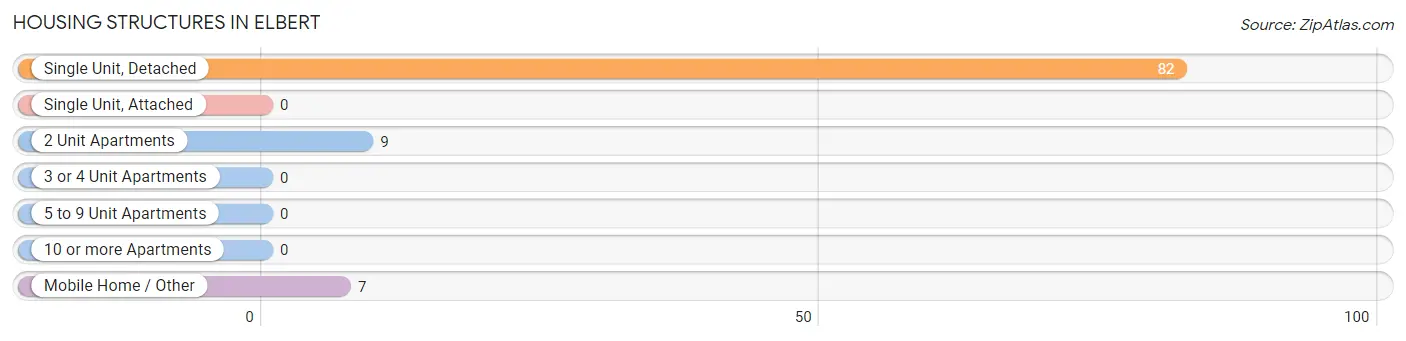
| Structure Type | # Housing Units | % Housing Units |
| Single Unit, Detached | 82 | 83.7% |
| Single Unit, Attached | 0 | 0.0% |
| 2 Unit Apartments | 9 | 9.2% |
| 3 or 4 Unit Apartments | 0 | 0.0% |
| 5 to 9 Unit Apartments | 0 | 0.0% |
| 10 or more Apartments | 0 | 0.0% |
| Mobile Home / Other | 7 | 7.1% |
| Total | 98 | 100.0% |
Housing Structures by Occupancy in Elbert
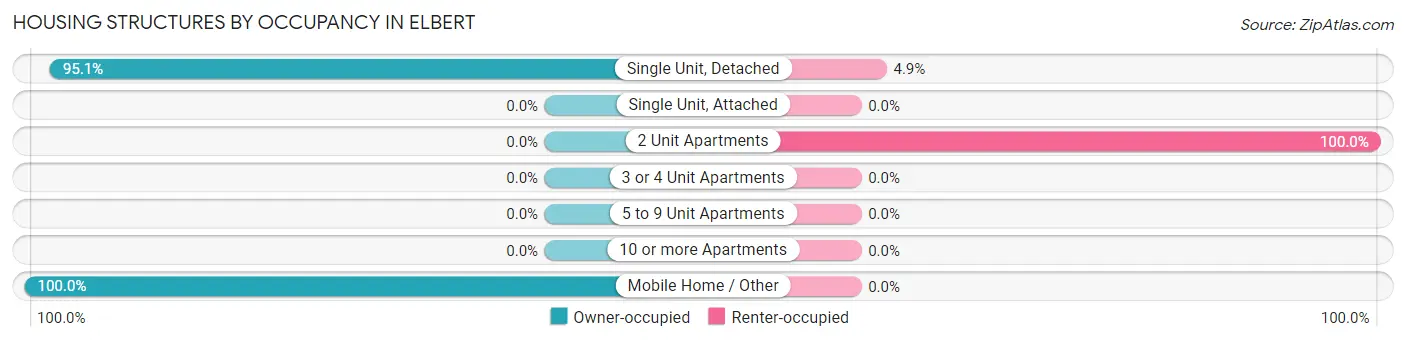
| Structure Type | Owner-occupied | Renter-occupied |
| Single Unit, Detached | 78 (95.1%) | 4 (4.9%) |
| Single Unit, Attached | 0 (0.0%) | 0 (0.0%) |
| 2 Unit Apartments | 0 (0.0%) | 9 (100.0%) |
| 3 or 4 Unit Apartments | 0 (0.0%) | 0 (0.0%) |
| 5 to 9 Unit Apartments | 0 (0.0%) | 0 (0.0%) |
| 10 or more Apartments | 0 (0.0%) | 0 (0.0%) |
| Mobile Home / Other | 7 (100.0%) | 0 (0.0%) |
| Total | 85 (86.7%) | 13 (13.3%) |
Housing Structures by Number of Rooms in Elbert
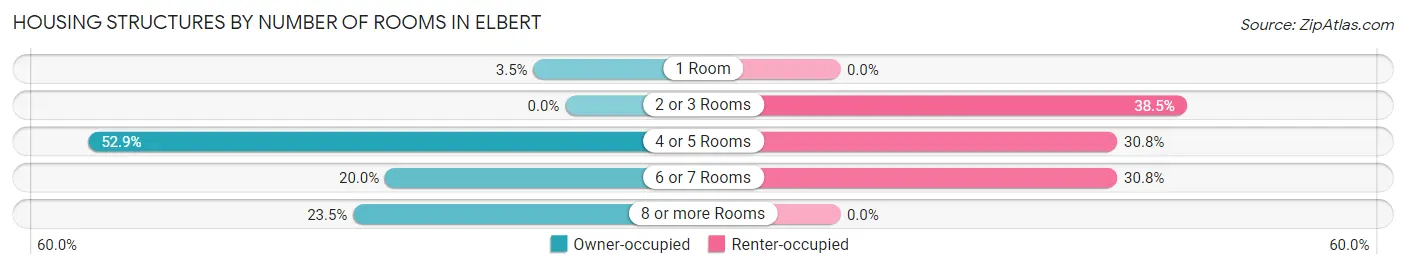
| Number of Rooms | Owner-occupied | Renter-occupied |
| 1 Room | 3 (3.5%) | 0 (0.0%) |
| 2 or 3 Rooms | 0 (0.0%) | 5 (38.5%) |
| 4 or 5 Rooms | 45 (52.9%) | 4 (30.8%) |
| 6 or 7 Rooms | 17 (20.0%) | 4 (30.8%) |
| 8 or more Rooms | 20 (23.5%) | 0 (0.0%) |
| Total | 85 (100.0%) | 13 (100.0%) |
Housing Structure by Heating Type in Elbert
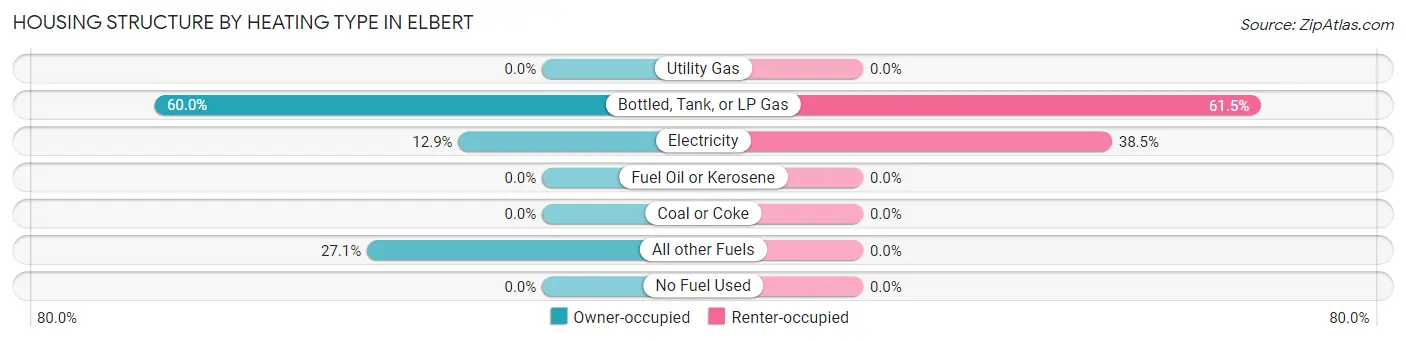
| Heating Type | Owner-occupied | Renter-occupied |
| Utility Gas | 0 (0.0%) | 0 (0.0%) |
| Bottled, Tank, or LP Gas | 51 (60.0%) | 8 (61.5%) |
| Electricity | 11 (12.9%) | 5 (38.5%) |
| Fuel Oil or Kerosene | 0 (0.0%) | 0 (0.0%) |
| Coal or Coke | 0 (0.0%) | 0 (0.0%) |
| All other Fuels | 23 (27.1%) | 0 (0.0%) |
| No Fuel Used | 0 (0.0%) | 0 (0.0%) |
| Total | 85 (100.0%) | 13 (100.0%) |
Household Vehicle Usage in Elbert
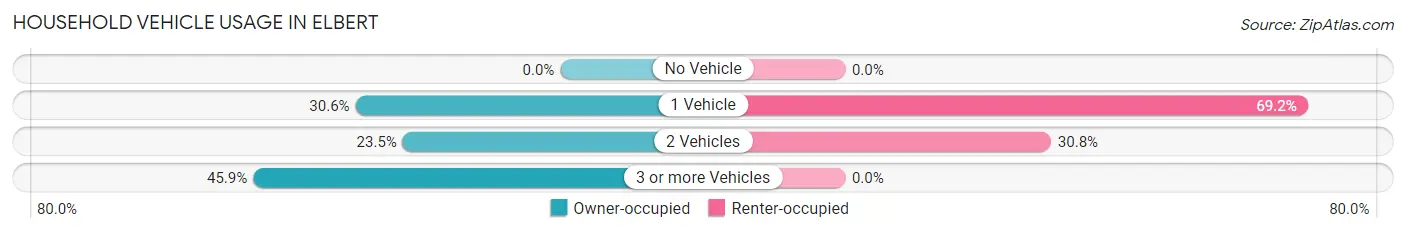
| Vehicles per Household | Owner-occupied | Renter-occupied |
| No Vehicle | 0 (0.0%) | 0 (0.0%) |
| 1 Vehicle | 26 (30.6%) | 9 (69.2%) |
| 2 Vehicles | 20 (23.5%) | 4 (30.8%) |
| 3 or more Vehicles | 39 (45.9%) | 0 (0.0%) |
| Total | 85 (100.0%) | 13 (100.0%) |
Real Estate & Mortgages in Elbert
Real Estate and Mortgage Overview in Elbert
| Characteristic | Without Mortgage | With Mortgage |
| Housing Units | 19 | 66 |
| Median Property Value | - | - |
| Median Household Income | $34,821 | $13 |
| Monthly Housing Costs | $346 | $0 |
| Real Estate Taxes | $900 | $0 |
Property Value by Mortgage Status in Elbert
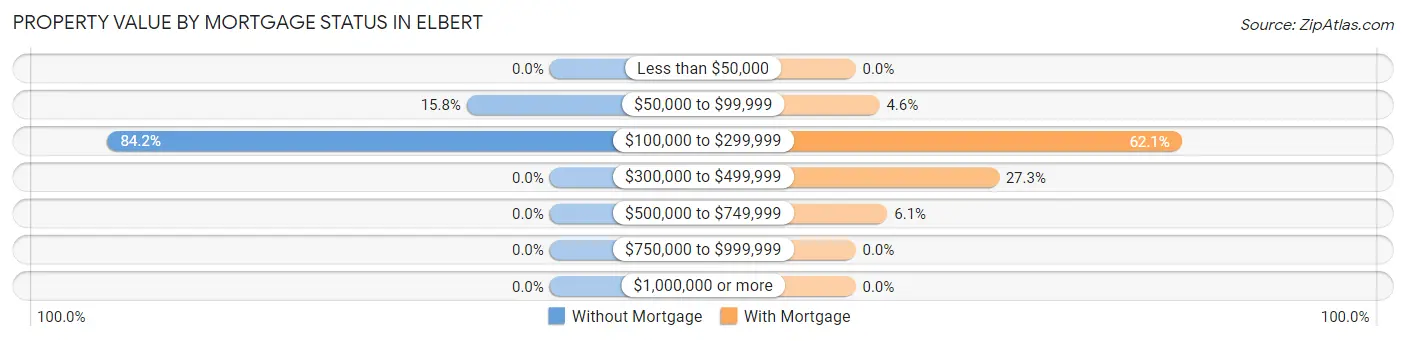
| Property Value | Without Mortgage | With Mortgage |
| Less than $50,000 | 0 (0.0%) | 0 (0.0%) |
| $50,000 to $99,999 | 3 (15.8%) | 3 (4.5%) |
| $100,000 to $299,999 | 16 (84.2%) | 41 (62.1%) |
| $300,000 to $499,999 | 0 (0.0%) | 18 (27.3%) |
| $500,000 to $749,999 | 0 (0.0%) | 4 (6.1%) |
| $750,000 to $999,999 | 0 (0.0%) | 0 (0.0%) |
| $1,000,000 or more | 0 (0.0%) | 0 (0.0%) |
| Total | 19 (100.0%) | 66 (100.0%) |
Household Income by Mortgage Status in Elbert
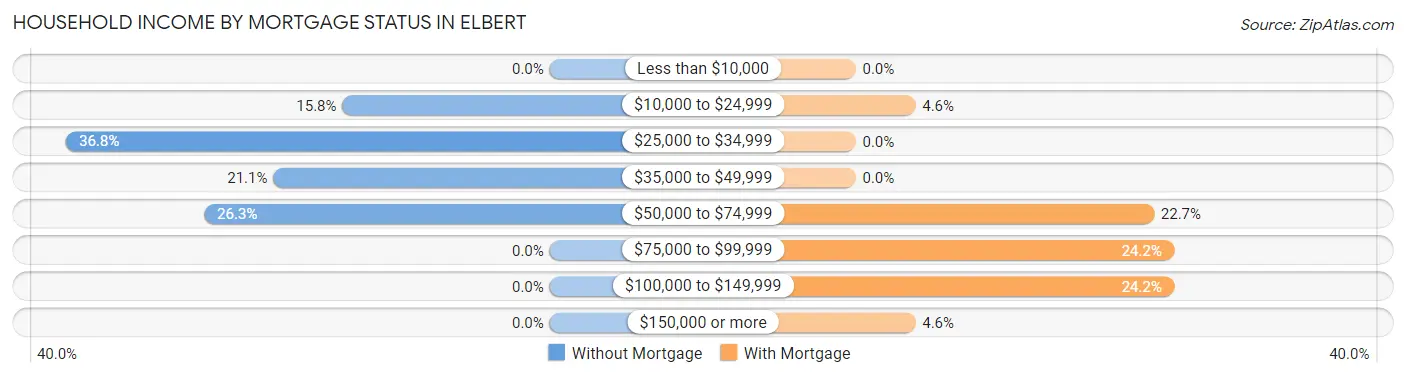
| Household Income | Without Mortgage | With Mortgage |
| Less than $10,000 | 0 (0.0%) | 0 (0.0%) |
| $10,000 to $24,999 | 3 (15.8%) | 3 (4.5%) |
| $25,000 to $34,999 | 7 (36.8%) | 0 (0.0%) |
| $35,000 to $49,999 | 4 (21.0%) | 0 (0.0%) |
| $50,000 to $74,999 | 5 (26.3%) | 15 (22.7%) |
| $75,000 to $99,999 | 0 (0.0%) | 16 (24.2%) |
| $100,000 to $149,999 | 0 (0.0%) | 16 (24.2%) |
| $150,000 or more | 0 (0.0%) | 3 (4.5%) |
| Total | 19 (100.0%) | 66 (100.0%) |
Property Value to Household Income Ratio in Elbert
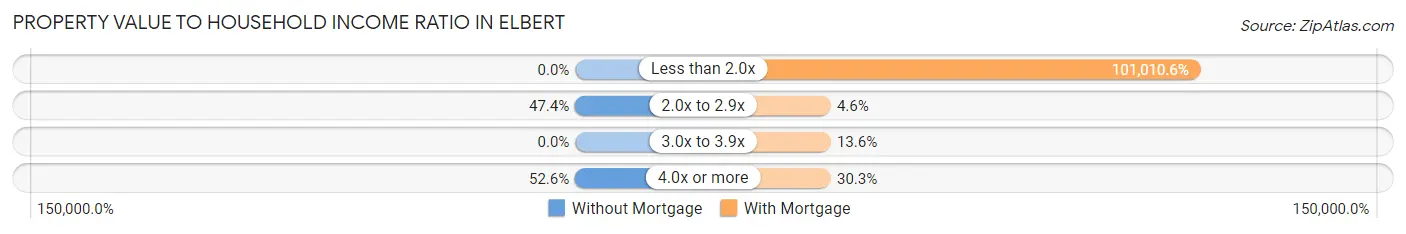
| Value-to-Income Ratio | Without Mortgage | With Mortgage |
| Less than 2.0x | 0 (0.0%) | 66,667 (101,010.6%) |
| 2.0x to 2.9x | 9 (47.4%) | 3 (4.5%) |
| 3.0x to 3.9x | 0 (0.0%) | 9 (13.6%) |
| 4.0x or more | 10 (52.6%) | 20 (30.3%) |
| Total | 19 (100.0%) | 66 (100.0%) |
Real Estate Taxes by Mortgage Status in Elbert
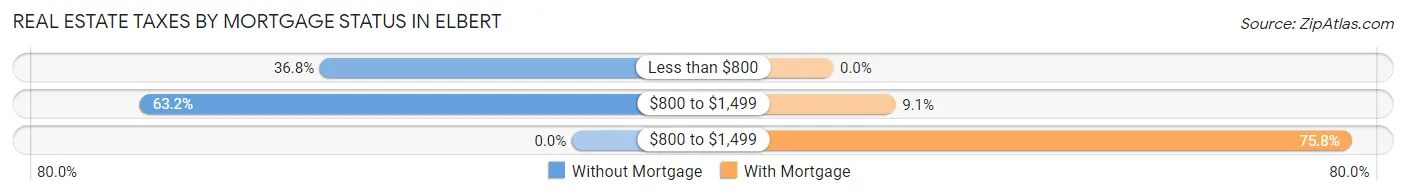
| Property Taxes | Without Mortgage | With Mortgage |
| Less than $800 | 7 (36.8%) | 0 (0.0%) |
| $800 to $1,499 | 12 (63.2%) | 6 (9.1%) |
| $800 to $1,499 | 0 (0.0%) | 50 (75.8%) |
| Total | 19 (100.0%) | 66 (100.0%) |
Health & Disability in Elbert
Health Insurance Coverage by Age in Elbert
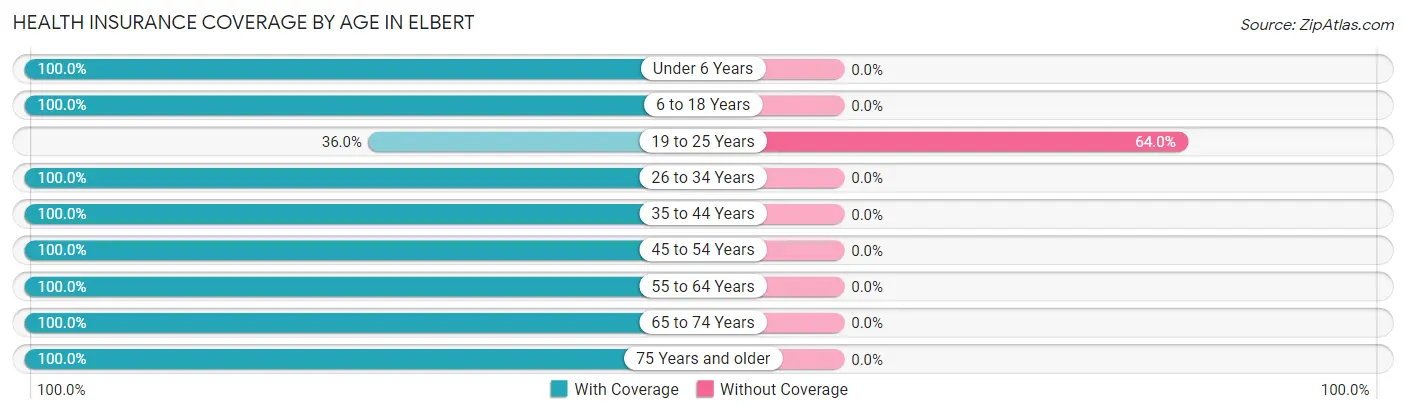
| Age Bracket | With Coverage | Without Coverage |
| Under 6 Years | 10 (100.0%) | 0 (0.0%) |
| 6 to 18 Years | 23 (100.0%) | 0 (0.0%) |
| 19 to 25 Years | 9 (36.0%) | 16 (64.0%) |
| 26 to 34 Years | 42 (100.0%) | 0 (0.0%) |
| 35 to 44 Years | 8 (100.0%) | 0 (0.0%) |
| 45 to 54 Years | 17 (100.0%) | 0 (0.0%) |
| 55 to 64 Years | 39 (100.0%) | 0 (0.0%) |
| 65 to 74 Years | 26 (100.0%) | 0 (0.0%) |
| 75 Years and older | 13 (100.0%) | 0 (0.0%) |
| Total | 187 (92.1%) | 16 (7.9%) |
Health Insurance Coverage by Citizenship Status in Elbert
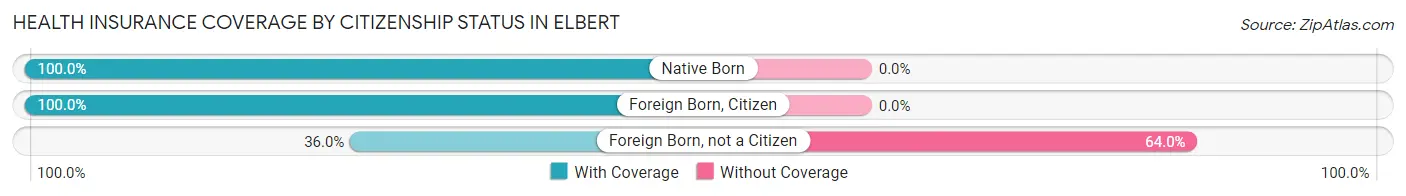
| Citizenship Status | With Coverage | Without Coverage |
| Native Born | 10 (100.0%) | 0 (0.0%) |
| Foreign Born, Citizen | 23 (100.0%) | 0 (0.0%) |
| Foreign Born, not a Citizen | 9 (36.0%) | 16 (64.0%) |
Health Insurance Coverage by Household Income in Elbert
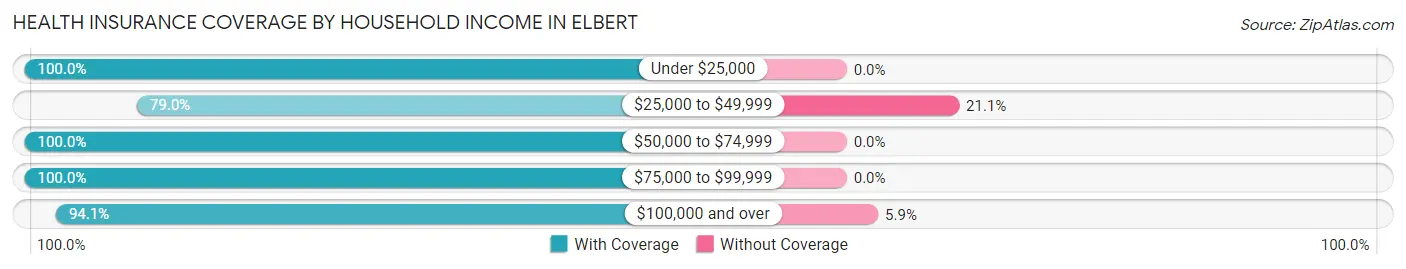
| Household Income | With Coverage | Without Coverage |
| Under $25,000 | 6 (100.0%) | 0 (0.0%) |
| $25,000 to $49,999 | 45 (78.9%) | 12 (21.0%) |
| $50,000 to $74,999 | 49 (100.0%) | 0 (0.0%) |
| $75,000 to $99,999 | 23 (100.0%) | 0 (0.0%) |
| $100,000 and over | 64 (94.1%) | 4 (5.9%) |
Public vs Private Health Insurance Coverage by Age in Elbert
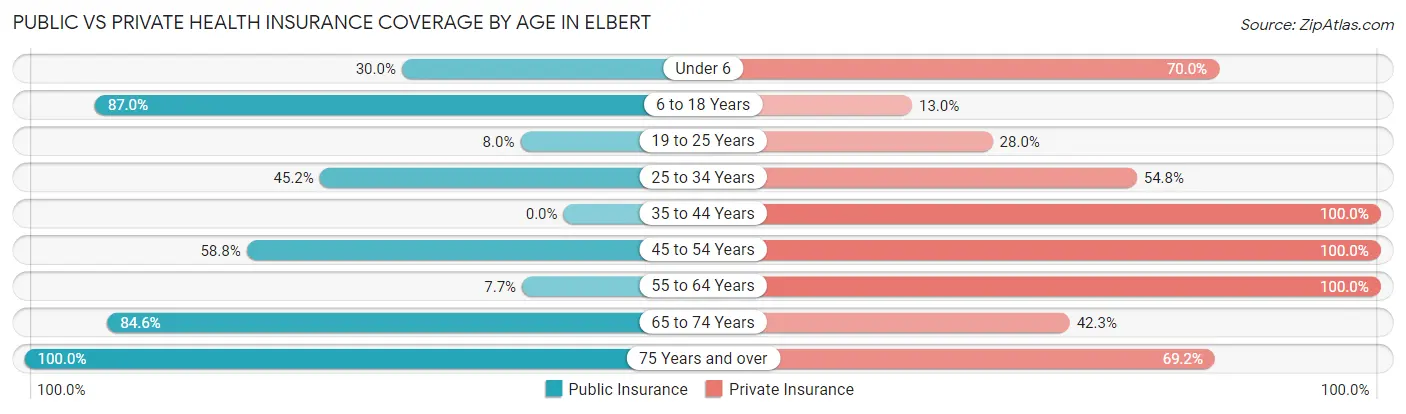
| Age Bracket | Public Insurance | Private Insurance |
| Under 6 | 3 (30.0%) | 7 (70.0%) |
| 6 to 18 Years | 20 (87.0%) | 3 (13.0%) |
| 19 to 25 Years | 2 (8.0%) | 7 (28.0%) |
| 25 to 34 Years | 19 (45.2%) | 23 (54.8%) |
| 35 to 44 Years | 0 (0.0%) | 8 (100.0%) |
| 45 to 54 Years | 10 (58.8%) | 17 (100.0%) |
| 55 to 64 Years | 3 (7.7%) | 39 (100.0%) |
| 65 to 74 Years | 22 (84.6%) | 11 (42.3%) |
| 75 Years and over | 13 (100.0%) | 9 (69.2%) |
| Total | 92 (45.3%) | 124 (61.1%) |
Disability Status by Sex by Age in Elbert
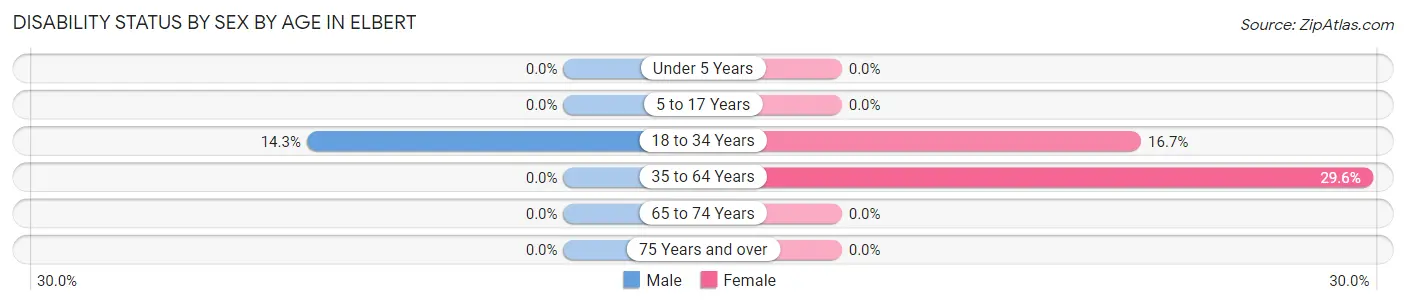
| Age Bracket | Male | Female |
| Under 5 Years | 0 (0.0%) | 0 (0.0%) |
| 5 to 17 Years | 0 (0.0%) | 0 (0.0%) |
| 18 to 34 Years | 7 (14.3%) | 3 (16.7%) |
| 35 to 64 Years | 0 (0.0%) | 13 (29.5%) |
| 65 to 74 Years | 0 (0.0%) | 0 (0.0%) |
| 75 Years and over | 0 (0.0%) | 0 (0.0%) |
Disability Class by Sex by Age in Elbert
Disability Class: Hearing Difficulty
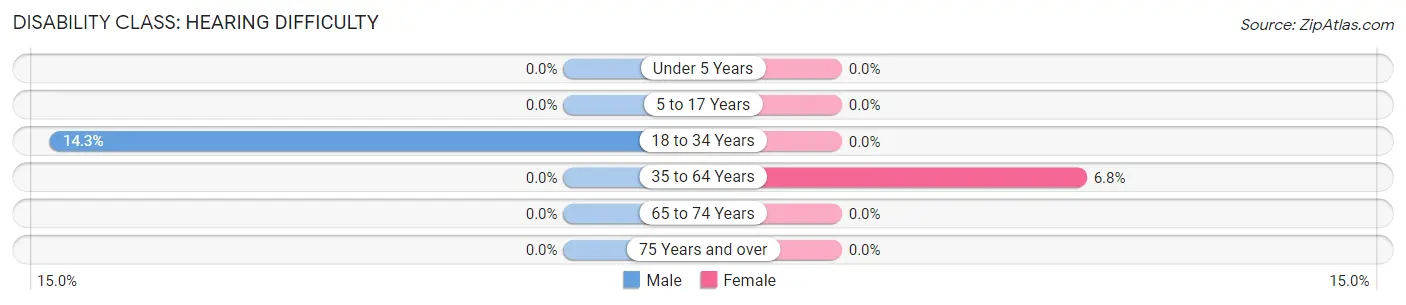
| Age Bracket | Male | Female |
| Under 5 Years | 0 (0.0%) | 0 (0.0%) |
| 5 to 17 Years | 0 (0.0%) | 0 (0.0%) |
| 18 to 34 Years | 7 (14.3%) | 0 (0.0%) |
| 35 to 64 Years | 0 (0.0%) | 3 (6.8%) |
| 65 to 74 Years | 0 (0.0%) | 0 (0.0%) |
| 75 Years and over | 0 (0.0%) | 0 (0.0%) |
Disability Class: Vision Difficulty
| Age Bracket | Male | Female |
| Under 5 Years | 0 (0.0%) | 0 (0.0%) |
| 5 to 17 Years | 0 (0.0%) | 0 (0.0%) |
| 18 to 34 Years | 0 (0.0%) | 0 (0.0%) |
| 35 to 64 Years | 0 (0.0%) | 0 (0.0%) |
| 65 to 74 Years | 0 (0.0%) | 0 (0.0%) |
| 75 Years and over | 0 (0.0%) | 0 (0.0%) |
Disability Class: Cognitive Difficulty
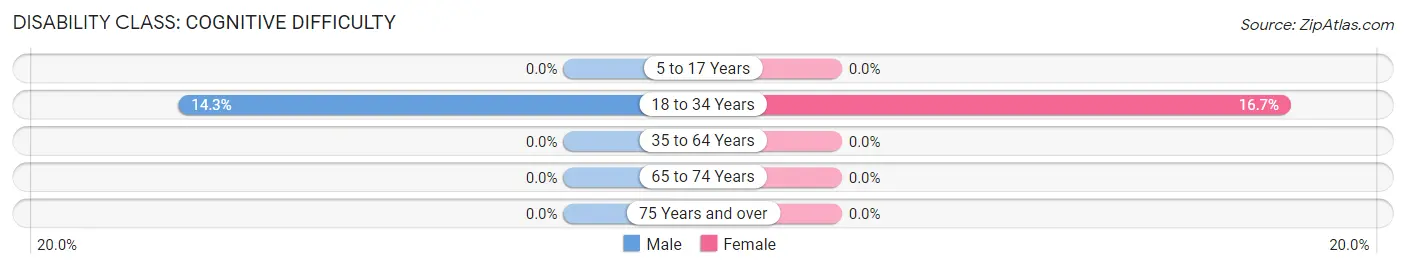
| Age Bracket | Male | Female |
| 5 to 17 Years | 0 (0.0%) | 0 (0.0%) |
| 18 to 34 Years | 7 (14.3%) | 3 (16.7%) |
| 35 to 64 Years | 0 (0.0%) | 0 (0.0%) |
| 65 to 74 Years | 0 (0.0%) | 0 (0.0%) |
| 75 Years and over | 0 (0.0%) | 0 (0.0%) |
Disability Class: Ambulatory Difficulty
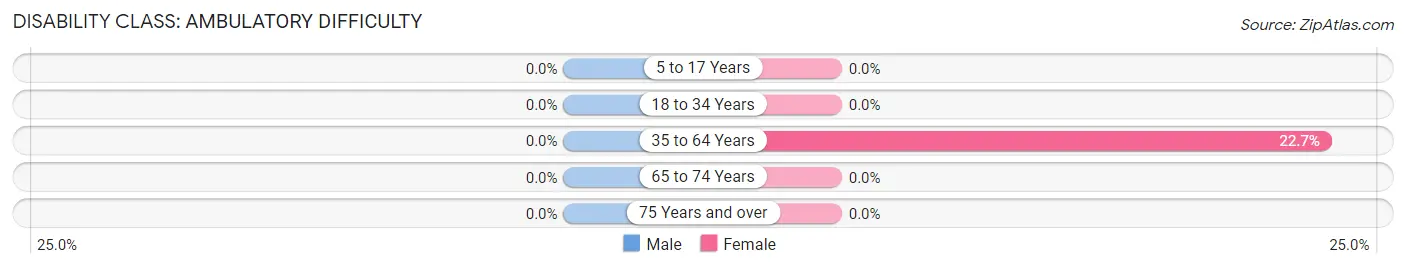
| Age Bracket | Male | Female |
| 5 to 17 Years | 0 (0.0%) | 0 (0.0%) |
| 18 to 34 Years | 0 (0.0%) | 0 (0.0%) |
| 35 to 64 Years | 0 (0.0%) | 10 (22.7%) |
| 65 to 74 Years | 0 (0.0%) | 0 (0.0%) |
| 75 Years and over | 0 (0.0%) | 0 (0.0%) |
Disability Class: Self-Care Difficulty
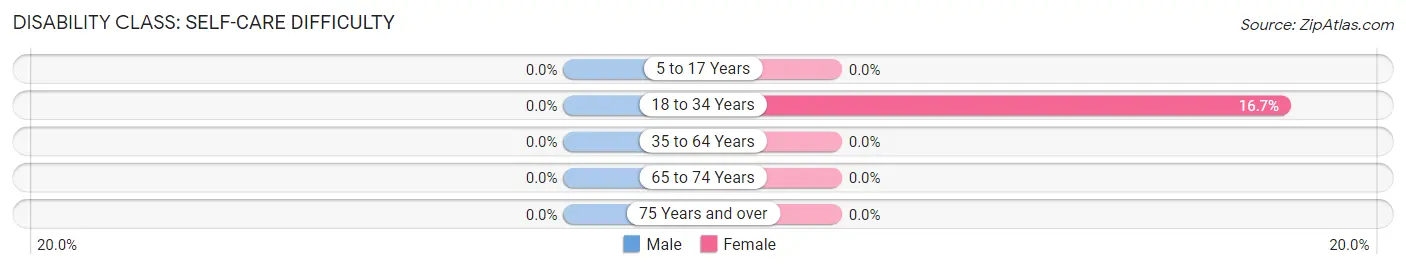
| Age Bracket | Male | Female |
| 5 to 17 Years | 0 (0.0%) | 0 (0.0%) |
| 18 to 34 Years | 0 (0.0%) | 3 (16.7%) |
| 35 to 64 Years | 0 (0.0%) | 0 (0.0%) |
| 65 to 74 Years | 0 (0.0%) | 0 (0.0%) |
| 75 Years and over | 0 (0.0%) | 0 (0.0%) |
Technology Access in Elbert
Computing Device Access in Elbert
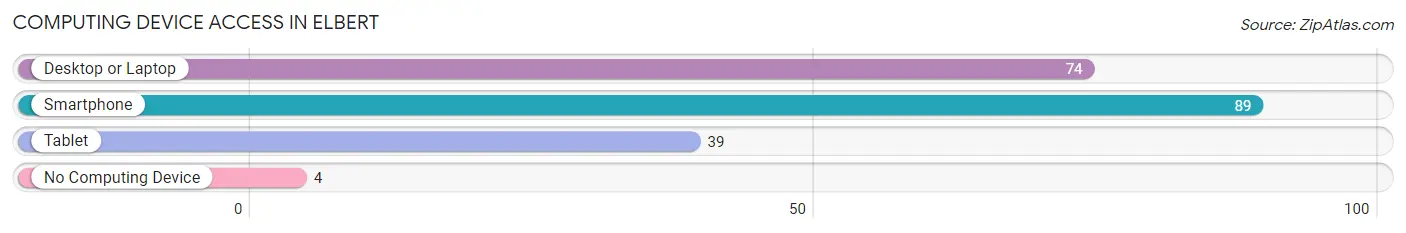
| Device Type | # Households | % Households |
| Desktop or Laptop | 74 | 75.5% |
| Smartphone | 89 | 90.8% |
| Tablet | 39 | 39.8% |
| No Computing Device | 4 | 4.1% |
| Total | 98 | 100.0% |
Internet Access in Elbert
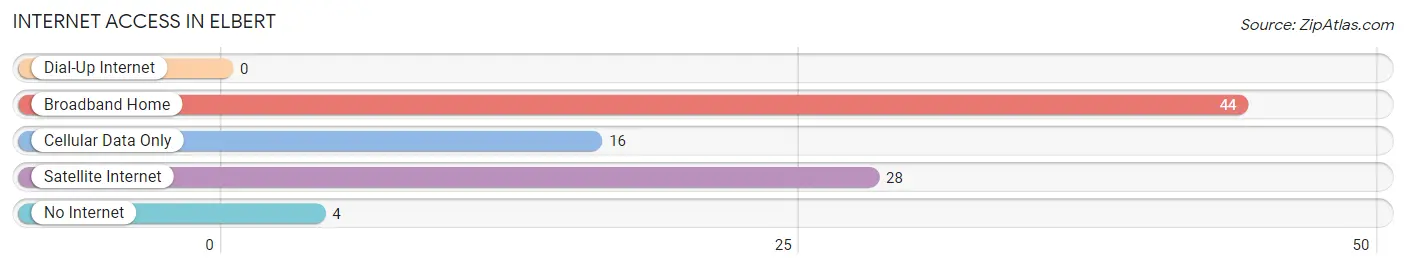
| Internet Type | # Households | % Households |
| Dial-Up Internet | 0 | 0.0% |
| Broadband Home | 44 | 44.9% |
| Cellular Data Only | 16 | 16.3% |
| Satellite Internet | 28 | 28.6% |
| No Internet | 4 | 4.1% |
| Total | 98 | 100.0% |
Elbert Summary
Elbert, Colorado is a small town located in Elbert County, Colorado. It is situated in the eastern part of the state, about 40 miles southeast of Denver. The town was founded in 1874 and has a population of approximately 1,000 people.
History
Elbert was founded in 1874 by a group of settlers from the Midwest. The town was named after Samuel Elbert, a prominent Colorado politician and the first governor of the state. The town was originally a farming community, but it soon became a center for the mining industry. In the late 1800s, the town was home to several coal mines, and the town's economy was largely based on the mining industry.
In the early 1900s, Elbert began to experience a decline in the mining industry, and the town's economy shifted to agriculture. The town was home to several large farms, and the town's population grew steadily throughout the early 20th century.
In the 1950s, Elbert experienced a resurgence in the mining industry, and the town's population began to grow again. The town was also home to several small businesses, including a grocery store, a hardware store, and a gas station.
Geography
Elbert is located in the eastern part of Elbert County, Colorado. The town is situated at an elevation of 6,000 feet, and it is surrounded by rolling hills and open plains. The town is located near the South Platte River, and it is about 40 miles southeast of Denver.
The town is located in a semi-arid climate, and it experiences hot summers and cold winters. The average annual temperature is around 50 degrees Fahrenheit, and the average annual precipitation is around 16 inches.
Economy
Elbert's economy is largely based on agriculture and tourism. The town is home to several large farms, and the town's economy is largely dependent on the production of wheat, corn, and other crops. The town is also home to several small businesses, including a grocery store, a hardware store, and a gas station.
The town is also a popular tourist destination, and it is home to several attractions, including the Elbert County Historical Museum and the Elbert County Fairgrounds. The town is also home to several outdoor recreation areas, including the Elbert County State Wildlife Area and the Elbert County State Park.
Demographics
As of the 2010 census, Elbert had a population of 1,000 people. The town is predominantly white, with about 95% of the population being white. The town is also home to a small Hispanic population, with about 4% of the population being Hispanic. The median household income in Elbert is around $50,000, and the median home value is around $200,000. The town has a low unemployment rate, and the poverty rate is around 10%.
Common Questions
What is Per Capita Income in Elbert?
Per Capita income in Elbert is $38,008.
What is the Median Family Income in Elbert?
Median Family Income in Elbert is $53,500.
What is the Median Household income in Elbert?
Median Household Income in Elbert is $54,500.
What is Income or Wage Gap in Elbert?
Income or Wage Gap in Elbert is 14.6%.
Women in Elbert earn 85.4 cents for every dollar earned by a man.
What is Inequality or Gini Index in Elbert?
Inequality or Gini Index in Elbert is 0.34.
What is the Total Population of Elbert?
Total Population of Elbert is 203.
What is the Total Male Population of Elbert?
Total Male Population of Elbert is 104.
What is the Total Female Population of Elbert?
Total Female Population of Elbert is 99.
What is the Ratio of Males per 100 Females in Elbert?
There are 105.05 Males per 100 Females in Elbert.
What is the Ratio of Females per 100 Males in Elbert?
There are 95.19 Females per 100 Males in Elbert.
What is the Median Population Age in Elbert?
Median Population Age in Elbert is 37.2 Years.
What is the Average Family Size in Elbert
Average Family Size in Elbert is 2.7 People.
What is the Average Household Size in Elbert
Average Household Size in Elbert is 2.1 People.
How Large is the Labor Force in Elbert?
There are 112 People in the Labor Forcein in Elbert.
What is the Percentage of People in the Labor Force in Elbert?
65.9% of People are in the Labor Force in Elbert.
What is the Unemployment Rate in Elbert?
Unemployment Rate in Elbert is 3.6%.