Coal Creek, CO Map & Demographics
Coal Creek Map
Coal Creek Overview
$24,896
PER CAPITA INCOME
$37,339
AVG HOUSEHOLD INCOME
16.0%
WAGE / INCOME GAP [ % ]
84.0¢/ $1
WAGE / INCOME GAP [ $ ]
0.48
INEQUALITY / GINI INDEX
494
TOTAL POPULATION
288
MALE POPULATION
206
FEMALE POPULATION
139.81
MALES / 100 FEMALES
71.53
FEMALES / 100 MALES
36.1
MEDIAN AGE
3.1
AVG FAMILY SIZE
2.7
AVG HOUSEHOLD SIZE
203
LABOR FORCE [ PEOPLE ]
48.2%
PERCENT IN LABOR FORCE
8.9%
UNEMPLOYMENT RATE
Coal Creek Zip Codes
Coal Creek Area Codes
Income in Coal Creek
Income Overview in Coal Creek
| Characteristic | Number | Measure |
| Per Capita Income | 494 | $24,896 |
| Median Family Income | 133 | $0 |
| Mean Family Income | 133 | $62,292 |
| Median Household Income | 180 | $37,339 |
| Mean Household Income | 180 | $64,011 |
| Income Deficit | 133 | $0 |
| Wage / Income Gap (%) | 494 | 16.02% |
| Wage / Income Gap ($) | 494 | 83.98¢ per $1 |
| Gini / Inequality Index | 494 | 0.48 |
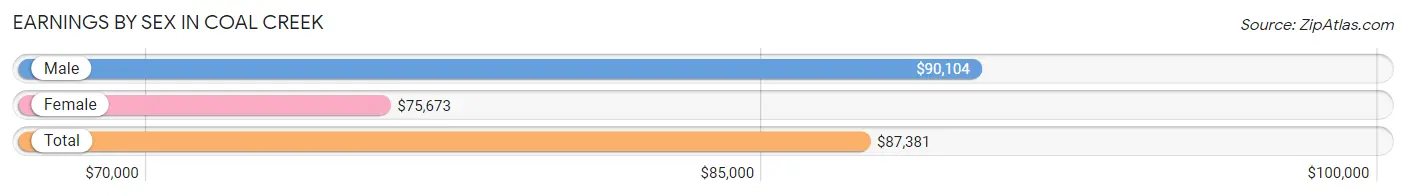
Earnings by Sex in Coal Creek
Average Earnings in Coal Creek are $87,381, $90,104 for men and $75,673 for women, a difference of 16.0%.
| Sex | Number | Average Earnings |
| Male | 110 (56.7%) | $90,104 |
| Female | 84 (43.3%) | $75,673 |
| Total | 194 (100.0%) | $87,381 |
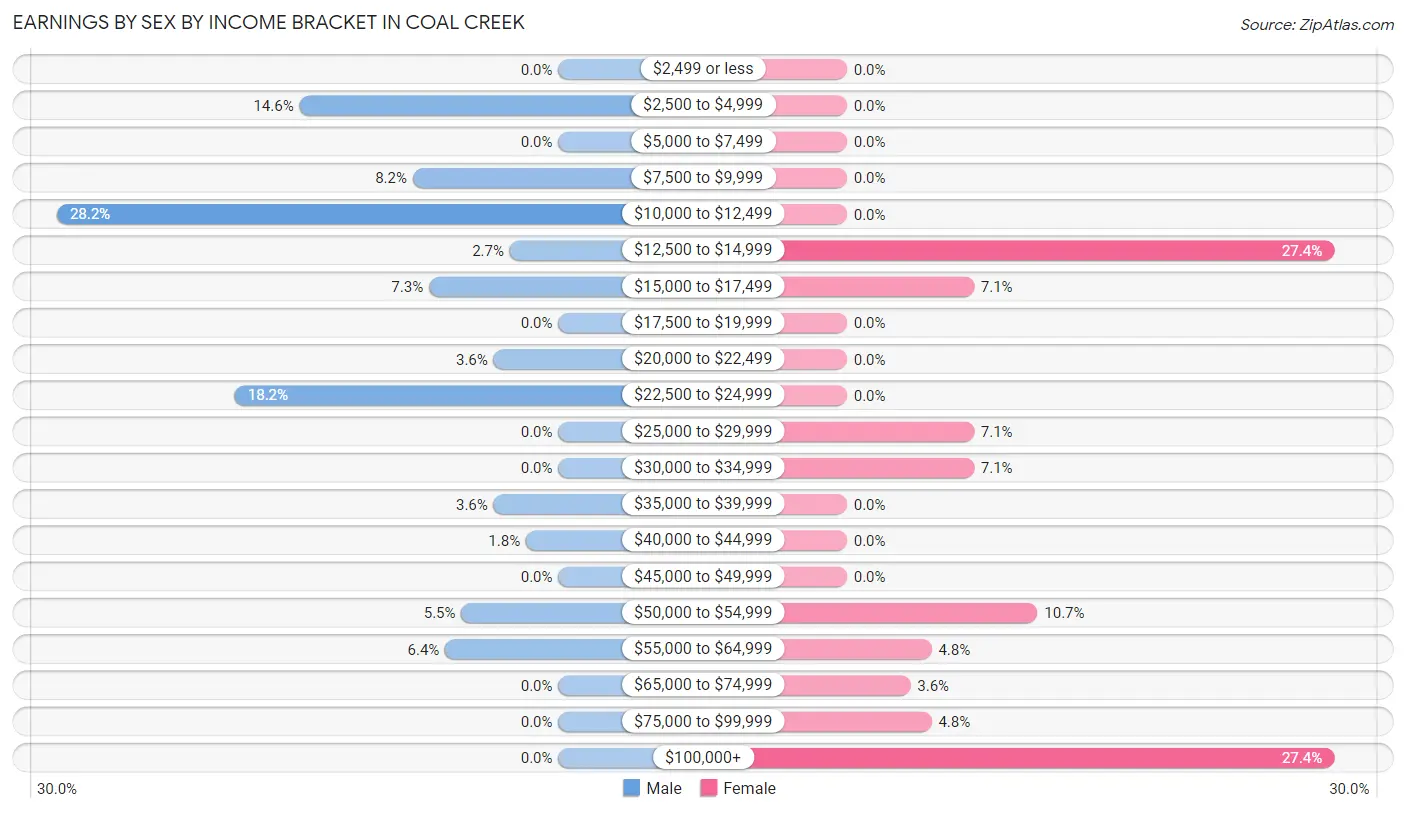
Earnings by Sex by Income Bracket in Coal Creek
The most common earnings brackets in Coal Creek are $10,000 to $12,499 for men (31 | 28.2%) and $12,500 to $14,999 for women (23 | 27.4%).
| Income | Male | Female |
| $2,499 or less | 0 (0.0%) | 0 (0.0%) |
| $2,500 to $4,999 | 16 (14.5%) | 0 (0.0%) |
| $5,000 to $7,499 | 0 (0.0%) | 0 (0.0%) |
| $7,500 to $9,999 | 9 (8.2%) | 0 (0.0%) |
| $10,000 to $12,499 | 31 (28.2%) | 0 (0.0%) |
| $12,500 to $14,999 | 3 (2.7%) | 23 (27.4%) |
| $15,000 to $17,499 | 8 (7.3%) | 6 (7.1%) |
| $17,500 to $19,999 | 0 (0.0%) | 0 (0.0%) |
| $20,000 to $22,499 | 4 (3.6%) | 0 (0.0%) |
| $22,500 to $24,999 | 20 (18.2%) | 0 (0.0%) |
| $25,000 to $29,999 | 0 (0.0%) | 6 (7.1%) |
| $30,000 to $34,999 | 0 (0.0%) | 6 (7.1%) |
| $35,000 to $39,999 | 4 (3.6%) | 0 (0.0%) |
| $40,000 to $44,999 | 2 (1.8%) | 0 (0.0%) |
| $45,000 to $49,999 | 0 (0.0%) | 0 (0.0%) |
| $50,000 to $54,999 | 6 (5.4%) | 9 (10.7%) |
| $55,000 to $64,999 | 7 (6.4%) | 4 (4.8%) |
| $65,000 to $74,999 | 0 (0.0%) | 3 (3.6%) |
| $75,000 to $99,999 | 0 (0.0%) | 4 (4.8%) |
| $100,000+ | 0 (0.0%) | 23 (27.4%) |
| Total | 110 (100.0%) | 84 (100.0%) |
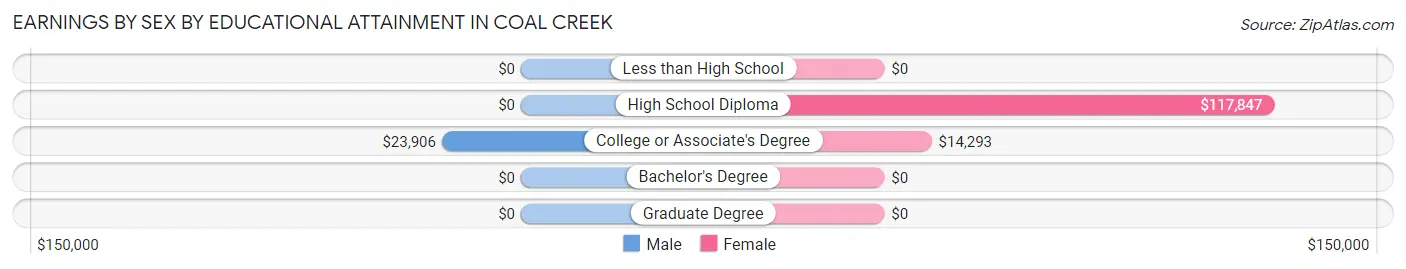
Earnings by Sex by Educational Attainment in Coal Creek
| Educational Attainment | Male Income | Female Income |
| Less than High School | - | - |
| High School Diploma | - | - |
| College or Associate's Degree | $23,906 | $14,293 |
| Bachelor's Degree | - | - |
| Graduate Degree | - | - |
| Total | $22,500 | $0 |
Family Income in Coal Creek
Family Income Brackets in Coal Creek
According to the Coal Creek family income data, there are 31 families falling into the $10,000 to $14,999 income range, which is the most common income bracket and makes up 23.3% of all families. Conversely, the $200,000+ income bracket is the least frequent group with only 5 families (3.8%) belonging to this category.
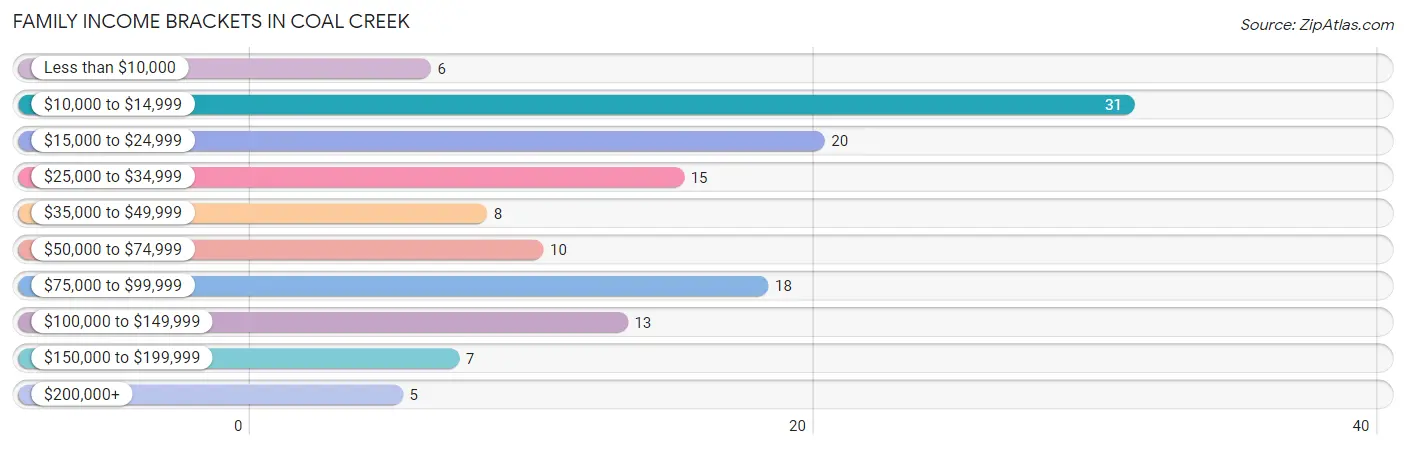
| Income Bracket | # Families | % Families |
| Less than $10,000 | 6 | 4.5% |
| $10,000 to $14,999 | 31 | 23.3% |
| $15,000 to $24,999 | 20 | 15.0% |
| $25,000 to $34,999 | 15 | 11.3% |
| $35,000 to $49,999 | 8 | 6.0% |
| $50,000 to $74,999 | 10 | 7.5% |
| $75,000 to $99,999 | 18 | 13.5% |
| $100,000 to $149,999 | 13 | 9.8% |
| $150,000 to $199,999 | 7 | 5.3% |
| $200,000+ | 5 | 3.8% |
Family Income by Famaliy Size in Coal Creek
2-person families (71 | 53.4%) account for the highest median family income in Coal Creek with $45,313 per family, while 2-person families (71 | 53.4%) have the highest median income of $22,656 per family member.
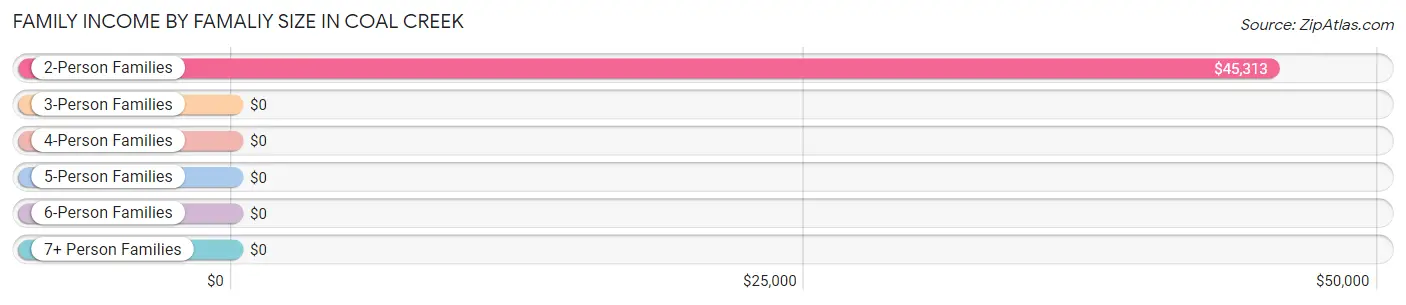
| Income Bracket | # Families | Median Income |
| 2-Person Families | 71 (53.4%) | $45,313 |
| 3-Person Families | 41 (30.8%) | $0 |
| 4-Person Families | 4 (3.0%) | $0 |
| 5-Person Families | 7 (5.3%) | $0 |
| 6-Person Families | 10 (7.5%) | $0 |
| 7+ Person Families | 0 (0.0%) | $0 |
| Total | 133 (100.0%) | $0 |
Family Income by Number of Earners in Coal Creek
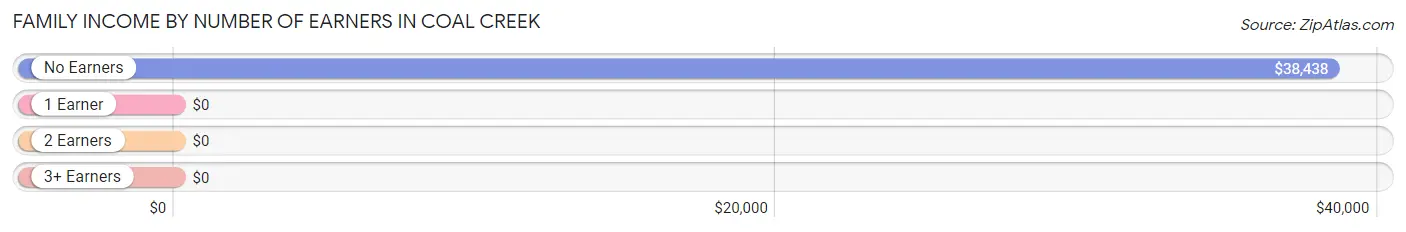
| Number of Earners | # Families | Median Income |
| No Earners | 41 (30.8%) | $38,438 |
| 1 Earner | 70 (52.6%) | $0 |
| 2 Earners | 15 (11.3%) | $0 |
| 3+ Earners | 7 (5.3%) | $0 |
| Total | 133 (100.0%) | $0 |
Household Income in Coal Creek
Household Income Brackets in Coal Creek
With 55 households falling in the category, the $35,000 to $49,999 income range is the most frequent in Coal Creek, accounting for 30.6% of all households. In contrast, only 5 households (2.8%) fall into the $200,000+ income bracket, making it the least populous group.
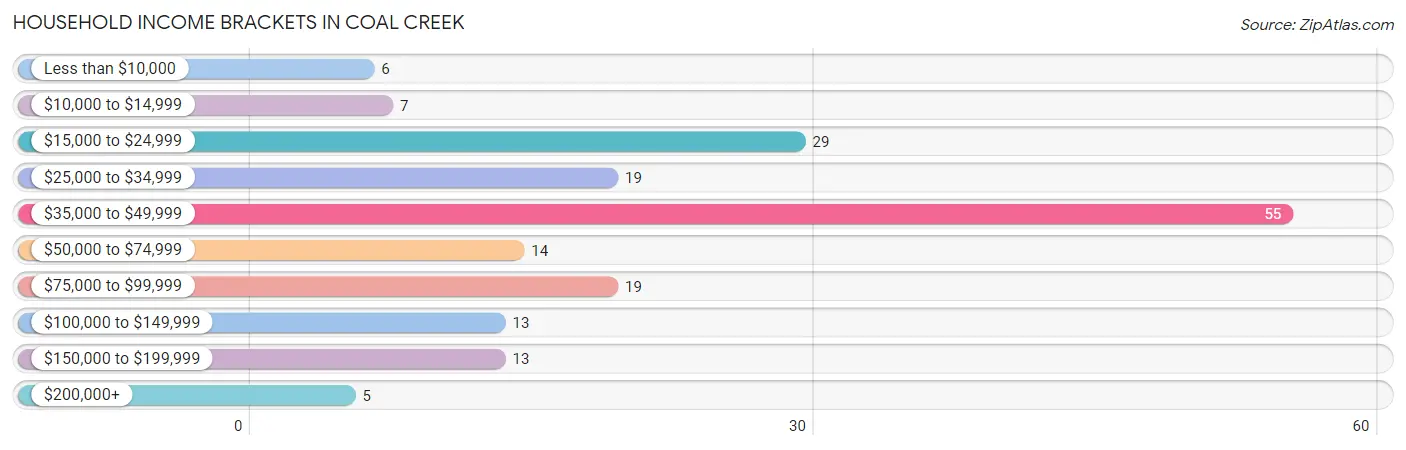
| Income Bracket | # Households | % Households |
| Less than $10,000 | 6 | 3.3% |
| $10,000 to $14,999 | 7 | 3.9% |
| $15,000 to $24,999 | 29 | 16.1% |
| $25,000 to $34,999 | 19 | 10.6% |
| $35,000 to $49,999 | 55 | 30.6% |
| $50,000 to $74,999 | 14 | 7.8% |
| $75,000 to $99,999 | 19 | 10.6% |
| $100,000 to $149,999 | 13 | 7.2% |
| $150,000 to $199,999 | 13 | 7.2% |
| $200,000+ | 5 | 2.8% |
Household Income by Householder Age in Coal Creek
The median household income in Coal Creek is $37,339, with the highest median household income of $84,063 found in the 25 to 44 years age bracket for the primary householder. A total of 53 households (29.4%) fall into this category. Meanwhile, the 15 to 24 years age bracket for the primary householder has the lowest median household income of $0, with 31 households (17.2%) in this group.
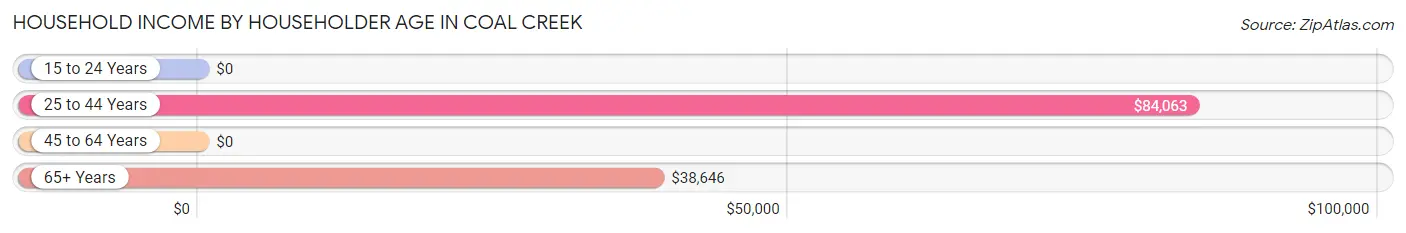
| Income Bracket | # Households | Median Income |
| 15 to 24 Years | 31 (17.2%) | $0 |
| 25 to 44 Years | 53 (29.4%) | $84,063 |
| 45 to 64 Years | 27 (15.0%) | $0 |
| 65+ Years | 69 (38.3%) | $38,646 |
| Total | 180 (100.0%) | $37,339 |
Poverty in Coal Creek
Income Below Poverty by Sex and Age in Coal Creek
With 34.4% poverty level for males and 27.7% for females among the residents of Coal Creek, 45 to 54 year old males and under 5 year old females are the most vulnerable to poverty, with 7 males (100.0%) and 6 females (100.0%) in their respective age groups living below the poverty level.
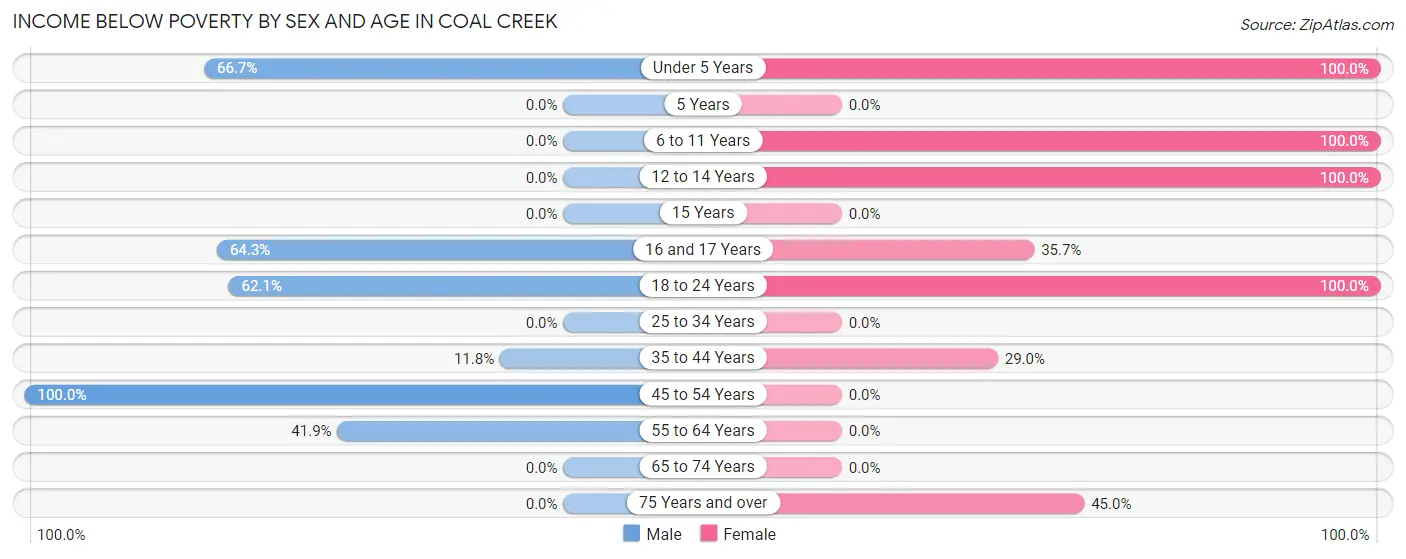
| Age Bracket | Male | Female |
| Under 5 Years | 14 (66.7%) | 6 (100.0%) |
| 5 Years | 0 (0.0%) | 0 (0.0%) |
| 6 to 11 Years | 0 (0.0%) | 4 (100.0%) |
| 12 to 14 Years | 0 (0.0%) | 8 (100.0%) |
| 15 Years | 0 (0.0%) | 0 (0.0%) |
| 16 and 17 Years | 18 (64.3%) | 5 (35.7%) |
| 18 to 24 Years | 41 (62.1%) | 14 (100.0%) |
| 25 to 34 Years | 0 (0.0%) | 0 (0.0%) |
| 35 to 44 Years | 6 (11.8%) | 11 (28.9%) |
| 45 to 54 Years | 7 (100.0%) | 0 (0.0%) |
| 55 to 64 Years | 13 (41.9%) | 0 (0.0%) |
| 65 to 74 Years | 0 (0.0%) | 0 (0.0%) |
| 75 Years and over | 0 (0.0%) | 9 (45.0%) |
| Total | 99 (34.4%) | 57 (27.7%) |
Income Above Poverty by Sex and Age in Coal Creek
According to the poverty statistics in Coal Creek, males aged 6 to 11 years and females aged 15 years are the age groups that are most secure financially, with 100.0% of males and 100.0% of females in these age groups living above the poverty line.
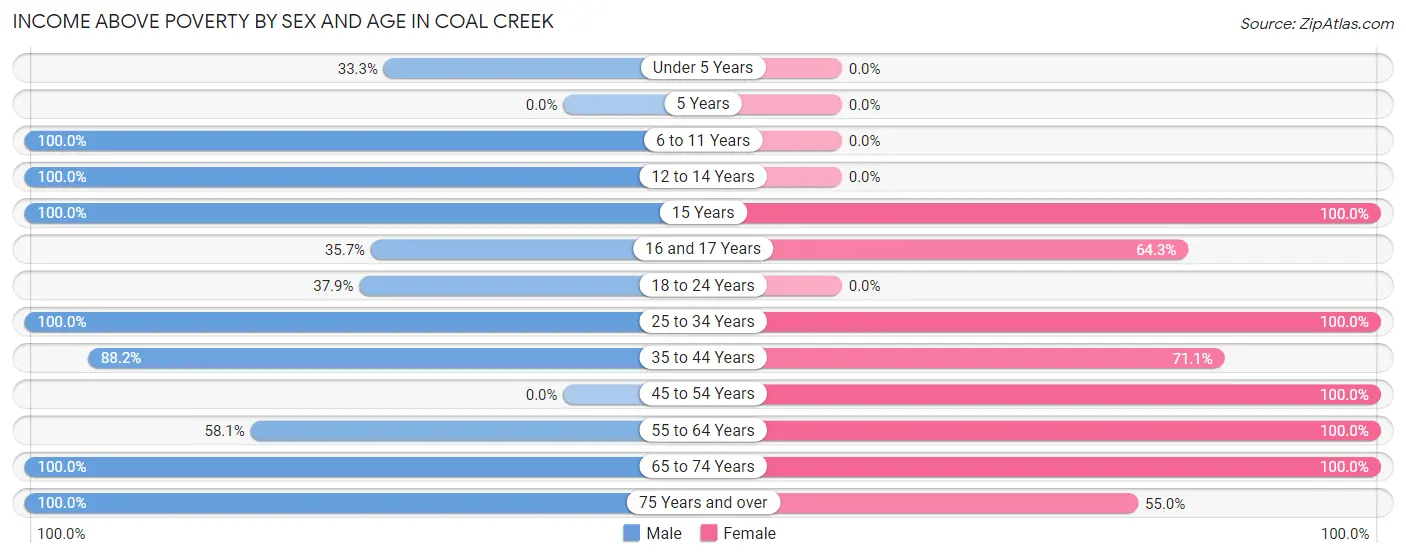
| Age Bracket | Male | Female |
| Under 5 Years | 7 (33.3%) | 0 (0.0%) |
| 5 Years | 0 (0.0%) | 0 (0.0%) |
| 6 to 11 Years | 10 (100.0%) | 0 (0.0%) |
| 12 to 14 Years | 6 (100.0%) | 0 (0.0%) |
| 15 Years | 10 (100.0%) | 8 (100.0%) |
| 16 and 17 Years | 10 (35.7%) | 9 (64.3%) |
| 18 to 24 Years | 25 (37.9%) | 0 (0.0%) |
| 25 to 34 Years | 8 (100.0%) | 42 (100.0%) |
| 35 to 44 Years | 45 (88.2%) | 27 (71.1%) |
| 45 to 54 Years | 0 (0.0%) | 4 (100.0%) |
| 55 to 64 Years | 18 (58.1%) | 6 (100.0%) |
| 65 to 74 Years | 37 (100.0%) | 42 (100.0%) |
| 75 Years and over | 13 (100.0%) | 11 (55.0%) |
| Total | 189 (65.6%) | 149 (72.3%) |
Income Below Poverty Among Married-Couple Families in Coal Creek
The poverty statistics for married-couple families in Coal Creek show that 37.7% or 40 of the total 106 families live below the poverty line. Families with 1 or 2 children have the highest poverty rate of 72.1%, comprising of 31 families. On the other hand, families with no children have the lowest poverty rate of 5.7%, which includes 3 families.
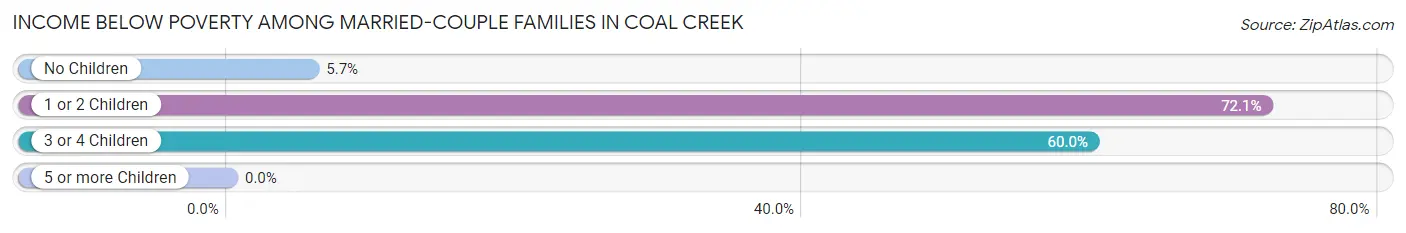
| Children | Above Poverty | Below Poverty |
| No Children | 50 (94.3%) | 3 (5.7%) |
| 1 or 2 Children | 12 (27.9%) | 31 (72.1%) |
| 3 or 4 Children | 4 (40.0%) | 6 (60.0%) |
| 5 or more Children | 0 (0.0%) | 0 (0.0%) |
| Total | 66 (62.3%) | 40 (37.7%) |
Income Below Poverty Among Single-Parent Households in Coal Creek
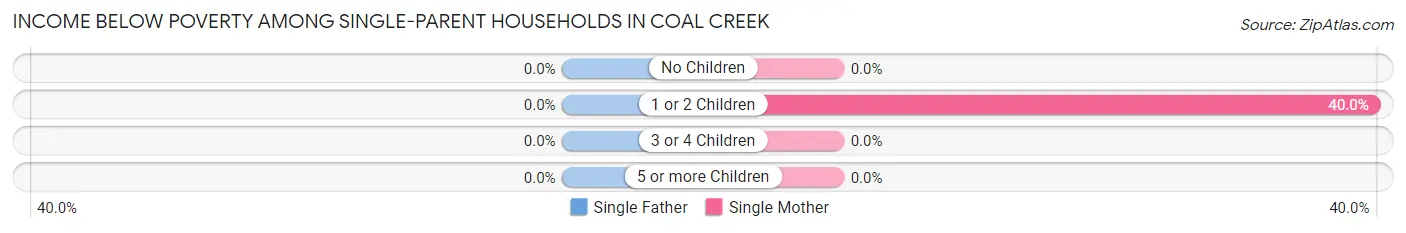
| Children | Single Father | Single Mother |
| No Children | 0 (0.0%) | 0 (0.0%) |
| 1 or 2 Children | 0 (0.0%) | 4 (40.0%) |
| 3 or 4 Children | 0 (0.0%) | 0 (0.0%) |
| 5 or more Children | 0 (0.0%) | 0 (0.0%) |
| Total | 0 (0.0%) | 4 (40.0%) |
Income Below Poverty Among Married-Couple vs Single-Parent Households in Coal Creek
The poverty data for Coal Creek shows that 40 of the married-couple family households (37.7%) and 4 of the single-parent households (14.8%) are living below the poverty level. Within the married-couple family households, those with 1 or 2 children have the highest poverty rate, with 31 households (72.1%) falling below the poverty line. Among the single-parent households, those with 1 or 2 children have the highest poverty rate, with 4 household (22.2%) living below poverty.
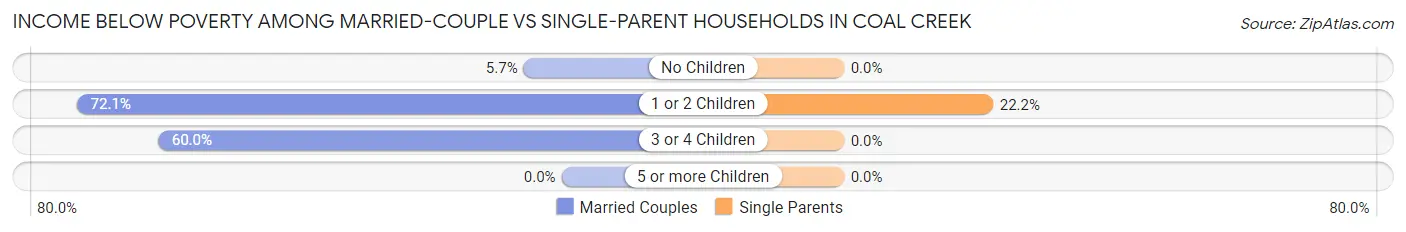
| Children | Married-Couple Families | Single-Parent Households |
| No Children | 3 (5.7%) | 0 (0.0%) |
| 1 or 2 Children | 31 (72.1%) | 4 (22.2%) |
| 3 or 4 Children | 6 (60.0%) | 0 (0.0%) |
| 5 or more Children | 0 (0.0%) | 0 (0.0%) |
| Total | 40 (37.7%) | 4 (14.8%) |
Race in Coal Creek
The most populous races in Coal Creek are White / Caucasian (420 | 85.0%), Hispanic or Latino (76 | 15.4%), and Two or more Races (57 | 11.5%).
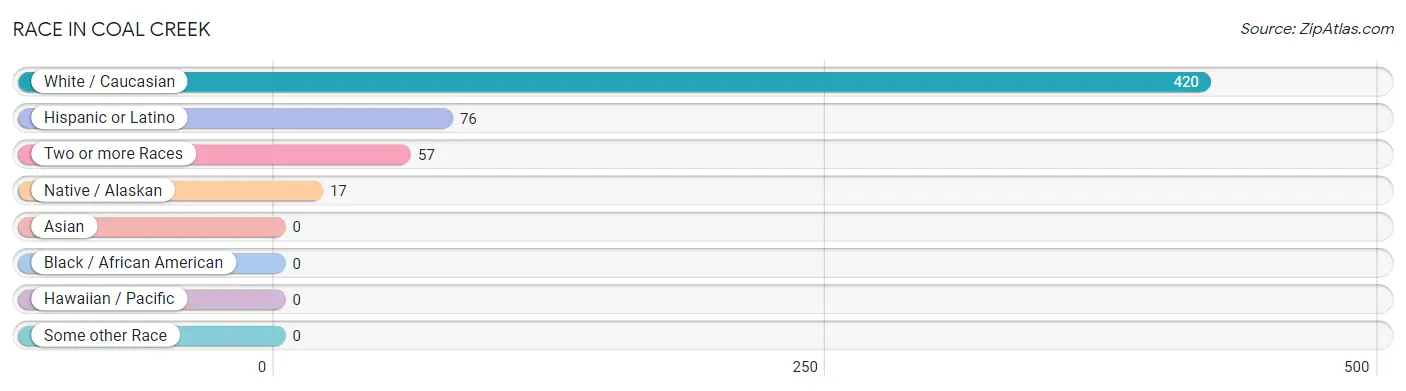
| Race | # Population | % Population |
| Asian | 0 | 0.0% |
| Black / African American | 0 | 0.0% |
| Hawaiian / Pacific | 0 | 0.0% |
| Hispanic or Latino | 76 | 15.4% |
| Native / Alaskan | 17 | 3.4% |
| White / Caucasian | 420 | 85.0% |
| Two or more Races | 57 | 11.5% |
| Some other Race | 0 | 0.0% |
| Total | 494 | 100.0% |
Ancestry in Coal Creek
The most populous ancestries reported in Coal Creek are German (81 | 16.4%), Irish (80 | 16.2%), Spanish (65 | 13.2%), Navajo (53 | 10.7%), and American (24 | 4.9%), together accounting for 61.3% of all Coal Creek residents.
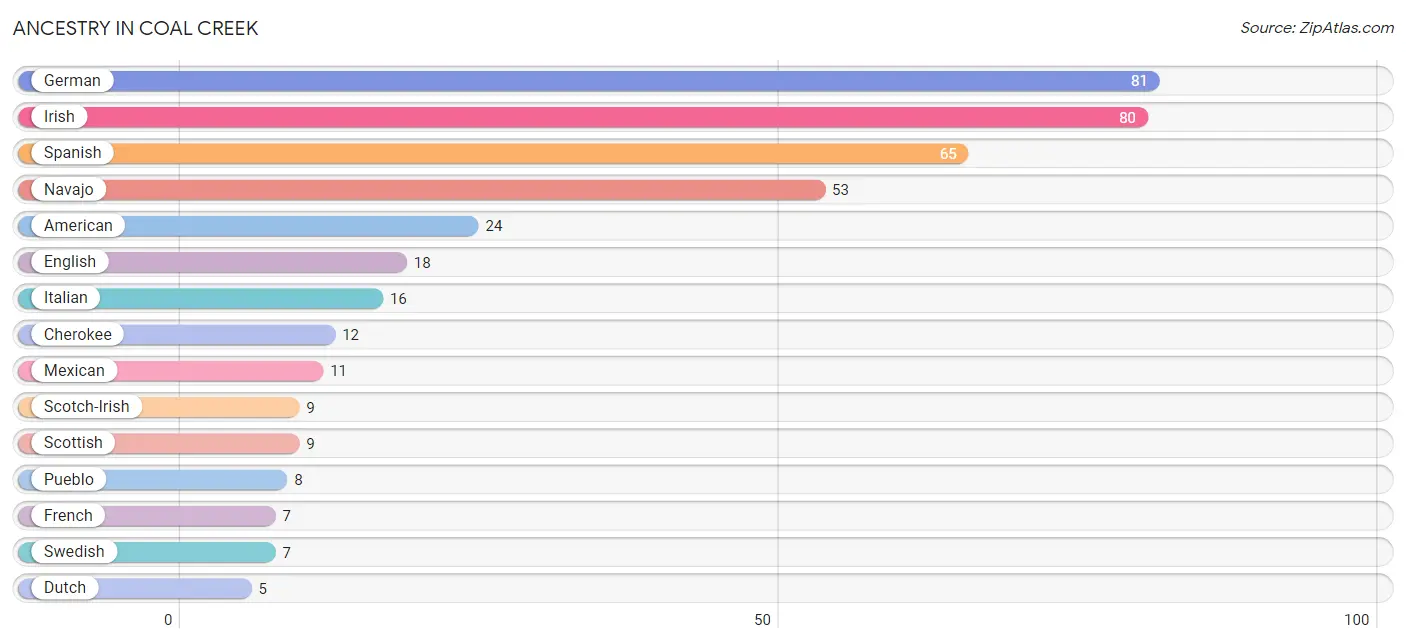
| Ancestry | # Population | % Population |
| American | 24 | 4.9% |
| Cherokee | 12 | 2.4% |
| Dutch | 5 | 1.0% |
| English | 18 | 3.6% |
| French | 7 | 1.4% |
| German | 81 | 16.4% |
| Irish | 80 | 16.2% |
| Italian | 16 | 3.2% |
| Mexican | 11 | 2.2% |
| Navajo | 53 | 10.7% |
| Pueblo | 8 | 1.6% |
| Scotch-Irish | 9 | 1.8% |
| Scottish | 9 | 1.8% |
| Sioux | 4 | 0.8% |
| Spanish | 65 | 13.2% |
| Swedish | 7 | 1.4% |
| Welsh | 4 | 0.8% | View All 17 Rows |
Immigrants in Coal Creek

| Immigration Origin | # Population | % Population | View All 0 Rows |
Sex and Age in Coal Creek
Sex and Age in Coal Creek
The most populous age groups in Coal Creek are 20 to 24 Years (56 | 19.4%) for men and 30 to 34 Years (39 | 18.9%) for women.
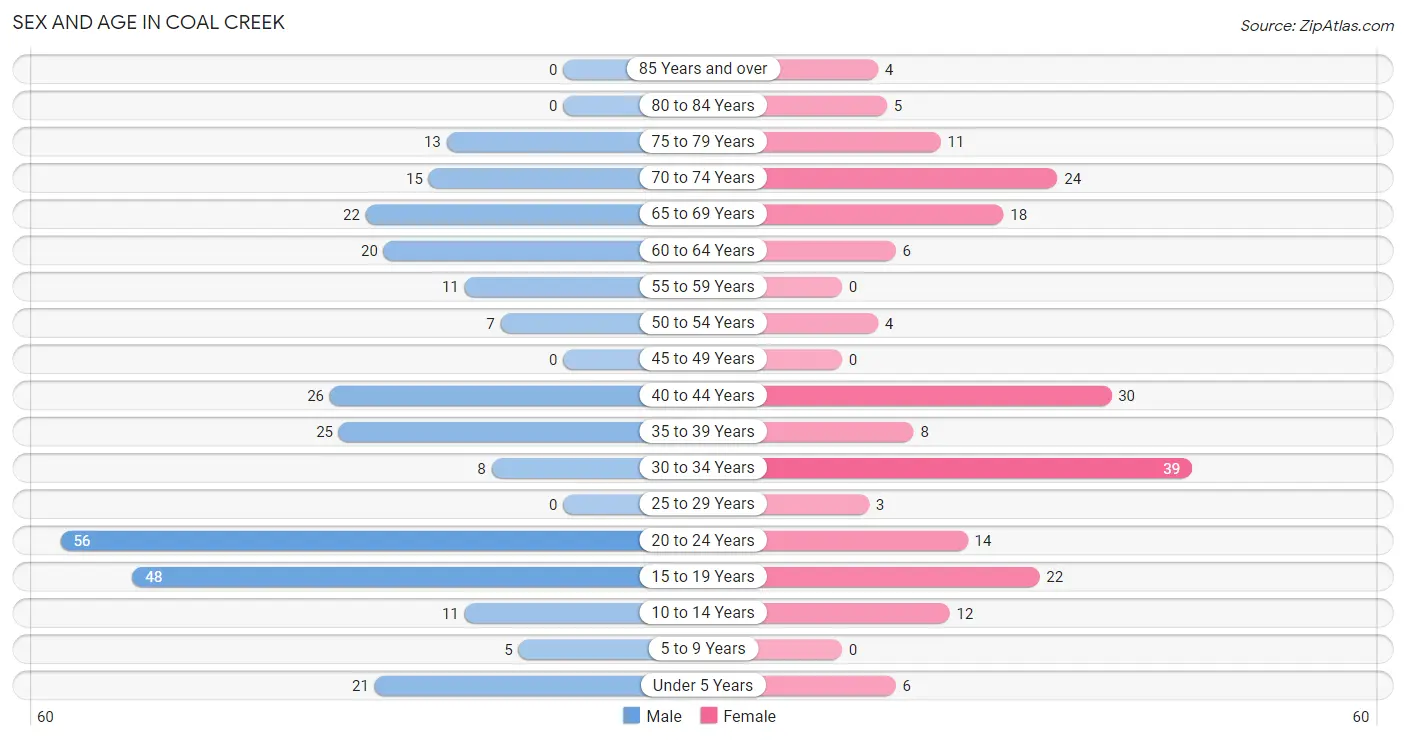
| Age Bracket | Male | Female |
| Under 5 Years | 21 (7.3%) | 6 (2.9%) |
| 5 to 9 Years | 5 (1.7%) | 0 (0.0%) |
| 10 to 14 Years | 11 (3.8%) | 12 (5.8%) |
| 15 to 19 Years | 48 (16.7%) | 22 (10.7%) |
| 20 to 24 Years | 56 (19.4%) | 14 (6.8%) |
| 25 to 29 Years | 0 (0.0%) | 3 (1.5%) |
| 30 to 34 Years | 8 (2.8%) | 39 (18.9%) |
| 35 to 39 Years | 25 (8.7%) | 8 (3.9%) |
| 40 to 44 Years | 26 (9.0%) | 30 (14.6%) |
| 45 to 49 Years | 0 (0.0%) | 0 (0.0%) |
| 50 to 54 Years | 7 (2.4%) | 4 (1.9%) |
| 55 to 59 Years | 11 (3.8%) | 0 (0.0%) |
| 60 to 64 Years | 20 (6.9%) | 6 (2.9%) |
| 65 to 69 Years | 22 (7.6%) | 18 (8.7%) |
| 70 to 74 Years | 15 (5.2%) | 24 (11.7%) |
| 75 to 79 Years | 13 (4.5%) | 11 (5.3%) |
| 80 to 84 Years | 0 (0.0%) | 5 (2.4%) |
| 85 Years and over | 0 (0.0%) | 4 (1.9%) |
| Total | 288 (100.0%) | 206 (100.0%) |
Families and Households in Coal Creek
Median Family Size in Coal Creek
The median family size in Coal Creek is 3.08 persons per family, with married-couple families (106 | 79.7%) accounting for the largest median family size of 3.33 persons per family. On the other hand, single male/father families (17 | 12.8%) represent the smallest median family size with 1.71 persons per family.
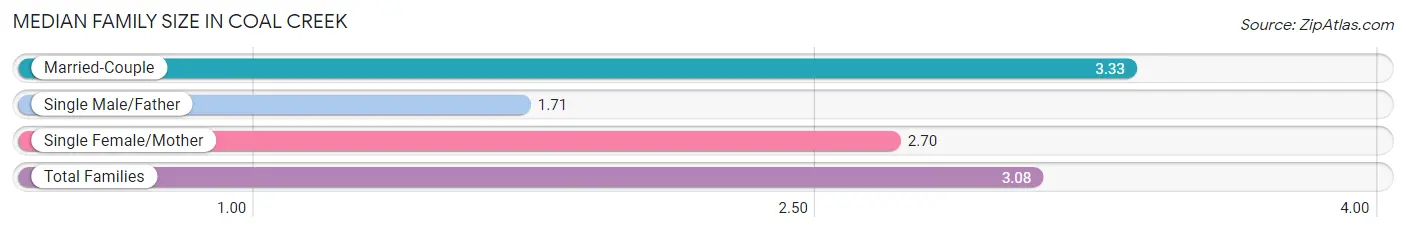
| Family Type | # Families | Family Size |
| Married-Couple | 106 (79.7%) | 3.33 |
| Single Male/Father | 17 (12.8%) | 1.71 |
| Single Female/Mother | 10 (7.5%) | 2.70 |
| Total Families | 133 (100.0%) | 3.08 |
Median Household Size in Coal Creek
The median household size in Coal Creek is 2.74 persons per household, with single female/mother households (10 | 5.6%) accounting for the largest median household size of 3.6 persons per household. non-family households (47 | 26.1%) represent the smallest median household size with 1.23 persons per household.
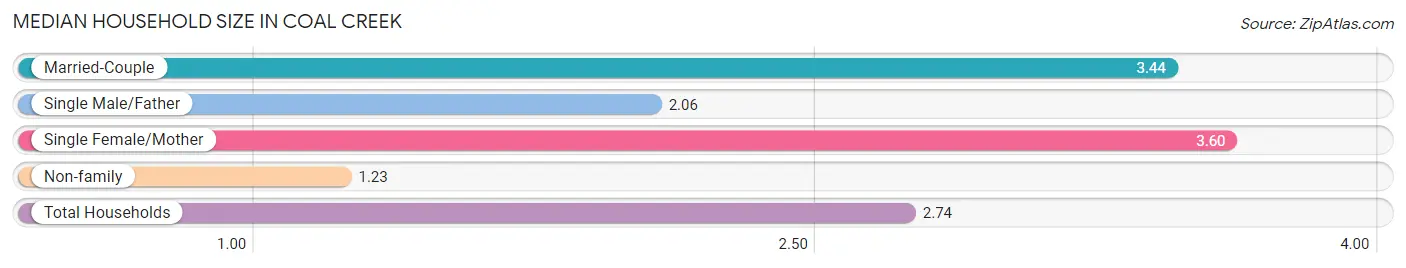
| Household Type | # Households | Household Size |
| Married-Couple | 106 (58.9%) | 3.44 |
| Single Male/Father | 17 (9.4%) | 2.06 |
| Single Female/Mother | 10 (5.6%) | 3.60 |
| Non-family | 47 (26.1%) | 1.23 |
| Total Households | 180 (100.0%) | 2.74 |
Household Size by Marriage Status in Coal Creek
Out of a total of 180 households in Coal Creek, 133 (73.9%) are family households, while 47 (26.1%) are nonfamily households. The most numerous type of family households are 2-person households, comprising 57, and the most common type of nonfamily households are 1-person households, comprising 42.
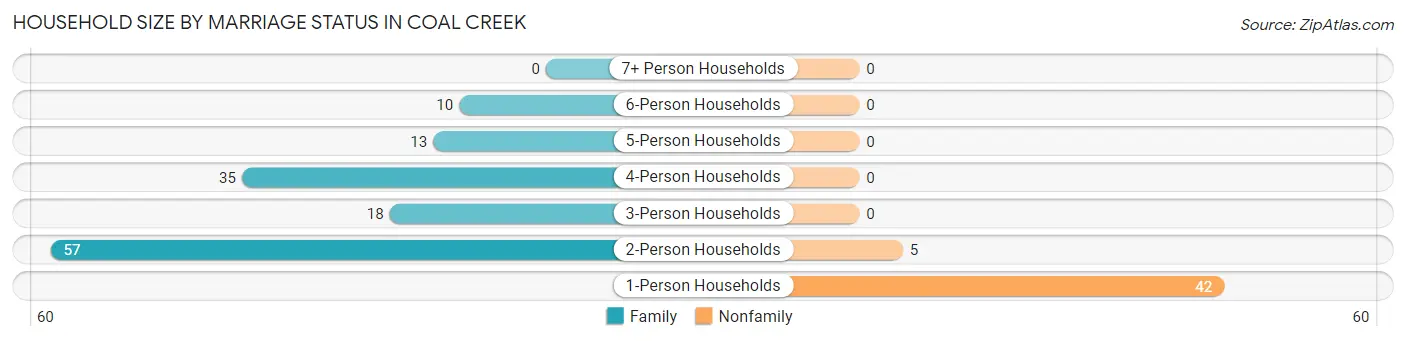
| Household Size | Family Households | Nonfamily Households |
| 1-Person Households | - | 42 (23.3%) |
| 2-Person Households | 57 (31.7%) | 5 (2.8%) |
| 3-Person Households | 18 (10.0%) | 0 (0.0%) |
| 4-Person Households | 35 (19.4%) | 0 (0.0%) |
| 5-Person Households | 13 (7.2%) | 0 (0.0%) |
| 6-Person Households | 10 (5.6%) | 0 (0.0%) |
| 7+ Person Households | 0 (0.0%) | 0 (0.0%) |
| Total | 133 (73.9%) | 47 (26.1%) |
Female Fertility in Coal Creek
Fertility by Age in Coal Creek
Average fertility rate in Coal Creek is 92.0 births per 1,000 women. Women in the age bracket of 20 to 34 years have the highest fertility rate with 196.0 births per 1,000 women. Women in the age bracket of 20 to 34 years acount for 100.0% of all women with births.
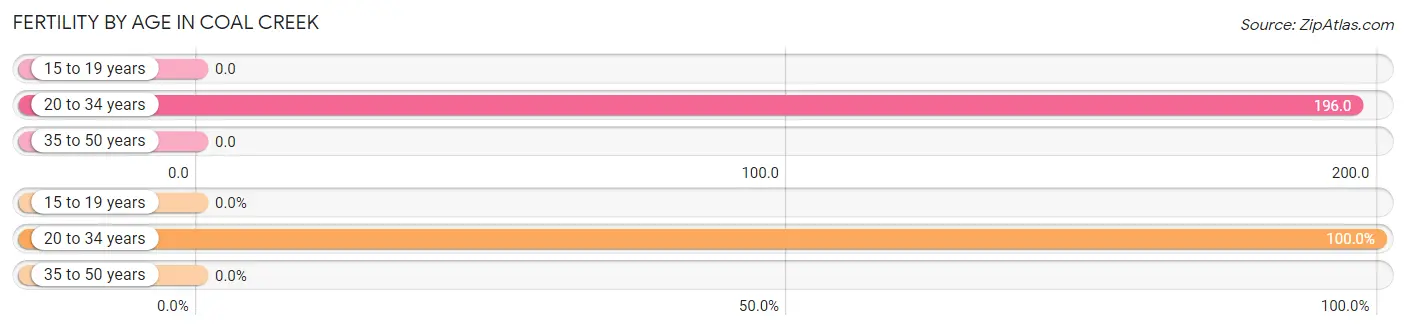
| Age Bracket | Women with Births | Births / 1,000 Women |
| 15 to 19 years | 0 (0.0%) | 0.0 |
| 20 to 34 years | 11 (100.0%) | 196.0 |
| 35 to 50 years | 0 (0.0%) | 0.0 |
| Total | 11 (100.0%) | 92.0 |
Fertility by Age by Marriage Status in Coal Creek
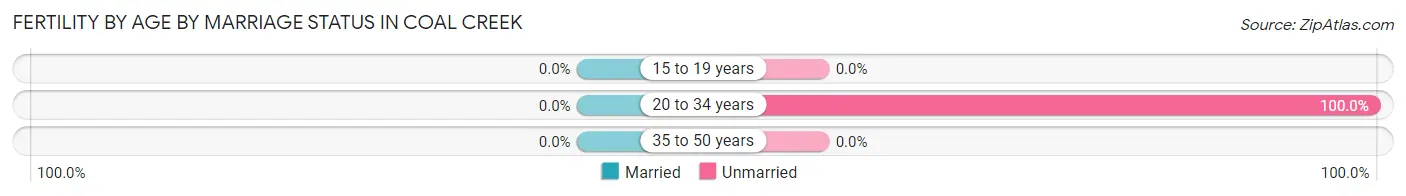
| Age Bracket | Married | Unmarried |
| 15 to 19 years | 0 (0.0%) | 0 (0.0%) |
| 20 to 34 years | 0 (0.0%) | 11 (100.0%) |
| 35 to 50 years | 0 (0.0%) | 0 (0.0%) |
| Total | 0 (0.0%) | 11 (100.0%) |
Fertility by Education in Coal Creek
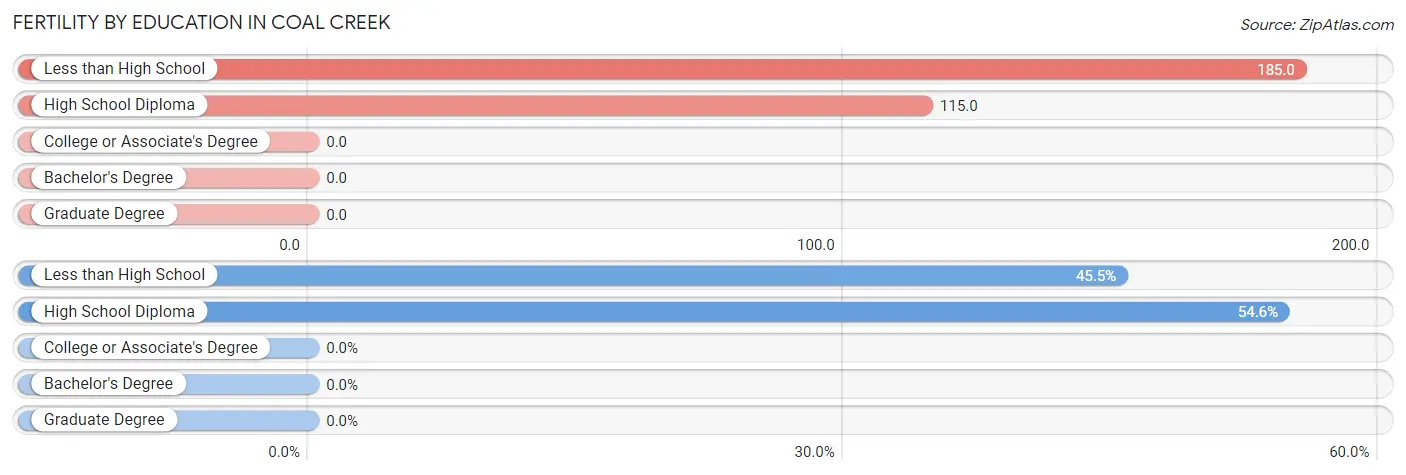
| Educational Attainment | Women with Births | Births / 1,000 Women |
| Less than High School | 5 (45.5%) | 185.0 |
| High School Diploma | 6 (54.5%) | 115.0 |
| College or Associate's Degree | 0 (0.0%) | 0.0 |
| Bachelor's Degree | 0 (0.0%) | 0.0 |
| Graduate Degree | 0 (0.0%) | 0.0 |
| Total | 11 (100.0%) | 92.0 |
Fertility by Education by Marriage Status in Coal Creek
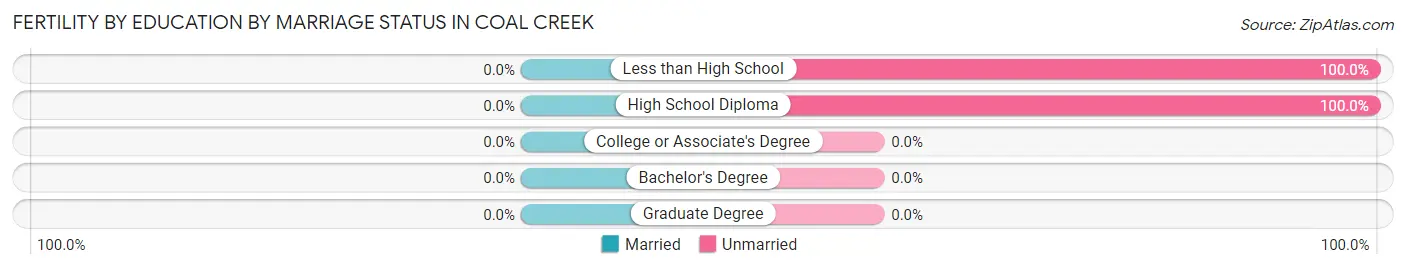
| Educational Attainment | Married | Unmarried |
| Less than High School | 0 (0.0%) | 5 (100.0%) |
| High School Diploma | 0 (0.0%) | 6 (100.0%) |
| College or Associate's Degree | 0 (0.0%) | 0 (0.0%) |
| Bachelor's Degree | 0 (0.0%) | 0 (0.0%) |
| Graduate Degree | 0 (0.0%) | 0 (0.0%) |
| Total | 0 (0.0%) | 11 (100.0%) |
Employment Characteristics in Coal Creek
Employment by Class of Employer in Coal Creek
Among the 185 employed individuals in Coal Creek, private company employees (142 | 76.8%), self-employed (not incorporated) (18 | 9.7%), and self-employed (incorporated) (8 | 4.3%) make up the most common classes of employment.
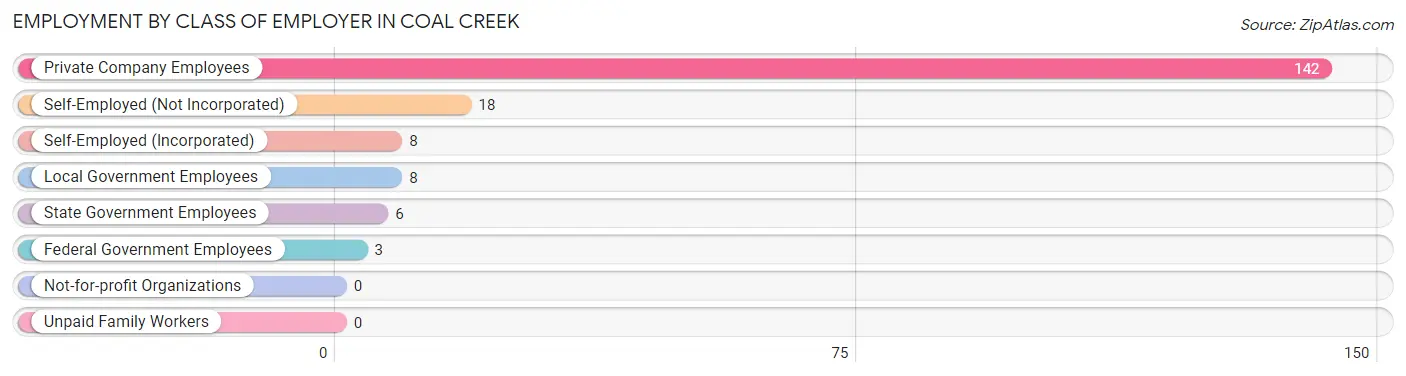
| Employer Class | # Employees | % Employees |
| Private Company Employees | 142 | 76.8% |
| Self-Employed (Incorporated) | 8 | 4.3% |
| Self-Employed (Not Incorporated) | 18 | 9.7% |
| Not-for-profit Organizations | 0 | 0.0% |
| Local Government Employees | 8 | 4.3% |
| State Government Employees | 6 | 3.2% |
| Federal Government Employees | 3 | 1.6% |
| Unpaid Family Workers | 0 | 0.0% |
| Total | 185 | 100.0% |
Employment Status by Age in Coal Creek
According to the labor force statistics for Coal Creek, out of the total population over 16 years of age (421), 48.2% or 203 individuals are in the labor force, with 8.9% or 18 of them unemployed. The age group with the highest labor force participation rate is 25 to 29 years, with 100.0% or 3 individuals in the labor force. Within the labor force, the 16 to 19 years age range has the highest percentage of unemployed individuals, with 100.0% or 5 of them being unemployed.
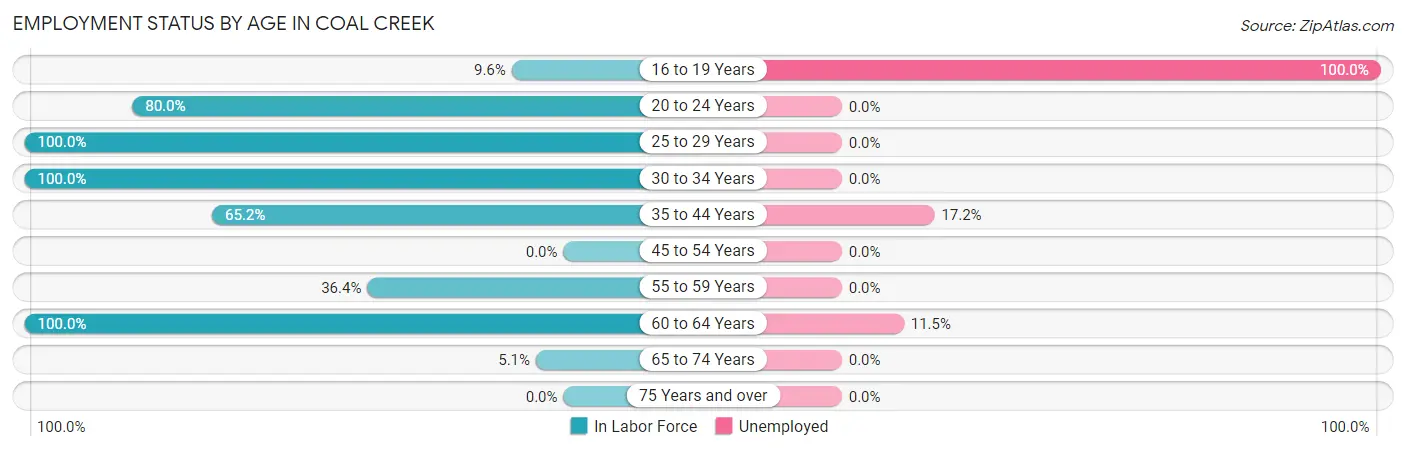
| Age Bracket | In Labor Force | Unemployed |
| 16 to 19 Years | 5 (9.6%) | 5 (100.0%) |
| 20 to 24 Years | 56 (80.0%) | 0 (0.0%) |
| 25 to 29 Years | 3 (100.0%) | 0 (0.0%) |
| 30 to 34 Years | 47 (100.0%) | 0 (0.0%) |
| 35 to 44 Years | 58 (65.2%) | 10 (17.2%) |
| 45 to 54 Years | 0 (0.0%) | 0 (0.0%) |
| 55 to 59 Years | 4 (36.4%) | 0 (0.0%) |
| 60 to 64 Years | 26 (100.0%) | 3 (11.5%) |
| 65 to 74 Years | 4 (5.1%) | 0 (0.0%) |
| 75 Years and over | 0 (0.0%) | 0 (0.0%) |
| Total | 203 (48.2%) | 18 (8.9%) |
Employment Status by Educational Attainment in Coal Creek
According to labor force statistics for Coal Creek, 73.8% of individuals (138) out of the total population between 25 and 64 years of age (187) are in the labor force, with 9.4% or 13 of them being unemployed. The group with the highest labor force participation rate are those with the educational attainment of college / associate degree, with 100.0% or 51 individuals in the labor force. Within the labor force, individuals with high school diploma education have the highest percentage of unemployment, with 13.0% or 10 of them being unemployed.
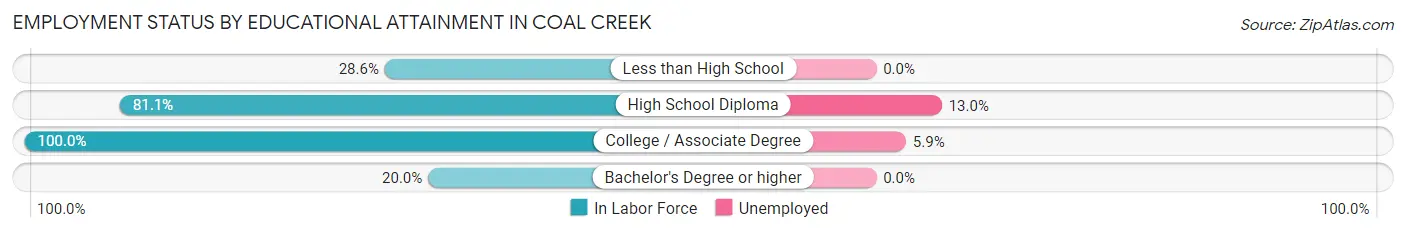
| Educational Attainment | In Labor Force | Unemployed |
| Less than High School | 6 (28.6%) | 0 (0.0%) |
| High School Diploma | 77 (81.1%) | 12 (13.0%) |
| College / Associate Degree | 51 (100.0%) | 3 (5.9%) |
| Bachelor's Degree or higher | 4 (20.0%) | 0 (0.0%) |
| Total | 138 (73.8%) | 18 (9.4%) |
Employment Occupations by Sex in Coal Creek
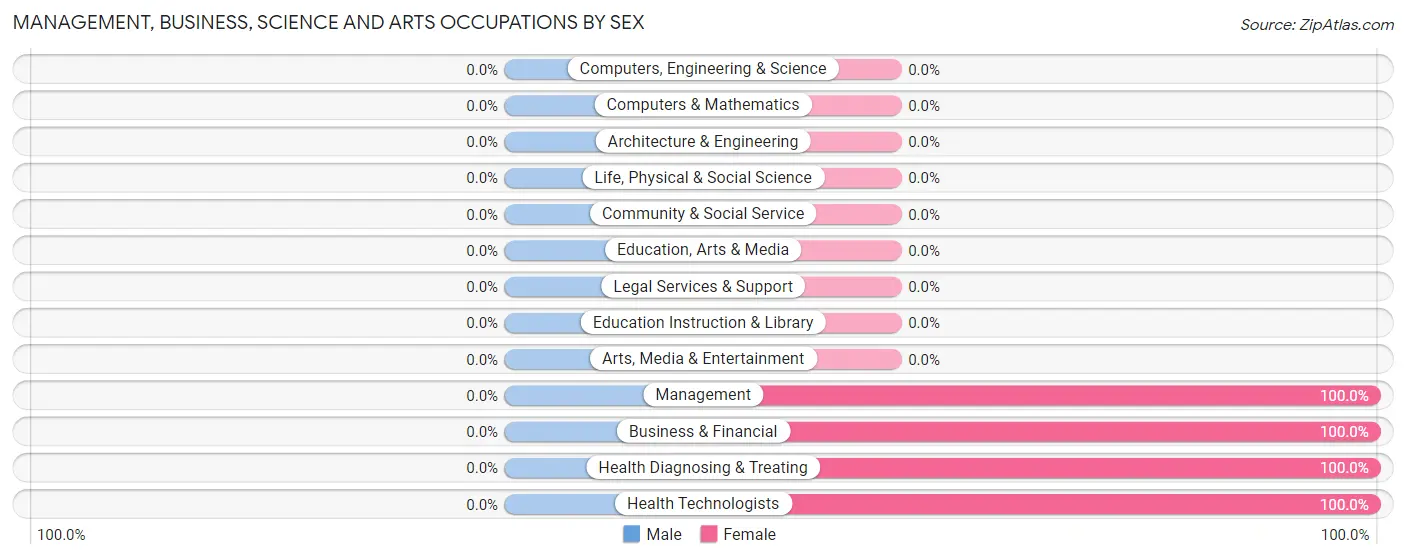
Management, Business, Science and Arts Occupations
The most common Management, Business, Science and Arts occupations in Coal Creek are Business & Financial (18 | 9.7%), Management (9 | 4.9%), Health Diagnosing & Treating (8 | 4.3%), and Health Technologists (4 | 2.2%).
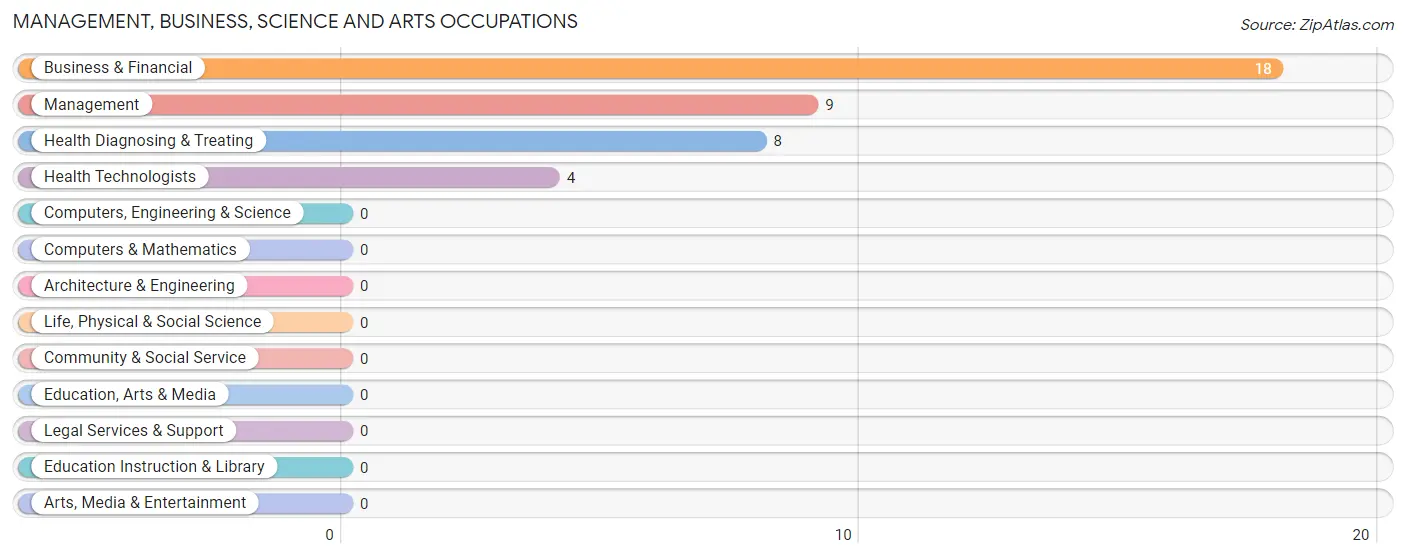
Management, Business, Science and Arts Occupations by Sex
| Occupation | Male | Female |
| Management | 0 (0.0%) | 9 (100.0%) |
| Business & Financial | 0 (0.0%) | 18 (100.0%) |
| Computers, Engineering & Science | 0 (0.0%) | 0 (0.0%) |
| Computers & Mathematics | 0 (0.0%) | 0 (0.0%) |
| Architecture & Engineering | 0 (0.0%) | 0 (0.0%) |
| Life, Physical & Social Science | 0 (0.0%) | 0 (0.0%) |
| Community & Social Service | 0 (0.0%) | 0 (0.0%) |
| Education, Arts & Media | 0 (0.0%) | 0 (0.0%) |
| Legal Services & Support | 0 (0.0%) | 0 (0.0%) |
| Education Instruction & Library | 0 (0.0%) | 0 (0.0%) |
| Arts, Media & Entertainment | 0 (0.0%) | 0 (0.0%) |
| Health Diagnosing & Treating | 0 (0.0%) | 8 (100.0%) |
| Health Technologists | 0 (0.0%) | 4 (100.0%) |
| Total (Category) | 0 (0.0%) | 35 (100.0%) |
| Total (Overall) | 110 (59.5%) | 75 (40.5%) |
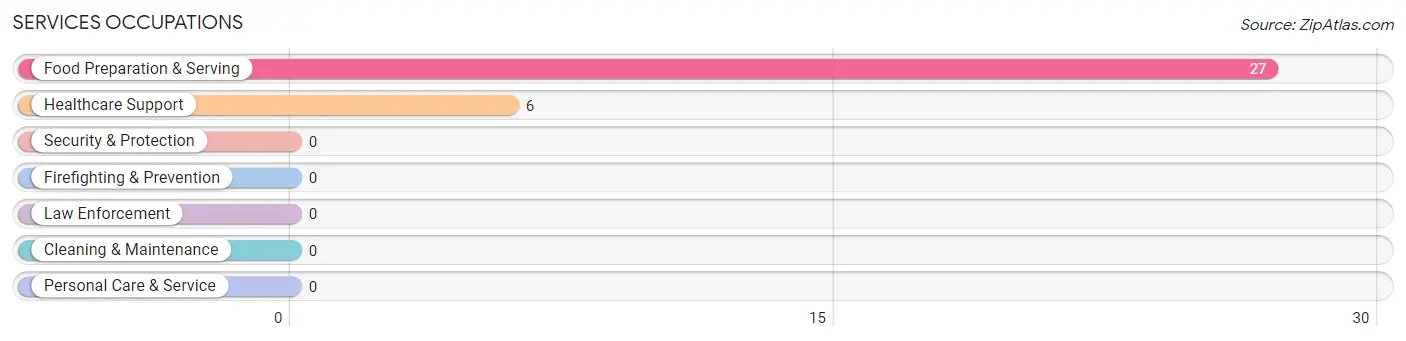
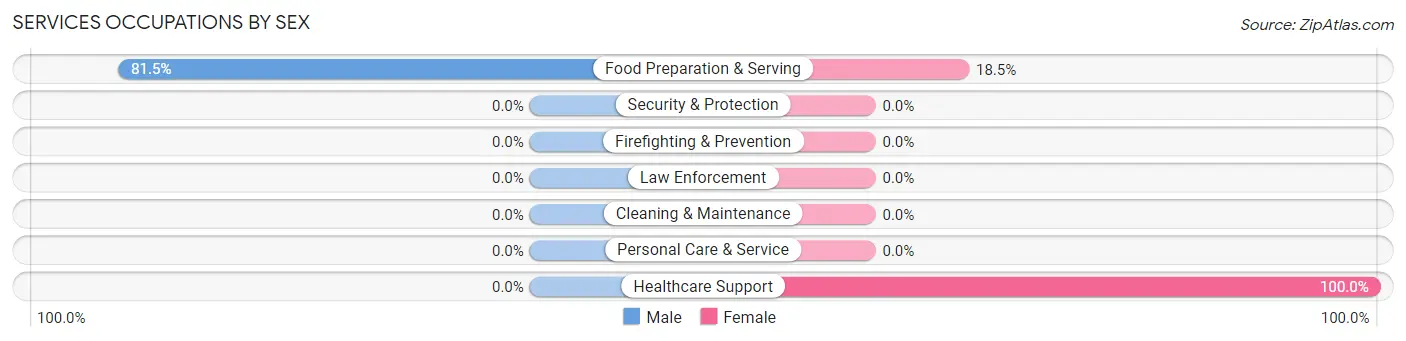
Services Occupations
The most common Services occupations in Coal Creek are Food Preparation & Serving (27 | 14.6%), and Healthcare Support (6 | 3.2%).
Services Occupations by Sex
| Occupation | Male | Female |
| Healthcare Support | 0 (0.0%) | 6 (100.0%) |
| Security & Protection | 0 (0.0%) | 0 (0.0%) |
| Firefighting & Prevention | 0 (0.0%) | 0 (0.0%) |
| Law Enforcement | 0 (0.0%) | 0 (0.0%) |
| Food Preparation & Serving | 22 (81.5%) | 5 (18.5%) |
| Cleaning & Maintenance | 0 (0.0%) | 0 (0.0%) |
| Personal Care & Service | 0 (0.0%) | 0 (0.0%) |
| Total (Category) | 22 (66.7%) | 11 (33.3%) |
| Total (Overall) | 110 (59.5%) | 75 (40.5%) |
Sales and Office Occupations
The most common Sales and Office occupations in Coal Creek are Office & Administration (25 | 13.5%), and Sales & Related (3 | 1.6%).

Sales and Office Occupations by Sex

| Occupation | Male | Female |
| Sales & Related | 3 (100.0%) | 0 (0.0%) |
| Office & Administration | 2 (8.0%) | 23 (92.0%) |
| Total (Category) | 5 (17.9%) | 23 (82.1%) |
| Total (Overall) | 110 (59.5%) | 75 (40.5%) |
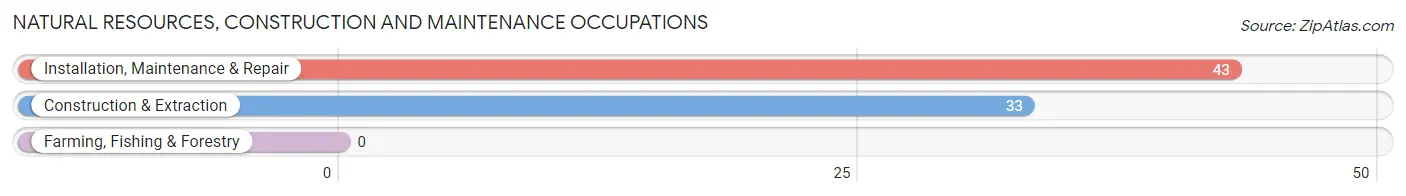
Natural Resources, Construction and Maintenance Occupations
The most common Natural Resources, Construction and Maintenance occupations in Coal Creek are Installation, Maintenance & Repair (43 | 23.2%), and Construction & Extraction (33 | 17.8%).
Natural Resources, Construction and Maintenance Occupations by Sex
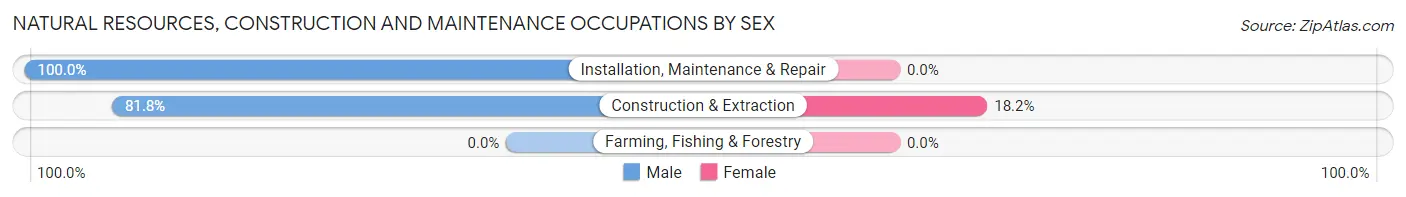
| Occupation | Male | Female |
| Farming, Fishing & Forestry | 0 (0.0%) | 0 (0.0%) |
| Construction & Extraction | 27 (81.8%) | 6 (18.2%) |
| Installation, Maintenance & Repair | 43 (100.0%) | 0 (0.0%) |
| Total (Category) | 70 (92.1%) | 6 (7.9%) |
| Total (Overall) | 110 (59.5%) | 75 (40.5%) |
Production, Transportation and Moving Occupations
The most common Production, Transportation and Moving occupations in Coal Creek are Production (10 | 5.4%), and Material Moving (3 | 1.6%).
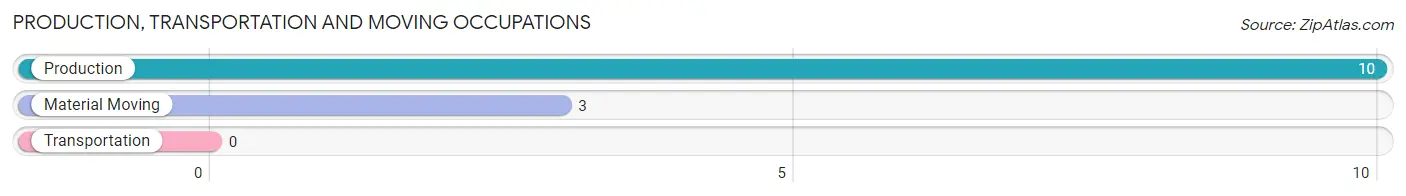
Production, Transportation and Moving Occupations by Sex
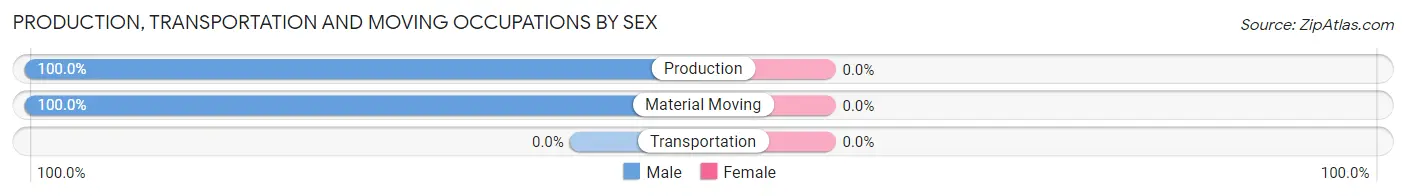
| Occupation | Male | Female |
| Production | 10 (100.0%) | 0 (0.0%) |
| Transportation | 0 (0.0%) | 0 (0.0%) |
| Material Moving | 3 (100.0%) | 0 (0.0%) |
| Total (Category) | 13 (100.0%) | 0 (0.0%) |
| Total (Overall) | 110 (59.5%) | 75 (40.5%) |
Employment Industries by Sex in Coal Creek
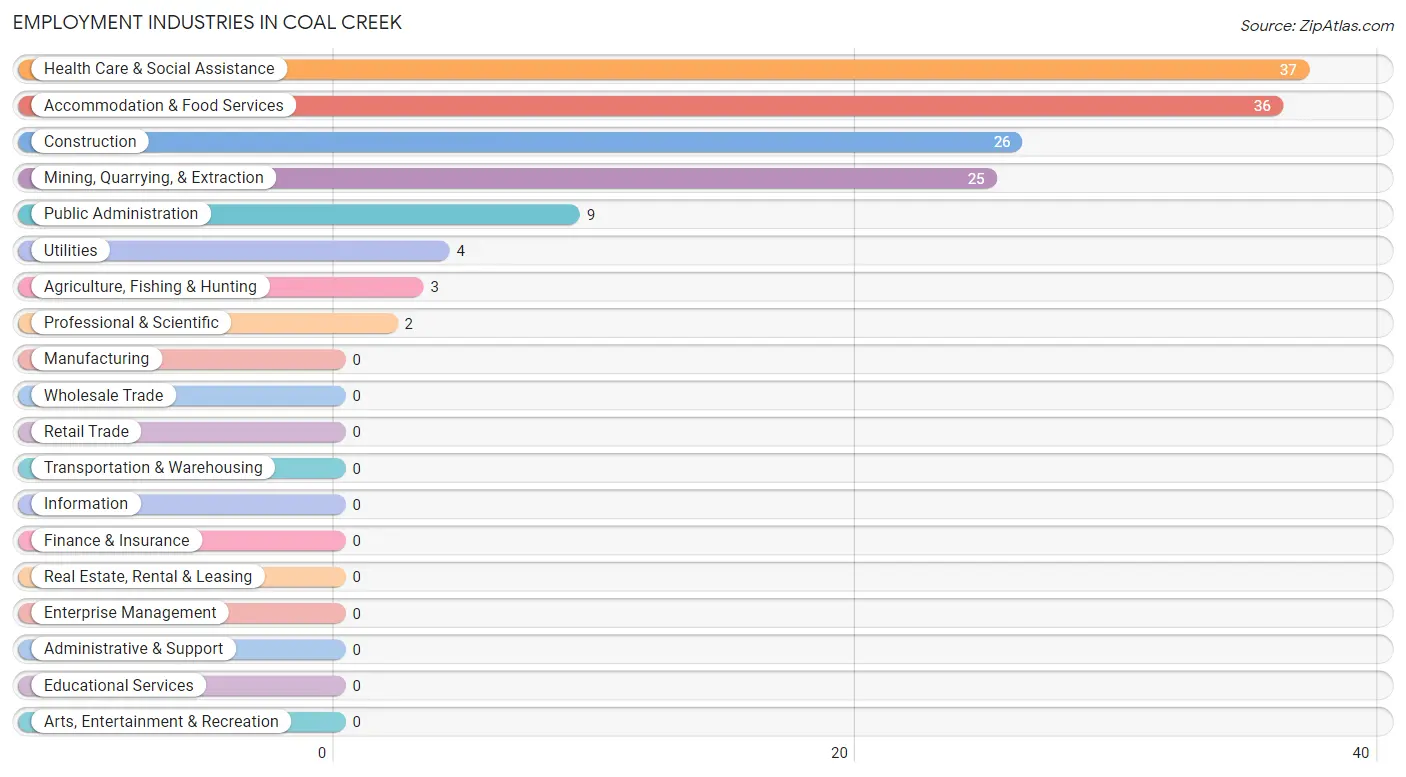
Employment Industries in Coal Creek
The major employment industries in Coal Creek include Health Care & Social Assistance (37 | 20.0%), Accommodation & Food Services (36 | 19.5%), Construction (26 | 14.1%), Mining, Quarrying, & Extraction (25 | 13.5%), and Public Administration (9 | 4.9%).
Employment Industries by Sex in Coal Creek
The Coal Creek industries that see more men than women are Agriculture, Fishing & Hunting (100.0%), Utilities (100.0%), and Professional & Scientific (100.0%), whereas the industries that tend to have a higher number of women are Health Care & Social Assistance (100.0%), Mining, Quarrying, & Extraction (72.0%), and Accommodation & Food Services (38.9%).
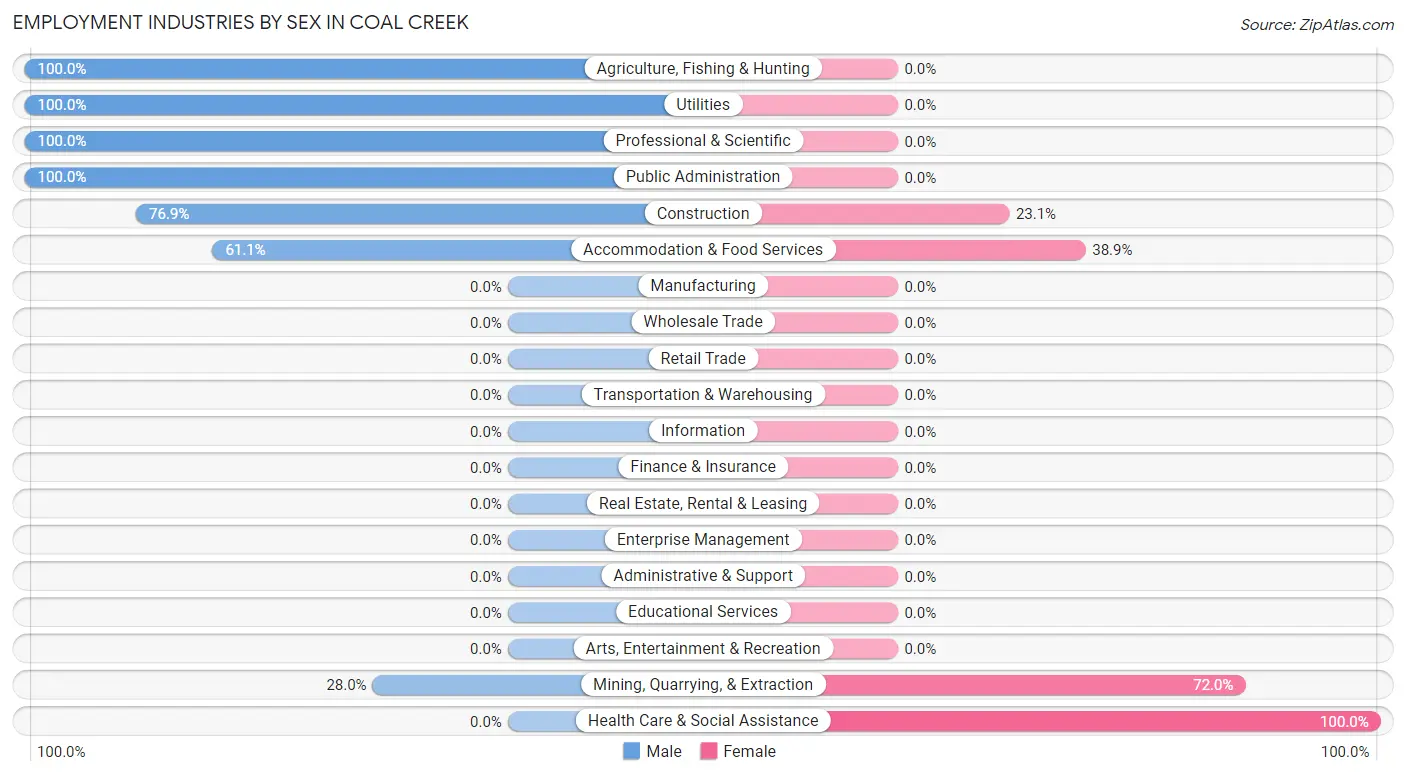
| Industry | Male | Female |
| Agriculture, Fishing & Hunting | 3 (100.0%) | 0 (0.0%) |
| Mining, Quarrying, & Extraction | 7 (28.0%) | 18 (72.0%) |
| Construction | 20 (76.9%) | 6 (23.1%) |
| Manufacturing | 0 (0.0%) | 0 (0.0%) |
| Wholesale Trade | 0 (0.0%) | 0 (0.0%) |
| Retail Trade | 0 (0.0%) | 0 (0.0%) |
| Transportation & Warehousing | 0 (0.0%) | 0 (0.0%) |
| Utilities | 4 (100.0%) | 0 (0.0%) |
| Information | 0 (0.0%) | 0 (0.0%) |
| Finance & Insurance | 0 (0.0%) | 0 (0.0%) |
| Real Estate, Rental & Leasing | 0 (0.0%) | 0 (0.0%) |
| Professional & Scientific | 2 (100.0%) | 0 (0.0%) |
| Enterprise Management | 0 (0.0%) | 0 (0.0%) |
| Administrative & Support | 0 (0.0%) | 0 (0.0%) |
| Educational Services | 0 (0.0%) | 0 (0.0%) |
| Health Care & Social Assistance | 0 (0.0%) | 37 (100.0%) |
| Arts, Entertainment & Recreation | 0 (0.0%) | 0 (0.0%) |
| Accommodation & Food Services | 22 (61.1%) | 14 (38.9%) |
| Public Administration | 9 (100.0%) | 0 (0.0%) |
| Total | 110 (59.5%) | 75 (40.5%) |
Education in Coal Creek
School Enrollment in Coal Creek
The most common levels of schooling among the 116 students in Coal Creek are high school (74 | 63.8%), middle school (19 | 16.4%), and college / undergraduate (18 | 15.5%).
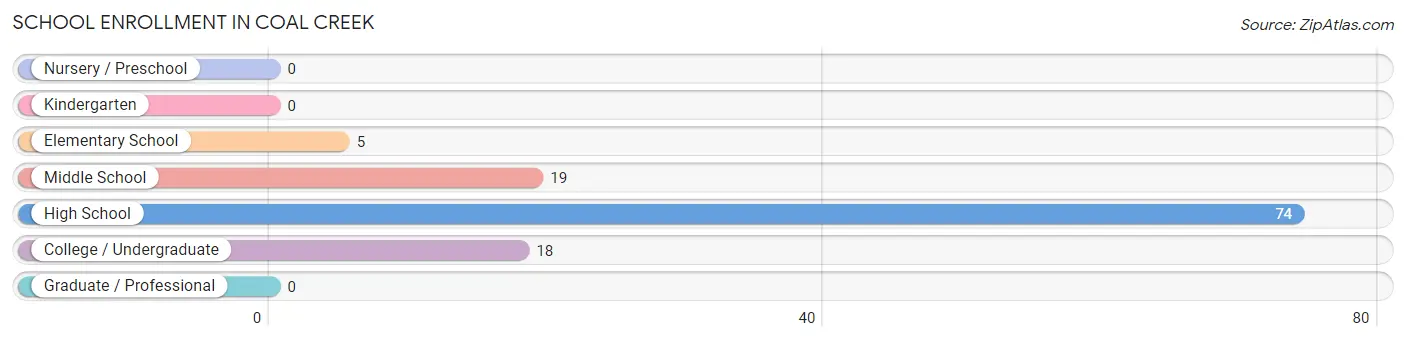
| School Level | # Students | % Students |
| Nursery / Preschool | 0 | 0.0% |
| Kindergarten | 0 | 0.0% |
| Elementary School | 5 | 4.3% |
| Middle School | 19 | 16.4% |
| High School | 74 | 63.8% |
| College / Undergraduate | 18 | 15.5% |
| Graduate / Professional | 0 | 0.0% |
| Total | 116 | 100.0% |
School Enrollment by Age by Funding Source in Coal Creek
Out of a total of 116 students who are enrolled in schools in Coal Creek, 5 (4.3%) attend a private institution, while the remaining 111 (95.7%) are enrolled in public schools. The age group of 20 to 24 year olds has the highest likelihood of being enrolled in private schools, with 5 (27.8% in the age bracket) enrolled. Conversely, the age group of 5 to 9 year old has the lowest likelihood of being enrolled in a private school, with 5 (100.0% in the age bracket) attending a public institution.
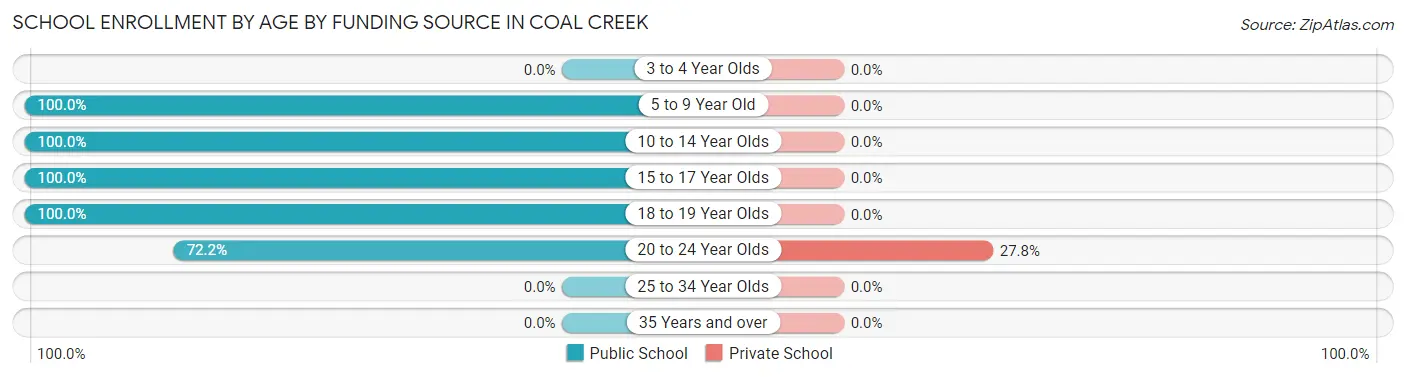
| Age Bracket | Public School | Private School |
| 3 to 4 Year Olds | 0 (0.0%) | 0 (0.0%) |
| 5 to 9 Year Old | 5 (100.0%) | 0 (0.0%) |
| 10 to 14 Year Olds | 23 (100.0%) | 0 (0.0%) |
| 15 to 17 Year Olds | 60 (100.0%) | 0 (0.0%) |
| 18 to 19 Year Olds | 10 (100.0%) | 0 (0.0%) |
| 20 to 24 Year Olds | 13 (72.2%) | 5 (27.8%) |
| 25 to 34 Year Olds | 0 (0.0%) | 0 (0.0%) |
| 35 Years and over | 0 (0.0%) | 0 (0.0%) |
| Total | 111 (95.7%) | 5 (4.3%) |
Educational Attainment by Field of Study in Coal Creek
Business (12 | 40.0%), science & technology (8 | 26.7%), psychology (5 | 16.7%), education (4 | 13.3%), and social sciences (1 | 3.3%) are the most common fields of study among 30 individuals in Coal Creek who have obtained a bachelor's degree or higher.
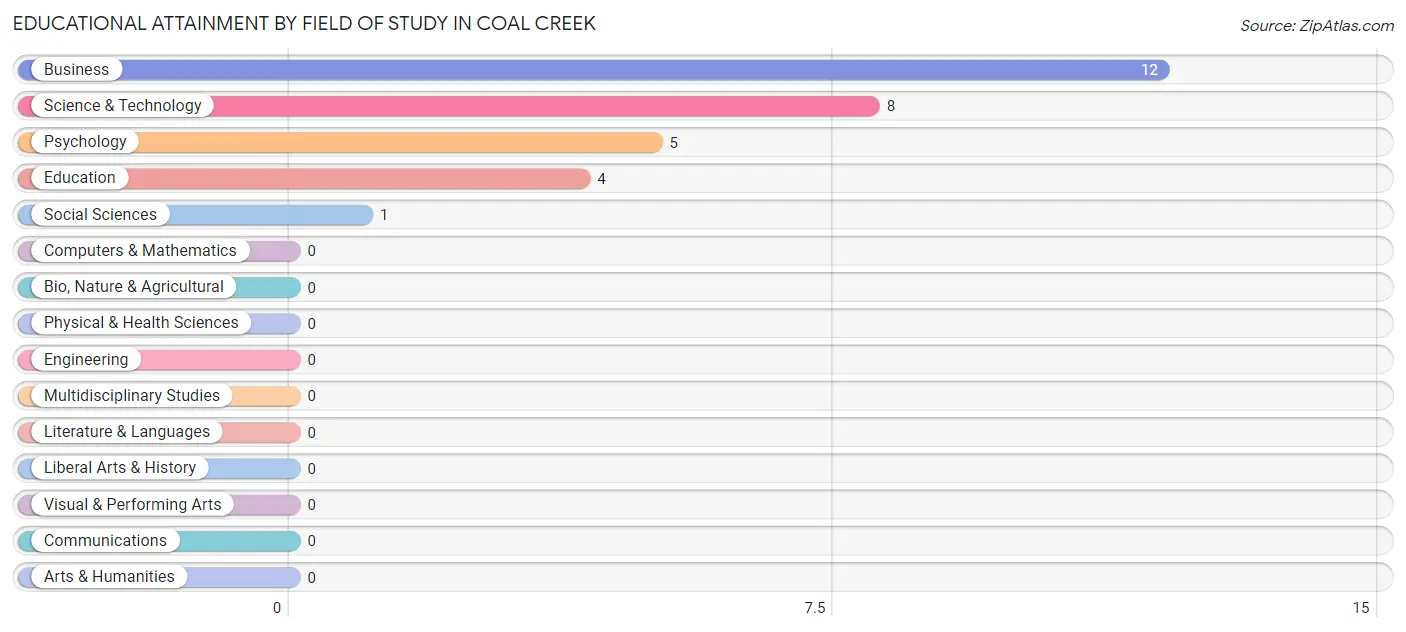
| Field of Study | # Graduates | % Graduates |
| Computers & Mathematics | 0 | 0.0% |
| Bio, Nature & Agricultural | 0 | 0.0% |
| Physical & Health Sciences | 0 | 0.0% |
| Psychology | 5 | 16.7% |
| Social Sciences | 1 | 3.3% |
| Engineering | 0 | 0.0% |
| Multidisciplinary Studies | 0 | 0.0% |
| Science & Technology | 8 | 26.7% |
| Business | 12 | 40.0% |
| Education | 4 | 13.3% |
| Literature & Languages | 0 | 0.0% |
| Liberal Arts & History | 0 | 0.0% |
| Visual & Performing Arts | 0 | 0.0% |
| Communications | 0 | 0.0% |
| Arts & Humanities | 0 | 0.0% |
| Total | 30 | 100.0% |
Transportation & Commute in Coal Creek
Vehicle Availability by Sex in Coal Creek
The most prevalent vehicle ownership categories in Coal Creek are males with 3 vehicles (45, accounting for 40.9%) and females with 3 vehicles (13, making up 60.0%).
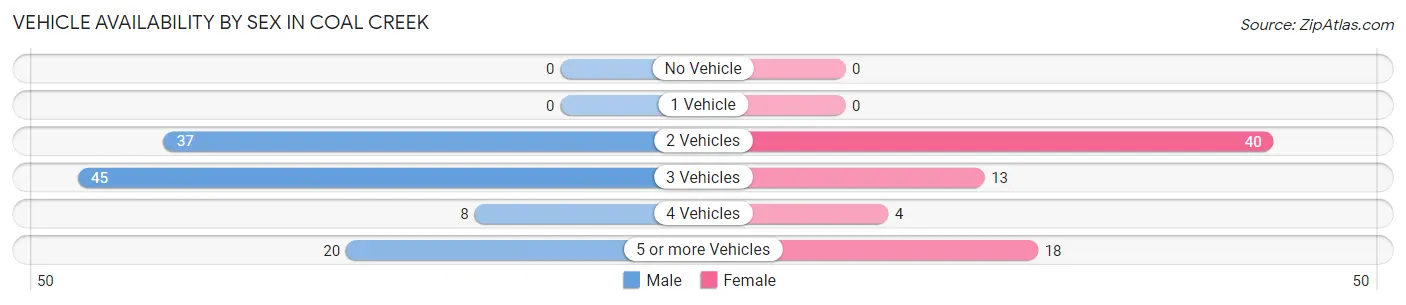
| Vehicles Available | Male | Female |
| No Vehicle | 0 (0.0%) | 0 (0.0%) |
| 1 Vehicle | 0 (0.0%) | 0 (0.0%) |
| 2 Vehicles | 37 (33.6%) | 40 (53.3%) |
| 3 Vehicles | 45 (40.9%) | 13 (17.3%) |
| 4 Vehicles | 8 (7.3%) | 4 (5.3%) |
| 5 or more Vehicles | 20 (18.2%) | 18 (24.0%) |
| Total | 110 (100.0%) | 75 (100.0%) |
Commute Time in Coal Creek
The most frequently occuring commute durations in Coal Creek are 20 to 24 minutes (88 commuters, 48.6%), 15 to 19 minutes (39 commuters, 21.5%), and 90 or more minutes (27 commuters, 14.9%).
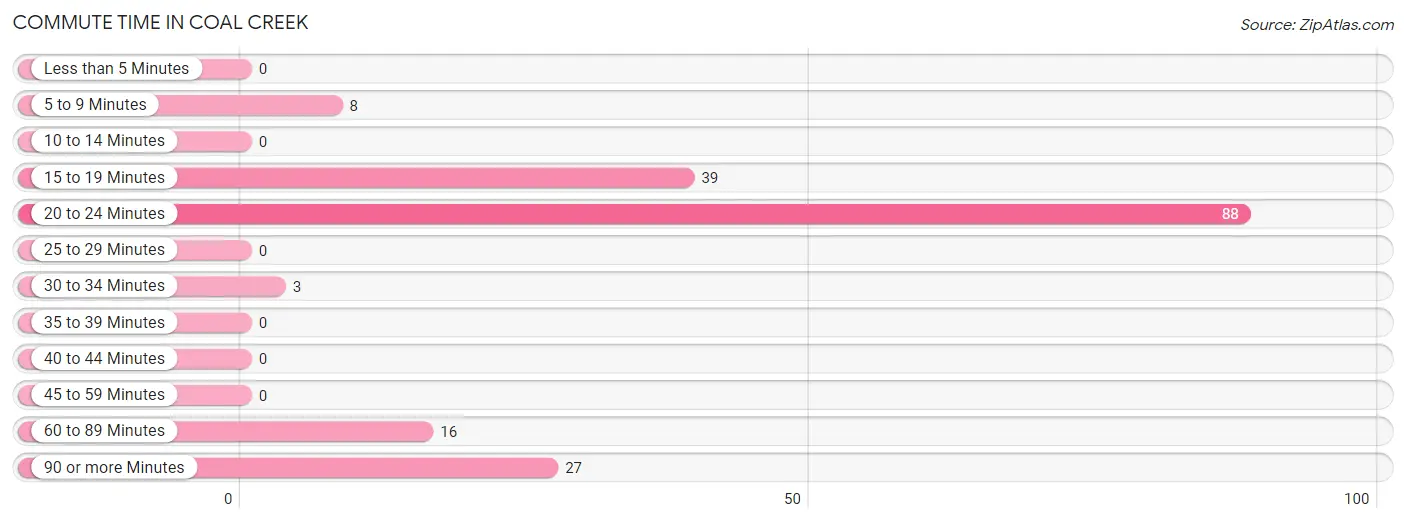
| Commute Time | # Commuters | % Commuters |
| Less than 5 Minutes | 0 | 0.0% |
| 5 to 9 Minutes | 8 | 4.4% |
| 10 to 14 Minutes | 0 | 0.0% |
| 15 to 19 Minutes | 39 | 21.5% |
| 20 to 24 Minutes | 88 | 48.6% |
| 25 to 29 Minutes | 0 | 0.0% |
| 30 to 34 Minutes | 3 | 1.7% |
| 35 to 39 Minutes | 0 | 0.0% |
| 40 to 44 Minutes | 0 | 0.0% |
| 45 to 59 Minutes | 0 | 0.0% |
| 60 to 89 Minutes | 16 | 8.8% |
| 90 or more Minutes | 27 | 14.9% |
Commute Time by Sex in Coal Creek
The most common commute times in Coal Creek are 20 to 24 minutes (56 commuters, 50.9%) for males and 20 to 24 minutes (32 commuters, 45.1%) for females.
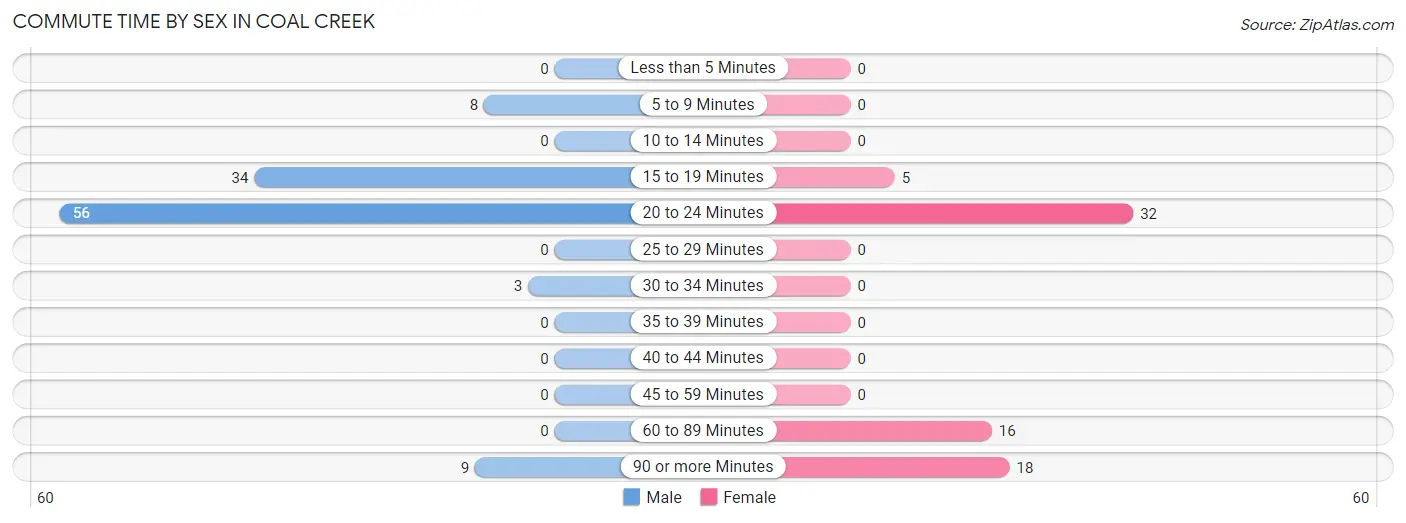
| Commute Time | Male | Female |
| Less than 5 Minutes | 0 (0.0%) | 0 (0.0%) |
| 5 to 9 Minutes | 8 (7.3%) | 0 (0.0%) |
| 10 to 14 Minutes | 0 (0.0%) | 0 (0.0%) |
| 15 to 19 Minutes | 34 (30.9%) | 5 (7.0%) |
| 20 to 24 Minutes | 56 (50.9%) | 32 (45.1%) |
| 25 to 29 Minutes | 0 (0.0%) | 0 (0.0%) |
| 30 to 34 Minutes | 3 (2.7%) | 0 (0.0%) |
| 35 to 39 Minutes | 0 (0.0%) | 0 (0.0%) |
| 40 to 44 Minutes | 0 (0.0%) | 0 (0.0%) |
| 45 to 59 Minutes | 0 (0.0%) | 0 (0.0%) |
| 60 to 89 Minutes | 0 (0.0%) | 16 (22.5%) |
| 90 or more Minutes | 9 (8.2%) | 18 (25.4%) |
Time of Departure to Work by Sex in Coal Creek
The most frequent times of departure to work in Coal Creek are 7:30 AM to 7:59 AM (47, 42.7%) for males and 7:00 AM to 7:29 AM (28, 39.4%) for females.
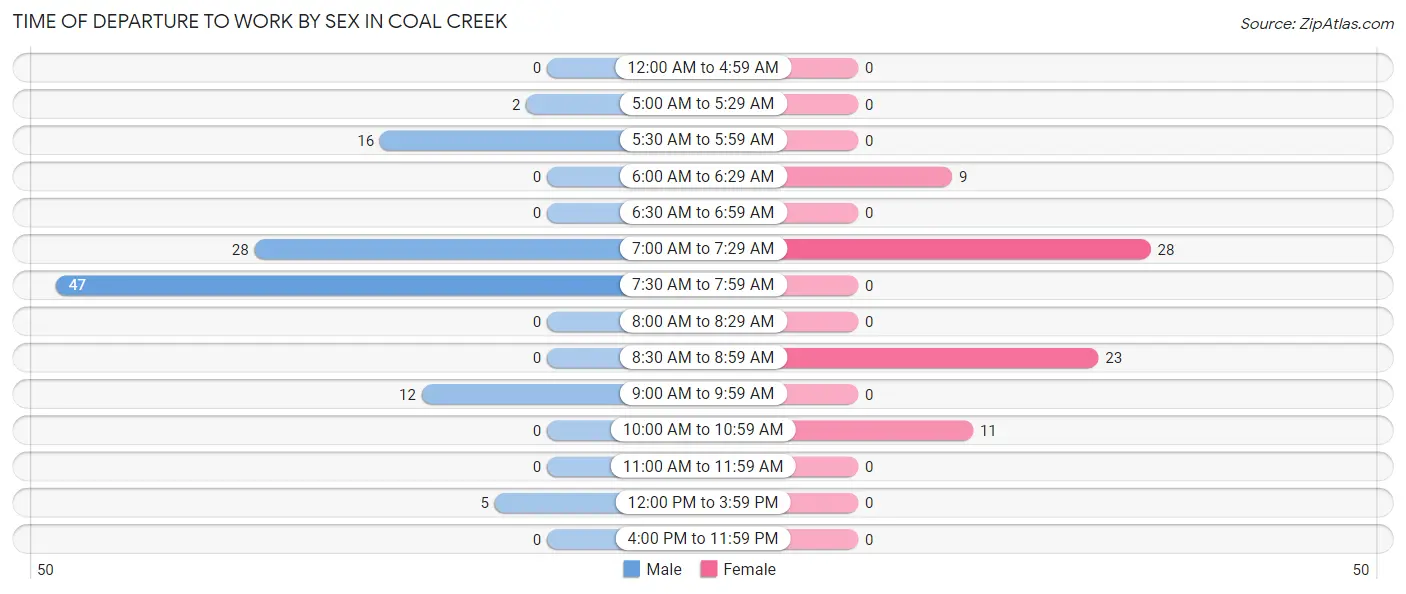
| Time of Departure | Male | Female |
| 12:00 AM to 4:59 AM | 0 (0.0%) | 0 (0.0%) |
| 5:00 AM to 5:29 AM | 2 (1.8%) | 0 (0.0%) |
| 5:30 AM to 5:59 AM | 16 (14.5%) | 0 (0.0%) |
| 6:00 AM to 6:29 AM | 0 (0.0%) | 9 (12.7%) |
| 6:30 AM to 6:59 AM | 0 (0.0%) | 0 (0.0%) |
| 7:00 AM to 7:29 AM | 28 (25.5%) | 28 (39.4%) |
| 7:30 AM to 7:59 AM | 47 (42.7%) | 0 (0.0%) |
| 8:00 AM to 8:29 AM | 0 (0.0%) | 0 (0.0%) |
| 8:30 AM to 8:59 AM | 0 (0.0%) | 23 (32.4%) |
| 9:00 AM to 9:59 AM | 12 (10.9%) | 0 (0.0%) |
| 10:00 AM to 10:59 AM | 0 (0.0%) | 11 (15.5%) |
| 11:00 AM to 11:59 AM | 0 (0.0%) | 0 (0.0%) |
| 12:00 PM to 3:59 PM | 5 (4.5%) | 0 (0.0%) |
| 4:00 PM to 11:59 PM | 0 (0.0%) | 0 (0.0%) |
| Total | 110 (100.0%) | 71 (100.0%) |
Housing Occupancy in Coal Creek
Occupancy by Ownership in Coal Creek
Of the total 1,148 dwellings in Coal Creek, owner-occupied units account for 1,066 (92.9%), while renter-occupied units make up 82 (7.1%).
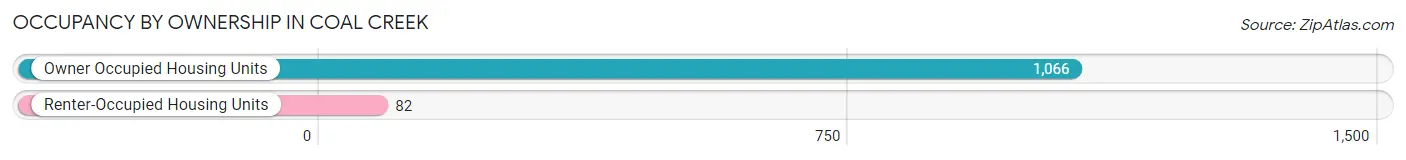
| Occupancy | # Housing Units | % Housing Units |
| Owner Occupied Housing Units | 1,066 | 92.9% |
| Renter-Occupied Housing Units | 82 | 7.1% |
| Total Occupied Housing Units | 1,148 | 100.0% |
Occupancy by Household Size in Coal Creek
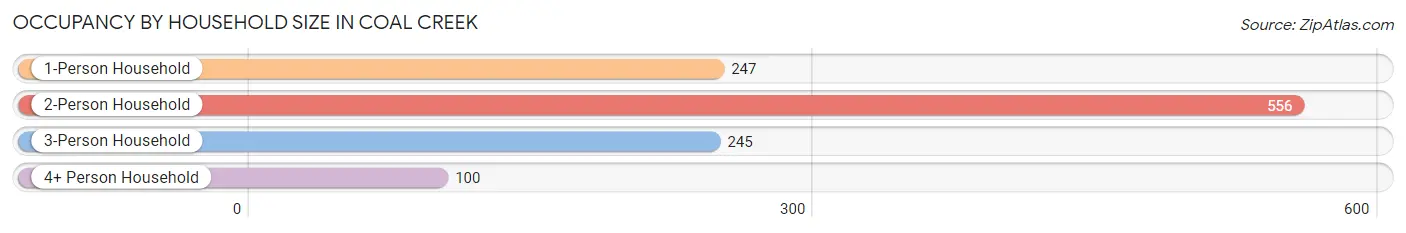
| Household Size | # Housing Units | % Housing Units |
| 1-Person Household | 247 | 21.5% |
| 2-Person Household | 556 | 48.4% |
| 3-Person Household | 245 | 21.3% |
| 4+ Person Household | 100 | 8.7% |
| Total Housing Units | 1,148 | 100.0% |
Occupancy by Ownership by Household Size in Coal Creek
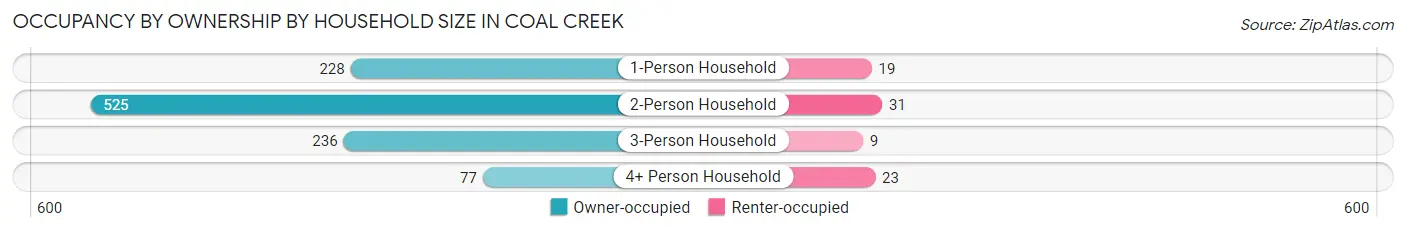
| Household Size | Owner-occupied | Renter-occupied |
| 1-Person Household | 228 (92.3%) | 19 (7.7%) |
| 2-Person Household | 525 (94.4%) | 31 (5.6%) |
| 3-Person Household | 236 (96.3%) | 9 (3.7%) |
| 4+ Person Household | 77 (77.0%) | 23 (23.0%) |
| Total Housing Units | 1,066 (92.9%) | 82 (7.1%) |
Occupancy by Educational Attainment in Coal Creek
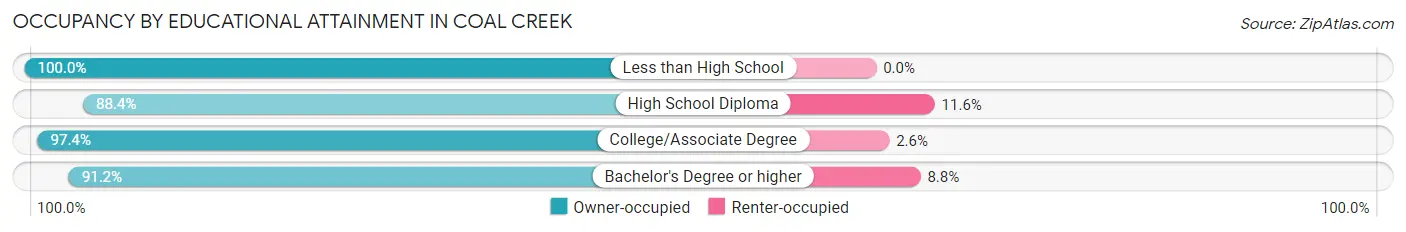
| Household Size | Owner-occupied | Renter-occupied |
| Less than High School | 13 (100.0%) | 0 (0.0%) |
| High School Diploma | 122 (88.4%) | 16 (11.6%) |
| College/Associate Degree | 339 (97.4%) | 9 (2.6%) |
| Bachelor's Degree or higher | 592 (91.2%) | 57 (8.8%) |
Occupancy by Age of Householder in Coal Creek
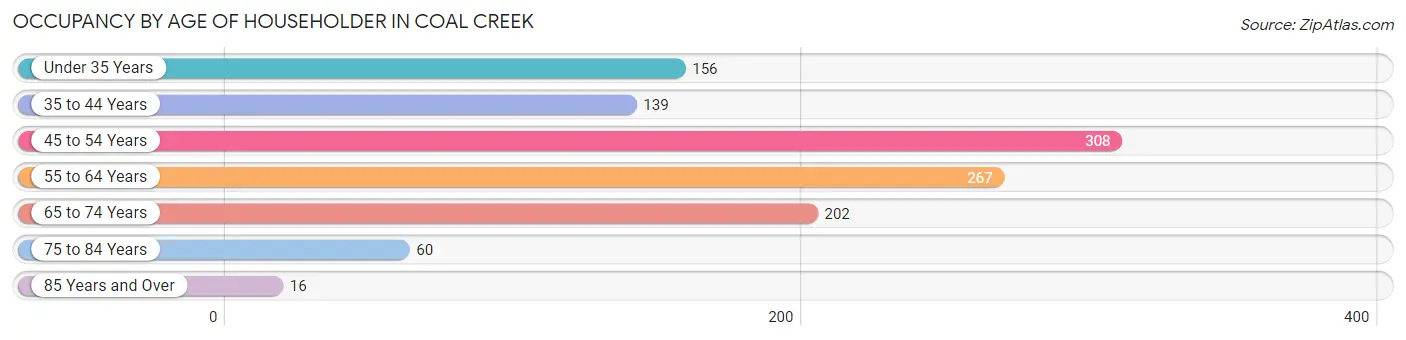
| Age Bracket | # Households | % Households |
| Under 35 Years | 156 | 13.6% |
| 35 to 44 Years | 139 | 12.1% |
| 45 to 54 Years | 308 | 26.8% |
| 55 to 64 Years | 267 | 23.3% |
| 65 to 74 Years | 202 | 17.6% |
| 75 to 84 Years | 60 | 5.2% |
| 85 Years and Over | 16 | 1.4% |
| Total | 1,148 | 100.0% |
Housing Finances in Coal Creek
Median Income by Occupancy in Coal Creek
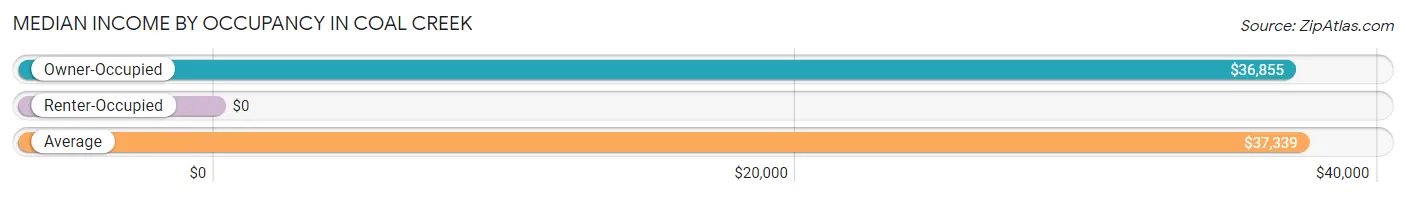
| Occupancy Type | # Households | Median Income |
| Owner-Occupied | 154 (85.6%) | $36,855 |
| Renter-Occupied | 26 (14.4%) | $0 |
| Average | 180 (100.0%) | $37,339 |
Occupancy by Householder Income Bracket in Coal Creek
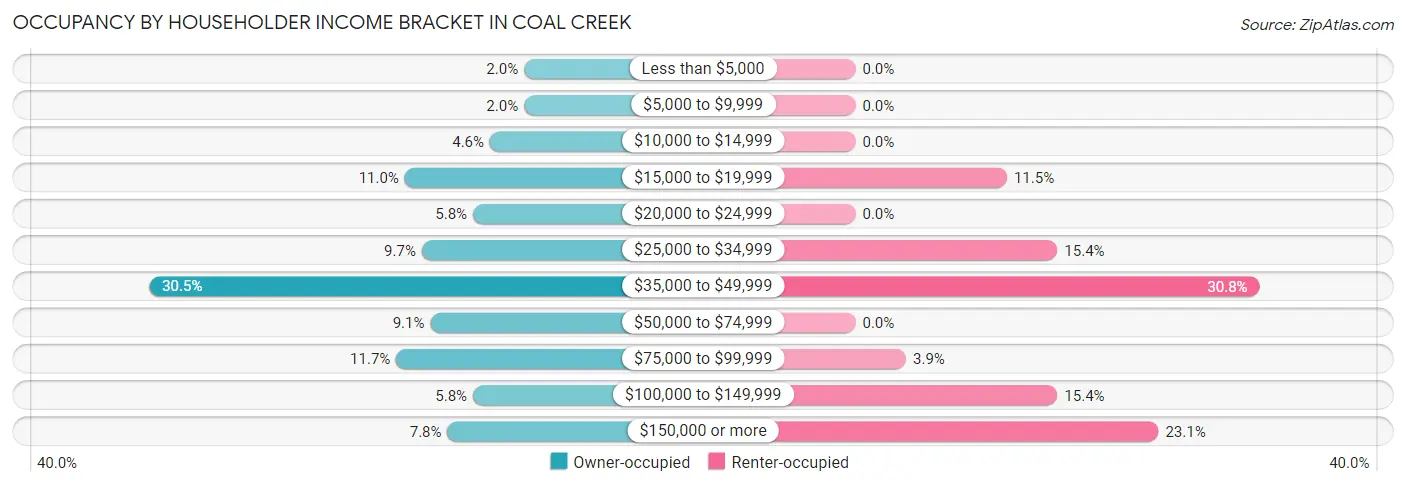
| Income Bracket | Owner-occupied | Renter-occupied |
| Less than $5,000 | 3 (1.9%) | 0 (0.0%) |
| $5,000 to $9,999 | 3 (1.9%) | 0 (0.0%) |
| $10,000 to $14,999 | 7 (4.5%) | 0 (0.0%) |
| $15,000 to $19,999 | 17 (11.0%) | 3 (11.5%) |
| $20,000 to $24,999 | 9 (5.8%) | 0 (0.0%) |
| $25,000 to $34,999 | 15 (9.7%) | 4 (15.4%) |
| $35,000 to $49,999 | 47 (30.5%) | 8 (30.8%) |
| $50,000 to $74,999 | 14 (9.1%) | 0 (0.0%) |
| $75,000 to $99,999 | 18 (11.7%) | 1 (3.8%) |
| $100,000 to $149,999 | 9 (5.8%) | 4 (15.4%) |
| $150,000 or more | 12 (7.8%) | 6 (23.1%) |
| Total | 154 (100.0%) | 26 (100.0%) |
Monthly Housing Cost Tiers in Coal Creek
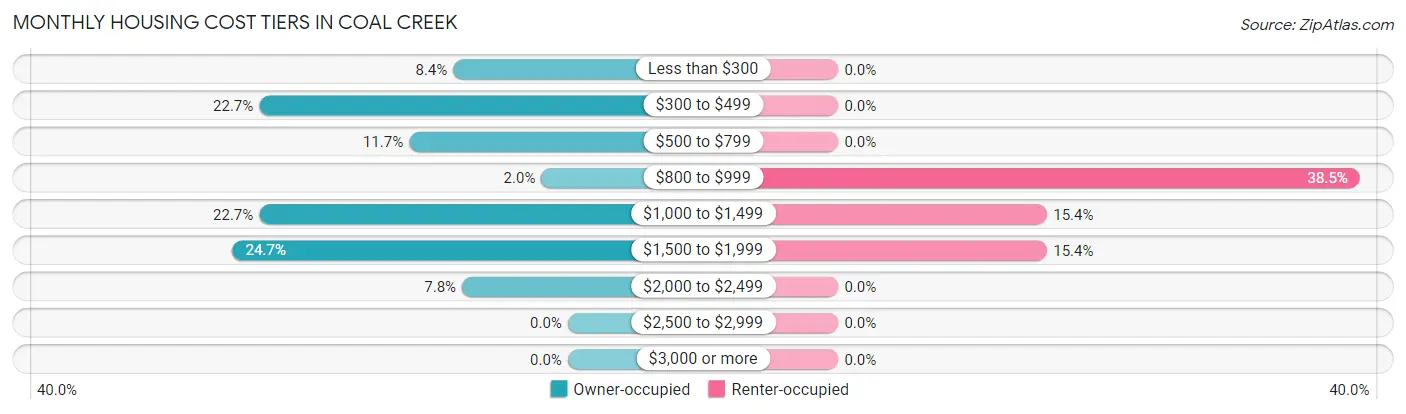
| Monthly Cost | Owner-occupied | Renter-occupied |
| Less than $300 | 13 (8.4%) | 0 (0.0%) |
| $300 to $499 | 35 (22.7%) | 0 (0.0%) |
| $500 to $799 | 18 (11.7%) | 0 (0.0%) |
| $800 to $999 | 3 (1.9%) | 10 (38.5%) |
| $1,000 to $1,499 | 35 (22.7%) | 4 (15.4%) |
| $1,500 to $1,999 | 38 (24.7%) | 4 (15.4%) |
| $2,000 to $2,499 | 12 (7.8%) | 0 (0.0%) |
| $2,500 to $2,999 | 0 (0.0%) | 0 (0.0%) |
| $3,000 or more | 0 (0.0%) | 0 (0.0%) |
| Total | 154 (100.0%) | 26 (100.0%) |
Physical Housing Characteristics in Coal Creek
Housing Structures in Coal Creek
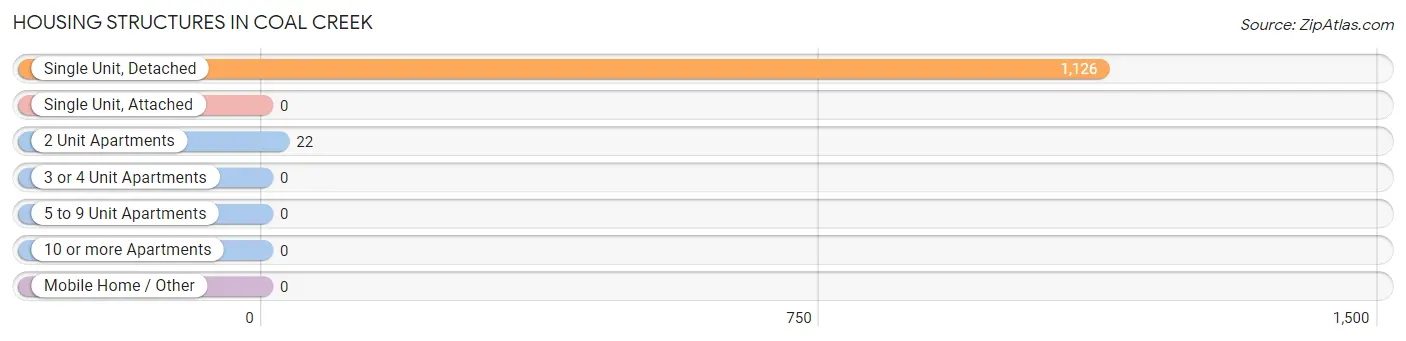
| Structure Type | # Housing Units | % Housing Units |
| Single Unit, Detached | 1,126 | 98.1% |
| Single Unit, Attached | 0 | 0.0% |
| 2 Unit Apartments | 22 | 1.9% |
| 3 or 4 Unit Apartments | 0 | 0.0% |
| 5 to 9 Unit Apartments | 0 | 0.0% |
| 10 or more Apartments | 0 | 0.0% |
| Mobile Home / Other | 0 | 0.0% |
| Total | 1,148 | 100.0% |
Housing Structures by Occupancy in Coal Creek
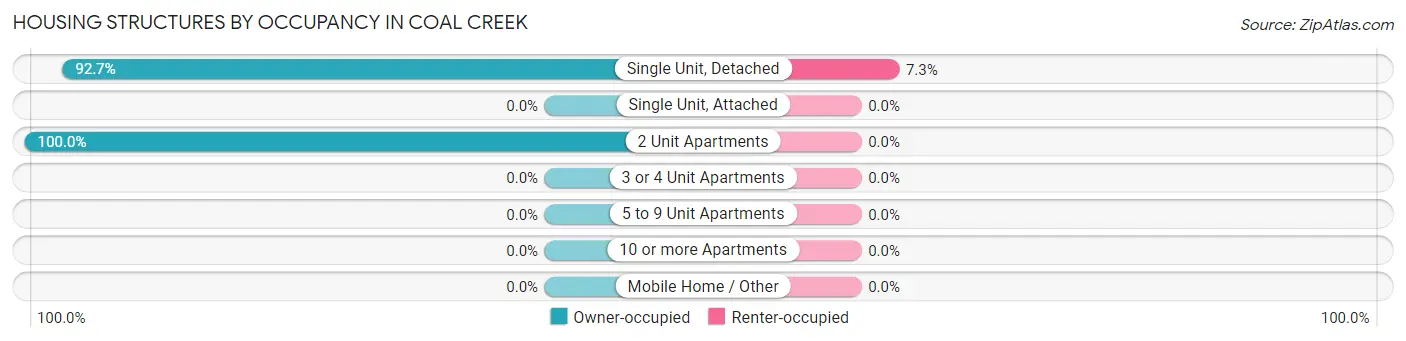
| Structure Type | Owner-occupied | Renter-occupied |
| Single Unit, Detached | 1,044 (92.7%) | 82 (7.3%) |
| Single Unit, Attached | 0 (0.0%) | 0 (0.0%) |
| 2 Unit Apartments | 22 (100.0%) | 0 (0.0%) |
| 3 or 4 Unit Apartments | 0 (0.0%) | 0 (0.0%) |
| 5 to 9 Unit Apartments | 0 (0.0%) | 0 (0.0%) |
| 10 or more Apartments | 0 (0.0%) | 0 (0.0%) |
| Mobile Home / Other | 0 (0.0%) | 0 (0.0%) |
| Total | 1,066 (92.9%) | 82 (7.1%) |
Housing Structures by Number of Rooms in Coal Creek
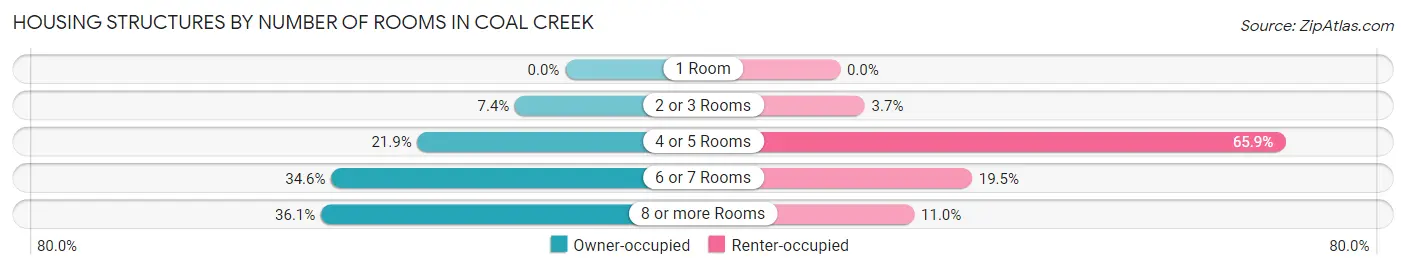
| Number of Rooms | Owner-occupied | Renter-occupied |
| 1 Room | 0 (0.0%) | 0 (0.0%) |
| 2 or 3 Rooms | 79 (7.4%) | 3 (3.7%) |
| 4 or 5 Rooms | 233 (21.9%) | 54 (65.8%) |
| 6 or 7 Rooms | 369 (34.6%) | 16 (19.5%) |
| 8 or more Rooms | 385 (36.1%) | 9 (11.0%) |
| Total | 1,066 (100.0%) | 82 (100.0%) |
Housing Structure by Heating Type in Coal Creek
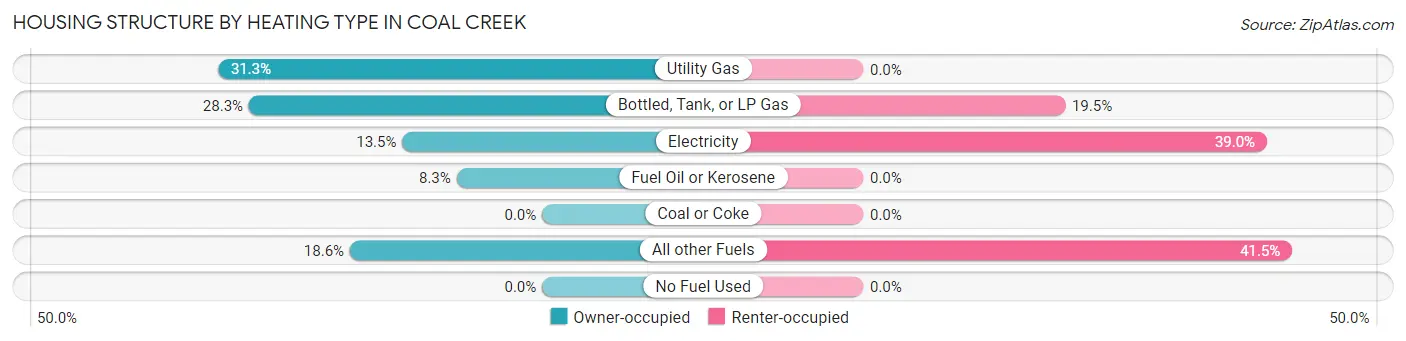
| Heating Type | Owner-occupied | Renter-occupied |
| Utility Gas | 334 (31.3%) | 0 (0.0%) |
| Bottled, Tank, or LP Gas | 302 (28.3%) | 16 (19.5%) |
| Electricity | 144 (13.5%) | 32 (39.0%) |
| Fuel Oil or Kerosene | 88 (8.3%) | 0 (0.0%) |
| Coal or Coke | 0 (0.0%) | 0 (0.0%) |
| All other Fuels | 198 (18.6%) | 34 (41.5%) |
| No Fuel Used | 0 (0.0%) | 0 (0.0%) |
| Total | 1,066 (100.0%) | 82 (100.0%) |
Household Vehicle Usage in Coal Creek
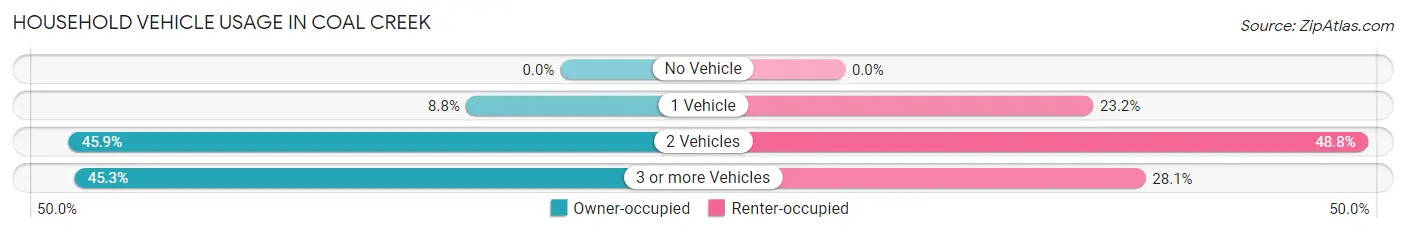
| Vehicles per Household | Owner-occupied | Renter-occupied |
| No Vehicle | 0 (0.0%) | 0 (0.0%) |
| 1 Vehicle | 94 (8.8%) | 19 (23.2%) |
| 2 Vehicles | 489 (45.9%) | 40 (48.8%) |
| 3 or more Vehicles | 483 (45.3%) | 23 (28.1%) |
| Total | 1,066 (100.0%) | 82 (100.0%) |
Real Estate & Mortgages in Coal Creek
Real Estate and Mortgage Overview in Coal Creek
| Characteristic | Without Mortgage | With Mortgage |
| Housing Units | 197 | 93 |
| Median Property Value | $544,500 | $226,800 |
| Median Household Income | $104,350 | $12 |
| Monthly Housing Costs | $558 | $0 |
| Real Estate Taxes | $1,791 | $0 |
Property Value by Mortgage Status in Coal Creek
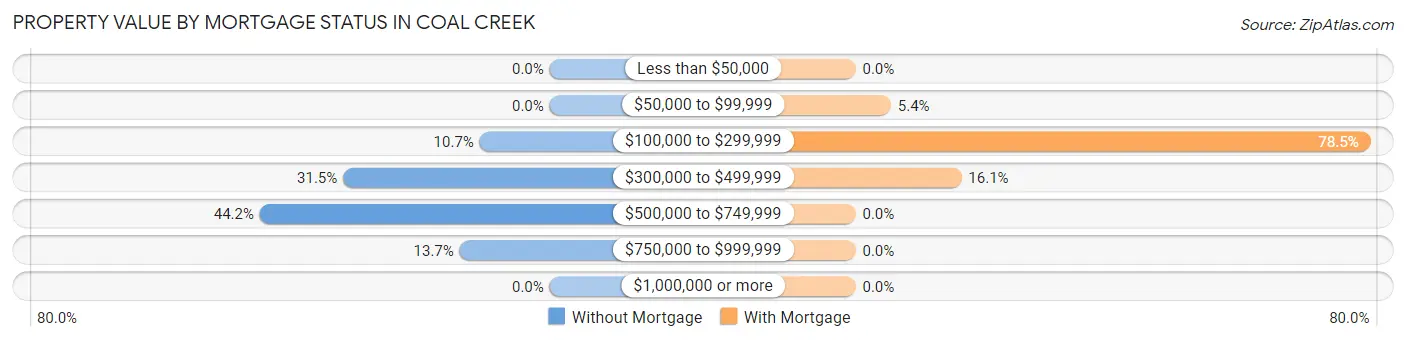
| Property Value | Without Mortgage | With Mortgage |
| Less than $50,000 | 0 (0.0%) | 0 (0.0%) |
| $50,000 to $99,999 | 0 (0.0%) | 5 (5.4%) |
| $100,000 to $299,999 | 21 (10.7%) | 73 (78.5%) |
| $300,000 to $499,999 | 62 (31.5%) | 15 (16.1%) |
| $500,000 to $749,999 | 87 (44.2%) | 0 (0.0%) |
| $750,000 to $999,999 | 27 (13.7%) | 0 (0.0%) |
| $1,000,000 or more | 0 (0.0%) | 0 (0.0%) |
| Total | 197 (100.0%) | 93 (100.0%) |
Household Income by Mortgage Status in Coal Creek
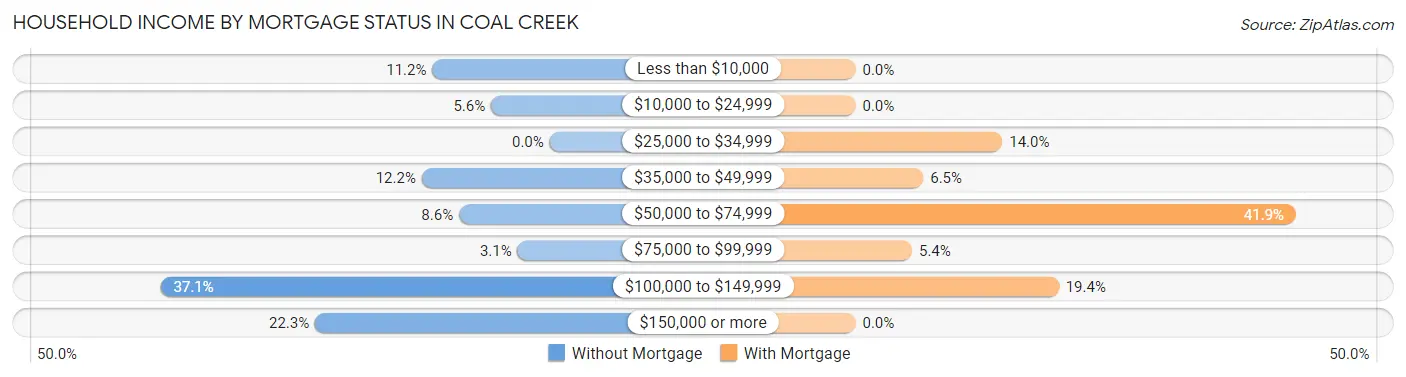
| Household Income | Without Mortgage | With Mortgage |
| Less than $10,000 | 22 (11.2%) | 0 (0.0%) |
| $10,000 to $24,999 | 11 (5.6%) | 0 (0.0%) |
| $25,000 to $34,999 | 0 (0.0%) | 13 (14.0%) |
| $35,000 to $49,999 | 24 (12.2%) | 6 (6.5%) |
| $50,000 to $74,999 | 17 (8.6%) | 39 (41.9%) |
| $75,000 to $99,999 | 6 (3.0%) | 5 (5.4%) |
| $100,000 to $149,999 | 73 (37.1%) | 18 (19.4%) |
| $150,000 or more | 44 (22.3%) | 0 (0.0%) |
| Total | 197 (100.0%) | 93 (100.0%) |
Property Value to Household Income Ratio in Coal Creek
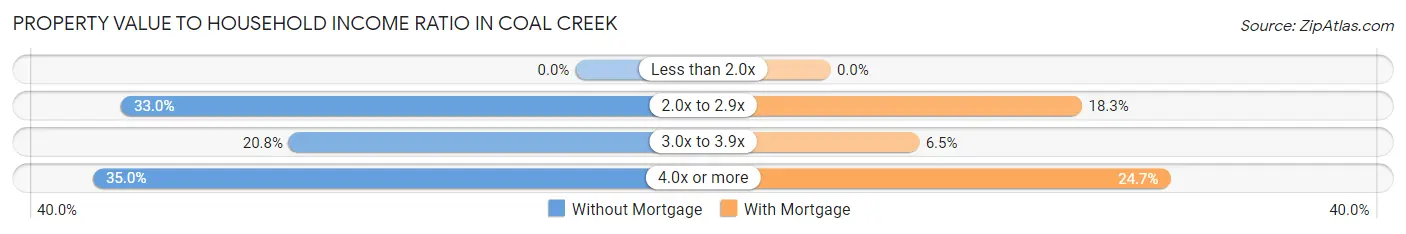
| Value-to-Income Ratio | Without Mortgage | With Mortgage |
| Less than 2.0x | 0 (0.0%) | 0 (0.0%) |
| 2.0x to 2.9x | 65 (33.0%) | 17 (18.3%) |
| 3.0x to 3.9x | 41 (20.8%) | 6 (6.5%) |
| 4.0x or more | 69 (35.0%) | 23 (24.7%) |
| Total | 197 (100.0%) | 93 (100.0%) |
Real Estate Taxes by Mortgage Status in Coal Creek
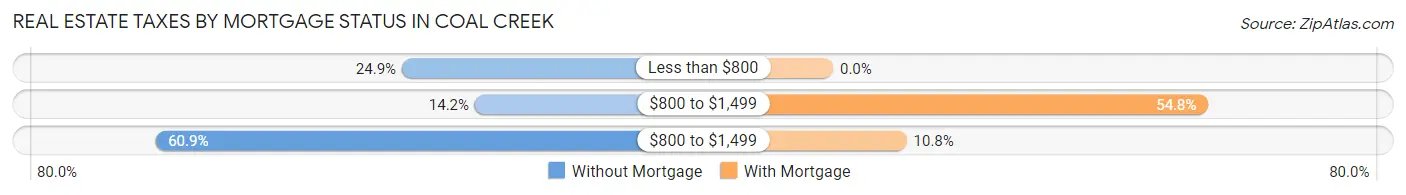
| Property Taxes | Without Mortgage | With Mortgage |
| Less than $800 | 49 (24.9%) | 0 (0.0%) |
| $800 to $1,499 | 28 (14.2%) | 51 (54.8%) |
| $800 to $1,499 | 120 (60.9%) | 10 (10.7%) |
| Total | 197 (100.0%) | 93 (100.0%) |
Health & Disability in Coal Creek
Health Insurance Coverage by Age in Coal Creek
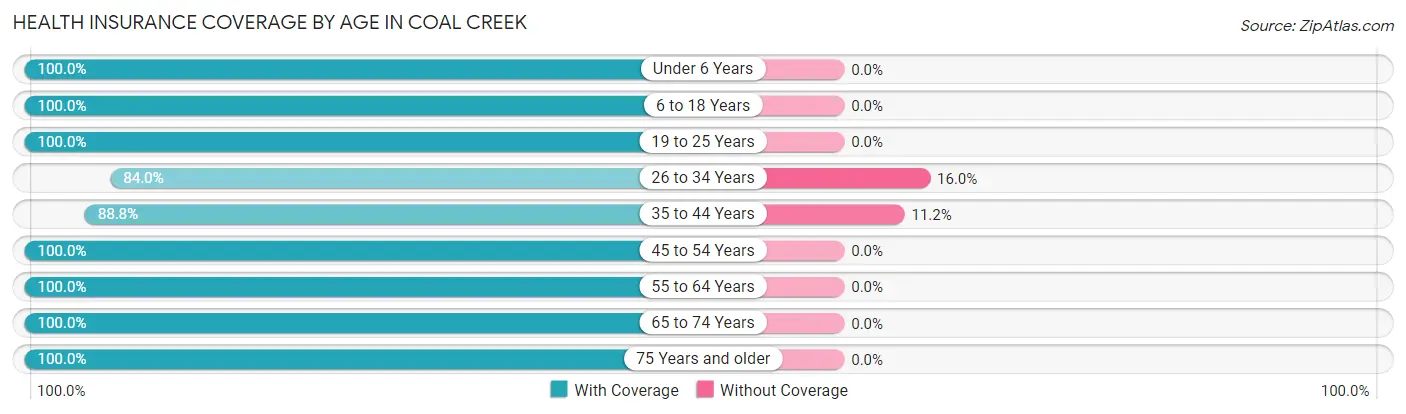
| Age Bracket | With Coverage | Without Coverage |
| Under 6 Years | 27 (100.0%) | 0 (0.0%) |
| 6 to 18 Years | 93 (100.0%) | 0 (0.0%) |
| 19 to 25 Years | 75 (100.0%) | 0 (0.0%) |
| 26 to 34 Years | 42 (84.0%) | 8 (16.0%) |
| 35 to 44 Years | 79 (88.8%) | 10 (11.2%) |
| 45 to 54 Years | 11 (100.0%) | 0 (0.0%) |
| 55 to 64 Years | 37 (100.0%) | 0 (0.0%) |
| 65 to 74 Years | 79 (100.0%) | 0 (0.0%) |
| 75 Years and older | 33 (100.0%) | 0 (0.0%) |
| Total | 476 (96.4%) | 18 (3.6%) |
Health Insurance Coverage by Citizenship Status in Coal Creek
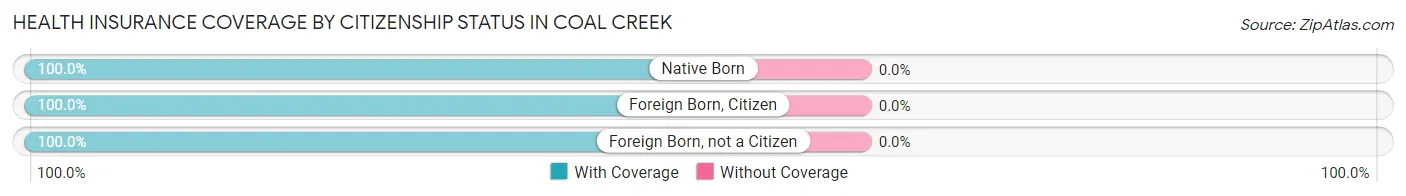
| Citizenship Status | With Coverage | Without Coverage |
| Native Born | 27 (100.0%) | 0 (0.0%) |
| Foreign Born, Citizen | 93 (100.0%) | 0 (0.0%) |
| Foreign Born, not a Citizen | 75 (100.0%) | 0 (0.0%) |
Health Insurance Coverage by Household Income in Coal Creek
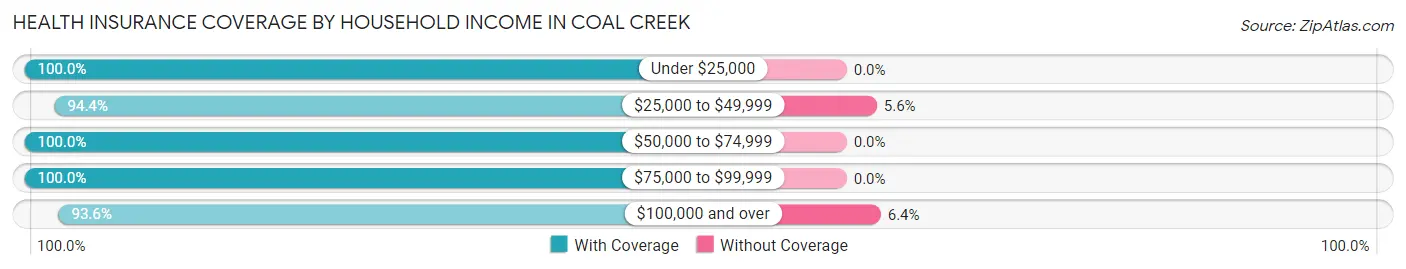
| Household Income | With Coverage | Without Coverage |
| Under $25,000 | 125 (100.0%) | 0 (0.0%) |
| $25,000 to $49,999 | 134 (94.4%) | 8 (5.6%) |
| $50,000 to $74,999 | 22 (100.0%) | 0 (0.0%) |
| $75,000 to $99,999 | 48 (100.0%) | 0 (0.0%) |
| $100,000 and over | 147 (93.6%) | 10 (6.4%) |
Public vs Private Health Insurance Coverage by Age in Coal Creek
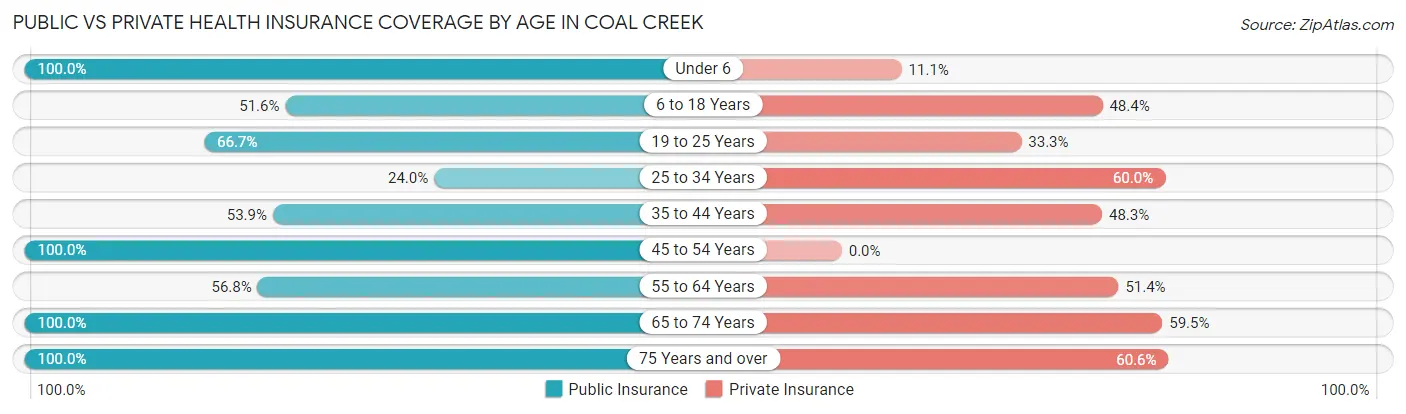
| Age Bracket | Public Insurance | Private Insurance |
| Under 6 | 27 (100.0%) | 3 (11.1%) |
| 6 to 18 Years | 48 (51.6%) | 45 (48.4%) |
| 19 to 25 Years | 50 (66.7%) | 25 (33.3%) |
| 25 to 34 Years | 12 (24.0%) | 30 (60.0%) |
| 35 to 44 Years | 48 (53.9%) | 43 (48.3%) |
| 45 to 54 Years | 11 (100.0%) | 0 (0.0%) |
| 55 to 64 Years | 21 (56.8%) | 19 (51.3%) |
| 65 to 74 Years | 79 (100.0%) | 47 (59.5%) |
| 75 Years and over | 33 (100.0%) | 20 (60.6%) |
| Total | 329 (66.6%) | 232 (47.0%) |
Disability Status by Sex by Age in Coal Creek
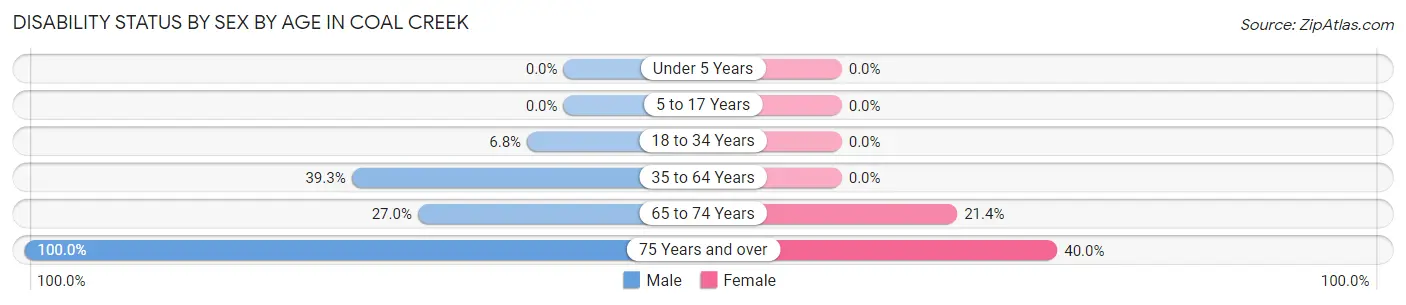
| Age Bracket | Male | Female |
| Under 5 Years | 0 (0.0%) | 0 (0.0%) |
| 5 to 17 Years | 0 (0.0%) | 0 (0.0%) |
| 18 to 34 Years | 5 (6.8%) | 0 (0.0%) |
| 35 to 64 Years | 35 (39.3%) | 0 (0.0%) |
| 65 to 74 Years | 10 (27.0%) | 9 (21.4%) |
| 75 Years and over | 13 (100.0%) | 8 (40.0%) |
Disability Class by Sex by Age in Coal Creek
Disability Class: Hearing Difficulty
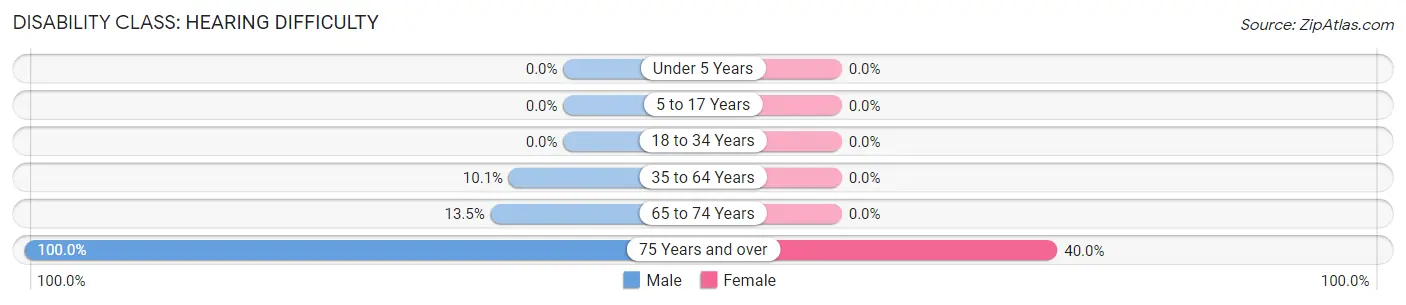
| Age Bracket | Male | Female |
| Under 5 Years | 0 (0.0%) | 0 (0.0%) |
| 5 to 17 Years | 0 (0.0%) | 0 (0.0%) |
| 18 to 34 Years | 0 (0.0%) | 0 (0.0%) |
| 35 to 64 Years | 9 (10.1%) | 0 (0.0%) |
| 65 to 74 Years | 5 (13.5%) | 0 (0.0%) |
| 75 Years and over | 13 (100.0%) | 8 (40.0%) |
Disability Class: Vision Difficulty
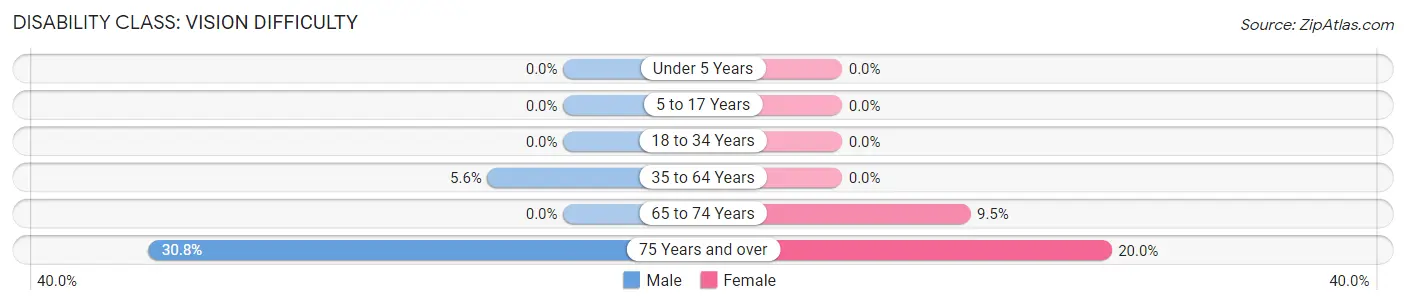
| Age Bracket | Male | Female |
| Under 5 Years | 0 (0.0%) | 0 (0.0%) |
| 5 to 17 Years | 0 (0.0%) | 0 (0.0%) |
| 18 to 34 Years | 0 (0.0%) | 0 (0.0%) |
| 35 to 64 Years | 5 (5.6%) | 0 (0.0%) |
| 65 to 74 Years | 0 (0.0%) | 4 (9.5%) |
| 75 Years and over | 4 (30.8%) | 4 (20.0%) |
Disability Class: Cognitive Difficulty
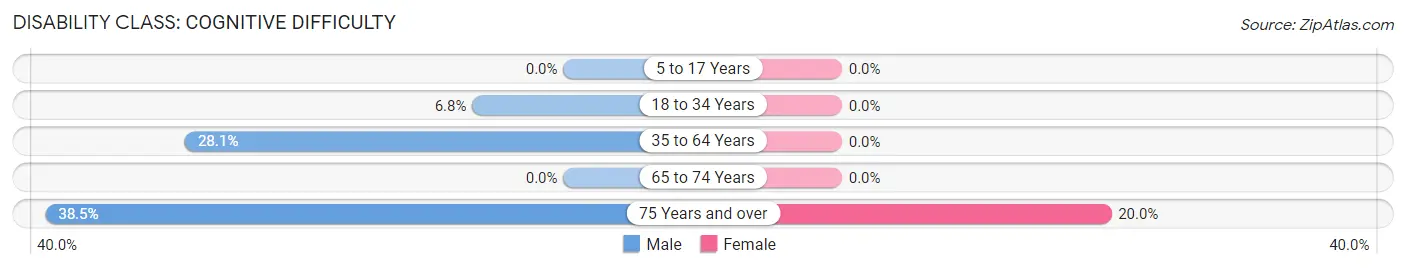
| Age Bracket | Male | Female |
| 5 to 17 Years | 0 (0.0%) | 0 (0.0%) |
| 18 to 34 Years | 5 (6.8%) | 0 (0.0%) |
| 35 to 64 Years | 25 (28.1%) | 0 (0.0%) |
| 65 to 74 Years | 0 (0.0%) | 0 (0.0%) |
| 75 Years and over | 5 (38.5%) | 4 (20.0%) |
Disability Class: Ambulatory Difficulty
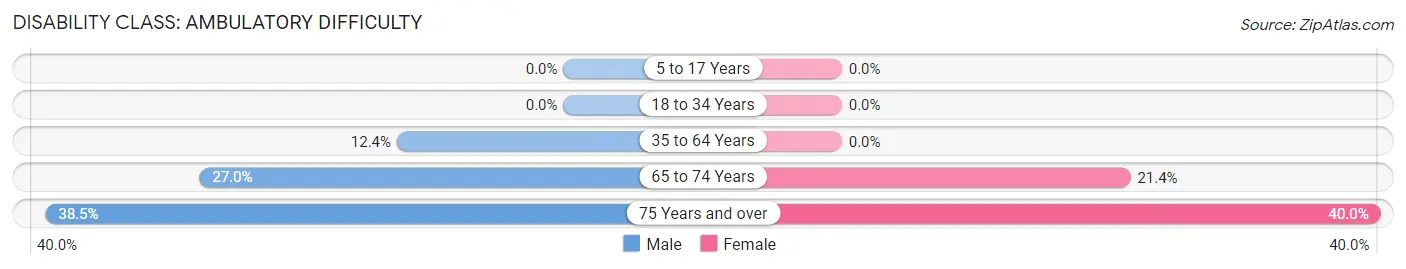
| Age Bracket | Male | Female |
| 5 to 17 Years | 0 (0.0%) | 0 (0.0%) |
| 18 to 34 Years | 0 (0.0%) | 0 (0.0%) |
| 35 to 64 Years | 11 (12.4%) | 0 (0.0%) |
| 65 to 74 Years | 10 (27.0%) | 9 (21.4%) |
| 75 Years and over | 5 (38.5%) | 8 (40.0%) |
Disability Class: Self-Care Difficulty
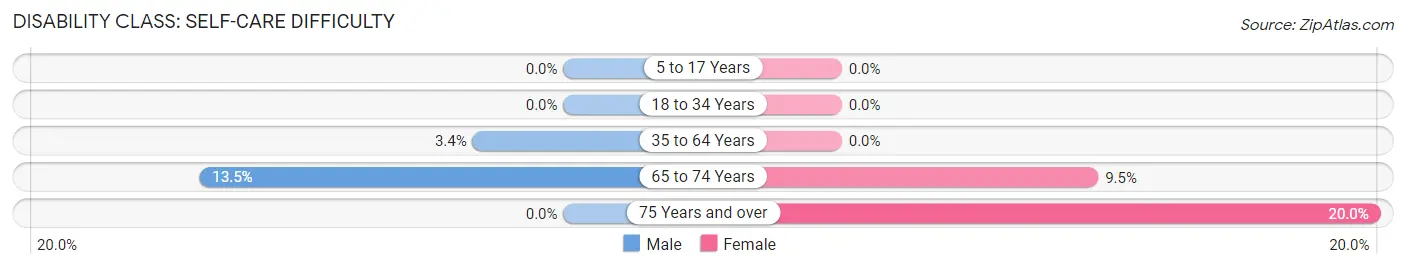
| Age Bracket | Male | Female |
| 5 to 17 Years | 0 (0.0%) | 0 (0.0%) |
| 18 to 34 Years | 0 (0.0%) | 0 (0.0%) |
| 35 to 64 Years | 3 (3.4%) | 0 (0.0%) |
| 65 to 74 Years | 5 (13.5%) | 4 (9.5%) |
| 75 Years and over | 0 (0.0%) | 4 (20.0%) |
Technology Access in Coal Creek
Computing Device Access in Coal Creek
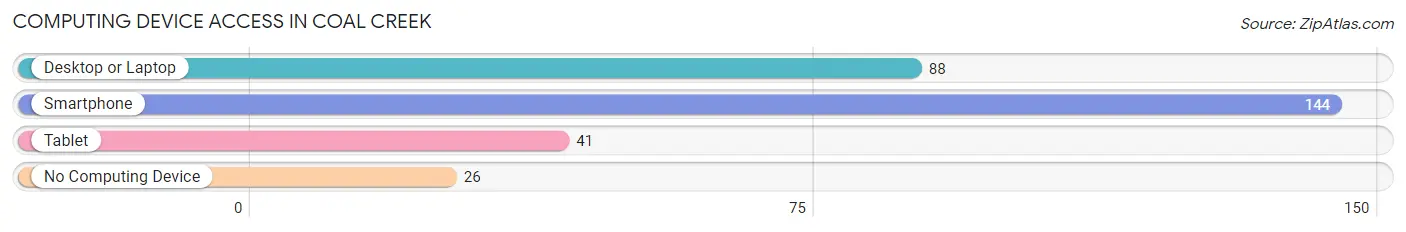
| Device Type | # Households | % Households |
| Desktop or Laptop | 88 | 48.9% |
| Smartphone | 144 | 80.0% |
| Tablet | 41 | 22.8% |
| No Computing Device | 26 | 14.4% |
| Total | 180 | 100.0% |
Internet Access in Coal Creek
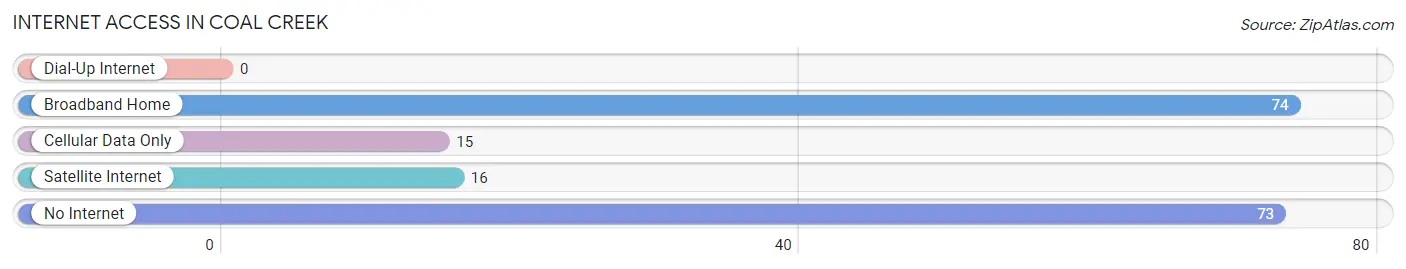
| Internet Type | # Households | % Households |
| Dial-Up Internet | 0 | 0.0% |
| Broadband Home | 74 | 41.1% |
| Cellular Data Only | 15 | 8.3% |
| Satellite Internet | 16 | 8.9% |
| No Internet | 73 | 40.6% |
| Total | 180 | 100.0% |
Coal Creek Summary
Coal Creek is a small unincorporated community located in Boulder County, Colorado. It is situated in the foothills of the Rocky Mountains, approximately 10 miles west of Boulder. The town was founded in 1859 by miners who were searching for coal in the area. The town was named after the nearby Coal Creek, which was named for the coal deposits found in the area.
History
Coal Creek was founded in 1859 by miners who were searching for coal in the area. The town was named after the nearby Coal Creek, which was named for the coal deposits found in the area. The town was originally a mining camp, and the miners built a number of cabins and other structures in the area. The town grew quickly, and by the late 1800s it had become a bustling community with a population of over 500 people.
The town was home to a number of businesses, including a general store, a blacksmith shop, a saloon, and a hotel. The town also had a school, a post office, and a church. The town was a popular destination for tourists, and it was known for its scenic beauty and its abundance of wildlife.
In the early 1900s, the coal mining industry began to decline, and the town's population began to dwindle. By the 1950s, the town had become a ghost town, and most of the buildings had been abandoned. In the 1970s, the town was revitalized when a group of artists and musicians moved to the area and began to restore the buildings. Today, Coal Creek is a small, quiet community with a population of approximately 200 people.
Geography
Coal Creek is located in Boulder County, Colorado, in the foothills of the Rocky Mountains. The town is situated at an elevation of 6,400 feet, and it is surrounded by mountains and forests. The town is located approximately 10 miles west of Boulder, and it is accessible via Highway 119. The town is located near the headwaters of Coal Creek, which is a tributary of the South Platte River.
The climate in Coal Creek is semi-arid, with hot summers and cold winters. The average annual temperature is around 50 degrees Fahrenheit, and the average annual precipitation is around 16 inches.
Economy
The economy of Coal Creek is largely based on tourism. The town is a popular destination for outdoor enthusiasts, and it is known for its scenic beauty and its abundance of wildlife. The town is also home to a number of small businesses, including restaurants, shops, and galleries.
Demographics
As of the 2010 census, the population of Coal Creek was approximately 200 people. The racial makeup of the town was 97.5% White, 0.5% African American, 0.5% Native American, 0.5% Asian, and 1.0% from other races. The median household income was $50,000, and the median home value was $250,000. The town is served by the Boulder Valley School District.
Common Questions
What is Per Capita Income in Coal Creek?
Per Capita income in Coal Creek is $24,896.
What is the Median Household income in Coal Creek?
Median Household Income in Coal Creek is $37,339.
What is Income or Wage Gap in Coal Creek?
Income or Wage Gap in Coal Creek is 16.0%.
Women in Coal Creek earn 84.0 cents for every dollar earned by a man.
What is Inequality or Gini Index in Coal Creek?
Inequality or Gini Index in Coal Creek is 0.48.
What is the Total Population of Coal Creek?
Total Population of Coal Creek is 494.
What is the Total Male Population of Coal Creek?
Total Male Population of Coal Creek is 288.
What is the Total Female Population of Coal Creek?
Total Female Population of Coal Creek is 206.
What is the Ratio of Males per 100 Females in Coal Creek?
There are 139.81 Males per 100 Females in Coal Creek.
What is the Ratio of Females per 100 Males in Coal Creek?
There are 71.53 Females per 100 Males in Coal Creek.
What is the Median Population Age in Coal Creek?
Median Population Age in Coal Creek is 36.1 Years.
What is the Average Family Size in Coal Creek
Average Family Size in Coal Creek is 3.1 People.
What is the Average Household Size in Coal Creek
Average Household Size in Coal Creek is 2.7 People.
How Large is the Labor Force in Coal Creek?
There are 203 People in the Labor Forcein in Coal Creek.
What is the Percentage of People in the Labor Force in Coal Creek?
48.2% of People are in the Labor Force in Coal Creek.
What is the Unemployment Rate in Coal Creek?
Unemployment Rate in Coal Creek is 8.9%.