Capulin, CO Map & Demographics
Capulin Map
Capulin Overview
$9,500
PER CAPITA INCOME
$81,131
AVG HOUSEHOLD INCOME
0.36
INEQUALITY / GINI INDEX
301
TOTAL POPULATION
157
MALE POPULATION
144
FEMALE POPULATION
109.03
MALES / 100 FEMALES
91.72
FEMALES / 100 MALES
31.8
MEDIAN AGE
6.7
AVG FAMILY SIZE
5.2
AVG HOUSEHOLD SIZE
90
LABOR FORCE [ PEOPLE ]
50.6%
PERCENT IN LABOR FORCE
54.4%
UNEMPLOYMENT RATE
Capulin Zip Codes
Capulin Area Codes
Income in Capulin
Income Overview in Capulin
| Characteristic | Number | Measure |
| Per Capita Income | 301 | $9,500 |
| Median Family Income | 40 | $0 |
| Mean Family Income | 40 | $0 |
| Median Household Income | 57 | $81,131 |
| Mean Household Income | 57 | $64,853 |
| Income Deficit | 40 | $0 |
| Wage / Income Gap (%) | 301 | 0.00% |
| Wage / Income Gap ($) | 301 | 100.00¢ per $1 |
| Gini / Inequality Index | 301 | 0.36 |
Earnings by Sex in Capulin
| Sex | Number | Average Earnings |
| Male | 65 (65.0%) | $0 |
| Female | 35 (35.0%) | $0 |
| Total | 100 (100.0%) | $0 |
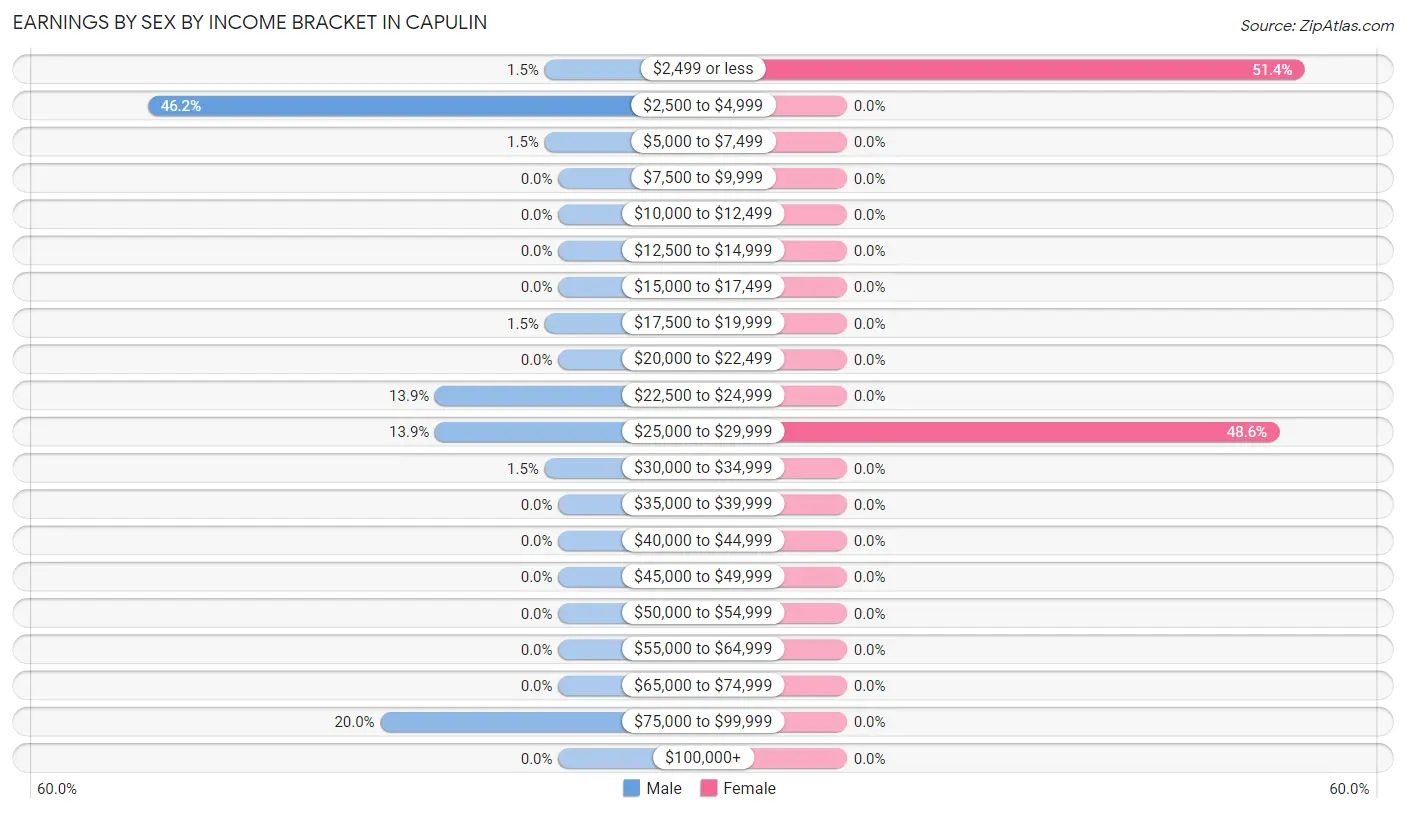
Earnings by Sex by Income Bracket in Capulin
The most common earnings brackets in Capulin are $2,500 to $4,999 for men (30 | 46.2%) and $2,499 or less for women (18 | 51.4%).
| Income | Male | Female |
| $2,499 or less | 1 (1.5%) | 18 (51.4%) |
| $2,500 to $4,999 | 30 (46.2%) | 0 (0.0%) |
| $5,000 to $7,499 | 1 (1.5%) | 0 (0.0%) |
| $7,500 to $9,999 | 0 (0.0%) | 0 (0.0%) |
| $10,000 to $12,499 | 0 (0.0%) | 0 (0.0%) |
| $12,500 to $14,999 | 0 (0.0%) | 0 (0.0%) |
| $15,000 to $17,499 | 0 (0.0%) | 0 (0.0%) |
| $17,500 to $19,999 | 1 (1.5%) | 0 (0.0%) |
| $20,000 to $22,499 | 0 (0.0%) | 0 (0.0%) |
| $22,500 to $24,999 | 9 (13.9%) | 0 (0.0%) |
| $25,000 to $29,999 | 9 (13.9%) | 17 (48.6%) |
| $30,000 to $34,999 | 1 (1.5%) | 0 (0.0%) |
| $35,000 to $39,999 | 0 (0.0%) | 0 (0.0%) |
| $40,000 to $44,999 | 0 (0.0%) | 0 (0.0%) |
| $45,000 to $49,999 | 0 (0.0%) | 0 (0.0%) |
| $50,000 to $54,999 | 0 (0.0%) | 0 (0.0%) |
| $55,000 to $64,999 | 0 (0.0%) | 0 (0.0%) |
| $65,000 to $74,999 | 0 (0.0%) | 0 (0.0%) |
| $75,000 to $99,999 | 13 (20.0%) | 0 (0.0%) |
| $100,000+ | 0 (0.0%) | 0 (0.0%) |
| Total | 65 (100.0%) | 35 (100.0%) |
Earnings by Sex by Educational Attainment in Capulin
| Educational Attainment | Male Income | Female Income |
| Less than High School | - | - |
| High School Diploma | - | - |
| College or Associate's Degree | - | - |
| Bachelor's Degree | - | - |
| Graduate Degree | - | - |
| Total | - | - |
Family Income in Capulin
Family Income Brackets in Capulin
According to the Capulin family income data, there are 21 families falling into the $75,000 to $99,999 income range, which is the most common income bracket and makes up 52.5% of all families.
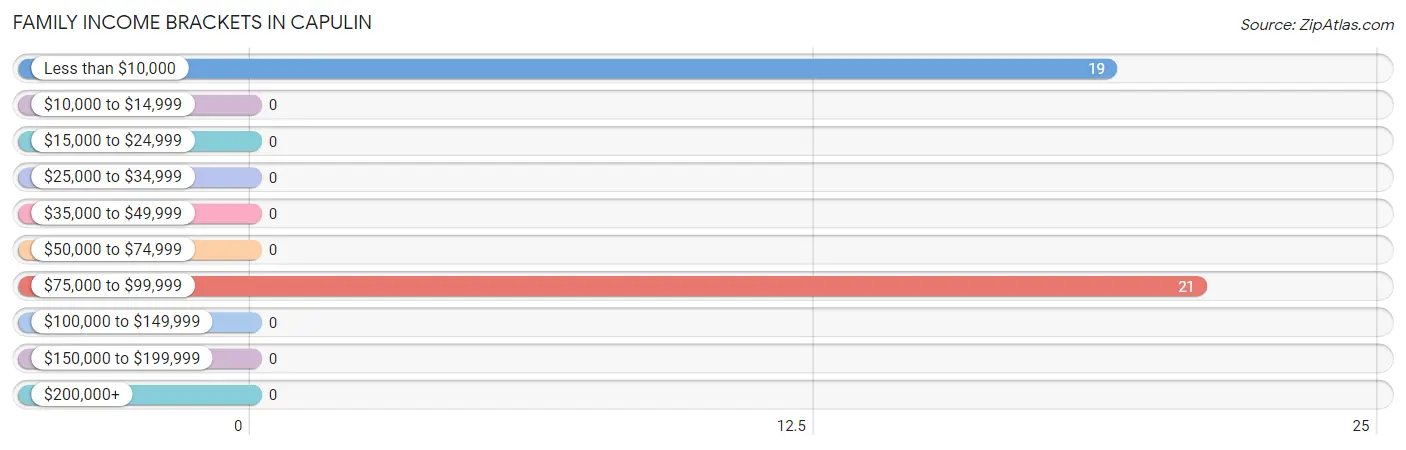
| Income Bracket | # Families | % Families |
| Less than $10,000 | 19 | 47.5% |
| $10,000 to $14,999 | 0 | 0.0% |
| $15,000 to $24,999 | 0 | 0.0% |
| $25,000 to $34,999 | 0 | 0.0% |
| $35,000 to $49,999 | 0 | 0.0% |
| $50,000 to $74,999 | 0 | 0.0% |
| $75,000 to $99,999 | 21 | 52.5% |
| $100,000 to $149,999 | 0 | 0.0% |
| $150,000 to $199,999 | 0 | 0.0% |
| $200,000+ | 0 | 0.0% |
Family Income by Famaliy Size in Capulin
| Income Bracket | # Families | Median Income |
| 2-Person Families | 0 (0.0%) | $0 |
| 3-Person Families | 19 (47.5%) | $0 |
| 4-Person Families | 0 (0.0%) | $0 |
| 5-Person Families | 0 (0.0%) | $0 |
| 6-Person Families | 0 (0.0%) | $0 |
| 7+ Person Families | 21 (52.5%) | $0 |
| Total | 40 (100.0%) | $0 |
Family Income by Number of Earners in Capulin
| Number of Earners | # Families | Median Income |
| No Earners | 0 (0.0%) | $0 |
| 1 Earner | 0 (0.0%) | $0 |
| 2 Earners | 40 (100.0%) | $0 |
| 3+ Earners | 0 (0.0%) | $0 |
| Total | 40 (100.0%) | $0 |
Household Income in Capulin
Household Income Brackets in Capulin
With 21 households falling in the category, the $75,000 to $99,999 income range is the most frequent in Capulin, accounting for 36.8% of all households.
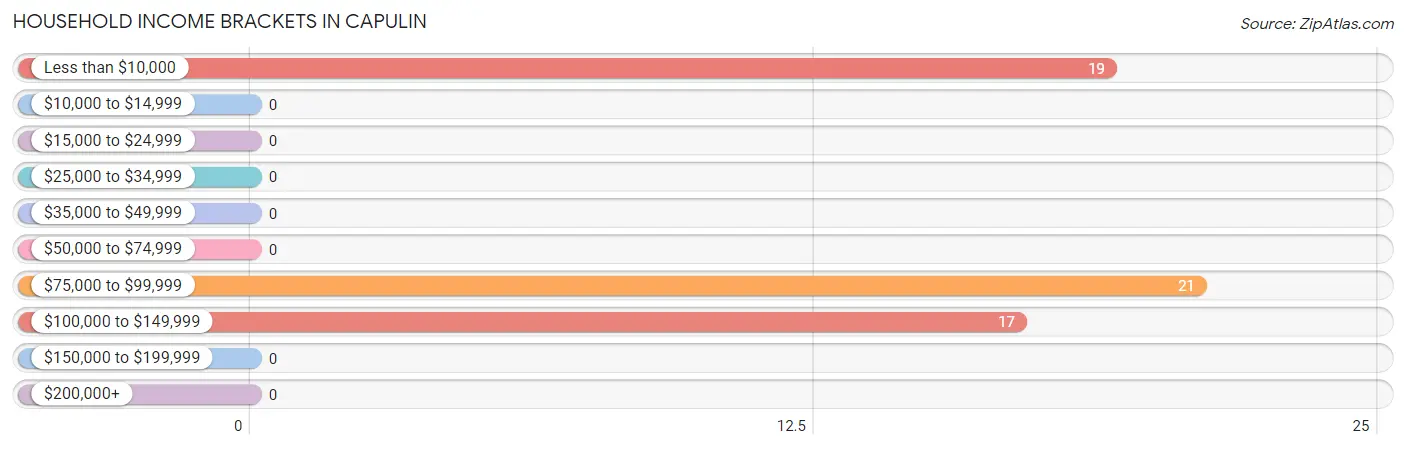
| Income Bracket | # Households | % Households |
| Less than $10,000 | 19 | 33.3% |
| $10,000 to $14,999 | 0 | 0.0% |
| $15,000 to $24,999 | 0 | 0.0% |
| $25,000 to $34,999 | 0 | 0.0% |
| $35,000 to $49,999 | 0 | 0.0% |
| $50,000 to $74,999 | 0 | 0.0% |
| $75,000 to $99,999 | 21 | 36.8% |
| $100,000 to $149,999 | 17 | 29.8% |
| $150,000 to $199,999 | 0 | 0.0% |
| $200,000+ | 0 | 0.0% |
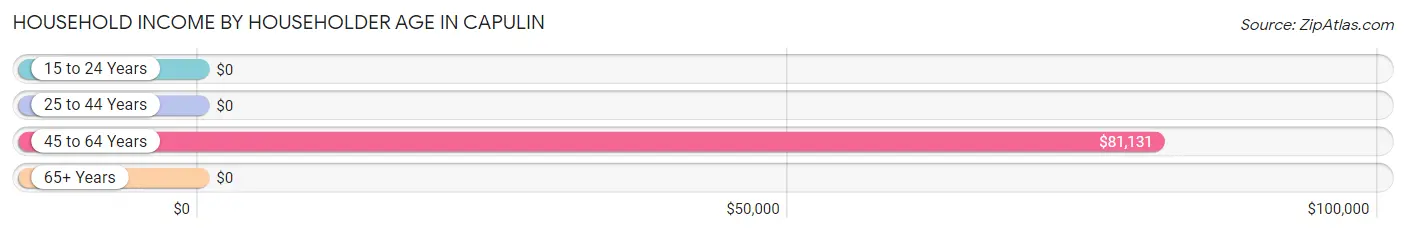
Household Income by Householder Age in Capulin
The median household income in Capulin is $81,131, with the highest median household income of $81,131 found in the 45 to 64 years age bracket for the primary householder. A total of 57 households (100.0%) fall into this category.
| Income Bracket | # Households | Median Income |
| 15 to 24 Years | 0 (0.0%) | $0 |
| 25 to 44 Years | 0 (0.0%) | $0 |
| 45 to 64 Years | 57 (100.0%) | $81,131 |
| 65+ Years | 0 (0.0%) | $0 |
| Total | 57 (100.0%) | $81,131 |
Poverty in Capulin
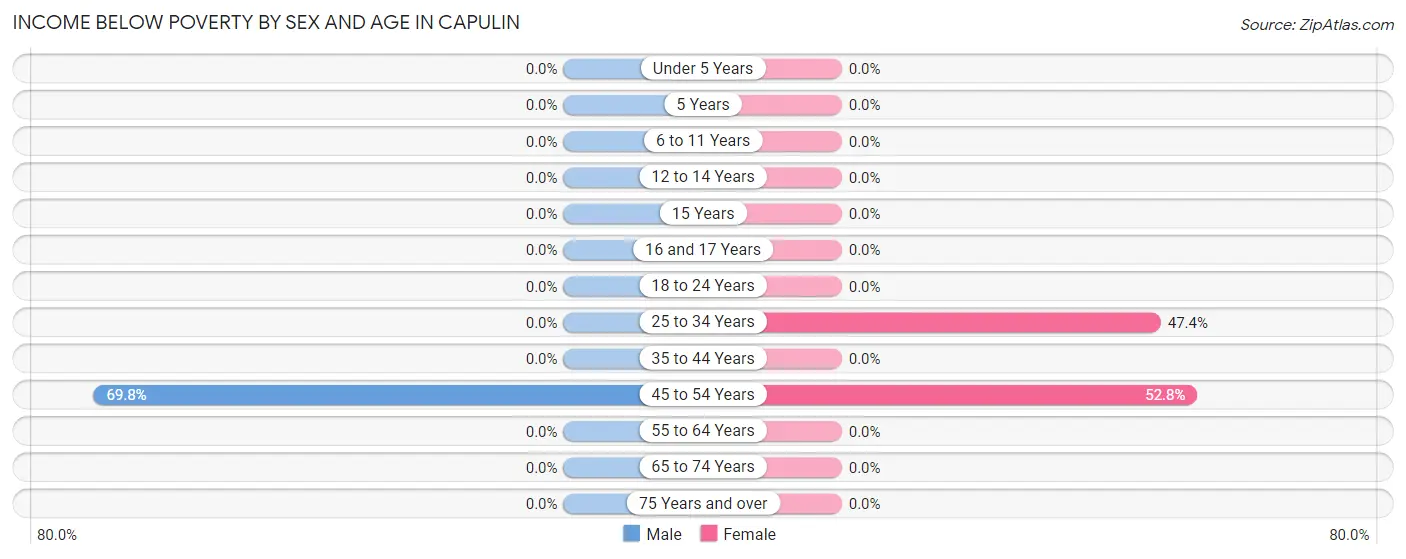
Income Below Poverty by Sex and Age in Capulin
With 19.6% poverty level for males and 25.7% for females among the residents of Capulin, 45 to 54 year old males and 45 to 54 year old females are the most vulnerable to poverty, with 30 males (69.8%) and 19 females (52.8%) in their respective age groups living below the poverty level.
| Age Bracket | Male | Female |
| Under 5 Years | 0 (0.0%) | 0 (0.0%) |
| 5 Years | 0 (0.0%) | 0 (0.0%) |
| 6 to 11 Years | 0 (0.0%) | 0 (0.0%) |
| 12 to 14 Years | 0 (0.0%) | 0 (0.0%) |
| 15 Years | 0 (0.0%) | 0 (0.0%) |
| 16 and 17 Years | 0 (0.0%) | 0 (0.0%) |
| 18 to 24 Years | 0 (0.0%) | 0 (0.0%) |
| 25 to 34 Years | 0 (0.0%) | 18 (47.4%) |
| 35 to 44 Years | 0 (0.0%) | 0 (0.0%) |
| 45 to 54 Years | 30 (69.8%) | 19 (52.8%) |
| 55 to 64 Years | 0 (0.0%) | 0 (0.0%) |
| 65 to 74 Years | 0 (0.0%) | 0 (0.0%) |
| 75 Years and over | 0 (0.0%) | 0 (0.0%) |
| Total | 30 (19.6%) | 37 (25.7%) |
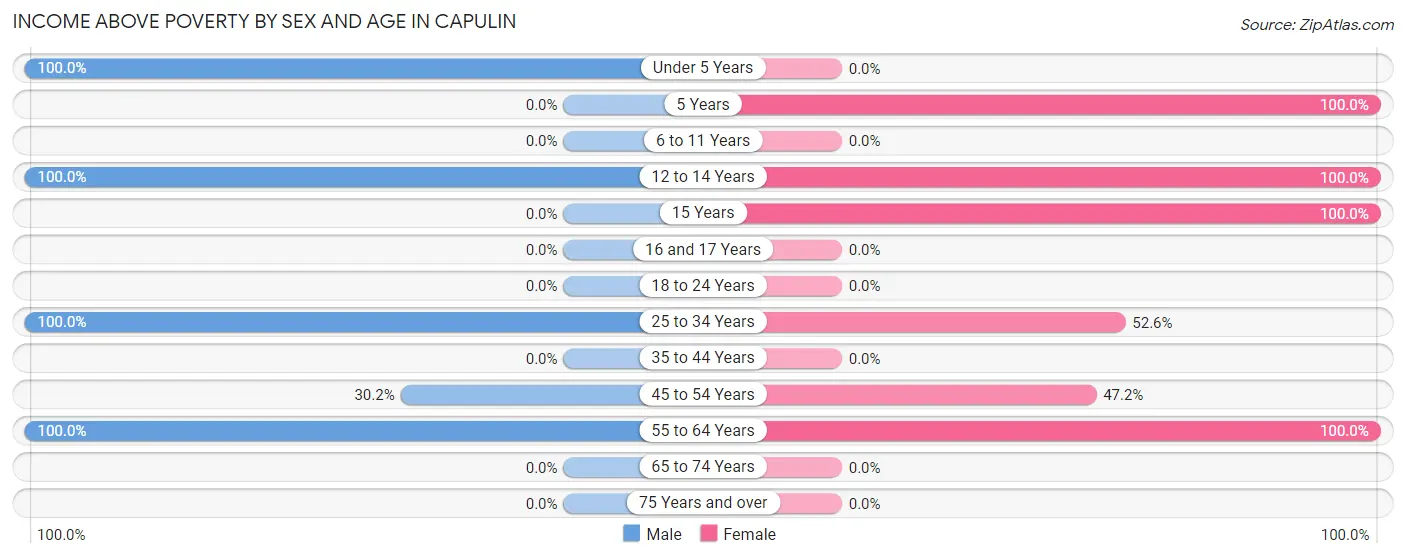
Income Above Poverty by Sex and Age in Capulin
According to the poverty statistics in Capulin, males aged under 5 years and females aged 5 years are the age groups that are most secure financially, with 100.0% of males and 100.0% of females in these age groups living above the poverty line.
| Age Bracket | Male | Female |
| Under 5 Years | 41 (100.0%) | 0 (0.0%) |
| 5 Years | 0 (0.0%) | 22 (100.0%) |
| 6 to 11 Years | 0 (0.0%) | 0 (0.0%) |
| 12 to 14 Years | 30 (100.0%) | 21 (100.0%) |
| 15 Years | 0 (0.0%) | 9 (100.0%) |
| 16 and 17 Years | 0 (0.0%) | 0 (0.0%) |
| 18 to 24 Years | 0 (0.0%) | 0 (0.0%) |
| 25 to 34 Years | 18 (100.0%) | 20 (52.6%) |
| 35 to 44 Years | 0 (0.0%) | 0 (0.0%) |
| 45 to 54 Years | 13 (30.2%) | 17 (47.2%) |
| 55 to 64 Years | 21 (100.0%) | 18 (100.0%) |
| 65 to 74 Years | 0 (0.0%) | 0 (0.0%) |
| 75 Years and over | 0 (0.0%) | 0 (0.0%) |
| Total | 123 (80.4%) | 107 (74.3%) |
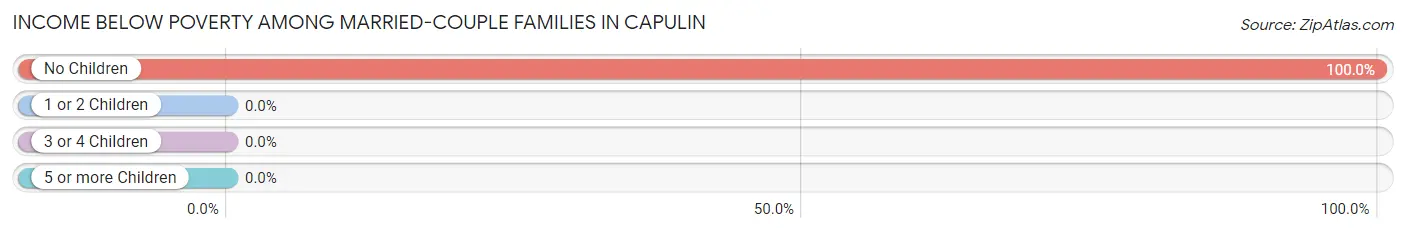
Income Below Poverty Among Married-Couple Families in Capulin
The poverty statistics for married-couple families in Capulin show that 47.5% or 19 of the total 40 families live below the poverty line. Families with no children have the highest poverty rate of 100.0%, comprising of 19 families. On the other hand, families with 5 or more children have the lowest poverty rate of 0.0%, which includes 0 families.
| Children | Above Poverty | Below Poverty |
| No Children | 0 (0.0%) | 19 (100.0%) |
| 1 or 2 Children | 0 (0.0%) | 0 (0.0%) |
| 3 or 4 Children | 0 (0.0%) | 0 (0.0%) |
| 5 or more Children | 21 (100.0%) | 0 (0.0%) |
| Total | 21 (52.5%) | 19 (47.5%) |
Income Below Poverty Among Single-Parent Households in Capulin
| Children | Single Father | Single Mother |
| No Children | 0 (0.0%) | 0 (0.0%) |
| 1 or 2 Children | 0 (0.0%) | 0 (0.0%) |
| 3 or 4 Children | 0 (0.0%) | 0 (0.0%) |
| 5 or more Children | 0 (0.0%) | 0 (0.0%) |
| Total | 0 (0.0%) | 0 (0.0%) |
Income Below Poverty Among Married-Couple vs Single-Parent Households in Capulin
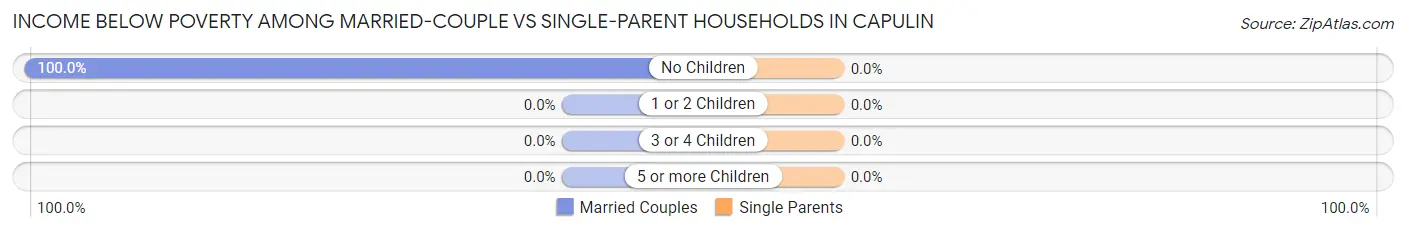
| Children | Married-Couple Families | Single-Parent Households |
| No Children | 19 (100.0%) | 0 (0.0%) |
| 1 or 2 Children | 0 (0.0%) | 0 (0.0%) |
| 3 or 4 Children | 0 (0.0%) | 0 (0.0%) |
| 5 or more Children | 0 (0.0%) | 0 (0.0%) |
| Total | 19 (47.5%) | 0 (0.0%) |
Race in Capulin
The most populous races in Capulin are Hispanic or Latino (297 | 98.7%), Some other Race (179 | 59.5%), and White / Caucasian (69 | 22.9%).
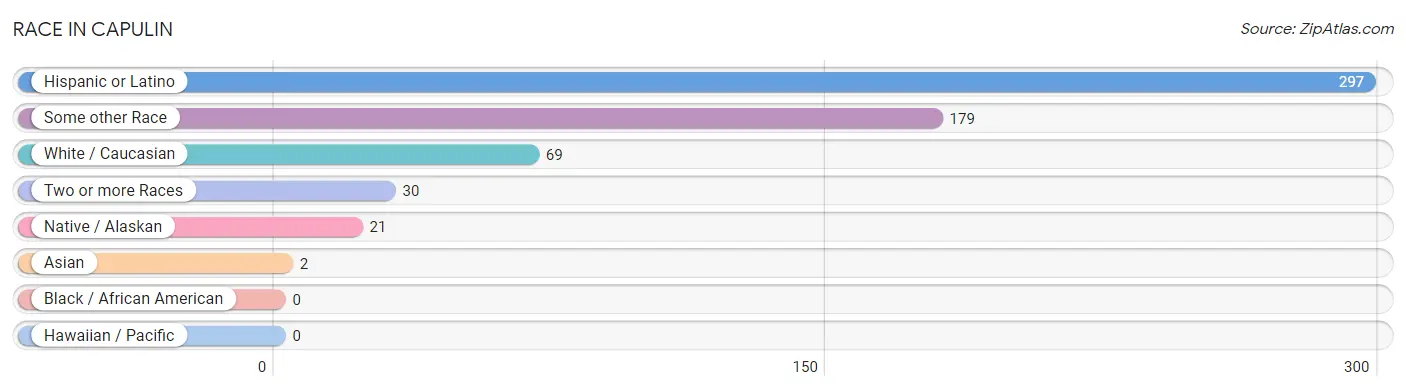
| Race | # Population | % Population |
| Asian | 2 | 0.7% |
| Black / African American | 0 | 0.0% |
| Hawaiian / Pacific | 0 | 0.0% |
| Hispanic or Latino | 297 | 98.7% |
| Native / Alaskan | 21 | 7.0% |
| White / Caucasian | 69 | 22.9% |
| Two or more Races | 30 | 10.0% |
| Some other Race | 179 | 59.5% |
| Total | 301 | 100.0% |
Ancestry in Capulin
The most populous ancestries reported in Capulin are Mexican (267 | 88.7%), Spaniard (30 | 10.0%), Ute (21 | 7.0%), Korean (2 | 0.7%), and German (1 | 0.3%), together accounting for 106.6% of all Capulin residents.
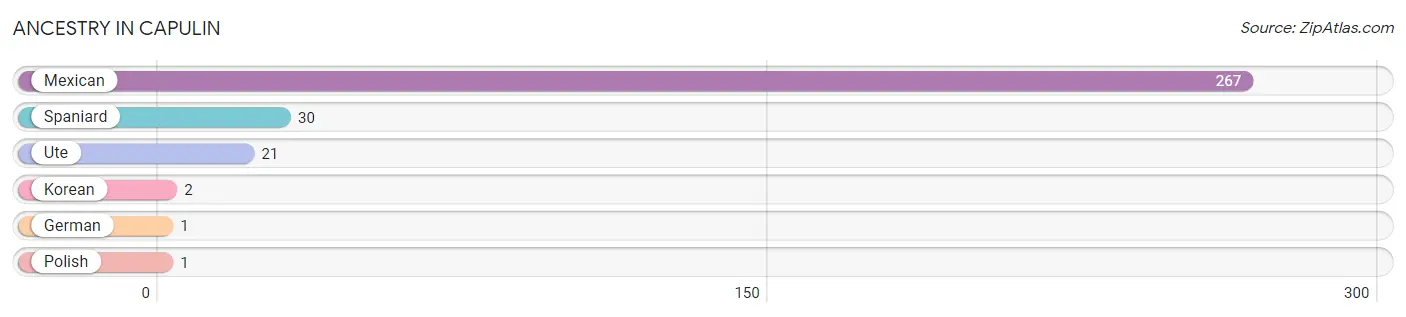
| Ancestry | # Population | % Population |
| German | 1 | 0.3% |
| Korean | 2 | 0.7% |
| Mexican | 267 | 88.7% |
| Polish | 1 | 0.3% |
| Spaniard | 30 | 10.0% |
| Ute | 21 | 7.0% | View All 6 Rows |
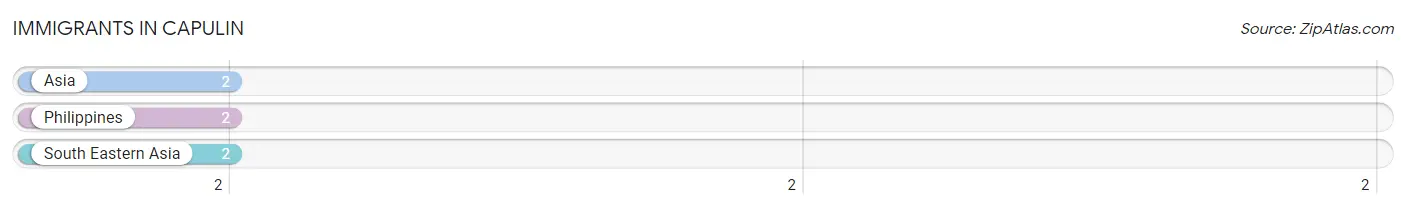
Immigrants in Capulin
The most numerous immigrant groups reported in Capulin came from Asia (2 | 0.7%), Philippines (2 | 0.7%), and South Eastern Asia (2 | 0.7%), together accounting for 2.0% of all Capulin residents.
| Immigration Origin | # Population | % Population |
| Asia | 2 | 0.7% |
| Philippines | 2 | 0.7% |
| South Eastern Asia | 2 | 0.7% | View All 3 Rows |
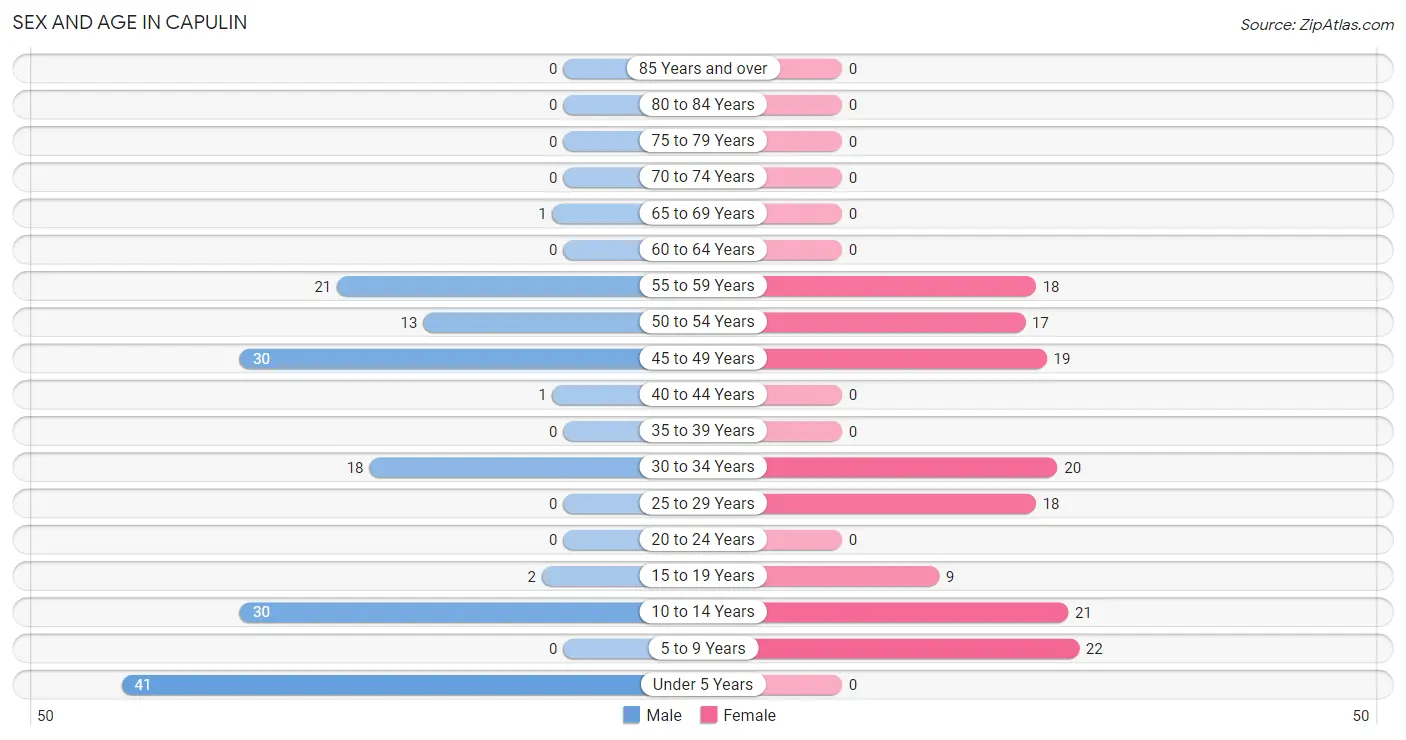
Sex and Age in Capulin
Sex and Age in Capulin
The most populous age groups in Capulin are Under 5 Years (41 | 26.1%) for men and 5 to 9 Years (22 | 15.3%) for women.
| Age Bracket | Male | Female |
| Under 5 Years | 41 (26.1%) | 0 (0.0%) |
| 5 to 9 Years | 0 (0.0%) | 22 (15.3%) |
| 10 to 14 Years | 30 (19.1%) | 21 (14.6%) |
| 15 to 19 Years | 2 (1.3%) | 9 (6.2%) |
| 20 to 24 Years | 0 (0.0%) | 0 (0.0%) |
| 25 to 29 Years | 0 (0.0%) | 18 (12.5%) |
| 30 to 34 Years | 18 (11.5%) | 20 (13.9%) |
| 35 to 39 Years | 0 (0.0%) | 0 (0.0%) |
| 40 to 44 Years | 1 (0.6%) | 0 (0.0%) |
| 45 to 49 Years | 30 (19.1%) | 19 (13.2%) |
| 50 to 54 Years | 13 (8.3%) | 17 (11.8%) |
| 55 to 59 Years | 21 (13.4%) | 18 (12.5%) |
| 60 to 64 Years | 0 (0.0%) | 0 (0.0%) |
| 65 to 69 Years | 1 (0.6%) | 0 (0.0%) |
| 70 to 74 Years | 0 (0.0%) | 0 (0.0%) |
| 75 to 79 Years | 0 (0.0%) | 0 (0.0%) |
| 80 to 84 Years | 0 (0.0%) | 0 (0.0%) |
| 85 Years and over | 0 (0.0%) | 0 (0.0%) |
| Total | 157 (100.0%) | 144 (100.0%) |
Families and Households in Capulin
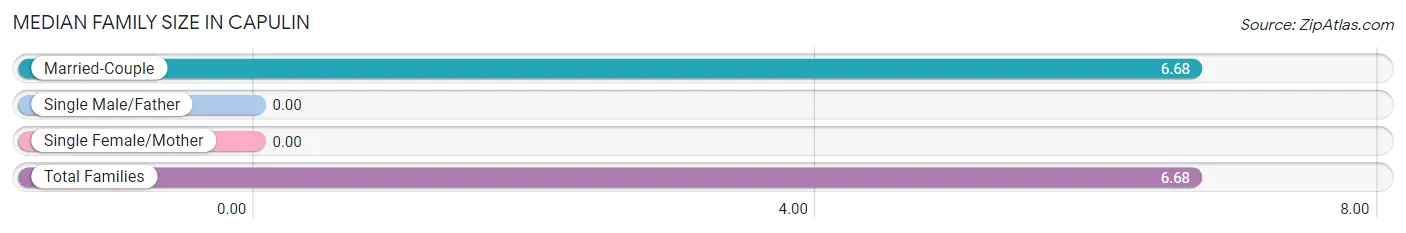
Median Family Size in Capulin
| Family Type | # Families | Family Size |
| Married-Couple | 40 (100.0%) | 6.68 |
| Single Male/Father | 0 (0.0%) | - |
| Single Female/Mother | 0 (0.0%) | - |
| Total Families | 40 (100.0%) | 6.68 |
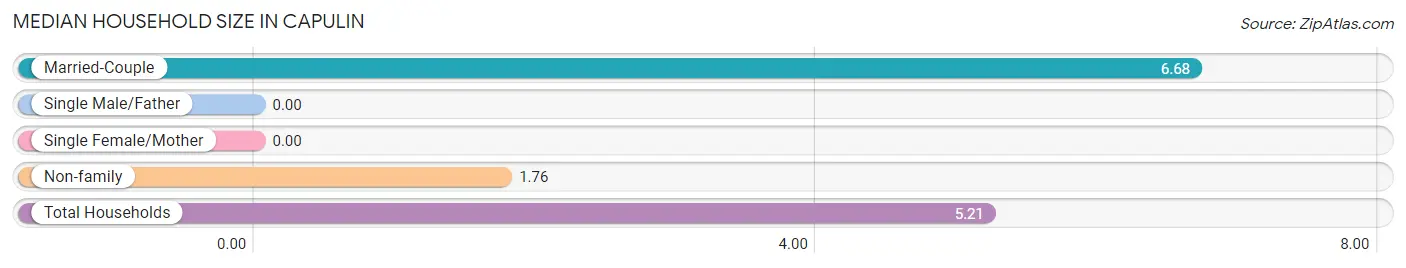
Median Household Size in Capulin
| Household Type | # Households | Household Size |
| Married-Couple | 40 (70.2%) | 6.68 |
| Single Male/Father | 0 (0.0%) | - |
| Single Female/Mother | 0 (0.0%) | - |
| Non-family | 17 (29.8%) | 1.76 |
| Total Households | 57 (100.0%) | 5.21 |
Household Size by Marriage Status in Capulin
Out of a total of 57 households in Capulin, 40 (70.2%) are family households, while 17 (29.8%) are nonfamily households. The most numerous type of family households are 7+ person households, comprising 21, and the most common type of nonfamily households are 2-person households, comprising 17.
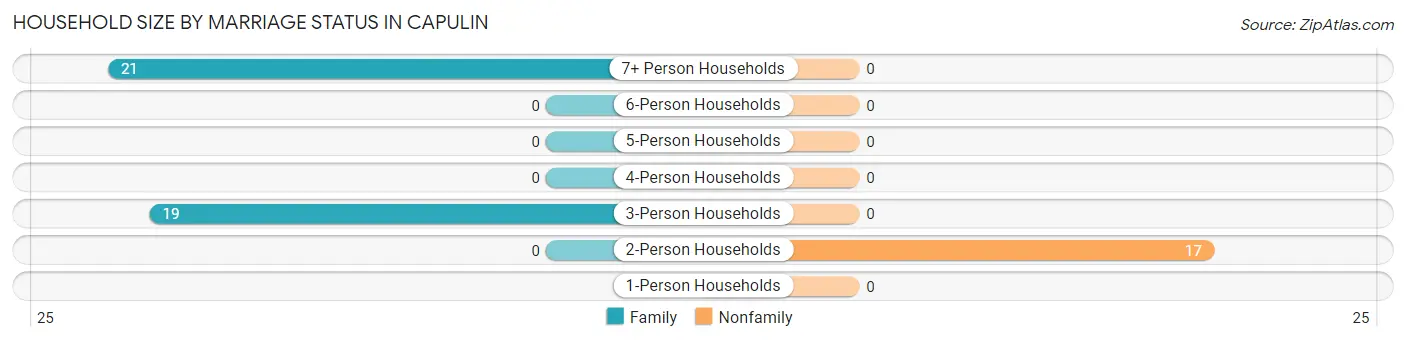
| Household Size | Family Households | Nonfamily Households |
| 1-Person Households | - | 0 (0.0%) |
| 2-Person Households | 0 (0.0%) | 17 (29.8%) |
| 3-Person Households | 19 (33.3%) | 0 (0.0%) |
| 4-Person Households | 0 (0.0%) | 0 (0.0%) |
| 5-Person Households | 0 (0.0%) | 0 (0.0%) |
| 6-Person Households | 0 (0.0%) | 0 (0.0%) |
| 7+ Person Households | 21 (36.8%) | 0 (0.0%) |
| Total | 40 (70.2%) | 17 (29.8%) |
Female Fertility in Capulin
Fertility by Age in Capulin
| Age Bracket | Women with Births | Births / 1,000 Women |
| 15 to 19 years | 0 (0.0%) | 0.0 |
| 20 to 34 years | 0 (0.0%) | 0.0 |
| 35 to 50 years | 0 (0.0%) | 0.0 |
| Total | 0 (0.0%) | 0.0 |
Fertility by Age by Marriage Status in Capulin
| Age Bracket | Married | Unmarried |
| 15 to 19 years | 0 (0.0%) | 0 (0.0%) |
| 20 to 34 years | 0 (0.0%) | 0 (0.0%) |
| 35 to 50 years | 0 (0.0%) | 0 (0.0%) |
| Total | 0 (0.0%) | 0 (0.0%) |
Fertility by Education in Capulin
| Educational Attainment | Women with Births | Births / 1,000 Women |
| Less than High School | 0 (0.0%) | 0.0 |
| High School Diploma | 0 (0.0%) | 0.0 |
| College or Associate's Degree | 0 (0.0%) | 0.0 |
| Bachelor's Degree | 0 (0.0%) | 0.0 |
| Graduate Degree | 0 (0.0%) | 0.0 |
| Total | 0 (0.0%) | 0.0 |
Fertility by Education by Marriage Status in Capulin
| Educational Attainment | Married | Unmarried |
| Less than High School | 0 (0.0%) | 0 (0.0%) |
| High School Diploma | 0 (0.0%) | 0 (0.0%) |
| College or Associate's Degree | 0 (0.0%) | 0 (0.0%) |
| Bachelor's Degree | 0 (0.0%) | 0 (0.0%) |
| Graduate Degree | 0 (0.0%) | 0 (0.0%) |
| Total | 0 (0.0%) | 0 (0.0%) |
Employment Characteristics in Capulin
Employment by Class of Employer in Capulin
Among the 41 employed individuals in Capulin, private company employees (22 | 53.7%), local government employees (17 | 41.5%), and not-for-profit organizations (2 | 4.9%) make up the most common classes of employment.
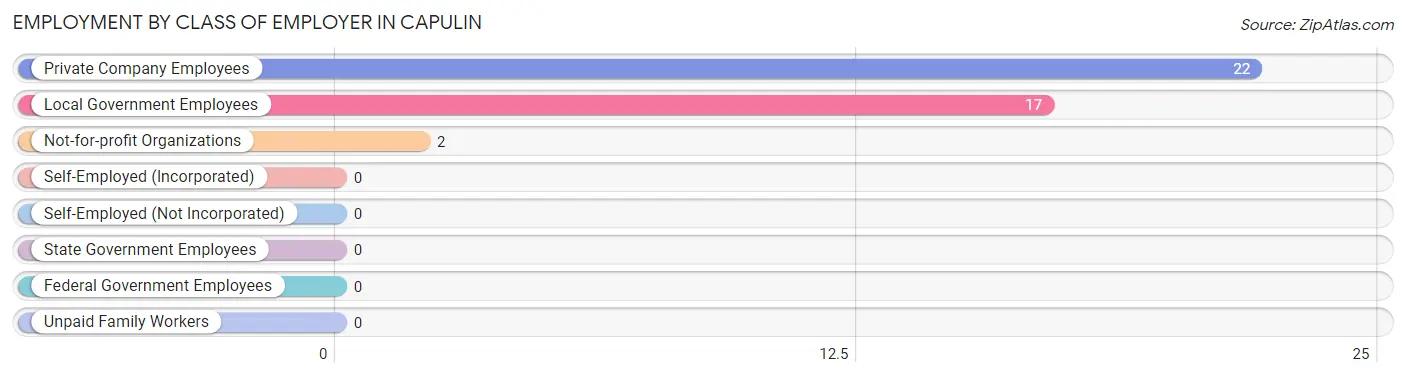
| Employer Class | # Employees | % Employees |
| Private Company Employees | 22 | 53.7% |
| Self-Employed (Incorporated) | 0 | 0.0% |
| Self-Employed (Not Incorporated) | 0 | 0.0% |
| Not-for-profit Organizations | 2 | 4.9% |
| Local Government Employees | 17 | 41.5% |
| State Government Employees | 0 | 0.0% |
| Federal Government Employees | 0 | 0.0% |
| Unpaid Family Workers | 0 | 0.0% |
| Total | 41 | 100.0% |
Employment Status by Age in Capulin
According to the labor force statistics for Capulin, out of the total population over 16 years of age (178), 50.6% or 90 individuals are in the labor force, with 54.4% or 49 of them unemployed. The age group with the highest labor force participation rate is 35 to 44 years, with 100.0% or 1 individuals in the labor force. Within the labor force, the 45 to 54 years age range has the highest percentage of unemployed individuals, with 62.0% or 49 of them being unemployed.
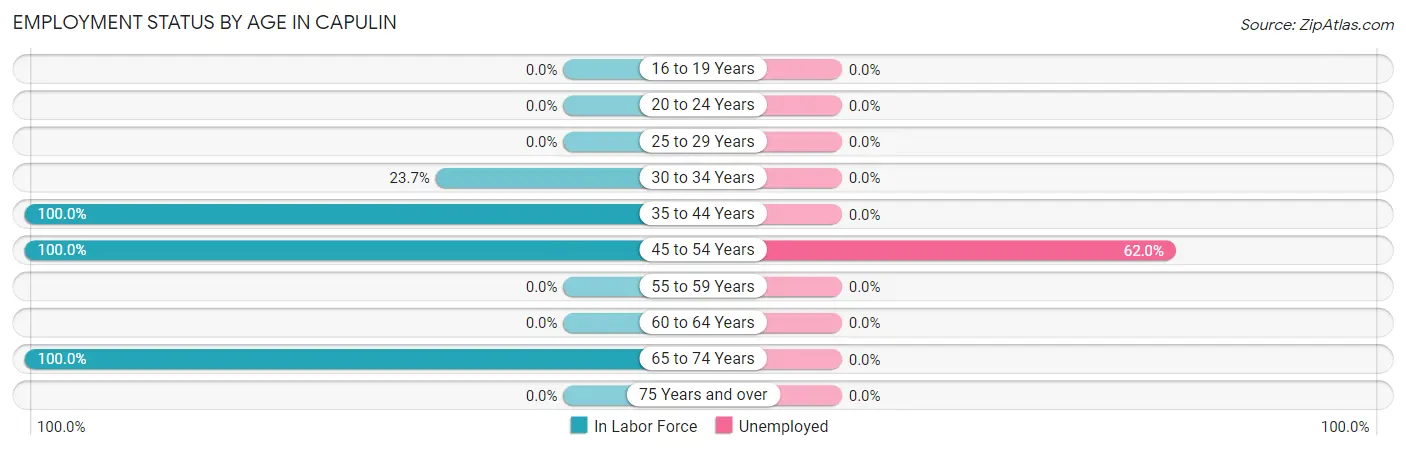
| Age Bracket | In Labor Force | Unemployed |
| 16 to 19 Years | 0 (0.0%) | 0 (0.0%) |
| 20 to 24 Years | 0 (0.0%) | 0 (0.0%) |
| 25 to 29 Years | 0 (0.0%) | 0 (0.0%) |
| 30 to 34 Years | 9 (23.7%) | 0 (0.0%) |
| 35 to 44 Years | 1 (100.0%) | 0 (0.0%) |
| 45 to 54 Years | 79 (100.0%) | 49 (62.0%) |
| 55 to 59 Years | 0 (0.0%) | 0 (0.0%) |
| 60 to 64 Years | 0 (0.0%) | 0 (0.0%) |
| 65 to 74 Years | 1 (100.0%) | 0 (0.0%) |
| 75 Years and over | 0 (0.0%) | 0 (0.0%) |
| Total | 90 (50.6%) | 49 (54.4%) |
Employment Status by Educational Attainment in Capulin
According to labor force statistics for Capulin, 50.9% of individuals (89) out of the total population between 25 and 64 years of age (175) are in the labor force, with 55.1% or 49 of them being unemployed. The group with the highest labor force participation rate are those with the educational attainment of college / associate degree, with 80.0% or 36 individuals in the labor force. Within the labor force, individuals with high school diploma education have the highest percentage of unemployment, with 57.7% or 30 of them being unemployed.
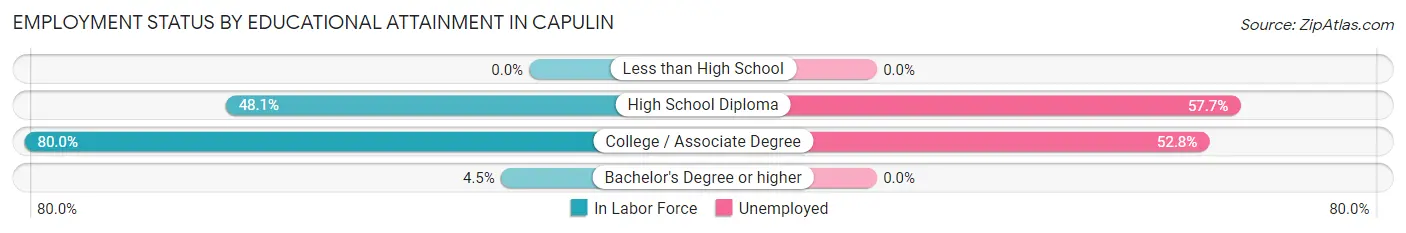
| Educational Attainment | In Labor Force | Unemployed |
| Less than High School | 0 (0.0%) | 0 (0.0%) |
| High School Diploma | 52 (48.1%) | 62 (57.7%) |
| College / Associate Degree | 36 (80.0%) | 24 (52.8%) |
| Bachelor's Degree or higher | 1 (4.5%) | 0 (0.0%) |
| Total | 89 (50.9%) | 96 (55.1%) |
Employment Occupations by Sex in Capulin
Management, Business, Science and Arts Occupations
The most common Management, Business, Science and Arts occupations in Capulin are Management (9 | 22.0%), Community & Social Service (2 | 4.9%), and Education, Arts & Media (2 | 4.9%).
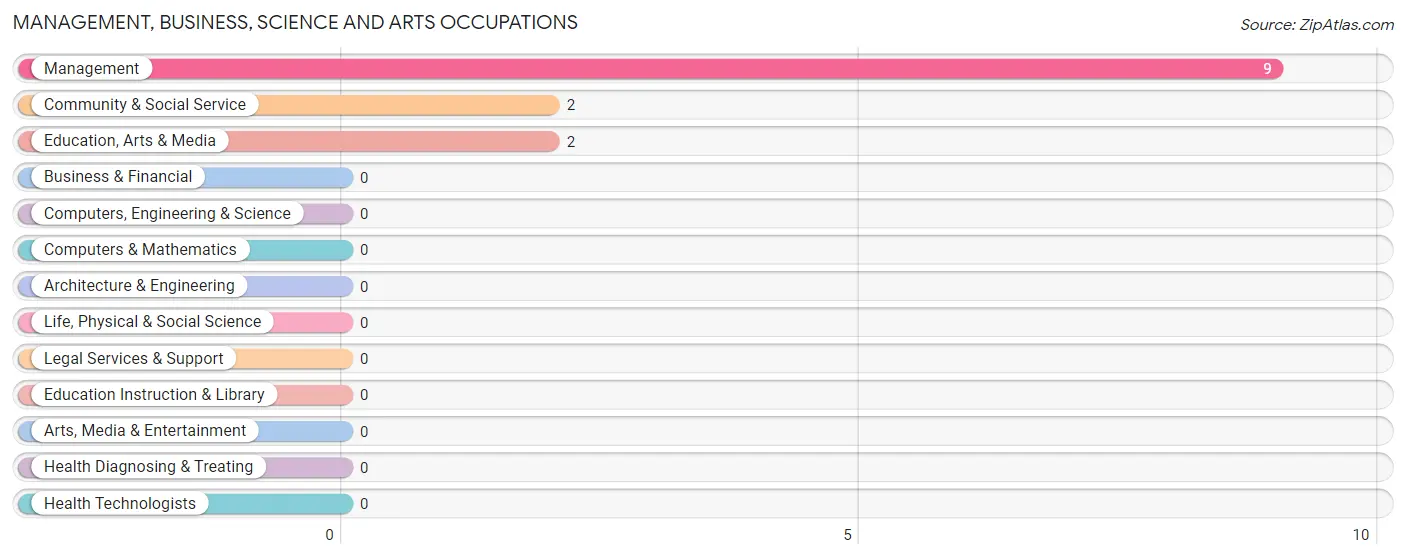
Management, Business, Science and Arts Occupations by Sex
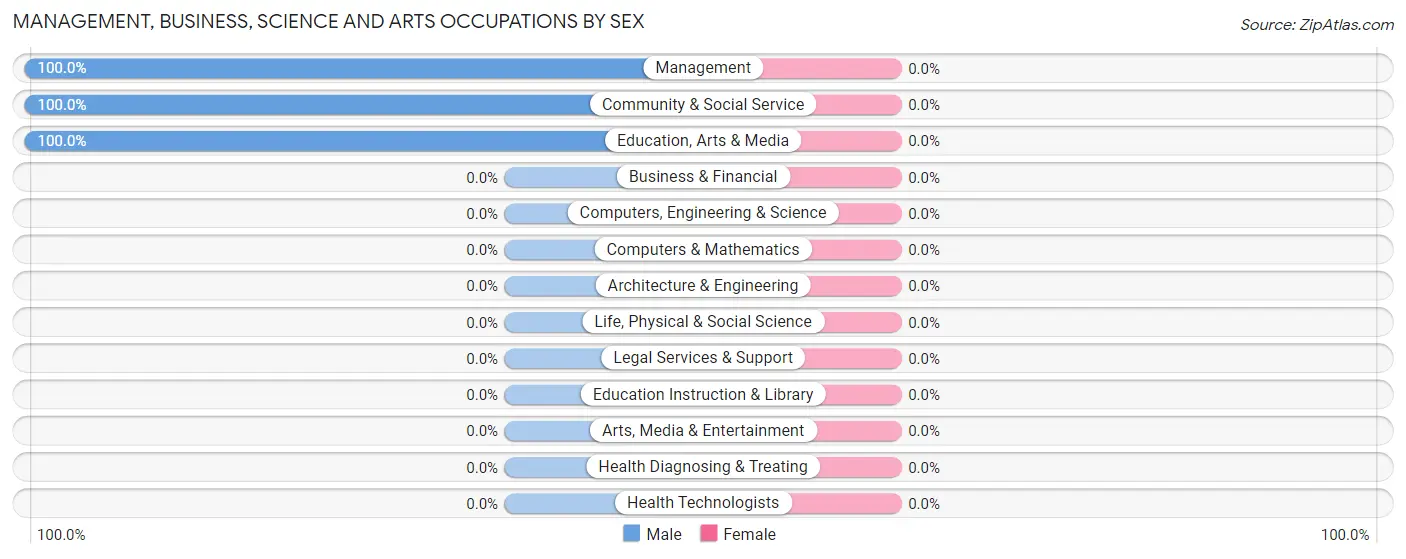
| Occupation | Male | Female |
| Management | 9 (100.0%) | 0 (0.0%) |
| Business & Financial | 0 (0.0%) | 0 (0.0%) |
| Computers, Engineering & Science | 0 (0.0%) | 0 (0.0%) |
| Computers & Mathematics | 0 (0.0%) | 0 (0.0%) |
| Architecture & Engineering | 0 (0.0%) | 0 (0.0%) |
| Life, Physical & Social Science | 0 (0.0%) | 0 (0.0%) |
| Community & Social Service | 2 (100.0%) | 0 (0.0%) |
| Education, Arts & Media | 2 (100.0%) | 0 (0.0%) |
| Legal Services & Support | 0 (0.0%) | 0 (0.0%) |
| Education Instruction & Library | 0 (0.0%) | 0 (0.0%) |
| Arts, Media & Entertainment | 0 (0.0%) | 0 (0.0%) |
| Health Diagnosing & Treating | 0 (0.0%) | 0 (0.0%) |
| Health Technologists | 0 (0.0%) | 0 (0.0%) |
| Total (Category) | 11 (100.0%) | 0 (0.0%) |
| Total (Overall) | 24 (58.5%) | 17 (41.5%) |
Services Occupations
The most common Services occupations in Capulin are , and Healthcare Support (17 | 41.5%).
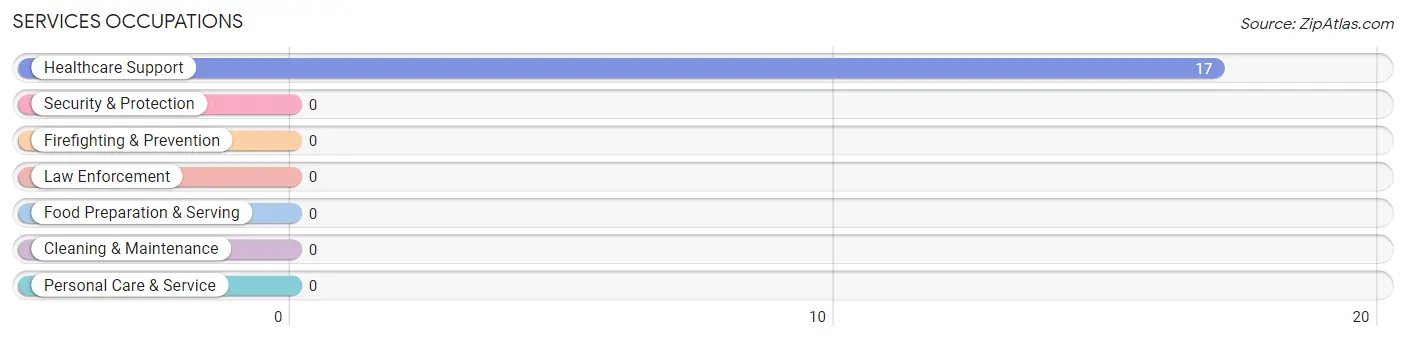
Services Occupations by Sex
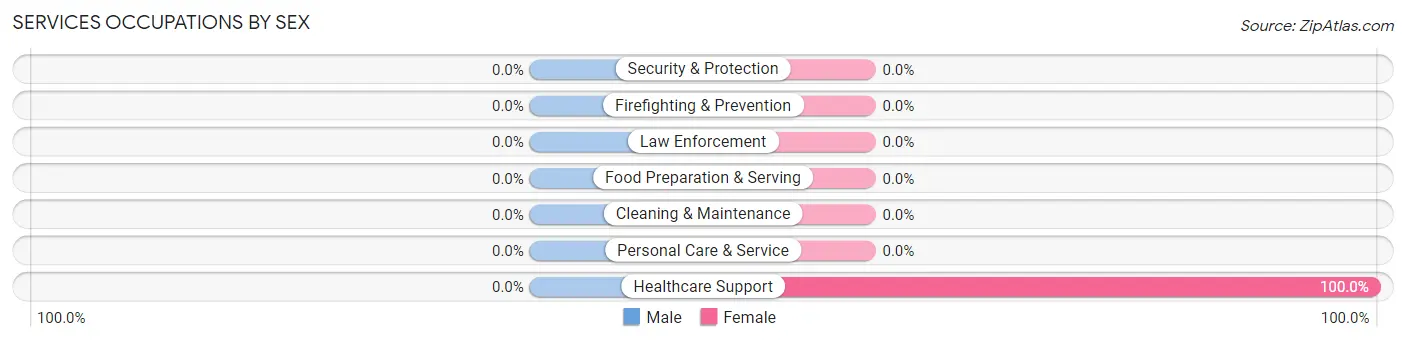
| Occupation | Male | Female |
| Healthcare Support | 0 (0.0%) | 17 (100.0%) |
| Security & Protection | 0 (0.0%) | 0 (0.0%) |
| Firefighting & Prevention | 0 (0.0%) | 0 (0.0%) |
| Law Enforcement | 0 (0.0%) | 0 (0.0%) |
| Food Preparation & Serving | 0 (0.0%) | 0 (0.0%) |
| Cleaning & Maintenance | 0 (0.0%) | 0 (0.0%) |
| Personal Care & Service | 0 (0.0%) | 0 (0.0%) |
| Total (Category) | 0 (0.0%) | 17 (100.0%) |
| Total (Overall) | 24 (58.5%) | 17 (41.5%) |
Sales and Office Occupations

Sales and Office Occupations by Sex
| Occupation | Male | Female |
| Sales & Related | 0 (0.0%) | 0 (0.0%) |
| Office & Administration | 0 (0.0%) | 0 (0.0%) |
| Total (Category) | 0 (0.0%) | 0 (0.0%) |
| Total (Overall) | 24 (58.5%) | 17 (41.5%) |
Natural Resources, Construction and Maintenance Occupations
Natural Resources, Construction and Maintenance Occupations by Sex
| Occupation | Male | Female |
| Farming, Fishing & Forestry | 0 (0.0%) | 0 (0.0%) |
| Construction & Extraction | 0 (0.0%) | 0 (0.0%) |
| Installation, Maintenance & Repair | 0 (0.0%) | 0 (0.0%) |
| Total (Category) | 0 (0.0%) | 0 (0.0%) |
| Total (Overall) | 24 (58.5%) | 17 (41.5%) |
Production, Transportation and Moving Occupations
The most common Production, Transportation and Moving occupations in Capulin are , and Material Moving (13 | 31.7%).
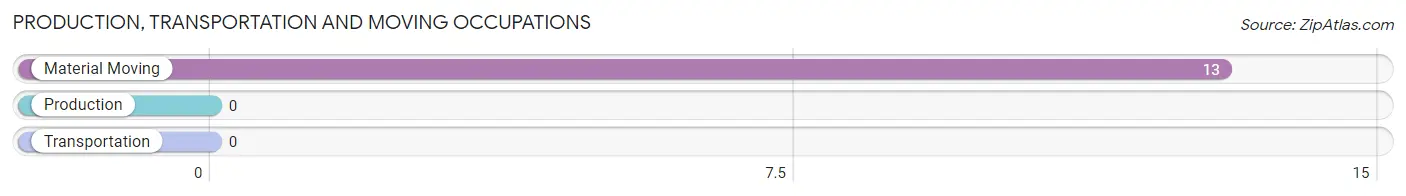
Production, Transportation and Moving Occupations by Sex
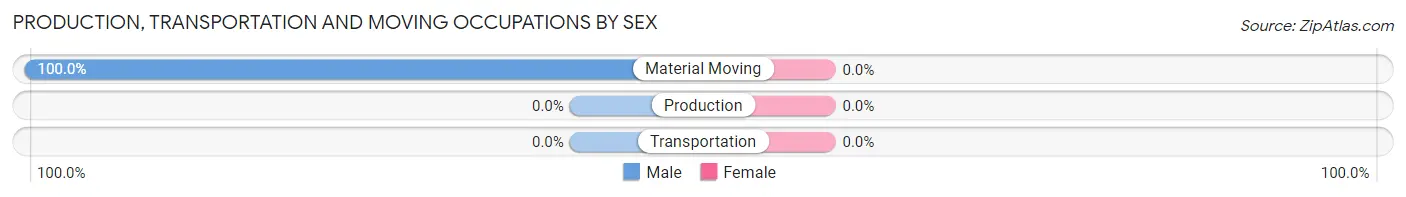
| Occupation | Male | Female |
| Production | 0 (0.0%) | 0 (0.0%) |
| Transportation | 0 (0.0%) | 0 (0.0%) |
| Material Moving | 13 (100.0%) | 0 (0.0%) |
| Total (Category) | 13 (100.0%) | 0 (0.0%) |
| Total (Overall) | 24 (58.5%) | 17 (41.5%) |
Employment Industries by Sex in Capulin
Employment Industries in Capulin
The major employment industries in Capulin include Health Care & Social Assistance (17 | 41.5%), Manufacturing (13 | 31.7%), and Retail Trade (9 | 22.0%).
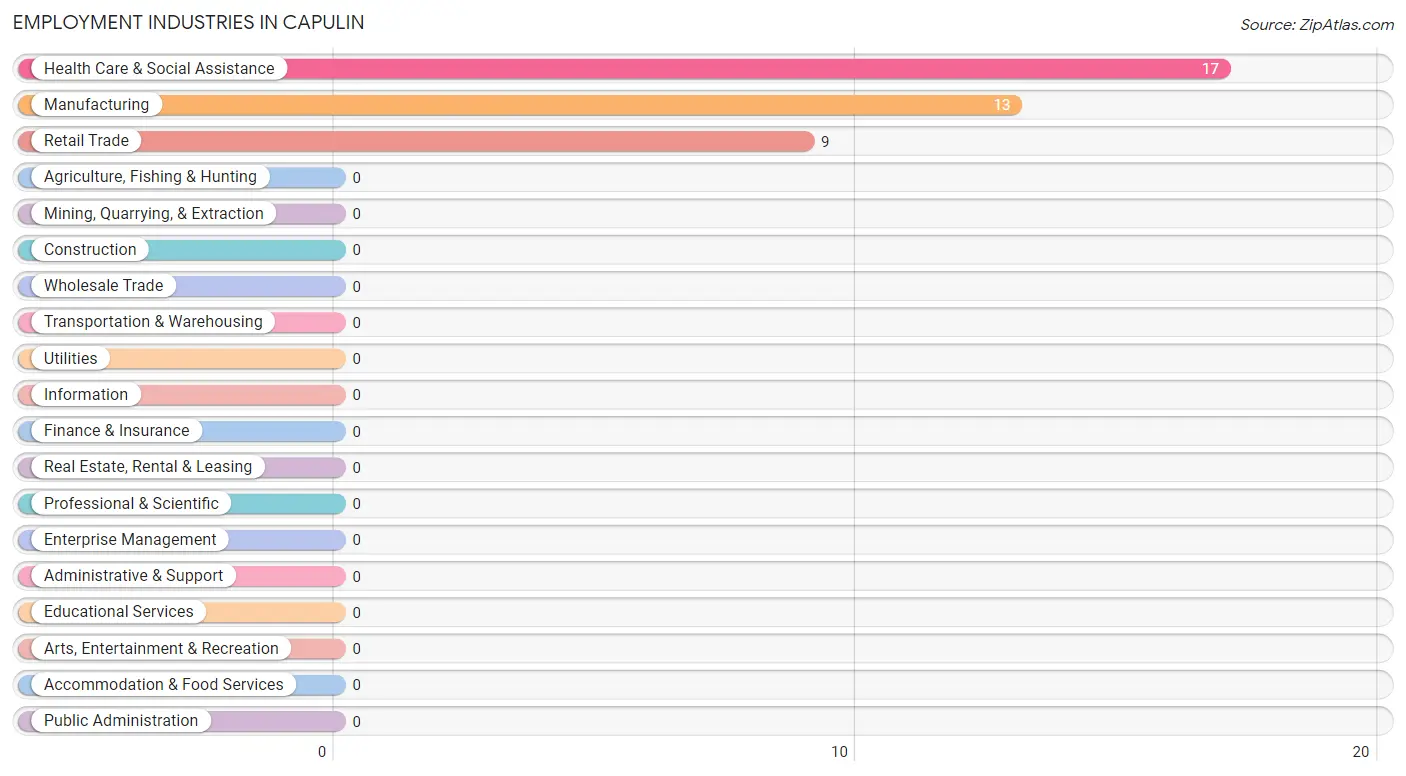
Employment Industries by Sex in Capulin
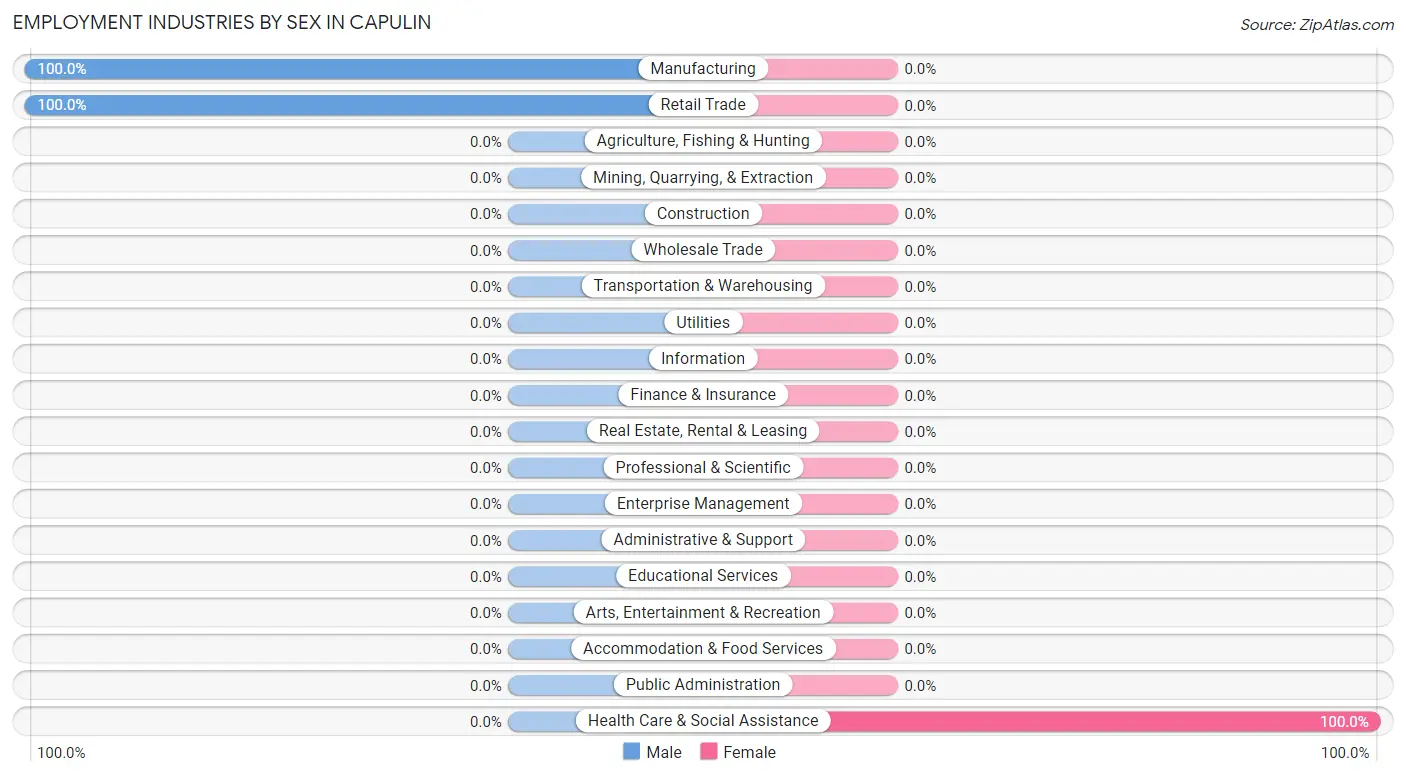
| Industry | Male | Female |
| Agriculture, Fishing & Hunting | 0 (0.0%) | 0 (0.0%) |
| Mining, Quarrying, & Extraction | 0 (0.0%) | 0 (0.0%) |
| Construction | 0 (0.0%) | 0 (0.0%) |
| Manufacturing | 13 (100.0%) | 0 (0.0%) |
| Wholesale Trade | 0 (0.0%) | 0 (0.0%) |
| Retail Trade | 9 (100.0%) | 0 (0.0%) |
| Transportation & Warehousing | 0 (0.0%) | 0 (0.0%) |
| Utilities | 0 (0.0%) | 0 (0.0%) |
| Information | 0 (0.0%) | 0 (0.0%) |
| Finance & Insurance | 0 (0.0%) | 0 (0.0%) |
| Real Estate, Rental & Leasing | 0 (0.0%) | 0 (0.0%) |
| Professional & Scientific | 0 (0.0%) | 0 (0.0%) |
| Enterprise Management | 0 (0.0%) | 0 (0.0%) |
| Administrative & Support | 0 (0.0%) | 0 (0.0%) |
| Educational Services | 0 (0.0%) | 0 (0.0%) |
| Health Care & Social Assistance | 0 (0.0%) | 17 (100.0%) |
| Arts, Entertainment & Recreation | 0 (0.0%) | 0 (0.0%) |
| Accommodation & Food Services | 0 (0.0%) | 0 (0.0%) |
| Public Administration | 0 (0.0%) | 0 (0.0%) |
| Total | 24 (58.5%) | 17 (41.5%) |
Education in Capulin
School Enrollment in Capulin
The most common levels of schooling among the 62 students in Capulin are middle school (30 | 48.4%), high school (30 | 48.4%), and college / undergraduate (2 | 3.2%).
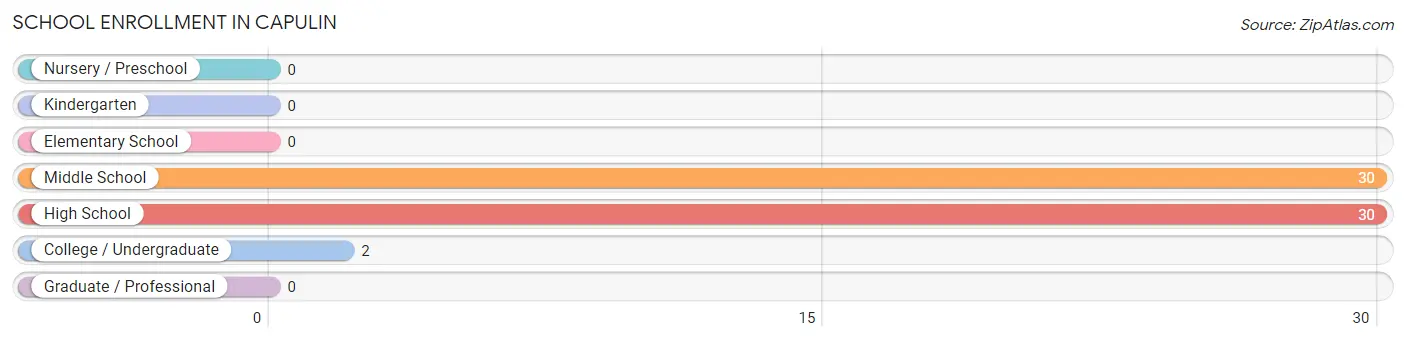
| School Level | # Students | % Students |
| Nursery / Preschool | 0 | 0.0% |
| Kindergarten | 0 | 0.0% |
| Elementary School | 0 | 0.0% |
| Middle School | 30 | 48.4% |
| High School | 30 | 48.4% |
| College / Undergraduate | 2 | 3.2% |
| Graduate / Professional | 0 | 0.0% |
| Total | 62 | 100.0% |
School Enrollment by Age by Funding Source in Capulin
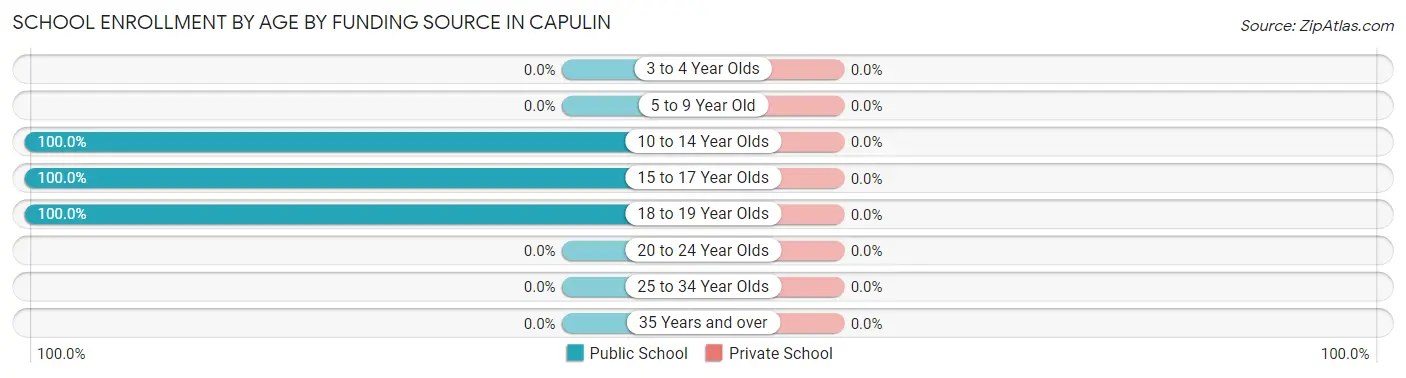
| Age Bracket | Public School | Private School |
| 3 to 4 Year Olds | 0 (0.0%) | 0 (0.0%) |
| 5 to 9 Year Old | 0 (0.0%) | 0 (0.0%) |
| 10 to 14 Year Olds | 51 (100.0%) | 0 (0.0%) |
| 15 to 17 Year Olds | 9 (100.0%) | 0 (0.0%) |
| 18 to 19 Year Olds | 2 (100.0%) | 0 (0.0%) |
| 20 to 24 Year Olds | 0 (0.0%) | 0 (0.0%) |
| 25 to 34 Year Olds | 0 (0.0%) | 0 (0.0%) |
| 35 Years and over | 0 (0.0%) | 0 (0.0%) |
| Total | 62 (100.0%) | 0 (0.0%) |
Educational Attainment by Field of Study in Capulin
Psychology (21 | 47.7%), social sciences (21 | 47.7%), physical & health sciences (1 | 2.3%), and liberal arts & history (1 | 2.3%) are the most common fields of study among 44 individuals in Capulin who have obtained a bachelor's degree or higher.
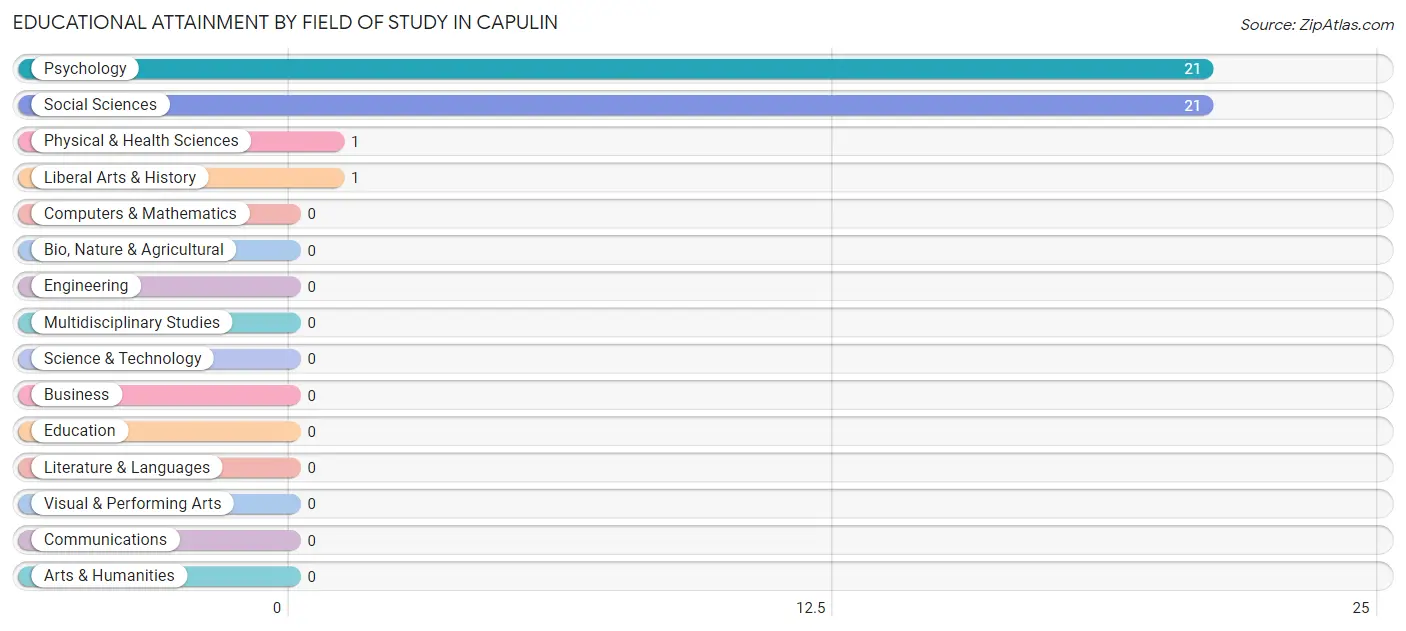
| Field of Study | # Graduates | % Graduates |
| Computers & Mathematics | 0 | 0.0% |
| Bio, Nature & Agricultural | 0 | 0.0% |
| Physical & Health Sciences | 1 | 2.3% |
| Psychology | 21 | 47.7% |
| Social Sciences | 21 | 47.7% |
| Engineering | 0 | 0.0% |
| Multidisciplinary Studies | 0 | 0.0% |
| Science & Technology | 0 | 0.0% |
| Business | 0 | 0.0% |
| Education | 0 | 0.0% |
| Literature & Languages | 0 | 0.0% |
| Liberal Arts & History | 1 | 2.3% |
| Visual & Performing Arts | 0 | 0.0% |
| Communications | 0 | 0.0% |
| Arts & Humanities | 0 | 0.0% |
| Total | 44 | 100.0% |
Transportation & Commute in Capulin
Vehicle Availability by Sex in Capulin
The most prevalent vehicle ownership categories in Capulin are males with 4 vehicles (13, accounting for 59.1%) and females with 4 vehicles (17, making up 76.5%).
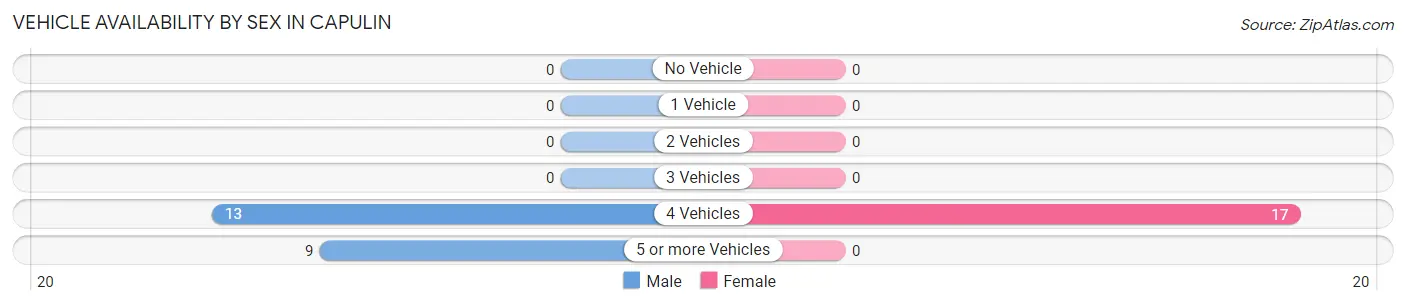
| Vehicles Available | Male | Female |
| No Vehicle | 0 (0.0%) | 0 (0.0%) |
| 1 Vehicle | 0 (0.0%) | 0 (0.0%) |
| 2 Vehicles | 0 (0.0%) | 0 (0.0%) |
| 3 Vehicles | 0 (0.0%) | 0 (0.0%) |
| 4 Vehicles | 13 (59.1%) | 17 (100.0%) |
| 5 or more Vehicles | 9 (40.9%) | 0 (0.0%) |
| Total | 22 (100.0%) | 17 (100.0%) |
Commute Time in Capulin
The most frequently occuring commute durations in Capulin are 10 to 14 minutes (17 commuters, 43.6%), 25 to 29 minutes (13 commuters, 33.3%), and 15 to 19 minutes (9 commuters, 23.1%).
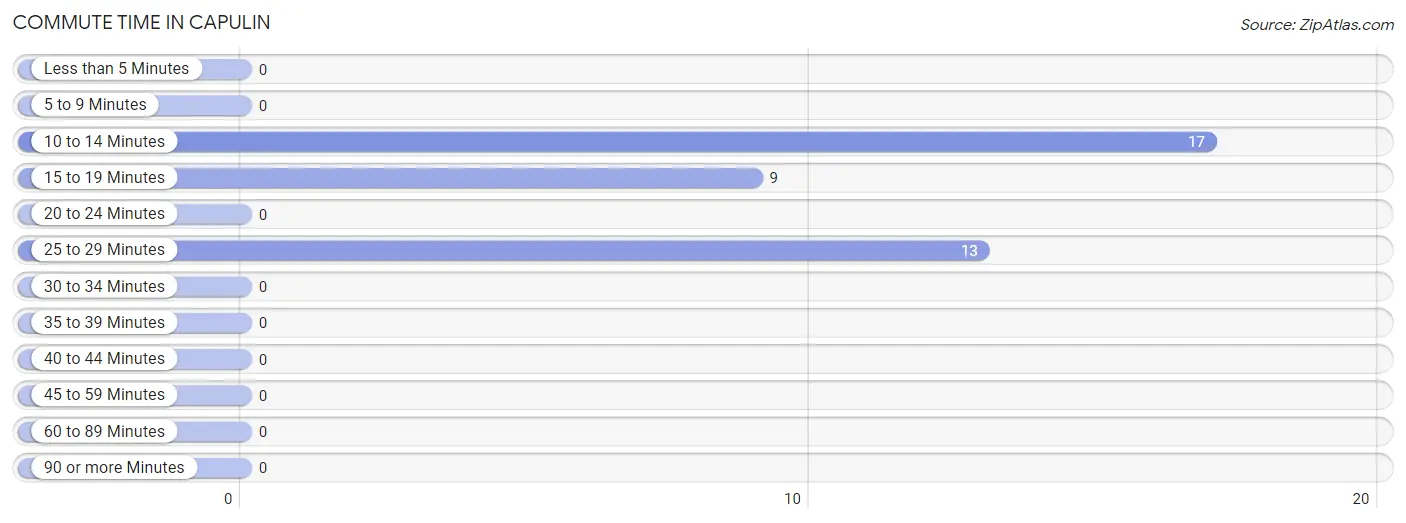
| Commute Time | # Commuters | % Commuters |
| Less than 5 Minutes | 0 | 0.0% |
| 5 to 9 Minutes | 0 | 0.0% |
| 10 to 14 Minutes | 17 | 43.6% |
| 15 to 19 Minutes | 9 | 23.1% |
| 20 to 24 Minutes | 0 | 0.0% |
| 25 to 29 Minutes | 13 | 33.3% |
| 30 to 34 Minutes | 0 | 0.0% |
| 35 to 39 Minutes | 0 | 0.0% |
| 40 to 44 Minutes | 0 | 0.0% |
| 45 to 59 Minutes | 0 | 0.0% |
| 60 to 89 Minutes | 0 | 0.0% |
| 90 or more Minutes | 0 | 0.0% |
Commute Time by Sex in Capulin
The most common commute times in Capulin are 25 to 29 minutes (13 commuters, 59.1%) for males and 10 to 14 minutes (17 commuters, 100.0%) for females.
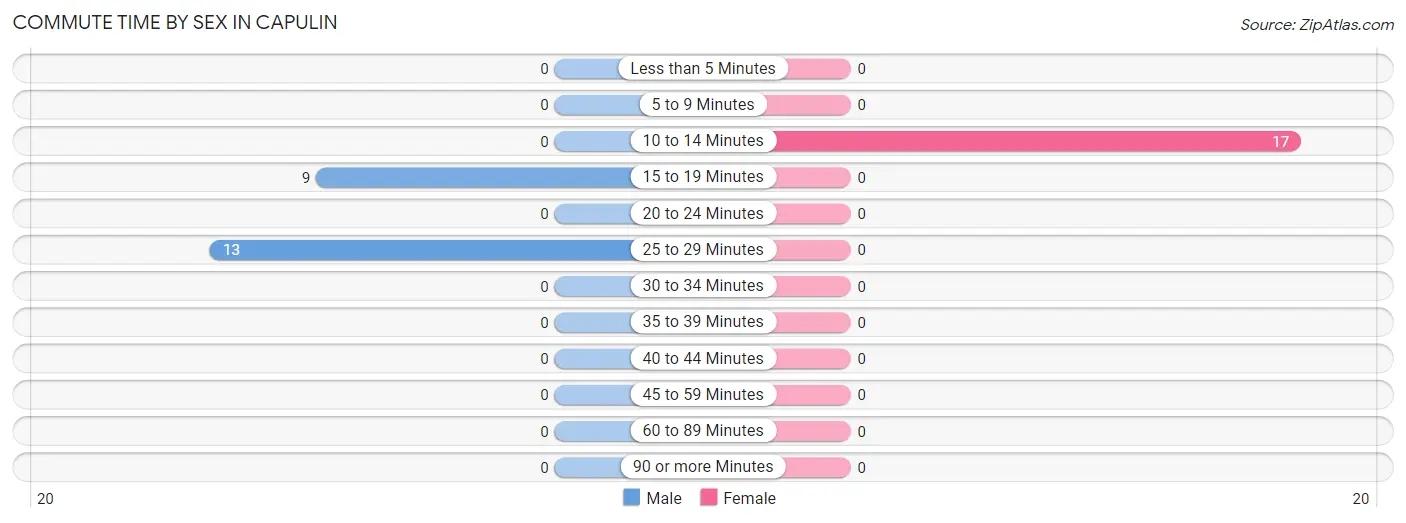
| Commute Time | Male | Female |
| Less than 5 Minutes | 0 (0.0%) | 0 (0.0%) |
| 5 to 9 Minutes | 0 (0.0%) | 0 (0.0%) |
| 10 to 14 Minutes | 0 (0.0%) | 17 (100.0%) |
| 15 to 19 Minutes | 9 (40.9%) | 0 (0.0%) |
| 20 to 24 Minutes | 0 (0.0%) | 0 (0.0%) |
| 25 to 29 Minutes | 13 (59.1%) | 0 (0.0%) |
| 30 to 34 Minutes | 0 (0.0%) | 0 (0.0%) |
| 35 to 39 Minutes | 0 (0.0%) | 0 (0.0%) |
| 40 to 44 Minutes | 0 (0.0%) | 0 (0.0%) |
| 45 to 59 Minutes | 0 (0.0%) | 0 (0.0%) |
| 60 to 89 Minutes | 0 (0.0%) | 0 (0.0%) |
| 90 or more Minutes | 0 (0.0%) | 0 (0.0%) |
Time of Departure to Work by Sex in Capulin
The most frequent times of departure to work in Capulin are 7:00 AM to 7:29 AM (13, 59.1%) for males and 7:30 AM to 7:59 AM (17, 100.0%) for females.
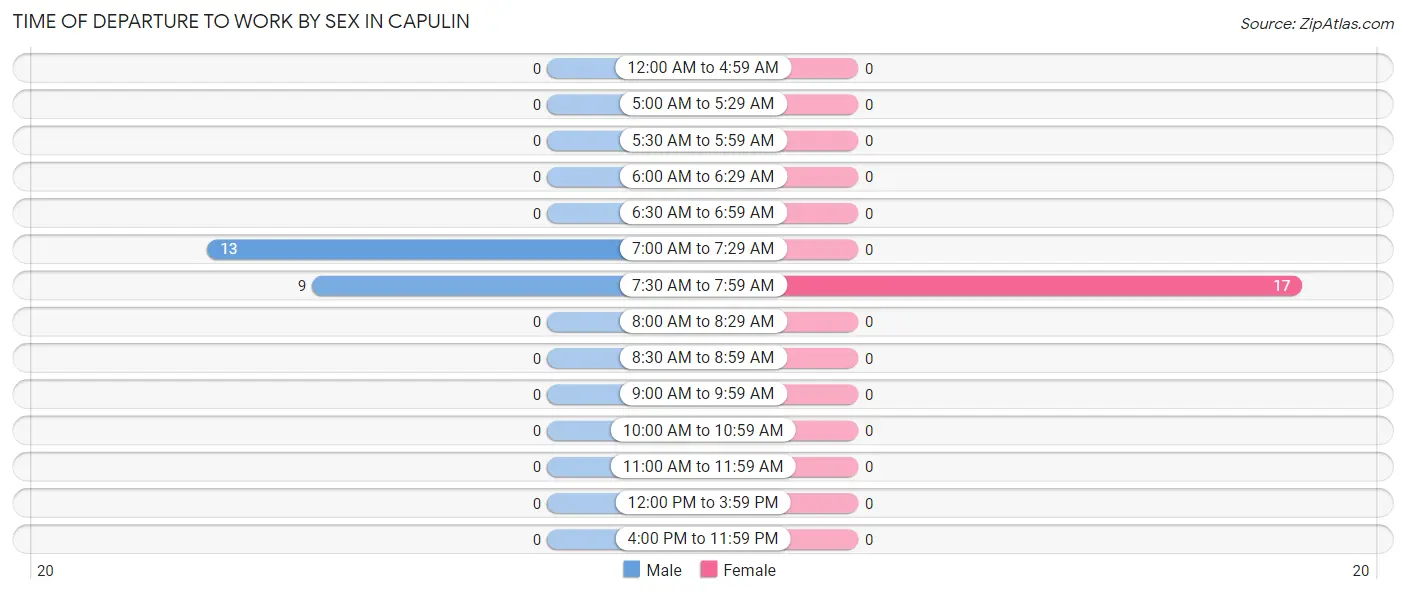
| Time of Departure | Male | Female |
| 12:00 AM to 4:59 AM | 0 (0.0%) | 0 (0.0%) |
| 5:00 AM to 5:29 AM | 0 (0.0%) | 0 (0.0%) |
| 5:30 AM to 5:59 AM | 0 (0.0%) | 0 (0.0%) |
| 6:00 AM to 6:29 AM | 0 (0.0%) | 0 (0.0%) |
| 6:30 AM to 6:59 AM | 0 (0.0%) | 0 (0.0%) |
| 7:00 AM to 7:29 AM | 13 (59.1%) | 0 (0.0%) |
| 7:30 AM to 7:59 AM | 9 (40.9%) | 17 (100.0%) |
| 8:00 AM to 8:29 AM | 0 (0.0%) | 0 (0.0%) |
| 8:30 AM to 8:59 AM | 0 (0.0%) | 0 (0.0%) |
| 9:00 AM to 9:59 AM | 0 (0.0%) | 0 (0.0%) |
| 10:00 AM to 10:59 AM | 0 (0.0%) | 0 (0.0%) |
| 11:00 AM to 11:59 AM | 0 (0.0%) | 0 (0.0%) |
| 12:00 PM to 3:59 PM | 0 (0.0%) | 0 (0.0%) |
| 4:00 PM to 11:59 PM | 0 (0.0%) | 0 (0.0%) |
| Total | 22 (100.0%) | 17 (100.0%) |
Housing Occupancy in Capulin
Occupancy by Ownership in Capulin
Of the total 57 dwellings in Capulin, owner-occupied units account for 57 (100.0%), while renter-occupied units make up 0 (0.0%).
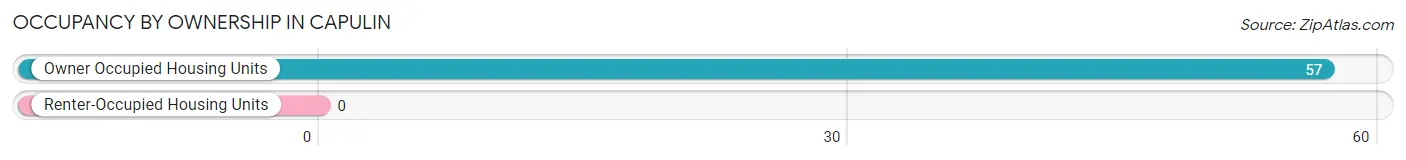
| Occupancy | # Housing Units | % Housing Units |
| Owner Occupied Housing Units | 57 | 100.0% |
| Renter-Occupied Housing Units | 0 | 0.0% |
| Total Occupied Housing Units | 57 | 100.0% |
Occupancy by Household Size in Capulin
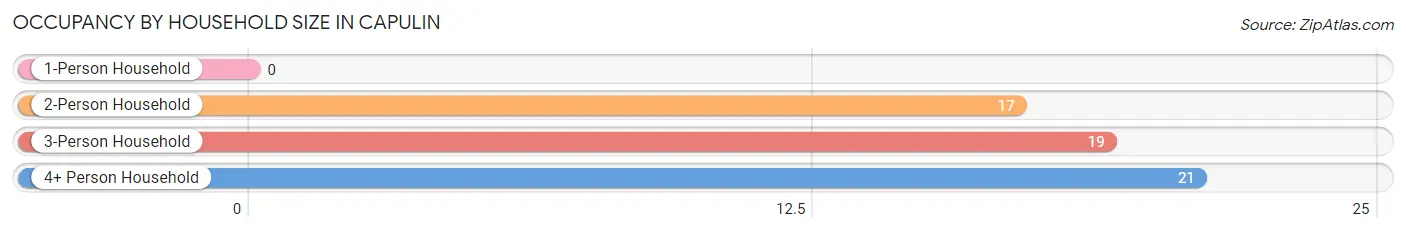
| Household Size | # Housing Units | % Housing Units |
| 1-Person Household | 0 | 0.0% |
| 2-Person Household | 17 | 29.8% |
| 3-Person Household | 19 | 33.3% |
| 4+ Person Household | 21 | 36.8% |
| Total Housing Units | 57 | 100.0% |
Occupancy by Ownership by Household Size in Capulin
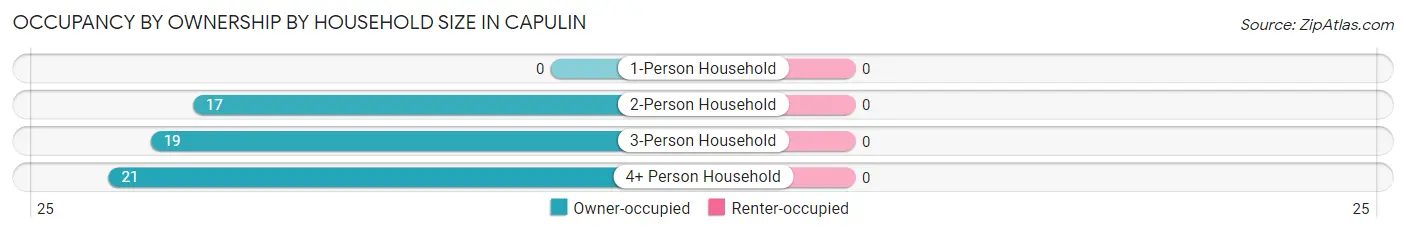
| Household Size | Owner-occupied | Renter-occupied |
| 1-Person Household | 0 (0.0%) | 0 (0.0%) |
| 2-Person Household | 17 (100.0%) | 0 (0.0%) |
| 3-Person Household | 19 (100.0%) | 0 (0.0%) |
| 4+ Person Household | 21 (100.0%) | 0 (0.0%) |
| Total Housing Units | 57 (100.0%) | 0 (0.0%) |
Occupancy by Educational Attainment in Capulin
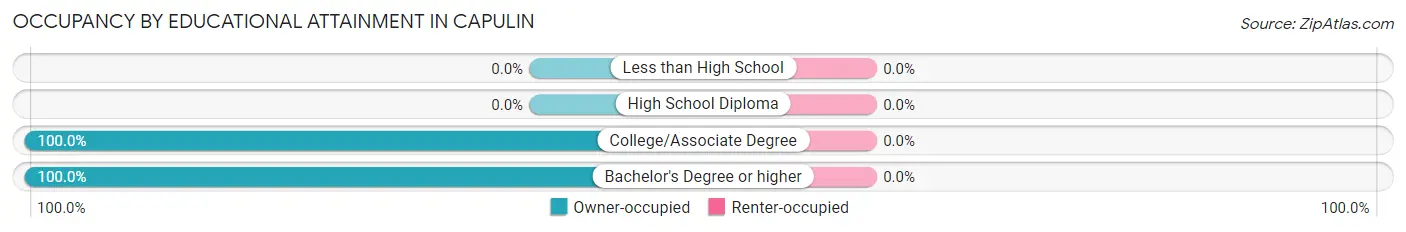
| Household Size | Owner-occupied | Renter-occupied |
| Less than High School | 0 (0.0%) | 0 (0.0%) |
| High School Diploma | 0 (0.0%) | 0 (0.0%) |
| College/Associate Degree | 36 (100.0%) | 0 (0.0%) |
| Bachelor's Degree or higher | 21 (100.0%) | 0 (0.0%) |
Occupancy by Age of Householder in Capulin
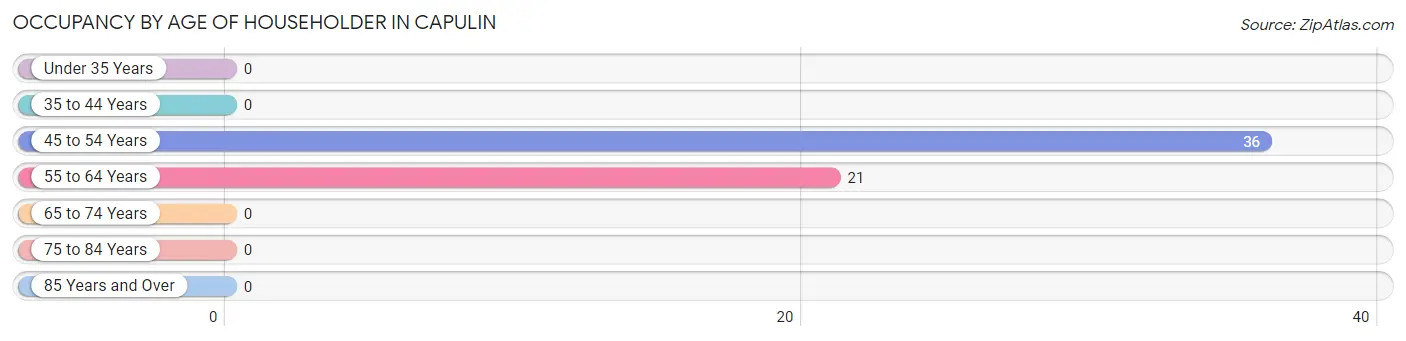
| Age Bracket | # Households | % Households |
| Under 35 Years | 0 | 0.0% |
| 35 to 44 Years | 0 | 0.0% |
| 45 to 54 Years | 36 | 63.2% |
| 55 to 64 Years | 21 | 36.8% |
| 65 to 74 Years | 0 | 0.0% |
| 75 to 84 Years | 0 | 0.0% |
| 85 Years and Over | 0 | 0.0% |
| Total | 57 | 100.0% |
Housing Finances in Capulin
Median Income by Occupancy in Capulin
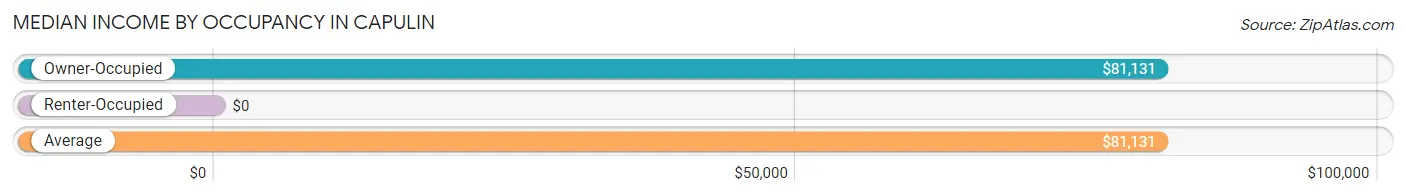
| Occupancy Type | # Households | Median Income |
| Owner-Occupied | 57 (100.0%) | $81,131 |
| Renter-Occupied | 0 (0.0%) | $0 |
| Average | 57 (100.0%) | $81,131 |
Occupancy by Householder Income Bracket in Capulin
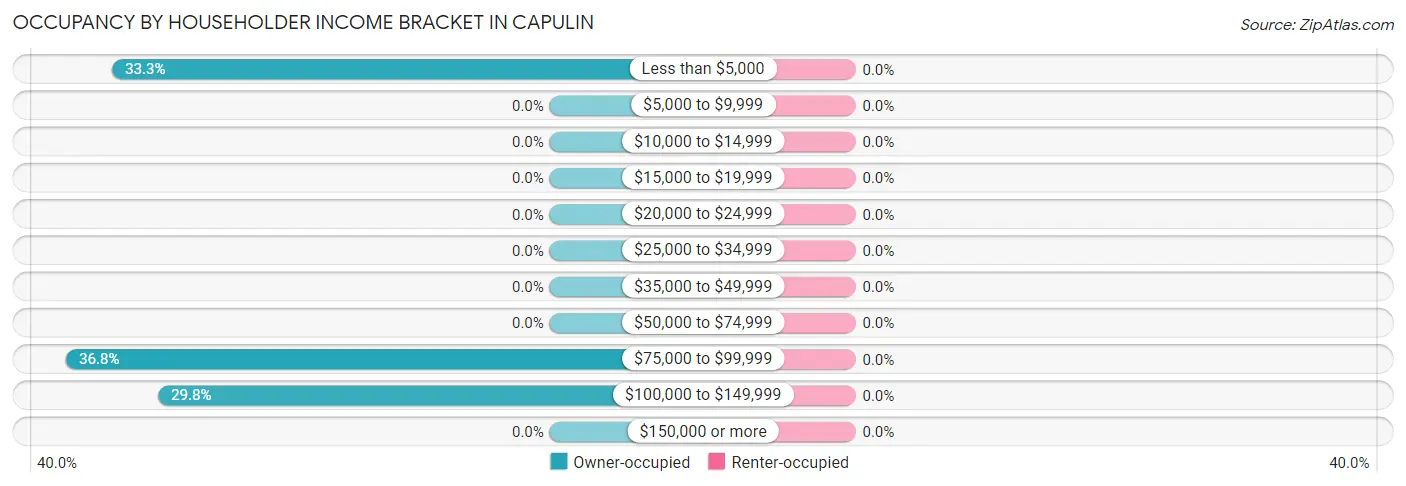
| Income Bracket | Owner-occupied | Renter-occupied |
| Less than $5,000 | 19 (33.3%) | 0 (0.0%) |
| $5,000 to $9,999 | 0 (0.0%) | 0 (0.0%) |
| $10,000 to $14,999 | 0 (0.0%) | 0 (0.0%) |
| $15,000 to $19,999 | 0 (0.0%) | 0 (0.0%) |
| $20,000 to $24,999 | 0 (0.0%) | 0 (0.0%) |
| $25,000 to $34,999 | 0 (0.0%) | 0 (0.0%) |
| $35,000 to $49,999 | 0 (0.0%) | 0 (0.0%) |
| $50,000 to $74,999 | 0 (0.0%) | 0 (0.0%) |
| $75,000 to $99,999 | 21 (36.8%) | 0 (0.0%) |
| $100,000 to $149,999 | 17 (29.8%) | 0 (0.0%) |
| $150,000 or more | 0 (0.0%) | 0 (0.0%) |
| Total | 57 (100.0%) | 0 (0.0%) |
Monthly Housing Cost Tiers in Capulin
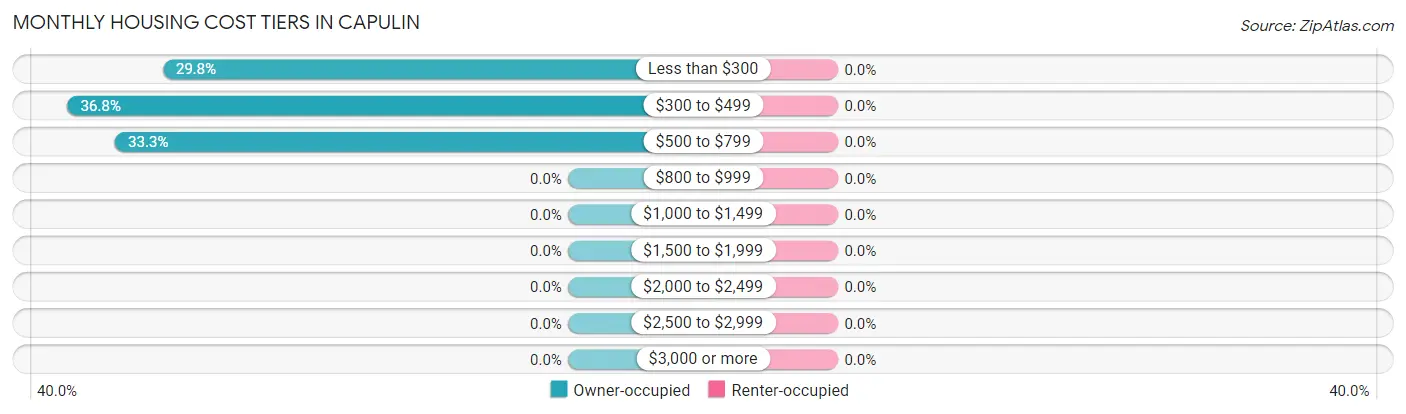
| Monthly Cost | Owner-occupied | Renter-occupied |
| Less than $300 | 17 (29.8%) | 0 (0.0%) |
| $300 to $499 | 21 (36.8%) | 0 (0.0%) |
| $500 to $799 | 19 (33.3%) | 0 (0.0%) |
| $800 to $999 | 0 (0.0%) | 0 (0.0%) |
| $1,000 to $1,499 | 0 (0.0%) | 0 (0.0%) |
| $1,500 to $1,999 | 0 (0.0%) | 0 (0.0%) |
| $2,000 to $2,499 | 0 (0.0%) | 0 (0.0%) |
| $2,500 to $2,999 | 0 (0.0%) | 0 (0.0%) |
| $3,000 or more | 0 (0.0%) | 0 (0.0%) |
| Total | 57 (100.0%) | 0 (0.0%) |
Physical Housing Characteristics in Capulin
Housing Structures in Capulin
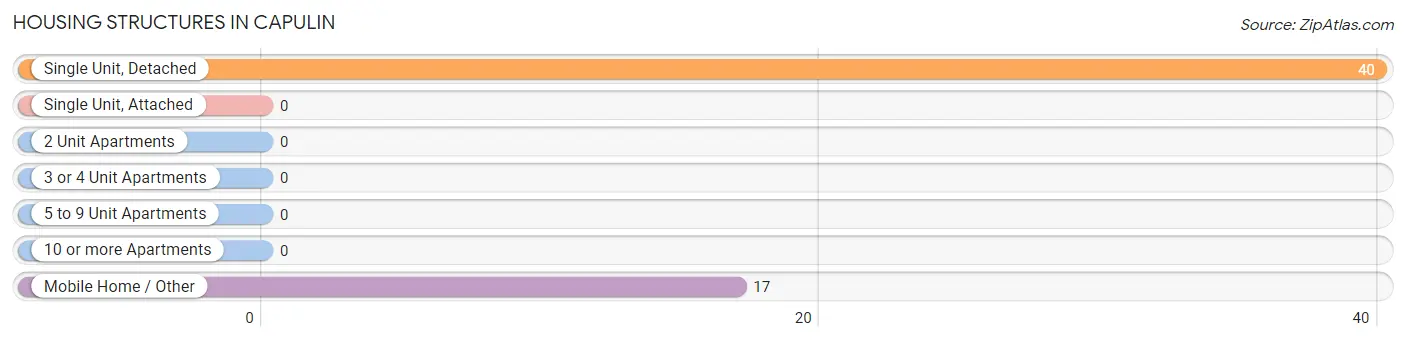
| Structure Type | # Housing Units | % Housing Units |
| Single Unit, Detached | 40 | 70.2% |
| Single Unit, Attached | 0 | 0.0% |
| 2 Unit Apartments | 0 | 0.0% |
| 3 or 4 Unit Apartments | 0 | 0.0% |
| 5 to 9 Unit Apartments | 0 | 0.0% |
| 10 or more Apartments | 0 | 0.0% |
| Mobile Home / Other | 17 | 29.8% |
| Total | 57 | 100.0% |
Housing Structures by Occupancy in Capulin
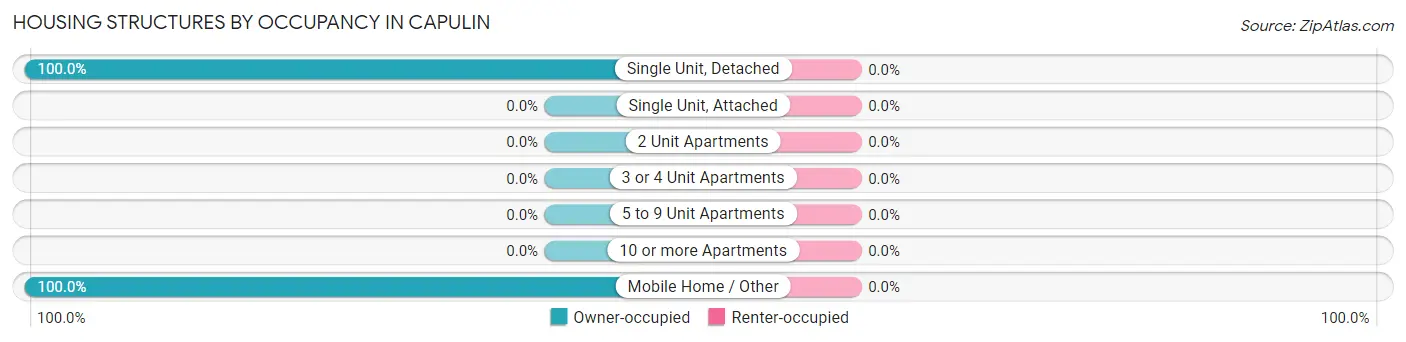
| Structure Type | Owner-occupied | Renter-occupied |
| Single Unit, Detached | 40 (100.0%) | 0 (0.0%) |
| Single Unit, Attached | 0 (0.0%) | 0 (0.0%) |
| 2 Unit Apartments | 0 (0.0%) | 0 (0.0%) |
| 3 or 4 Unit Apartments | 0 (0.0%) | 0 (0.0%) |
| 5 to 9 Unit Apartments | 0 (0.0%) | 0 (0.0%) |
| 10 or more Apartments | 0 (0.0%) | 0 (0.0%) |
| Mobile Home / Other | 17 (100.0%) | 0 (0.0%) |
| Total | 57 (100.0%) | 0 (0.0%) |
Housing Structures by Number of Rooms in Capulin
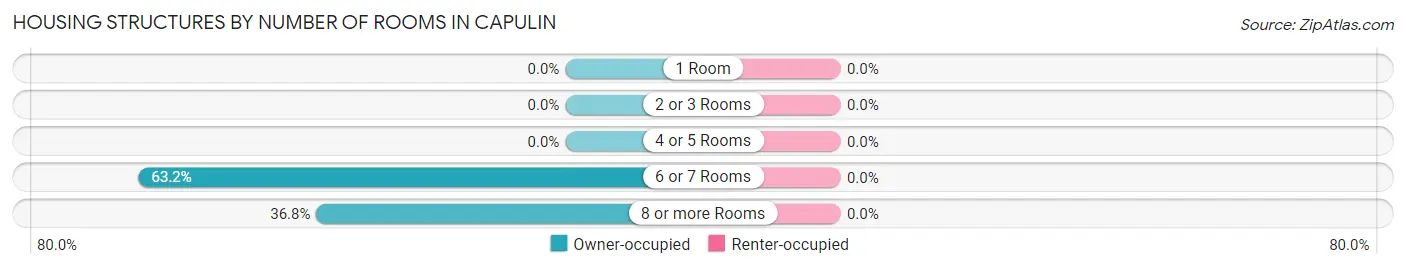
| Number of Rooms | Owner-occupied | Renter-occupied |
| 1 Room | 0 (0.0%) | 0 (0.0%) |
| 2 or 3 Rooms | 0 (0.0%) | 0 (0.0%) |
| 4 or 5 Rooms | 0 (0.0%) | 0 (0.0%) |
| 6 or 7 Rooms | 36 (63.2%) | 0 (0.0%) |
| 8 or more Rooms | 21 (36.8%) | 0 (0.0%) |
| Total | 57 (100.0%) | 0 (0.0%) |
Housing Structure by Heating Type in Capulin
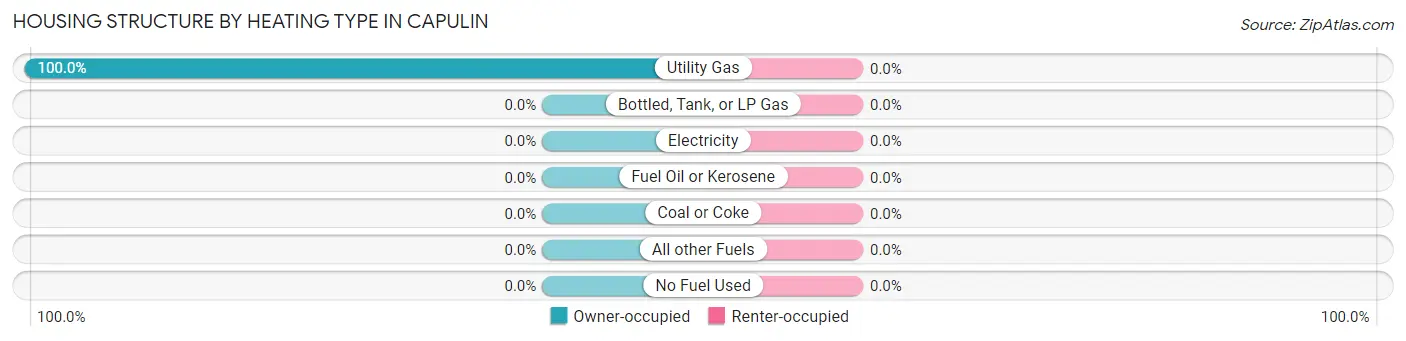
| Heating Type | Owner-occupied | Renter-occupied |
| Utility Gas | 57 (100.0%) | 0 (0.0%) |
| Bottled, Tank, or LP Gas | 0 (0.0%) | 0 (0.0%) |
| Electricity | 0 (0.0%) | 0 (0.0%) |
| Fuel Oil or Kerosene | 0 (0.0%) | 0 (0.0%) |
| Coal or Coke | 0 (0.0%) | 0 (0.0%) |
| All other Fuels | 0 (0.0%) | 0 (0.0%) |
| No Fuel Used | 0 (0.0%) | 0 (0.0%) |
| Total | 57 (100.0%) | 0 (0.0%) |
Household Vehicle Usage in Capulin
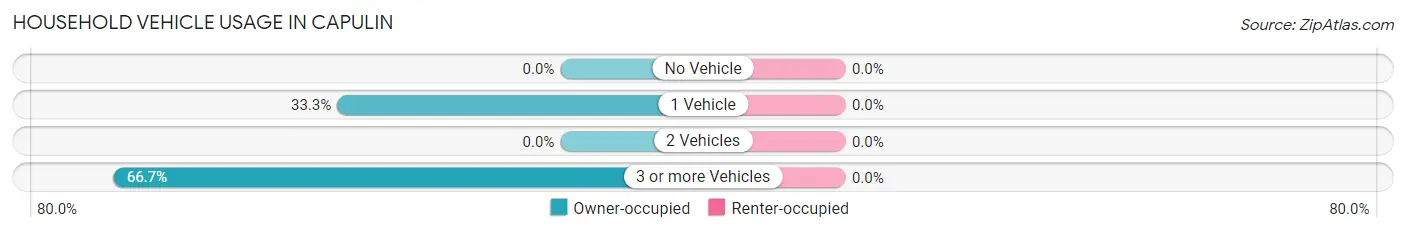
| Vehicles per Household | Owner-occupied | Renter-occupied |
| No Vehicle | 0 (0.0%) | 0 (0.0%) |
| 1 Vehicle | 19 (33.3%) | 0 (0.0%) |
| 2 Vehicles | 0 (0.0%) | 0 (0.0%) |
| 3 or more Vehicles | 38 (66.7%) | 0 (0.0%) |
| Total | 57 (100.0%) | 0 (0.0%) |
Real Estate & Mortgages in Capulin
Real Estate and Mortgage Overview in Capulin
| Characteristic | Without Mortgage | With Mortgage |
| Housing Units | 57 | 0 |
| Median Property Value | - | - |
| Median Household Income | $81,131 | $0 |
| Monthly Housing Costs | $377 | $0 |
| Real Estate Taxes | $199 | $0 |
Property Value by Mortgage Status in Capulin
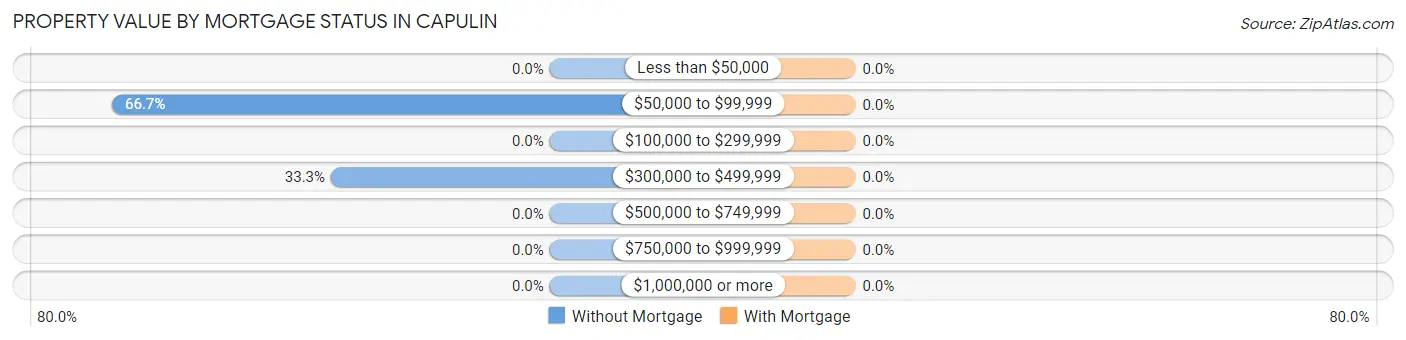
| Property Value | Without Mortgage | With Mortgage |
| Less than $50,000 | 0 (0.0%) | 0 (0.0%) |
| $50,000 to $99,999 | 38 (66.7%) | 0 (0.0%) |
| $100,000 to $299,999 | 0 (0.0%) | 0 (0.0%) |
| $300,000 to $499,999 | 19 (33.3%) | 0 (0.0%) |
| $500,000 to $749,999 | 0 (0.0%) | 0 (0.0%) |
| $750,000 to $999,999 | 0 (0.0%) | 0 (0.0%) |
| $1,000,000 or more | 0 (0.0%) | 0 (0.0%) |
| Total | 57 (100.0%) | 0 (0.0%) |
Household Income by Mortgage Status in Capulin
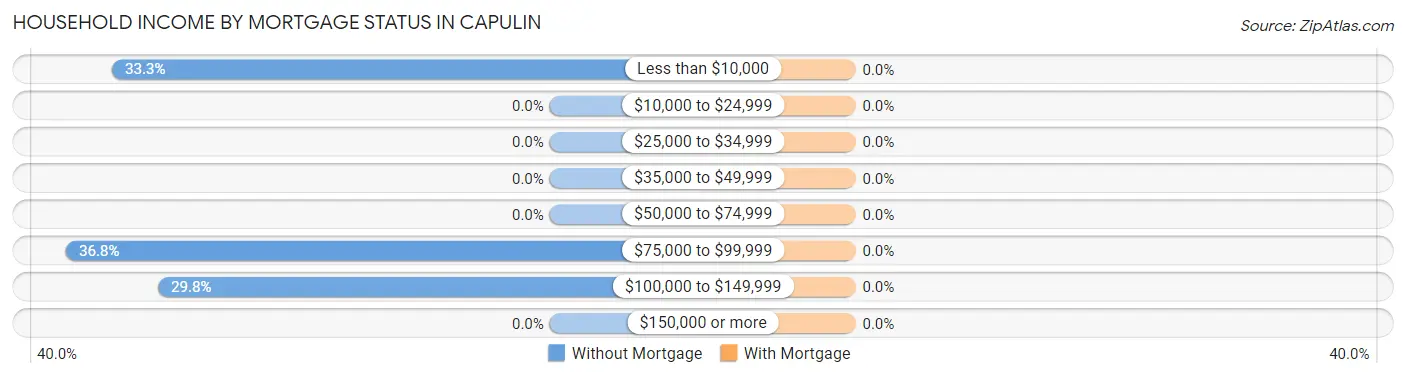
| Household Income | Without Mortgage | With Mortgage |
| Less than $10,000 | 19 (33.3%) | 0 (0.0%) |
| $10,000 to $24,999 | 0 (0.0%) | 0 (0.0%) |
| $25,000 to $34,999 | 0 (0.0%) | 0 (0.0%) |
| $35,000 to $49,999 | 0 (0.0%) | 0 (0.0%) |
| $50,000 to $74,999 | 0 (0.0%) | 0 (0.0%) |
| $75,000 to $99,999 | 21 (36.8%) | 0 (0.0%) |
| $100,000 to $149,999 | 17 (29.8%) | 0 (0.0%) |
| $150,000 or more | 0 (0.0%) | 0 (0.0%) |
| Total | 57 (100.0%) | 0 (0.0%) |
Property Value to Household Income Ratio in Capulin
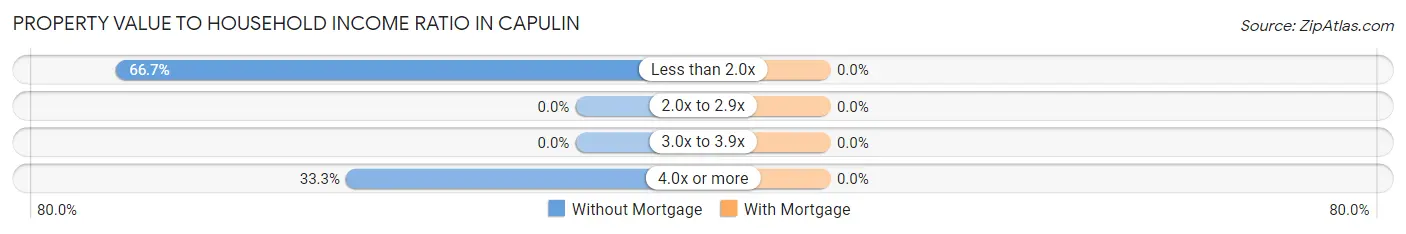
| Value-to-Income Ratio | Without Mortgage | With Mortgage |
| Less than 2.0x | 38 (66.7%) | 0 (0.0%) |
| 2.0x to 2.9x | 0 (0.0%) | 0 (0.0%) |
| 3.0x to 3.9x | 0 (0.0%) | 0 (0.0%) |
| 4.0x or more | 19 (33.3%) | 0 (0.0%) |
| Total | 57 (100.0%) | 0 (0.0%) |
Real Estate Taxes by Mortgage Status in Capulin
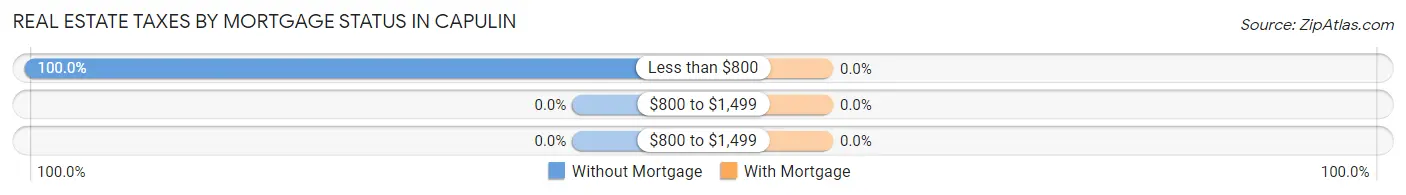
| Property Taxes | Without Mortgage | With Mortgage |
| Less than $800 | 57 (100.0%) | 0 (0.0%) |
| $800 to $1,499 | 0 (0.0%) | 0 (0.0%) |
| $800 to $1,499 | 0 (0.0%) | 0 (0.0%) |
| Total | 57 (100.0%) | 0 (0.0%) |
Health & Disability in Capulin
Health Insurance Coverage by Age in Capulin
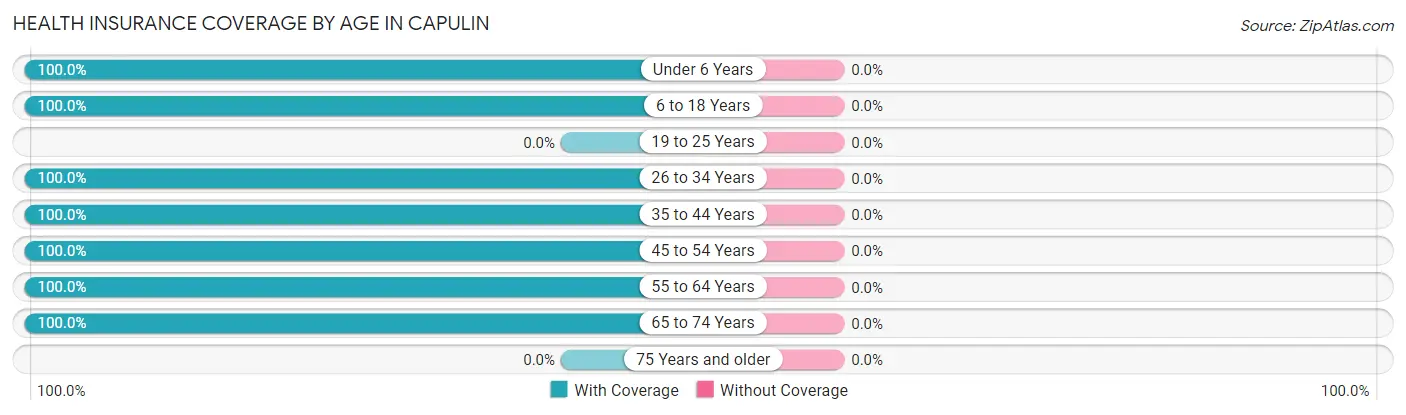
| Age Bracket | With Coverage | Without Coverage |
| Under 6 Years | 63 (100.0%) | 0 (0.0%) |
| 6 to 18 Years | 62 (100.0%) | 0 (0.0%) |
| 19 to 25 Years | 0 (0.0%) | 0 (0.0%) |
| 26 to 34 Years | 56 (100.0%) | 0 (0.0%) |
| 35 to 44 Years | 1 (100.0%) | 0 (0.0%) |
| 45 to 54 Years | 79 (100.0%) | 0 (0.0%) |
| 55 to 64 Years | 39 (100.0%) | 0 (0.0%) |
| 65 to 74 Years | 1 (100.0%) | 0 (0.0%) |
| 75 Years and older | 0 (0.0%) | 0 (0.0%) |
| Total | 301 (100.0%) | 0 (0.0%) |
Health Insurance Coverage by Citizenship Status in Capulin
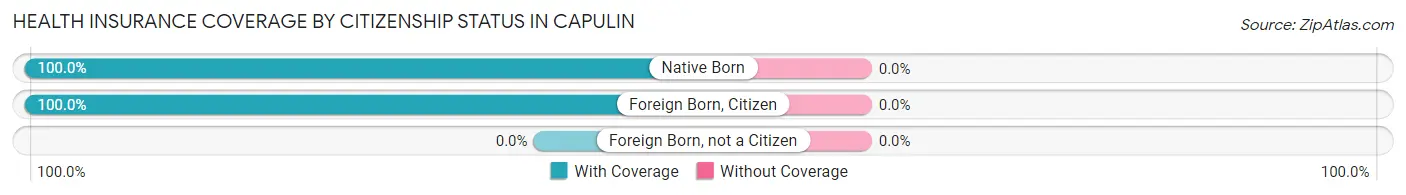
| Citizenship Status | With Coverage | Without Coverage |
| Native Born | 63 (100.0%) | 0 (0.0%) |
| Foreign Born, Citizen | 62 (100.0%) | 0 (0.0%) |
| Foreign Born, not a Citizen | 0 (0.0%) | 0 (0.0%) |
Health Insurance Coverage by Household Income in Capulin
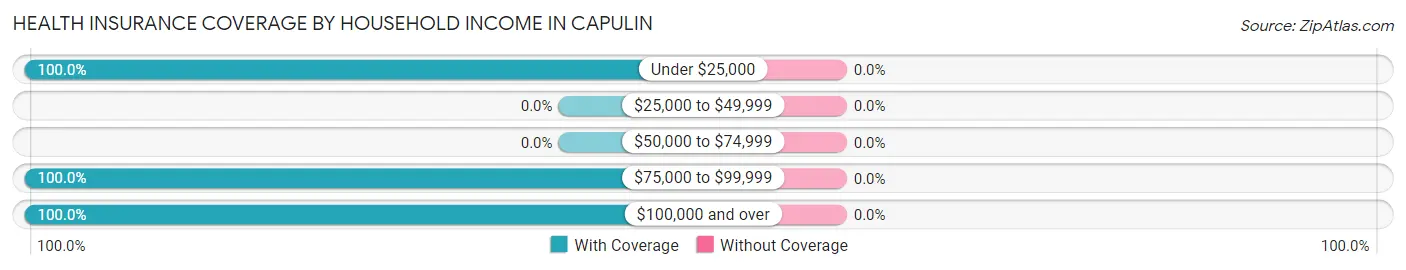
| Household Income | With Coverage | Without Coverage |
| Under $25,000 | 67 (100.0%) | 0 (0.0%) |
| $25,000 to $49,999 | 0 (0.0%) | 0 (0.0%) |
| $50,000 to $74,999 | 0 (0.0%) | 0 (0.0%) |
| $75,000 to $99,999 | 200 (100.0%) | 0 (0.0%) |
| $100,000 and over | 30 (100.0%) | 0 (0.0%) |
Public vs Private Health Insurance Coverage by Age in Capulin
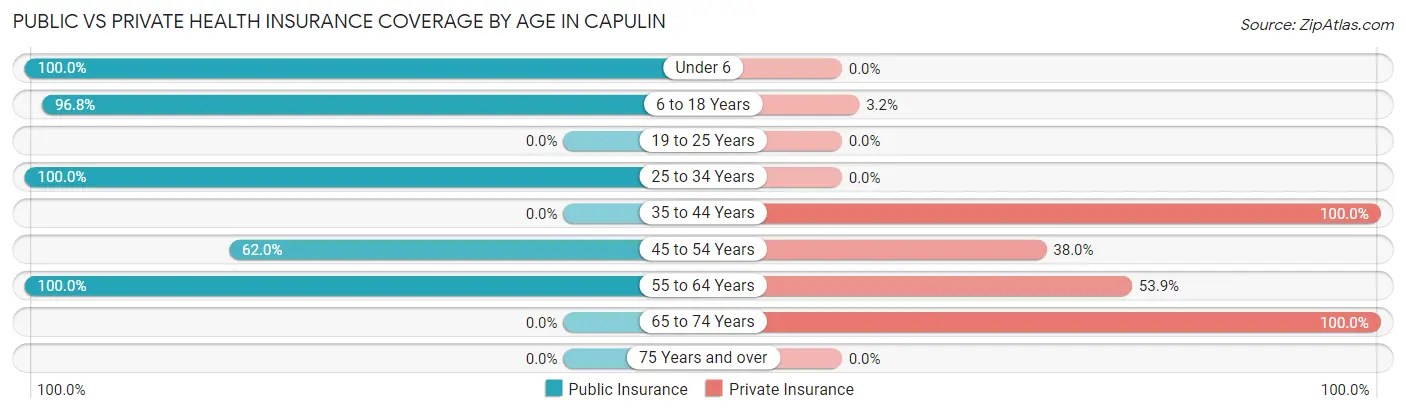
| Age Bracket | Public Insurance | Private Insurance |
| Under 6 | 63 (100.0%) | 0 (0.0%) |
| 6 to 18 Years | 60 (96.8%) | 2 (3.2%) |
| 19 to 25 Years | 0 (0.0%) | 0 (0.0%) |
| 25 to 34 Years | 56 (100.0%) | 0 (0.0%) |
| 35 to 44 Years | 0 (0.0%) | 1 (100.0%) |
| 45 to 54 Years | 49 (62.0%) | 30 (38.0%) |
| 55 to 64 Years | 39 (100.0%) | 21 (53.8%) |
| 65 to 74 Years | 0 (0.0%) | 1 (100.0%) |
| 75 Years and over | 0 (0.0%) | 0 (0.0%) |
| Total | 267 (88.7%) | 55 (18.3%) |
Disability Status by Sex by Age in Capulin
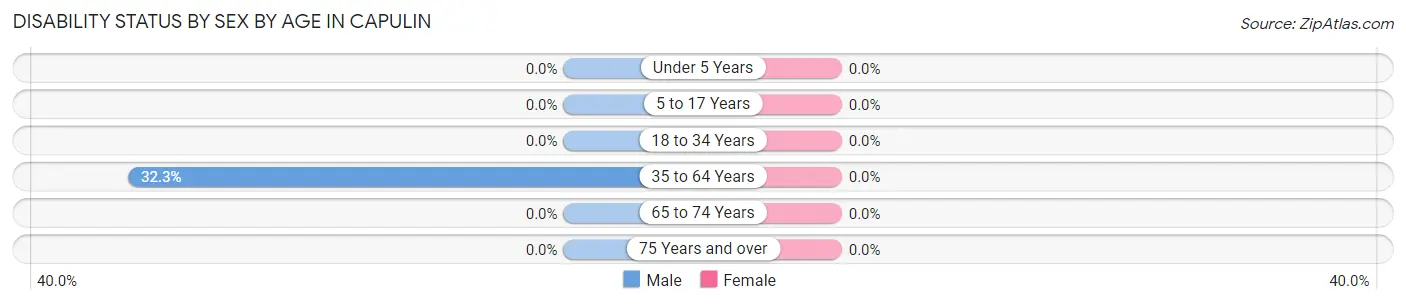
| Age Bracket | Male | Female |
| Under 5 Years | 0 (0.0%) | 0 (0.0%) |
| 5 to 17 Years | 0 (0.0%) | 0 (0.0%) |
| 18 to 34 Years | 0 (0.0%) | 0 (0.0%) |
| 35 to 64 Years | 21 (32.3%) | 0 (0.0%) |
| 65 to 74 Years | 0 (0.0%) | 0 (0.0%) |
| 75 Years and over | 0 (0.0%) | 0 (0.0%) |
Disability Class by Sex by Age in Capulin
Disability Class: Hearing Difficulty
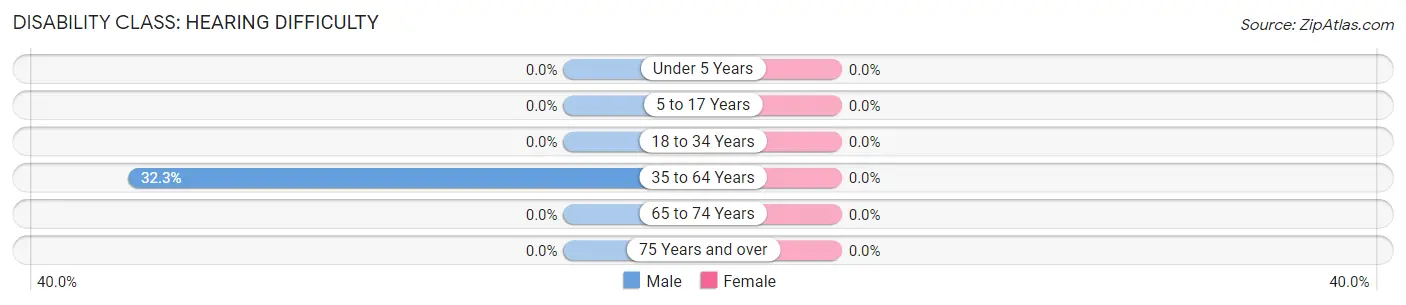
| Age Bracket | Male | Female |
| Under 5 Years | 0 (0.0%) | 0 (0.0%) |
| 5 to 17 Years | 0 (0.0%) | 0 (0.0%) |
| 18 to 34 Years | 0 (0.0%) | 0 (0.0%) |
| 35 to 64 Years | 21 (32.3%) | 0 (0.0%) |
| 65 to 74 Years | 0 (0.0%) | 0 (0.0%) |
| 75 Years and over | 0 (0.0%) | 0 (0.0%) |
Disability Class: Vision Difficulty
| Age Bracket | Male | Female |
| Under 5 Years | 0 (0.0%) | 0 (0.0%) |
| 5 to 17 Years | 0 (0.0%) | 0 (0.0%) |
| 18 to 34 Years | 0 (0.0%) | 0 (0.0%) |
| 35 to 64 Years | 0 (0.0%) | 0 (0.0%) |
| 65 to 74 Years | 0 (0.0%) | 0 (0.0%) |
| 75 Years and over | 0 (0.0%) | 0 (0.0%) |
Disability Class: Cognitive Difficulty
| Age Bracket | Male | Female |
| 5 to 17 Years | 0 (0.0%) | 0 (0.0%) |
| 18 to 34 Years | 0 (0.0%) | 0 (0.0%) |
| 35 to 64 Years | 0 (0.0%) | 0 (0.0%) |
| 65 to 74 Years | 0 (0.0%) | 0 (0.0%) |
| 75 Years and over | 0 (0.0%) | 0 (0.0%) |
Disability Class: Ambulatory Difficulty
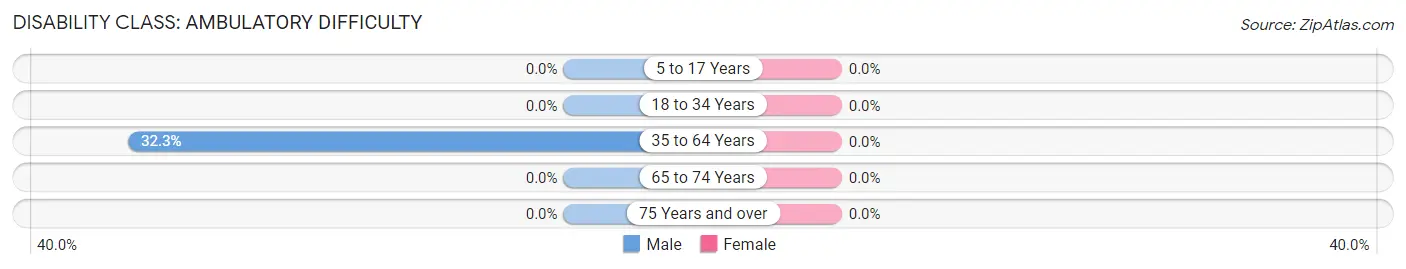
| Age Bracket | Male | Female |
| 5 to 17 Years | 0 (0.0%) | 0 (0.0%) |
| 18 to 34 Years | 0 (0.0%) | 0 (0.0%) |
| 35 to 64 Years | 21 (32.3%) | 0 (0.0%) |
| 65 to 74 Years | 0 (0.0%) | 0 (0.0%) |
| 75 Years and over | 0 (0.0%) | 0 (0.0%) |
Disability Class: Self-Care Difficulty
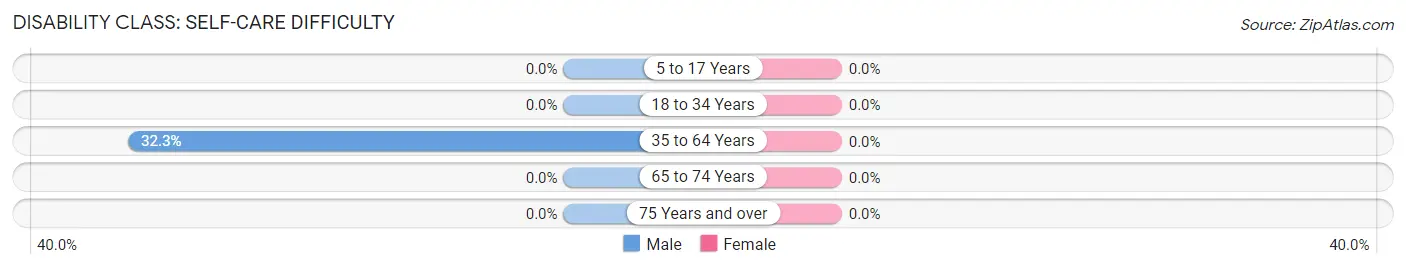
| Age Bracket | Male | Female |
| 5 to 17 Years | 0 (0.0%) | 0 (0.0%) |
| 18 to 34 Years | 0 (0.0%) | 0 (0.0%) |
| 35 to 64 Years | 21 (32.3%) | 0 (0.0%) |
| 65 to 74 Years | 0 (0.0%) | 0 (0.0%) |
| 75 Years and over | 0 (0.0%) | 0 (0.0%) |
Technology Access in Capulin
Computing Device Access in Capulin
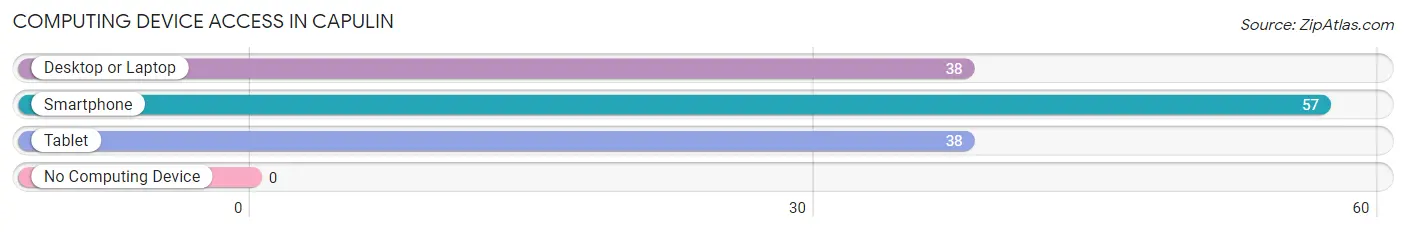
| Device Type | # Households | % Households |
| Desktop or Laptop | 38 | 66.7% |
| Smartphone | 57 | 100.0% |
| Tablet | 38 | 66.7% |
| No Computing Device | 0 | 0.0% |
| Total | 57 | 100.0% |
Internet Access in Capulin
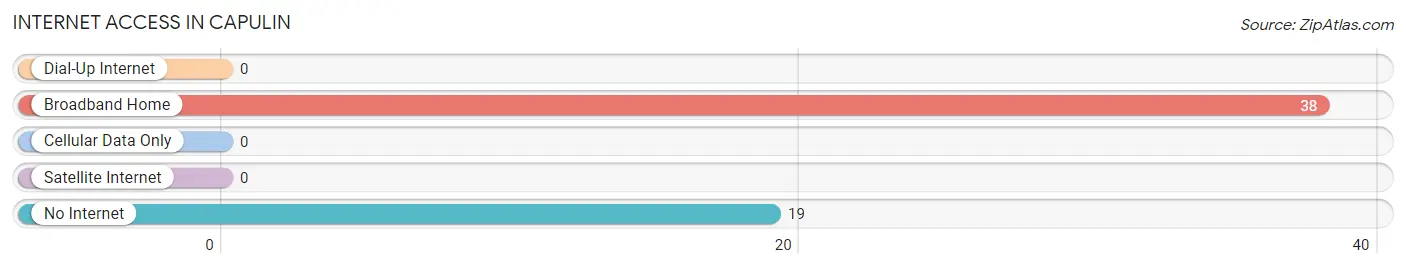
| Internet Type | # Households | % Households |
| Dial-Up Internet | 0 | 0.0% |
| Broadband Home | 38 | 66.7% |
| Cellular Data Only | 0 | 0.0% |
| Satellite Internet | 0 | 0.0% |
| No Internet | 19 | 33.3% |
| Total | 57 | 100.0% |
Capulin Summary
Capulin, Colorado is a small town located in the San Luis Valley in the south-central part of the state. It is situated at an elevation of 7,890 feet and is surrounded by the Sangre de Cristo Mountains. The town was founded in 1881 and was named after the nearby Capulin Volcano, which is a dormant cinder cone volcano. The town has a population of approximately 200 people and is known for its rural atmosphere and its proximity to the volcano.
Geography
Capulin is located in the San Luis Valley, which is a large intermontane basin located in south-central Colorado. The valley is surrounded by the Sangre de Cristo Mountains to the east and the San Juan Mountains to the west. The valley is approximately 8,000 feet above sea level and is the largest alpine valley in the United States. The valley is home to several small towns, including Capulin.
The town of Capulin is situated at an elevation of 7,890 feet and is located approximately 10 miles south of the town of Alamosa. The town is located on the western side of the valley and is surrounded by the Sangre de Cristo Mountains. The town is located near the Capulin Volcano National Monument, which is a dormant cinder cone volcano that is approximately 8,182 feet in elevation.
Economy
The economy of Capulin is largely based on agriculture and tourism. The town is home to several small farms that produce a variety of crops, including potatoes, alfalfa, and hay. The town is also home to several small businesses, including a grocery store, a gas station, and a few restaurants.
The town is also a popular tourist destination due to its proximity to the Capulin Volcano National Monument. The monument is a popular destination for hikers, campers, and nature lovers. The town also hosts several festivals throughout the year, including the Capulin Volcano Festival, which is held in August.
Demographics
As of the 2010 census, the town of Capulin had a population of 200 people. The population is predominantly Hispanic, with approximately 95% of the population identifying as Hispanic or Latino. The median age of the population is 37 years old, and the median household income is $30,000.
The town is served by the Capulin-Raton School District, which consists of one elementary school and one high school. The town is also home to a branch of the San Luis Valley Regional Library District, which provides library services to the residents of the town.
Conclusion
Capulin, Colorado is a small town located in the San Luis Valley in the south-central part of the state. The town was founded in 1881 and is known for its rural atmosphere and its proximity to the nearby Capulin Volcano. The town has a population of approximately 200 people and is largely supported by agriculture and tourism. The town is predominantly Hispanic, with approximately 95% of the population identifying as Hispanic or Latino. The town is served by the Capulin-Raton School District and is home to a branch of the San Luis Valley Regional Library District.
Common Questions
What is Per Capita Income in Capulin?
Per Capita income in Capulin is $9,500.
What is the Median Household income in Capulin?
Median Household Income in Capulin is $81,131.
What is Inequality or Gini Index in Capulin?
Inequality or Gini Index in Capulin is 0.36.
What is the Total Population of Capulin?
Total Population of Capulin is 301.
What is the Total Male Population of Capulin?
Total Male Population of Capulin is 157.
What is the Total Female Population of Capulin?
Total Female Population of Capulin is 144.
What is the Ratio of Males per 100 Females in Capulin?
There are 109.03 Males per 100 Females in Capulin.
What is the Ratio of Females per 100 Males in Capulin?
There are 91.72 Females per 100 Males in Capulin.
What is the Median Population Age in Capulin?
Median Population Age in Capulin is 31.8 Years.
What is the Average Family Size in Capulin
Average Family Size in Capulin is 6.7 People.
What is the Average Household Size in Capulin
Average Household Size in Capulin is 5.2 People.
How Large is the Labor Force in Capulin?
There are 90 People in the Labor Forcein in Capulin.
What is the Percentage of People in the Labor Force in Capulin?
50.6% of People are in the Labor Force in Capulin.
What is the Unemployment Rate in Capulin?
Unemployment Rate in Capulin is 54.4%.