Canon City, CO Map & Demographics
Canon City Overview
$27,824
PER CAPITA INCOME
$76,270
AVG FAMILY INCOME
$54,308
AVG HOUSEHOLD INCOME
39.4%
WAGE / INCOME GAP [ % ]
60.6¢/ $1
WAGE / INCOME GAP [ $ ]
0.43
INEQUALITY / GINI INDEX
17,059
TOTAL POPULATION
8,725
MALE POPULATION
8,334
FEMALE POPULATION
104.69
MALES / 100 FEMALES
95.52
FEMALES / 100 MALES
44.8
MEDIAN AGE
3.0
AVG FAMILY SIZE
2.2
AVG HOUSEHOLD SIZE
6,880
LABOR FORCE [ PEOPLE ]
49.4%
PERCENT IN LABOR FORCE
4.8%
UNEMPLOYMENT RATE
Canon City Zip Codes
Canon City Area Codes
Income in Canon City
Income Overview in Canon City
Per Capita Income in Canon City is $27,824, while median incomes of families and households are $76,270 and $54,308 respectively.
| Characteristic | Number | Measure |
| Per Capita Income | 17,059 | $27,824 |
| Median Family Income | 4,010 | $76,270 |
| Mean Family Income | 4,010 | $80,778 |
| Median Household Income | 7,176 | $54,308 |
| Mean Household Income | 7,176 | $64,048 |
| Income Deficit | 4,010 | $0 |
| Wage / Income Gap (%) | 17,059 | 39.37% |
| Wage / Income Gap ($) | 17,059 | 60.63¢ per $1 |
| Gini / Inequality Index | 17,059 | 0.43 |
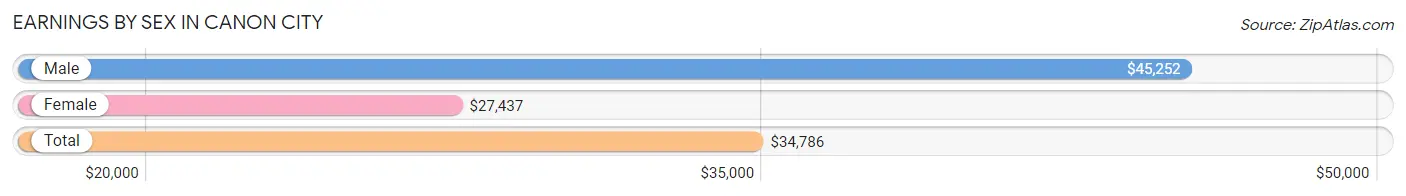
Earnings by Sex in Canon City
Average Earnings in Canon City are $34,786, $45,252 for men and $27,437 for women, a difference of 39.4%.
| Sex | Number | Average Earnings |
| Male | 3,810 (53.1%) | $45,252 |
| Female | 3,359 (46.9%) | $27,437 |
| Total | 7,169 (100.0%) | $34,786 |
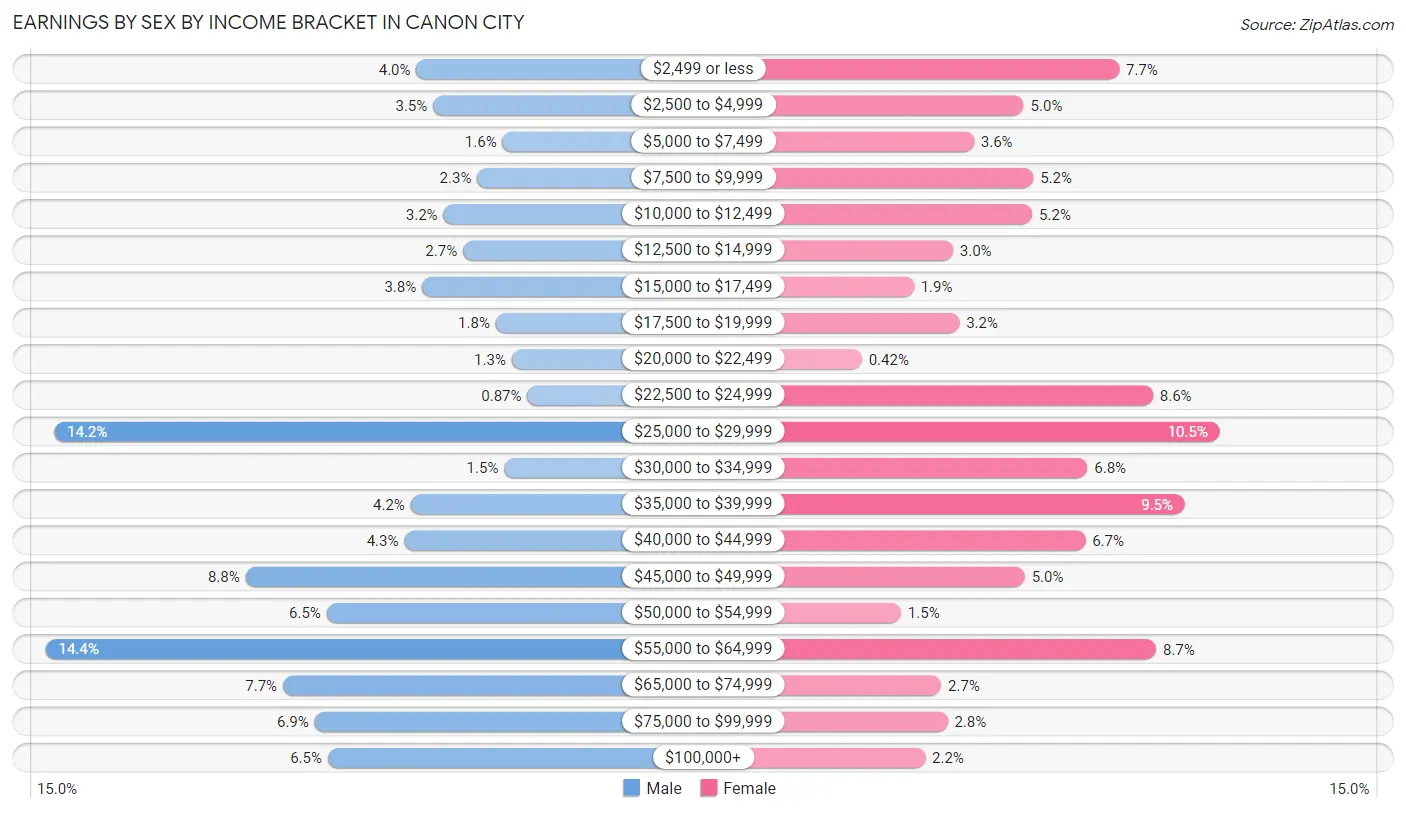
Earnings by Sex by Income Bracket in Canon City
The most common earnings brackets in Canon City are $55,000 to $64,999 for men (549 | 14.4%) and $25,000 to $29,999 for women (352 | 10.5%).
| Income | Male | Female |
| $2,499 or less | 152 (4.0%) | 257 (7.6%) |
| $2,500 to $4,999 | 134 (3.5%) | 167 (5.0%) |
| $5,000 to $7,499 | 60 (1.6%) | 120 (3.6%) |
| $7,500 to $9,999 | 87 (2.3%) | 176 (5.2%) |
| $10,000 to $12,499 | 123 (3.2%) | 175 (5.2%) |
| $12,500 to $14,999 | 102 (2.7%) | 100 (3.0%) |
| $15,000 to $17,499 | 146 (3.8%) | 63 (1.9%) |
| $17,500 to $19,999 | 67 (1.8%) | 106 (3.2%) |
| $20,000 to $22,499 | 50 (1.3%) | 14 (0.4%) |
| $22,500 to $24,999 | 33 (0.9%) | 289 (8.6%) |
| $25,000 to $29,999 | 540 (14.2%) | 352 (10.5%) |
| $30,000 to $34,999 | 58 (1.5%) | 227 (6.8%) |
| $35,000 to $39,999 | 158 (4.2%) | 319 (9.5%) |
| $40,000 to $44,999 | 165 (4.3%) | 225 (6.7%) |
| $45,000 to $49,999 | 335 (8.8%) | 168 (5.0%) |
| $50,000 to $54,999 | 248 (6.5%) | 51 (1.5%) |
| $55,000 to $64,999 | 549 (14.4%) | 292 (8.7%) |
| $65,000 to $74,999 | 295 (7.7%) | 89 (2.6%) |
| $75,000 to $99,999 | 261 (6.9%) | 95 (2.8%) |
| $100,000+ | 247 (6.5%) | 74 (2.2%) |
| Total | 3,810 (100.0%) | 3,359 (100.0%) |
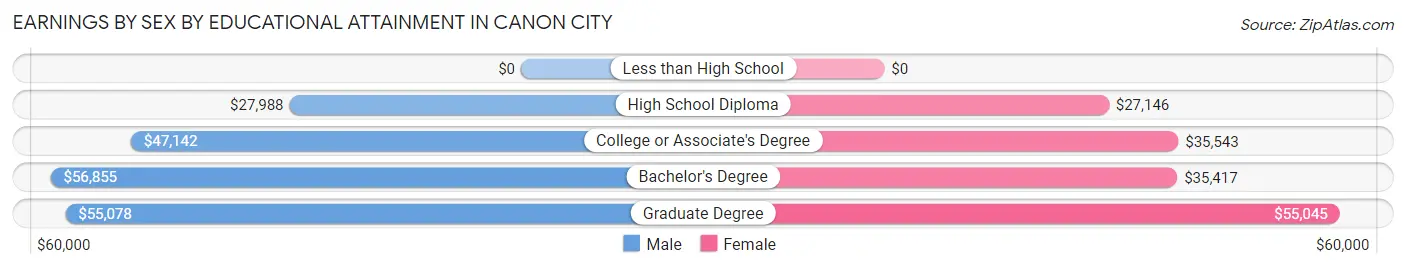
Earnings by Sex by Educational Attainment in Canon City
Average earnings in Canon City are $46,951 for men and $32,076 for women, a difference of 31.7%. Men with an educational attainment of bachelor's degree enjoy the highest average annual earnings of $56,855, while those with high school diploma education earn the least with $27,988. Women with an educational attainment of graduate degree earn the most with the average annual earnings of $55,045, while those with high school diploma education have the smallest earnings of $27,146.
| Educational Attainment | Male Income | Female Income |
| Less than High School | - | - |
| High School Diploma | $27,988 | $27,146 |
| College or Associate's Degree | $47,142 | $35,543 |
| Bachelor's Degree | $56,855 | $35,417 |
| Graduate Degree | $55,078 | $55,045 |
| Total | $46,951 | $32,076 |
Family Income in Canon City
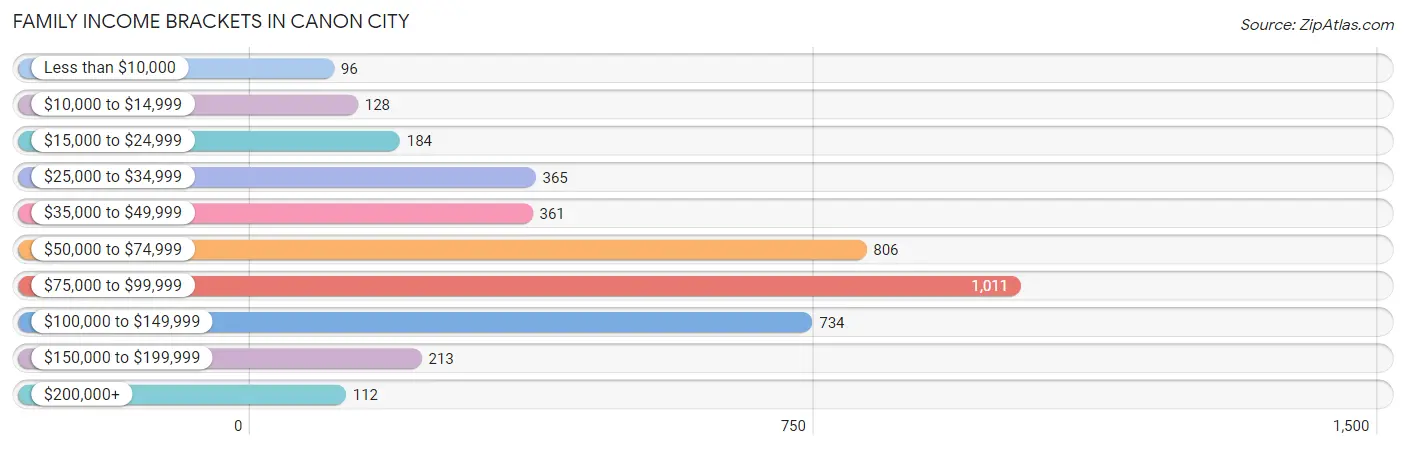
Family Income Brackets in Canon City
According to the Canon City family income data, there are 1,011 families falling into the $75,000 to $99,999 income range, which is the most common income bracket and makes up 25.2% of all families. Conversely, the less than $10,000 income bracket is the least frequent group with only 96 families (2.4%) belonging to this category.
| Income Bracket | # Families | % Families |
| Less than $10,000 | 96 | 2.4% |
| $10,000 to $14,999 | 128 | 3.2% |
| $15,000 to $24,999 | 184 | 4.6% |
| $25,000 to $34,999 | 365 | 9.1% |
| $35,000 to $49,999 | 361 | 9.0% |
| $50,000 to $74,999 | 806 | 20.1% |
| $75,000 to $99,999 | 1,011 | 25.2% |
| $100,000 to $149,999 | 734 | 18.3% |
| $150,000 to $199,999 | 213 | 5.3% |
| $200,000+ | 112 | 2.8% |
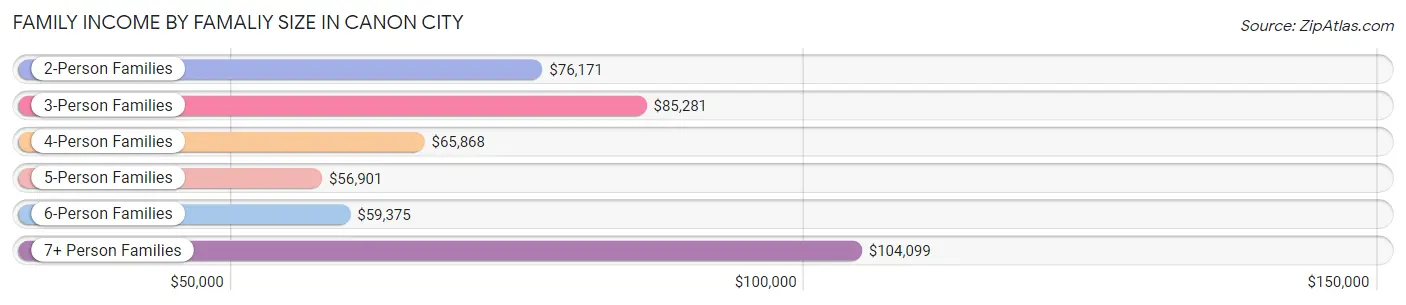
Family Income by Famaliy Size in Canon City
7+ person families (132 | 3.3%) account for the highest median family income in Canon City with $104,099 per family, while 2-person families (2,256 | 56.3%) have the highest median income of $38,086 per family member.
| Income Bracket | # Families | Median Income |
| 2-Person Families | 2,256 (56.3%) | $76,171 |
| 3-Person Families | 956 (23.8%) | $85,281 |
| 4-Person Families | 325 (8.1%) | $65,868 |
| 5-Person Families | 253 (6.3%) | $56,901 |
| 6-Person Families | 88 (2.2%) | $59,375 |
| 7+ Person Families | 132 (3.3%) | $104,099 |
| Total | 4,010 (100.0%) | $76,270 |
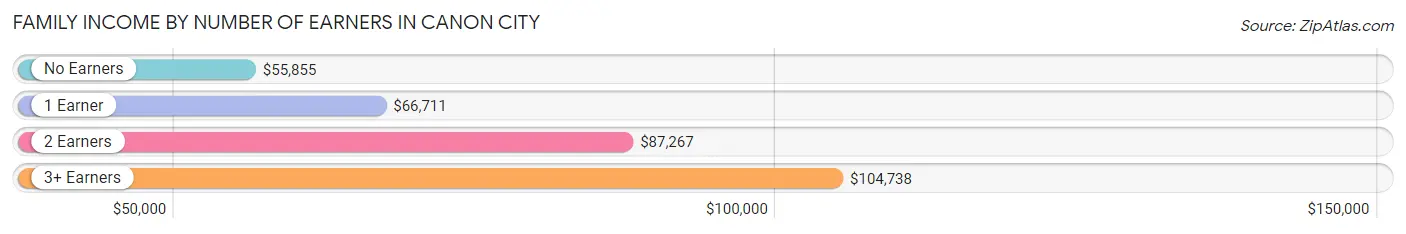
Family Income by Number of Earners in Canon City
The median family income in Canon City is $76,270, with families comprising 3+ earners (357) having the highest median family income of $104,738, while families with no earners (1,034) have the lowest median family income of $55,855, accounting for 8.9% and 25.8% of families, respectively.
| Number of Earners | # Families | Median Income |
| No Earners | 1,034 (25.8%) | $55,855 |
| 1 Earner | 1,350 (33.7%) | $66,711 |
| 2 Earners | 1,269 (31.7%) | $87,267 |
| 3+ Earners | 357 (8.9%) | $104,738 |
| Total | 4,010 (100.0%) | $76,270 |
Household Income in Canon City
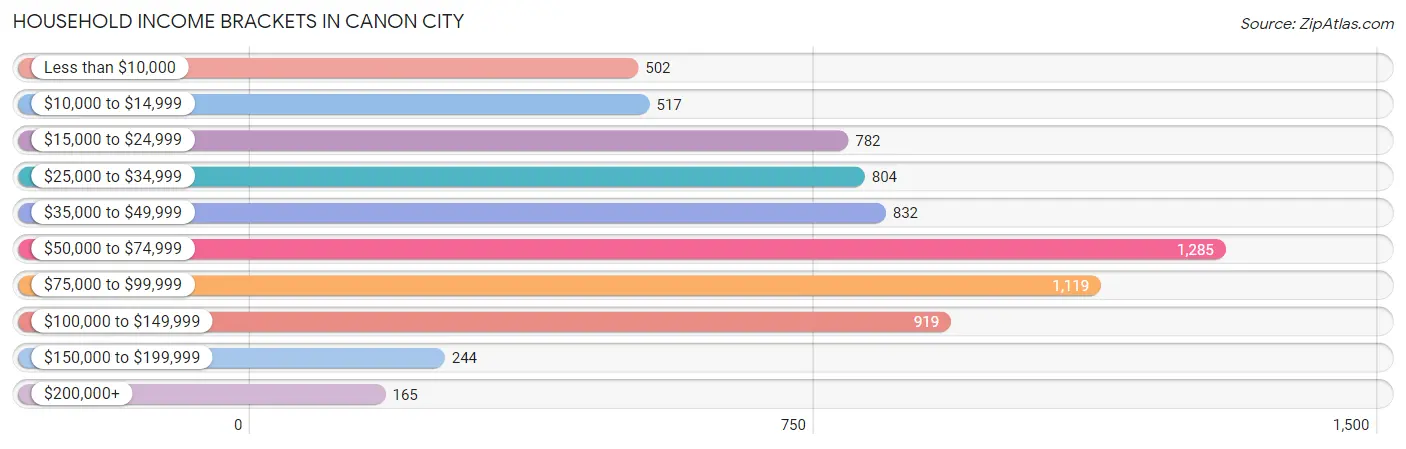
Household Income Brackets in Canon City
With 1,285 households falling in the category, the $50,000 to $74,999 income range is the most frequent in Canon City, accounting for 17.9% of all households. In contrast, only 165 households (2.3%) fall into the $200,000+ income bracket, making it the least populous group.
| Income Bracket | # Households | % Households |
| Less than $10,000 | 502 | 7.0% |
| $10,000 to $14,999 | 517 | 7.2% |
| $15,000 to $24,999 | 782 | 10.9% |
| $25,000 to $34,999 | 804 | 11.2% |
| $35,000 to $49,999 | 832 | 11.6% |
| $50,000 to $74,999 | 1,285 | 17.9% |
| $75,000 to $99,999 | 1,119 | 15.6% |
| $100,000 to $149,999 | 919 | 12.8% |
| $150,000 to $199,999 | 244 | 3.4% |
| $200,000+ | 165 | 2.3% |
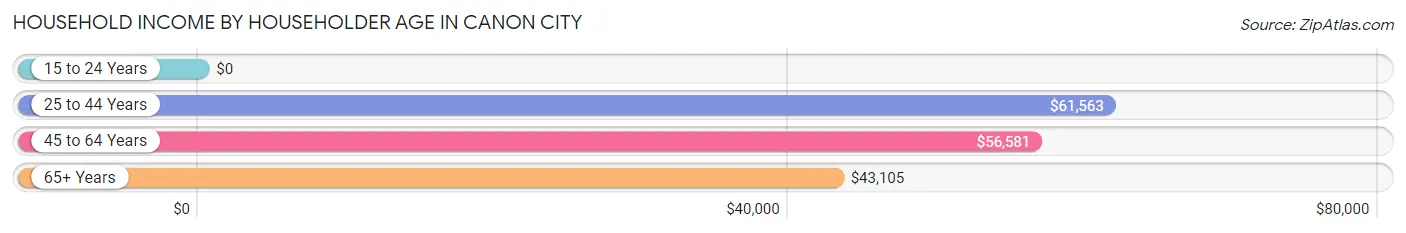
Household Income by Householder Age in Canon City
The median household income in Canon City is $54,308, with the highest median household income of $61,563 found in the 25 to 44 years age bracket for the primary householder. A total of 1,554 households (21.7%) fall into this category. Meanwhile, the 15 to 24 years age bracket for the primary householder has the lowest median household income of $0, with 370 households (5.2%) in this group.
| Income Bracket | # Households | Median Income |
| 15 to 24 Years | 370 (5.2%) | $0 |
| 25 to 44 Years | 1,554 (21.7%) | $61,563 |
| 45 to 64 Years | 2,709 (37.8%) | $56,581 |
| 65+ Years | 2,543 (35.4%) | $43,105 |
| Total | 7,176 (100.0%) | $54,308 |
Poverty in Canon City
Income Below Poverty by Sex and Age in Canon City
With 12.7% poverty level for males and 18.8% for females among the residents of Canon City, 18 to 24 year old males and 5 year old females are the most vulnerable to poverty, with 184 males (33.7%) and 62 females (92.5%) in their respective age groups living below the poverty level.
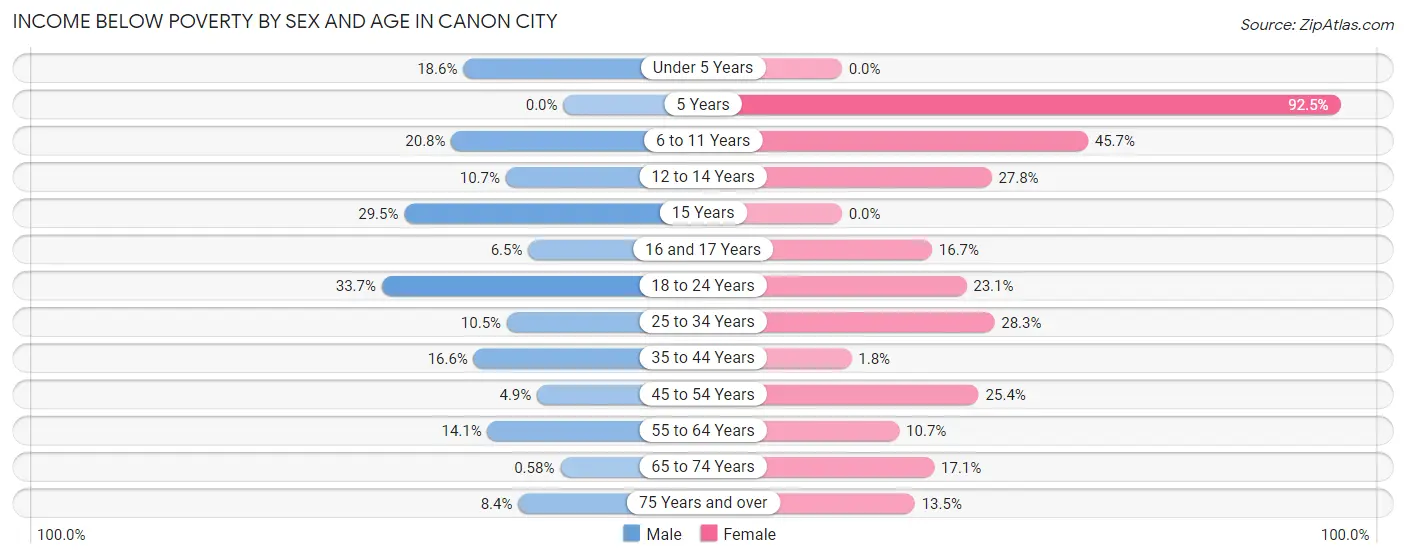
| Age Bracket | Male | Female |
| Under 5 Years | 118 (18.6%) | 0 (0.0%) |
| 5 Years | 0 (0.0%) | 62 (92.5%) |
| 6 to 11 Years | 126 (20.8%) | 258 (45.7%) |
| 12 to 14 Years | 36 (10.7%) | 80 (27.8%) |
| 15 Years | 49 (29.5%) | 0 (0.0%) |
| 16 and 17 Years | 14 (6.5%) | 49 (16.7%) |
| 18 to 24 Years | 184 (33.7%) | 101 (23.1%) |
| 25 to 34 Years | 133 (10.5%) | 234 (28.3%) |
| 35 to 44 Years | 113 (16.6%) | 13 (1.8%) |
| 45 to 54 Years | 50 (4.9%) | 223 (25.4%) |
| 55 to 64 Years | 114 (14.1%) | 153 (10.6%) |
| 65 to 74 Years | 5 (0.6%) | 193 (17.1%) |
| 75 Years and over | 60 (8.4%) | 150 (13.5%) |
| Total | 1,002 (12.7%) | 1,516 (18.8%) |
Income Above Poverty by Sex and Age in Canon City
According to the poverty statistics in Canon City, males aged 5 years and females aged under 5 years are the age groups that are most secure financially, with 100.0% of males and 100.0% of females in these age groups living above the poverty line.
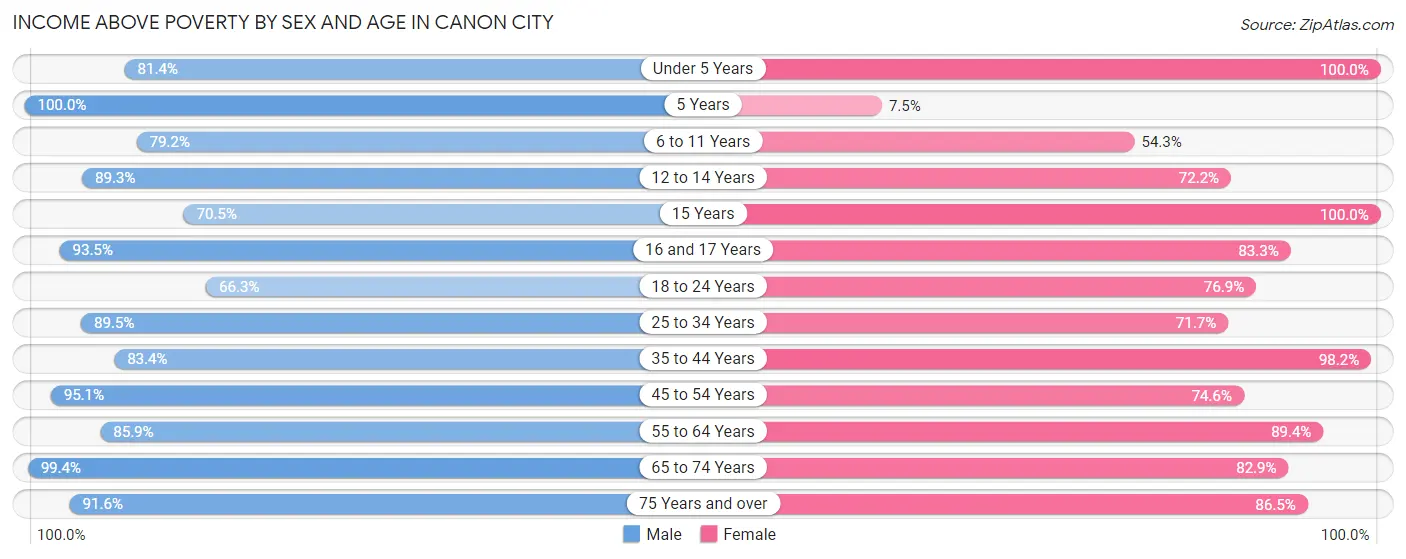
| Age Bracket | Male | Female |
| Under 5 Years | 517 (81.4%) | 292 (100.0%) |
| 5 Years | 51 (100.0%) | 5 (7.5%) |
| 6 to 11 Years | 480 (79.2%) | 307 (54.3%) |
| 12 to 14 Years | 301 (89.3%) | 208 (72.2%) |
| 15 Years | 117 (70.5%) | 6 (100.0%) |
| 16 and 17 Years | 201 (93.5%) | 244 (83.3%) |
| 18 to 24 Years | 362 (66.3%) | 336 (76.9%) |
| 25 to 34 Years | 1,136 (89.5%) | 593 (71.7%) |
| 35 to 44 Years | 566 (83.4%) | 718 (98.2%) |
| 45 to 54 Years | 977 (95.1%) | 655 (74.6%) |
| 55 to 64 Years | 696 (85.9%) | 1,284 (89.3%) |
| 65 to 74 Years | 854 (99.4%) | 934 (82.9%) |
| 75 Years and over | 657 (91.6%) | 958 (86.5%) |
| Total | 6,915 (87.3%) | 6,540 (81.2%) |
Income Below Poverty Among Married-Couple Families in Canon City
The poverty statistics for married-couple families in Canon City show that 3.7% or 111 of the total 2,968 families live below the poverty line. Families with 5 or more children have the highest poverty rate of 8.3%, comprising of 11 families. On the other hand, families with no children have the lowest poverty rate of 2.5%, which includes 53 families.
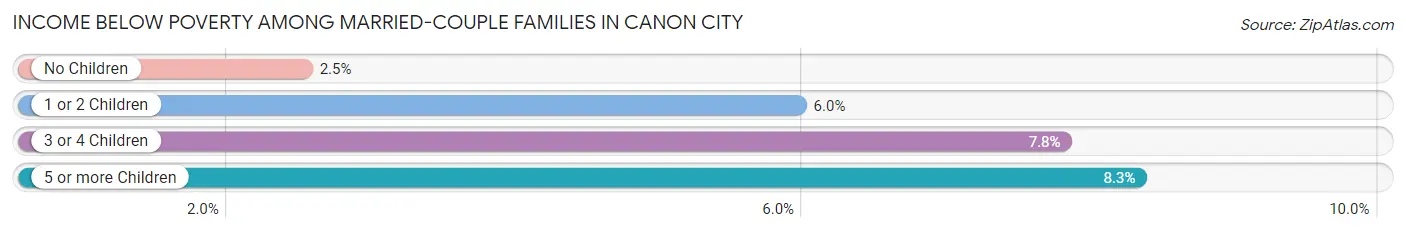
| Children | Above Poverty | Below Poverty |
| No Children | 2,054 (97.5%) | 53 (2.5%) |
| 1 or 2 Children | 505 (94.0%) | 32 (6.0%) |
| 3 or 4 Children | 177 (92.2%) | 15 (7.8%) |
| 5 or more Children | 121 (91.7%) | 11 (8.3%) |
| Total | 2,857 (96.3%) | 111 (3.7%) |
Income Below Poverty Among Single-Parent Households in Canon City
According to the poverty data in Canon City, 9.2% or 35 single-father households and 33.6% or 222 single-mother households are living below the poverty line. Among single-father households, those with 1 or 2 children have the highest poverty rate, with 35 households (14.4%) experiencing poverty. Likewise, among single-mother households, those with 3 or 4 children have the highest poverty rate, with 45 households (66.2%) falling below the poverty line.
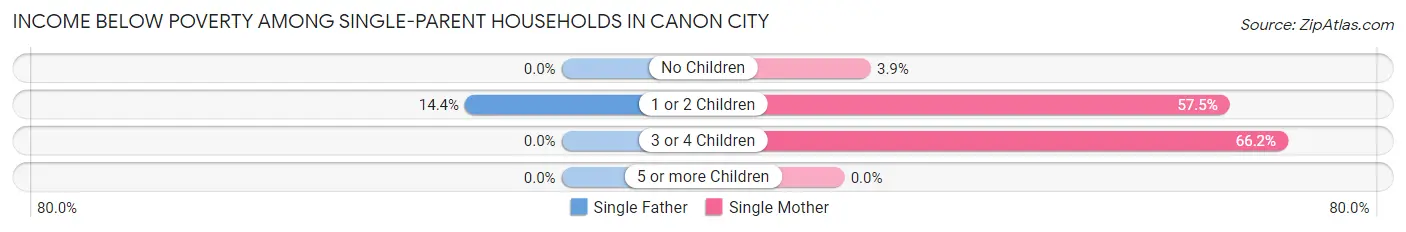
| Children | Single Father | Single Mother |
| No Children | 0 (0.0%) | 12 (3.9%) |
| 1 or 2 Children | 35 (14.4%) | 165 (57.5%) |
| 3 or 4 Children | 0 (0.0%) | 45 (66.2%) |
| 5 or more Children | 0 (0.0%) | 0 (0.0%) |
| Total | 35 (9.2%) | 222 (33.6%) |
Income Below Poverty Among Married-Couple vs Single-Parent Households in Canon City
The poverty data for Canon City shows that 111 of the married-couple family households (3.7%) and 257 of the single-parent households (24.7%) are living below the poverty level. Within the married-couple family households, those with 5 or more children have the highest poverty rate, with 11 households (8.3%) falling below the poverty line. Among the single-parent households, those with 3 or 4 children have the highest poverty rate, with 45 household (48.9%) living below poverty.
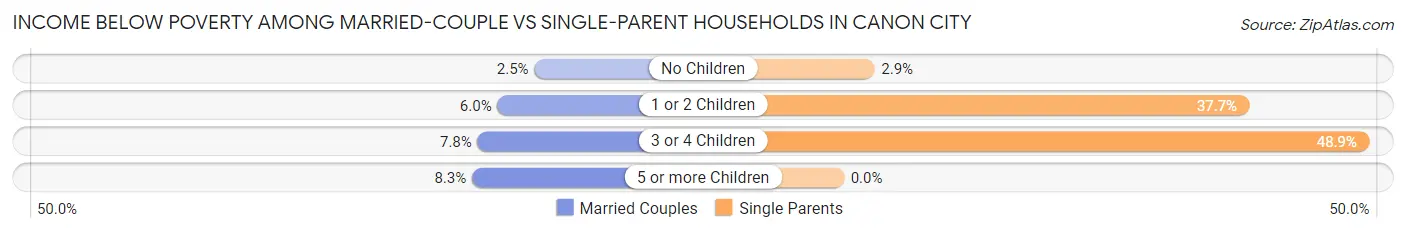
| Children | Married-Couple Families | Single-Parent Households |
| No Children | 53 (2.5%) | 12 (2.9%) |
| 1 or 2 Children | 32 (6.0%) | 200 (37.7%) |
| 3 or 4 Children | 15 (7.8%) | 45 (48.9%) |
| 5 or more Children | 11 (8.3%) | 0 (0.0%) |
| Total | 111 (3.7%) | 257 (24.7%) |
Race in Canon City
The most populous races in Canon City are White / Caucasian (15,589 | 91.4%), Hispanic or Latino (2,127 | 12.5%), and Two or more Races (704 | 4.1%).
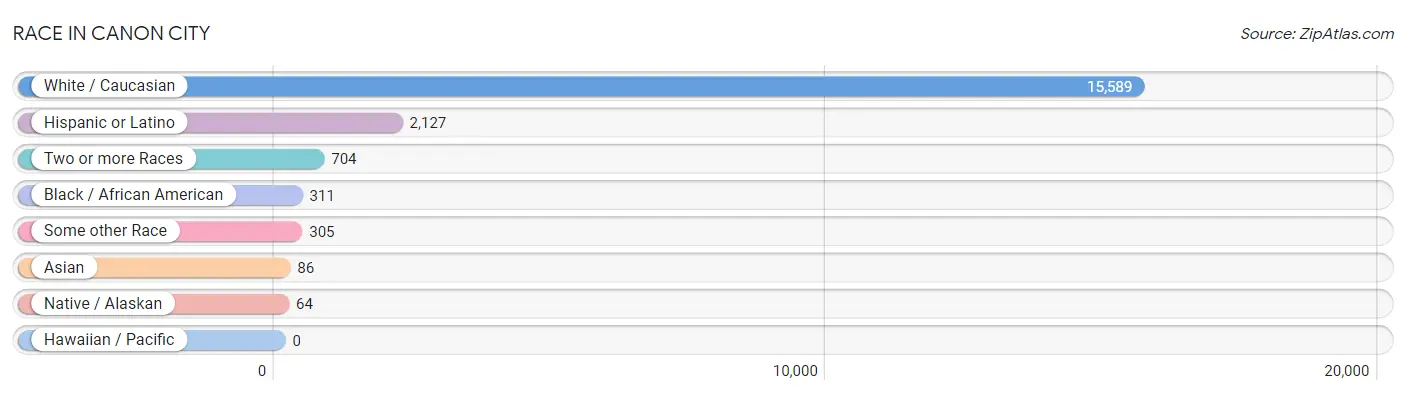
| Race | # Population | % Population |
| Asian | 86 | 0.5% |
| Black / African American | 311 | 1.8% |
| Hawaiian / Pacific | 0 | 0.0% |
| Hispanic or Latino | 2,127 | 12.5% |
| Native / Alaskan | 64 | 0.4% |
| White / Caucasian | 15,589 | 91.4% |
| Two or more Races | 704 | 4.1% |
| Some other Race | 305 | 1.8% |
| Total | 17,059 | 100.0% |
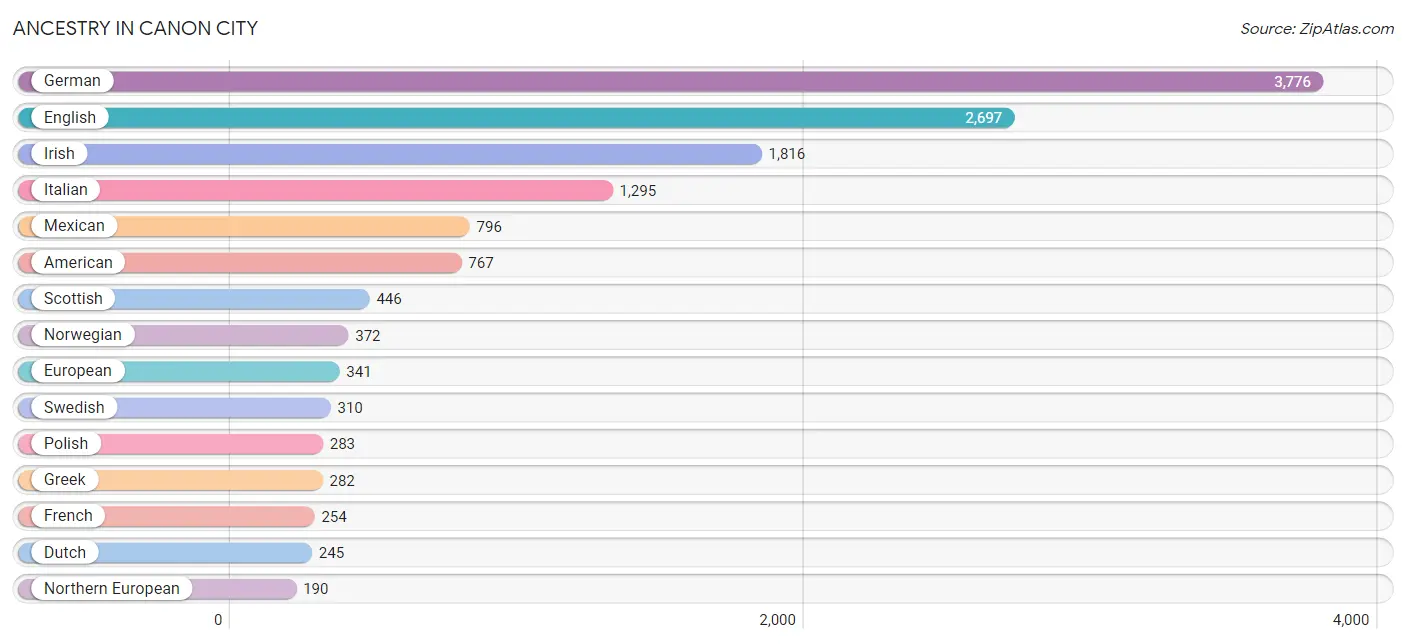
Ancestry in Canon City
The most populous ancestries reported in Canon City are German (3,776 | 22.1%), English (2,697 | 15.8%), Irish (1,816 | 10.6%), Italian (1,295 | 7.6%), and Mexican (796 | 4.7%), together accounting for 60.8% of all Canon City residents.
| Ancestry | # Population | % Population |
| American | 767 | 4.5% |
| Arab | 58 | 0.3% |
| Armenian | 14 | 0.1% |
| Austrian | 12 | 0.1% |
| Bhutanese | 40 | 0.2% |
| British | 76 | 0.4% |
| Burmese | 45 | 0.3% |
| Celtic | 4 | 0.0% |
| Cherokee | 68 | 0.4% |
| Chilean | 29 | 0.2% |
| Choctaw | 6 | 0.0% |
| Comanche | 31 | 0.2% |
| Creek | 1 | 0.0% |
| Croatian | 11 | 0.1% |
| Czech | 57 | 0.3% |
| Danish | 52 | 0.3% |
| Dutch | 245 | 1.4% |
| Dutch West Indian | 29 | 0.2% |
| Eastern European | 44 | 0.3% |
| English | 2,697 | 15.8% |
| European | 341 | 2.0% |
| Finnish | 15 | 0.1% |
| French | 254 | 1.5% |
| French Canadian | 62 | 0.4% |
| German | 3,776 | 22.1% |
| Greek | 282 | 1.7% |
| Hungarian | 9 | 0.1% |
| Icelander | 117 | 0.7% |
| Indian (Asian) | 141 | 0.8% |
| Irish | 1,816 | 10.6% |
| Italian | 1,295 | 7.6% |
| Lebanese | 8 | 0.1% |
| Lithuanian | 3 | 0.0% |
| Mexican | 796 | 4.7% |
| Northern European | 190 | 1.1% |
| Norwegian | 372 | 2.2% |
| Polish | 283 | 1.7% |
| Portuguese | 6 | 0.0% |
| Puerto Rican | 179 | 1.1% |
| Russian | 87 | 0.5% |
| Scandinavian | 156 | 0.9% |
| Scotch-Irish | 168 | 1.0% |
| Scottish | 446 | 2.6% |
| Sioux | 18 | 0.1% |
| Slavic | 45 | 0.3% |
| Slovak | 40 | 0.2% |
| Slovene | 48 | 0.3% |
| South American | 29 | 0.2% |
| Spaniard | 95 | 0.6% |
| Spanish | 167 | 1.0% |
| Spanish American | 100 | 0.6% |
| Swedish | 310 | 1.8% |
| Swiss | 54 | 0.3% |
| Syrian | 47 | 0.3% |
| Tlingit-Haida | 68 | 0.4% |
| Turkish | 29 | 0.2% |
| Ukrainian | 27 | 0.2% |
| Welsh | 145 | 0.9% |
| Yugoslavian | 19 | 0.1% | View All 59 Rows |
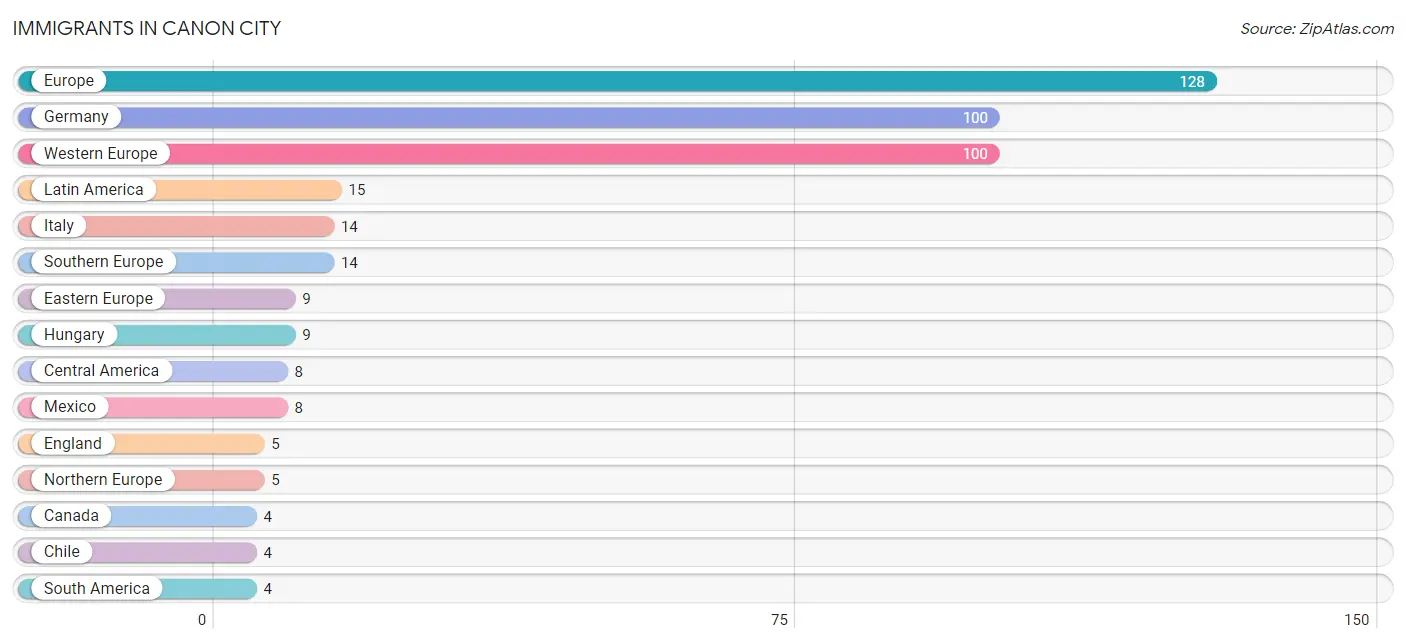
Immigrants in Canon City
The most numerous immigrant groups reported in Canon City came from Europe (128 | 0.7%), Germany (100 | 0.6%), Western Europe (100 | 0.6%), Latin America (15 | 0.1%), and Italy (14 | 0.1%), together accounting for 2.1% of all Canon City residents.
| Immigration Origin | # Population | % Population |
| Asia | 3 | 0.0% |
| Canada | 4 | 0.0% |
| Caribbean | 3 | 0.0% |
| Central America | 8 | 0.1% |
| Chile | 4 | 0.0% |
| Cuba | 3 | 0.0% |
| Eastern Europe | 9 | 0.1% |
| England | 5 | 0.0% |
| Europe | 128 | 0.7% |
| Germany | 100 | 0.6% |
| Hungary | 9 | 0.1% |
| Italy | 14 | 0.1% |
| Latin America | 15 | 0.1% |
| Mexico | 8 | 0.1% |
| Northern Europe | 5 | 0.0% |
| South America | 4 | 0.0% |
| Southern Europe | 14 | 0.1% |
| Western Asia | 3 | 0.0% |
| Western Europe | 100 | 0.6% |
| Yemen | 3 | 0.0% | View All 20 Rows |
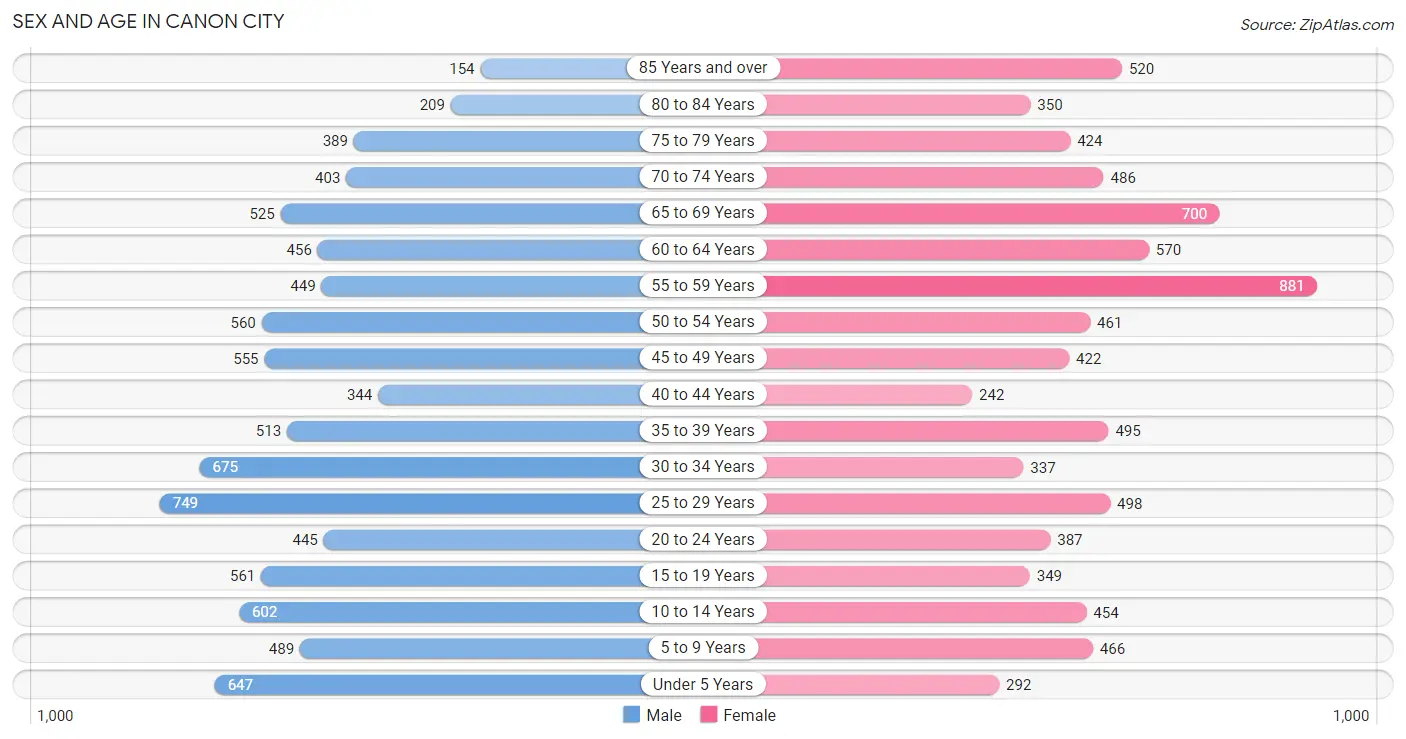
Sex and Age in Canon City
Sex and Age in Canon City
The most populous age groups in Canon City are 25 to 29 Years (749 | 8.6%) for men and 55 to 59 Years (881 | 10.6%) for women.
| Age Bracket | Male | Female |
| Under 5 Years | 647 (7.4%) | 292 (3.5%) |
| 5 to 9 Years | 489 (5.6%) | 466 (5.6%) |
| 10 to 14 Years | 602 (6.9%) | 454 (5.4%) |
| 15 to 19 Years | 561 (6.4%) | 349 (4.2%) |
| 20 to 24 Years | 445 (5.1%) | 387 (4.6%) |
| 25 to 29 Years | 749 (8.6%) | 498 (6.0%) |
| 30 to 34 Years | 675 (7.7%) | 337 (4.0%) |
| 35 to 39 Years | 513 (5.9%) | 495 (5.9%) |
| 40 to 44 Years | 344 (3.9%) | 242 (2.9%) |
| 45 to 49 Years | 555 (6.4%) | 422 (5.1%) |
| 50 to 54 Years | 560 (6.4%) | 461 (5.5%) |
| 55 to 59 Years | 449 (5.1%) | 881 (10.6%) |
| 60 to 64 Years | 456 (5.2%) | 570 (6.8%) |
| 65 to 69 Years | 525 (6.0%) | 700 (8.4%) |
| 70 to 74 Years | 403 (4.6%) | 486 (5.8%) |
| 75 to 79 Years | 389 (4.5%) | 424 (5.1%) |
| 80 to 84 Years | 209 (2.4%) | 350 (4.2%) |
| 85 Years and over | 154 (1.8%) | 520 (6.2%) |
| Total | 8,725 (100.0%) | 8,334 (100.0%) |
Families and Households in Canon City
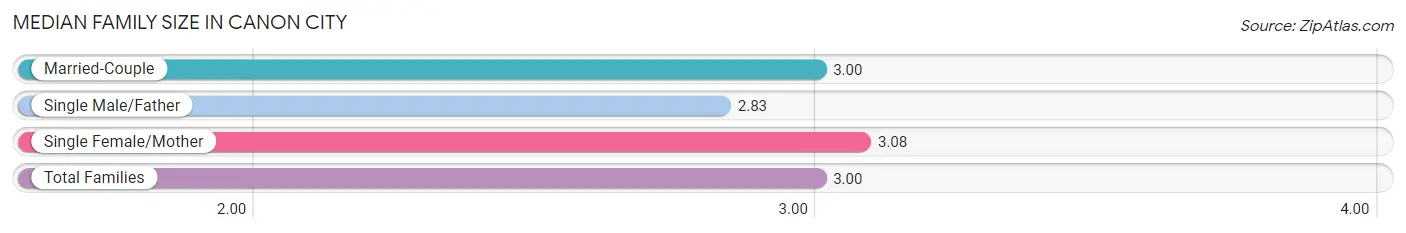
Median Family Size in Canon City
The median family size in Canon City is 3.00 persons per family, with single female/mother families (660 | 16.5%) accounting for the largest median family size of 3.08 persons per family. On the other hand, single male/father families (382 | 9.5%) represent the smallest median family size with 2.83 persons per family.
| Family Type | # Families | Family Size |
| Married-Couple | 2,968 (74.0%) | 3.00 |
| Single Male/Father | 382 (9.5%) | 2.83 |
| Single Female/Mother | 660 (16.5%) | 3.08 |
| Total Families | 4,010 (100.0%) | 3.00 |
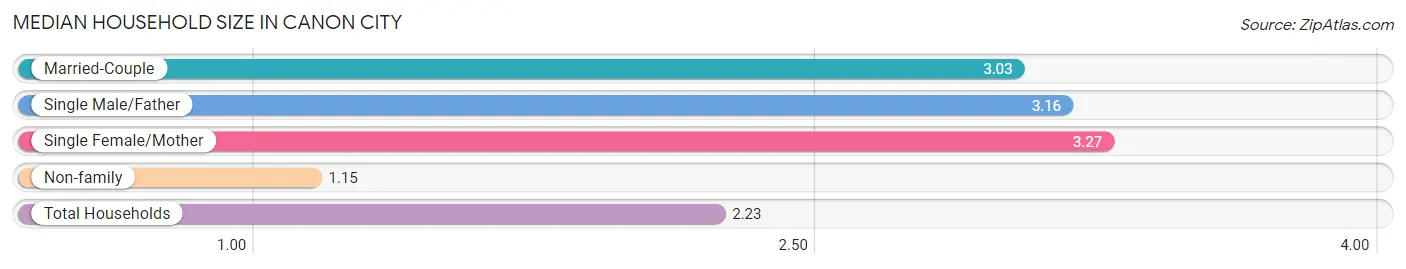
Median Household Size in Canon City
The median household size in Canon City is 2.23 persons per household, with single female/mother households (660 | 9.2%) accounting for the largest median household size of 3.27 persons per household. non-family households (3,166 | 44.1%) represent the smallest median household size with 1.15 persons per household.
| Household Type | # Households | Household Size |
| Married-Couple | 2,968 (41.4%) | 3.03 |
| Single Male/Father | 382 (5.3%) | 3.16 |
| Single Female/Mother | 660 (9.2%) | 3.27 |
| Non-family | 3,166 (44.1%) | 1.15 |
| Total Households | 7,176 (100.0%) | 2.23 |
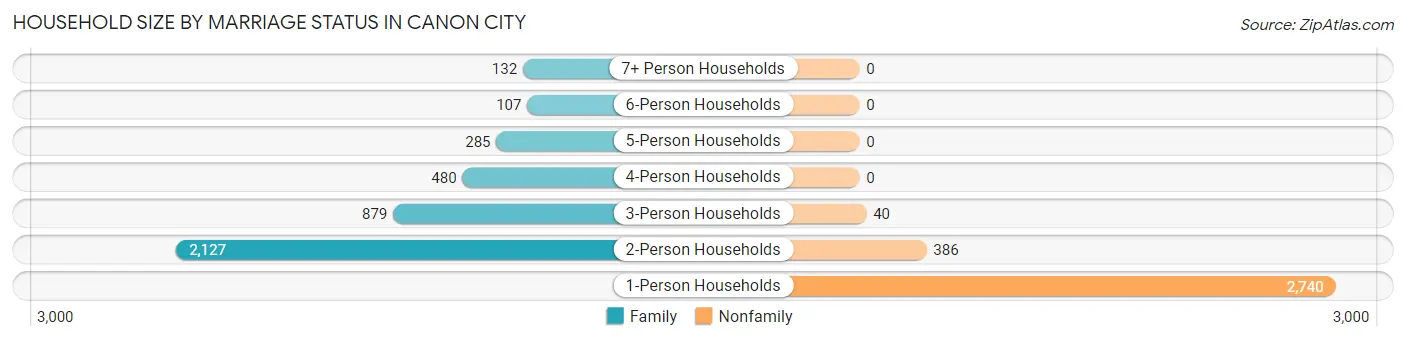
Household Size by Marriage Status in Canon City
Out of a total of 7,176 households in Canon City, 4,010 (55.9%) are family households, while 3,166 (44.1%) are nonfamily households. The most numerous type of family households are 2-person households, comprising 2,127, and the most common type of nonfamily households are 1-person households, comprising 2,740.
| Household Size | Family Households | Nonfamily Households |
| 1-Person Households | - | 2,740 (38.2%) |
| 2-Person Households | 2,127 (29.6%) | 386 (5.4%) |
| 3-Person Households | 879 (12.2%) | 40 (0.6%) |
| 4-Person Households | 480 (6.7%) | 0 (0.0%) |
| 5-Person Households | 285 (4.0%) | 0 (0.0%) |
| 6-Person Households | 107 (1.5%) | 0 (0.0%) |
| 7+ Person Households | 132 (1.8%) | 0 (0.0%) |
| Total | 4,010 (55.9%) | 3,166 (44.1%) |
Female Fertility in Canon City
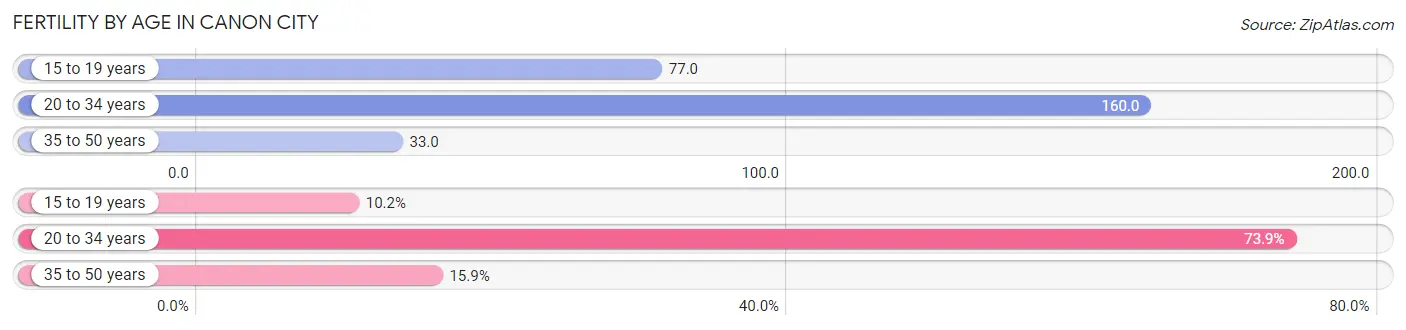
Fertility by Age in Canon City
Average fertility rate in Canon City is 92.0 births per 1,000 women. Women in the age bracket of 20 to 34 years have the highest fertility rate with 160.0 births per 1,000 women. Women in the age bracket of 20 to 34 years acount for 73.9% of all women with births.
| Age Bracket | Women with Births | Births / 1,000 Women |
| 15 to 19 years | 27 (10.2%) | 77.0 |
| 20 to 34 years | 195 (73.9%) | 160.0 |
| 35 to 50 years | 42 (15.9%) | 33.0 |
| Total | 264 (100.0%) | 92.0 |
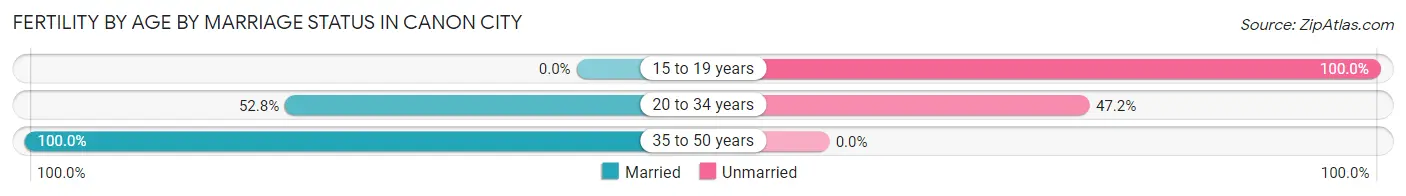
Fertility by Age by Marriage Status in Canon City
54.9% of women with births (264) in Canon City are married. The highest percentage of unmarried women with births falls into 15 to 19 years age bracket with 100.0% of them unmarried at the time of birth, while the lowest percentage of unmarried women with births belong to 35 to 50 years age bracket with 0.0% of them unmarried.
| Age Bracket | Married | Unmarried |
| 15 to 19 years | 0 (0.0%) | 27 (100.0%) |
| 20 to 34 years | 103 (52.8%) | 92 (47.2%) |
| 35 to 50 years | 42 (100.0%) | 0 (0.0%) |
| Total | 145 (54.9%) | 119 (45.1%) |
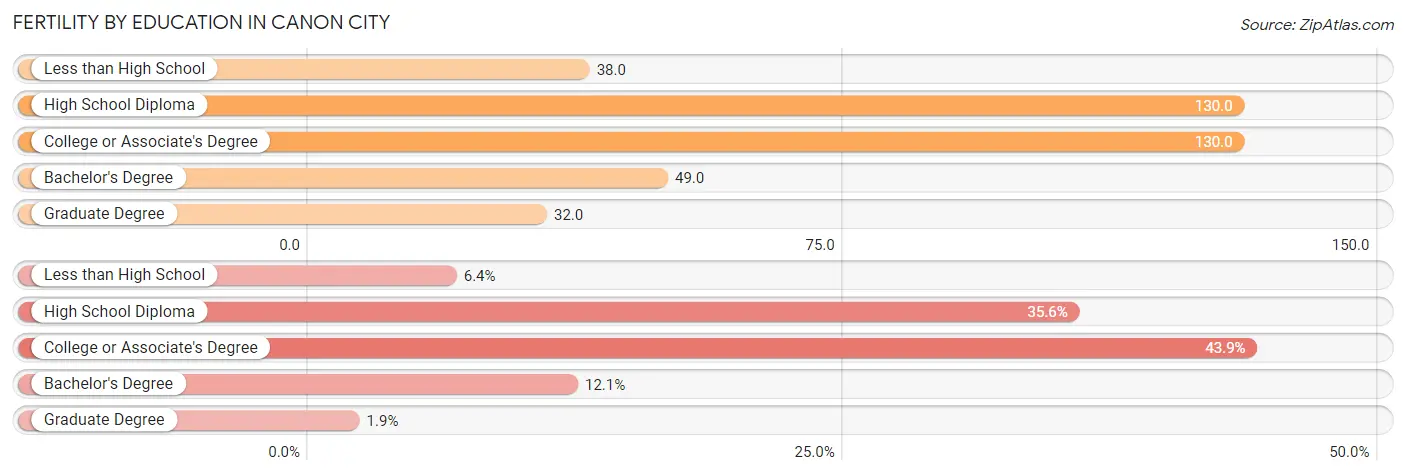
Fertility by Education in Canon City
Average fertility rate in Canon City is 92.0 births per 1,000 women. Women with the education attainment of high school diploma have the highest fertility rate of 130.0 births per 1,000 women, while women with the education attainment of graduate degree have the lowest fertility at 32.0 births per 1,000 women. Women with the education attainment of college or associate's degree represent 43.9% of all women with births.
| Educational Attainment | Women with Births | Births / 1,000 Women |
| Less than High School | 17 (6.4%) | 38.0 |
| High School Diploma | 94 (35.6%) | 130.0 |
| College or Associate's Degree | 116 (43.9%) | 130.0 |
| Bachelor's Degree | 32 (12.1%) | 49.0 |
| Graduate Degree | 5 (1.9%) | 32.0 |
| Total | 264 (100.0%) | 92.0 |
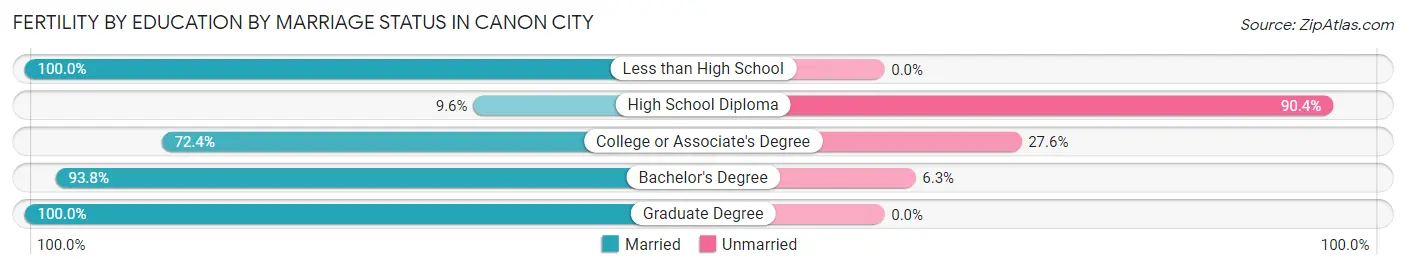
Fertility by Education by Marriage Status in Canon City
45.1% of women with births in Canon City are unmarried. Women with the educational attainment of less than high school are most likely to be married with 100.0% of them married at childbirth, while women with the educational attainment of high school diploma are least likely to be married with 90.4% of them unmarried at childbirth.
| Educational Attainment | Married | Unmarried |
| Less than High School | 17 (100.0%) | 0 (0.0%) |
| High School Diploma | 9 (9.6%) | 85 (90.4%) |
| College or Associate's Degree | 84 (72.4%) | 32 (27.6%) |
| Bachelor's Degree | 30 (93.8%) | 2 (6.2%) |
| Graduate Degree | 5 (100.0%) | 0 (0.0%) |
| Total | 145 (54.9%) | 119 (45.1%) |
Employment Characteristics in Canon City
Employment by Class of Employer in Canon City
Among the 6,505 employed individuals in Canon City, private company employees (3,713 | 57.1%), local government employees (924 | 14.2%), and state government employees (571 | 8.8%) make up the most common classes of employment.
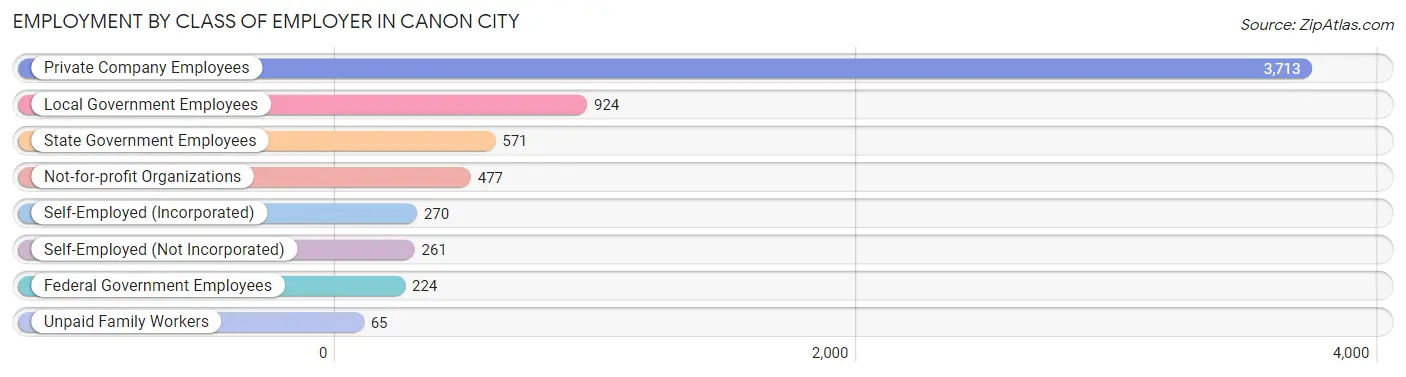
| Employer Class | # Employees | % Employees |
| Private Company Employees | 3,713 | 57.1% |
| Self-Employed (Incorporated) | 270 | 4.2% |
| Self-Employed (Not Incorporated) | 261 | 4.0% |
| Not-for-profit Organizations | 477 | 7.3% |
| Local Government Employees | 924 | 14.2% |
| State Government Employees | 571 | 8.8% |
| Federal Government Employees | 224 | 3.4% |
| Unpaid Family Workers | 65 | 1.0% |
| Total | 6,505 | 100.0% |
Employment Status by Age in Canon City
According to the labor force statistics for Canon City, out of the total population over 16 years of age (13,927), 49.4% or 6,880 individuals are in the labor force, with 4.8% or 330 of them unemployed. The age group with the highest labor force participation rate is 25 to 29 years, with 75.5% or 941 individuals in the labor force. Within the labor force, the 16 to 19 years age range has the highest percentage of unemployed individuals, with 16.2% or 38 of them being unemployed.
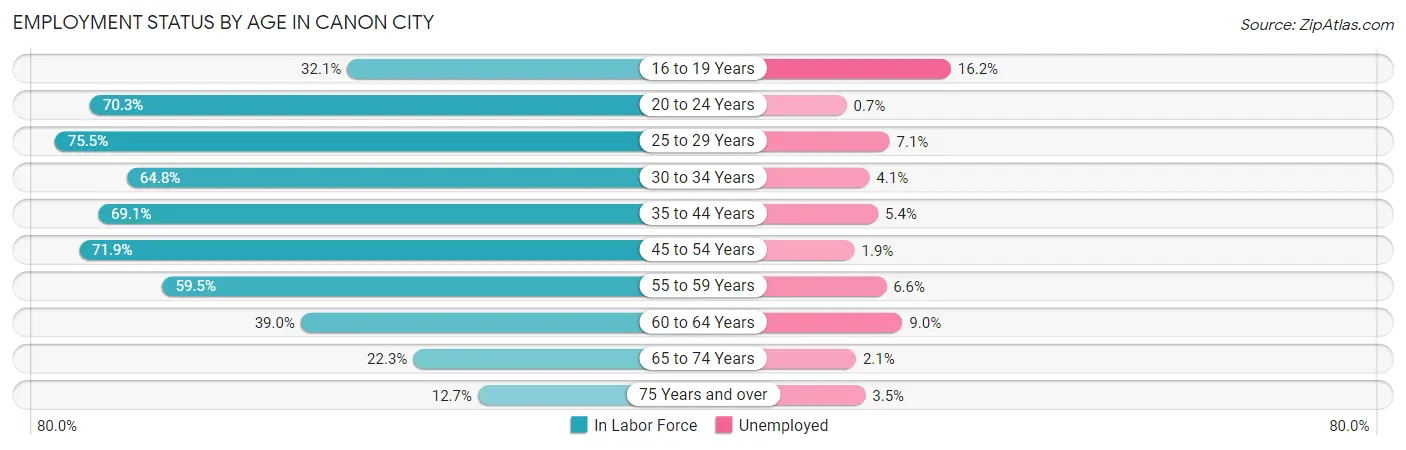
| Age Bracket | In Labor Force | Unemployed |
| 16 to 19 Years | 234 (32.1%) | 38 (16.2%) |
| 20 to 24 Years | 585 (70.3%) | 4 (0.7%) |
| 25 to 29 Years | 941 (75.5%) | 67 (7.1%) |
| 30 to 34 Years | 656 (64.8%) | 27 (4.1%) |
| 35 to 44 Years | 1,101 (69.1%) | 59 (5.4%) |
| 45 to 54 Years | 1,437 (71.9%) | 27 (1.9%) |
| 55 to 59 Years | 791 (59.5%) | 52 (6.6%) |
| 60 to 64 Years | 400 (39.0%) | 36 (9.0%) |
| 65 to 74 Years | 471 (22.3%) | 10 (2.1%) |
| 75 Years and over | 260 (12.7%) | 9 (3.5%) |
| Total | 6,880 (49.4%) | 330 (4.8%) |
Employment Status by Educational Attainment in Canon City
According to labor force statistics for Canon City, 64.9% of individuals (5,326) out of the total population between 25 and 64 years of age (8,207) are in the labor force, with 5.0% or 266 of them being unemployed. The group with the highest labor force participation rate are those with the educational attainment of bachelor's degree or higher, with 76.9% or 1,540 individuals in the labor force. Within the labor force, individuals with less than high school education have the highest percentage of unemployment, with 16.5% or 44 of them being unemployed.
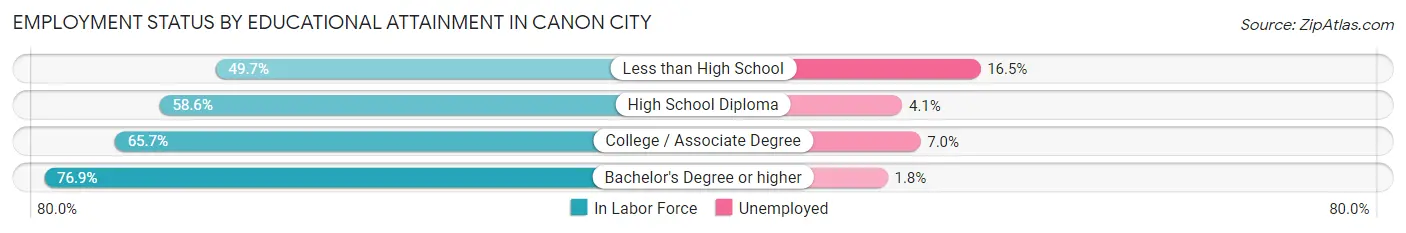
| Educational Attainment | In Labor Force | Unemployed |
| Less than High School | 266 (49.7%) | 88 (16.5%) |
| High School Diploma | 1,669 (58.6%) | 117 (4.1%) |
| College / Associate Degree | 1,854 (65.7%) | 198 (7.0%) |
| Bachelor's Degree or higher | 1,540 (76.9%) | 36 (1.8%) |
| Total | 5,326 (64.9%) | 410 (5.0%) |
Employment Occupations by Sex in Canon City
Management, Business, Science and Arts Occupations
The most common Management, Business, Science and Arts occupations in Canon City are Community & Social Service (967 | 14.8%), Management (560 | 8.6%), Education Instruction & Library (530 | 8.1%), Education, Arts & Media (335 | 5.1%), and Health Diagnosing & Treating (255 | 3.9%).
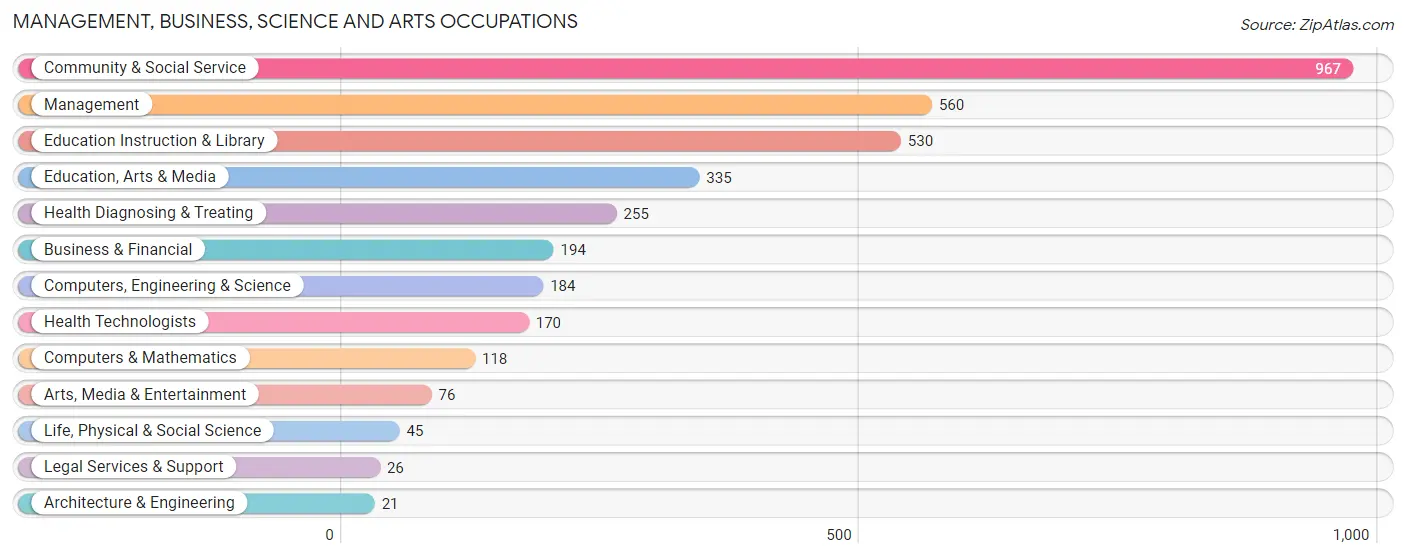
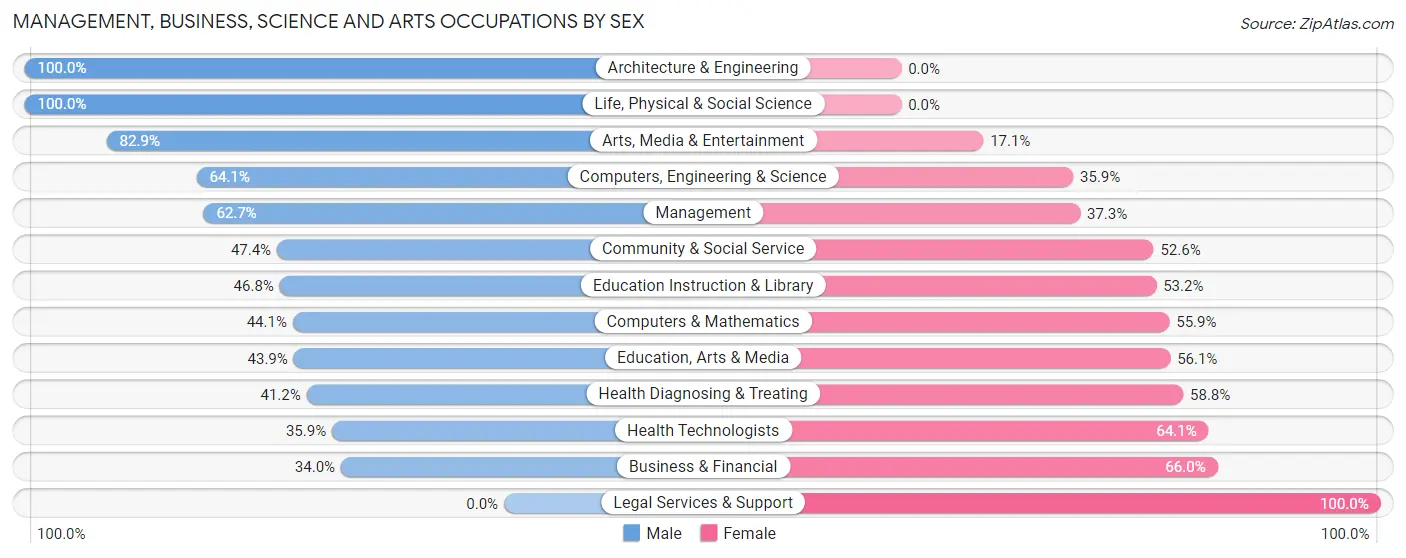
Management, Business, Science and Arts Occupations by Sex
Within the Management, Business, Science and Arts occupations in Canon City, the most male-oriented occupations are Architecture & Engineering (100.0%), Life, Physical & Social Science (100.0%), and Arts, Media & Entertainment (82.9%), while the most female-oriented occupations are Legal Services & Support (100.0%), Business & Financial (66.0%), and Health Technologists (64.1%).
| Occupation | Male | Female |
| Management | 351 (62.7%) | 209 (37.3%) |
| Business & Financial | 66 (34.0%) | 128 (66.0%) |
| Computers, Engineering & Science | 118 (64.1%) | 66 (35.9%) |
| Computers & Mathematics | 52 (44.1%) | 66 (55.9%) |
| Architecture & Engineering | 21 (100.0%) | 0 (0.0%) |
| Life, Physical & Social Science | 45 (100.0%) | 0 (0.0%) |
| Community & Social Service | 458 (47.4%) | 509 (52.6%) |
| Education, Arts & Media | 147 (43.9%) | 188 (56.1%) |
| Legal Services & Support | 0 (0.0%) | 26 (100.0%) |
| Education Instruction & Library | 248 (46.8%) | 282 (53.2%) |
| Arts, Media & Entertainment | 63 (82.9%) | 13 (17.1%) |
| Health Diagnosing & Treating | 105 (41.2%) | 150 (58.8%) |
| Health Technologists | 61 (35.9%) | 109 (64.1%) |
| Total (Category) | 1,098 (50.8%) | 1,062 (49.2%) |
| Total (Overall) | 3,597 (55.2%) | 2,924 (44.8%) |
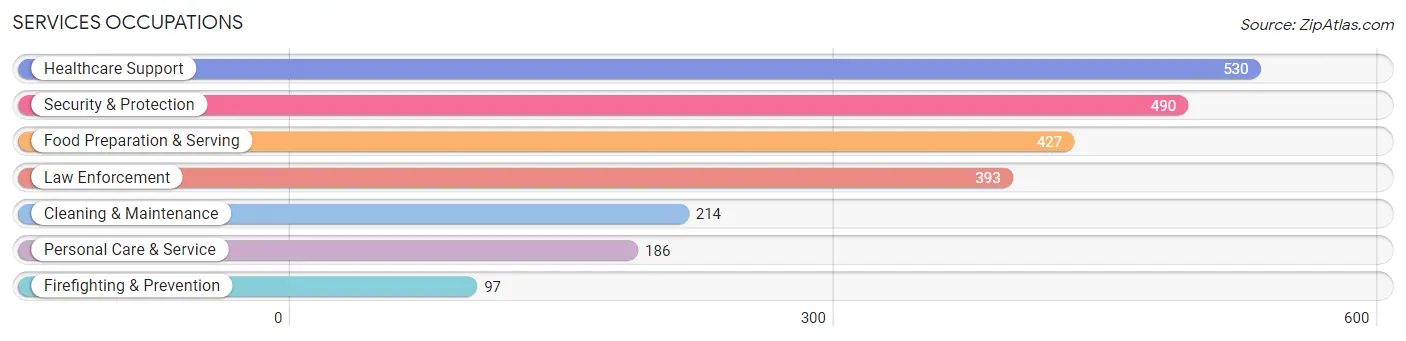
Services Occupations
The most common Services occupations in Canon City are Healthcare Support (530 | 8.1%), Security & Protection (490 | 7.5%), Food Preparation & Serving (427 | 6.6%), Law Enforcement (393 | 6.0%), and Cleaning & Maintenance (214 | 3.3%).
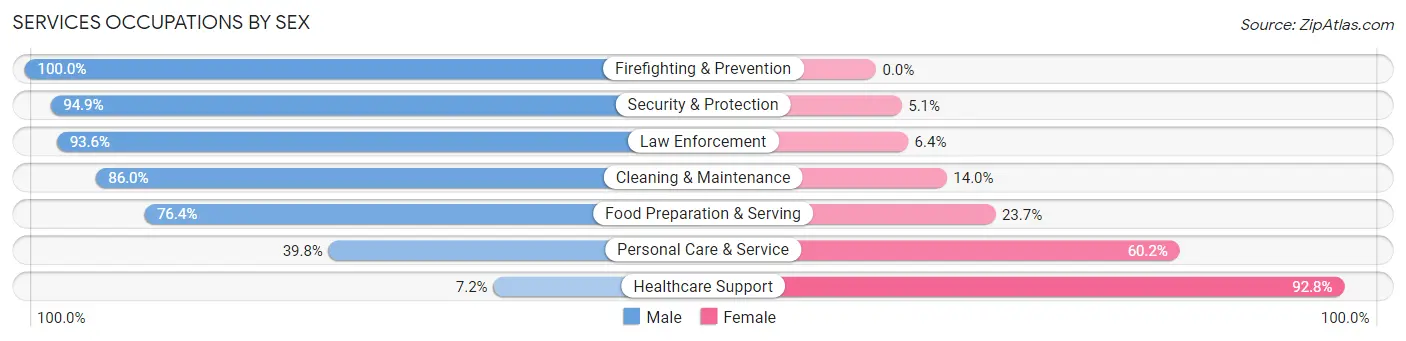
Services Occupations by Sex
Within the Services occupations in Canon City, the most male-oriented occupations are Firefighting & Prevention (100.0%), Security & Protection (94.9%), and Law Enforcement (93.6%), while the most female-oriented occupations are Healthcare Support (92.8%), Personal Care & Service (60.2%), and Food Preparation & Serving (23.6%).
| Occupation | Male | Female |
| Healthcare Support | 38 (7.2%) | 492 (92.8%) |
| Security & Protection | 465 (94.9%) | 25 (5.1%) |
| Firefighting & Prevention | 97 (100.0%) | 0 (0.0%) |
| Law Enforcement | 368 (93.6%) | 25 (6.4%) |
| Food Preparation & Serving | 326 (76.3%) | 101 (23.6%) |
| Cleaning & Maintenance | 184 (86.0%) | 30 (14.0%) |
| Personal Care & Service | 74 (39.8%) | 112 (60.2%) |
| Total (Category) | 1,087 (58.9%) | 760 (41.1%) |
| Total (Overall) | 3,597 (55.2%) | 2,924 (44.8%) |
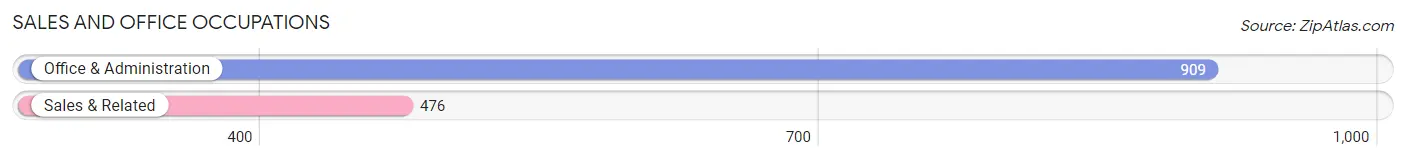
Sales and Office Occupations
The most common Sales and Office occupations in Canon City are Office & Administration (909 | 13.9%), and Sales & Related (476 | 7.3%).
Sales and Office Occupations by Sex
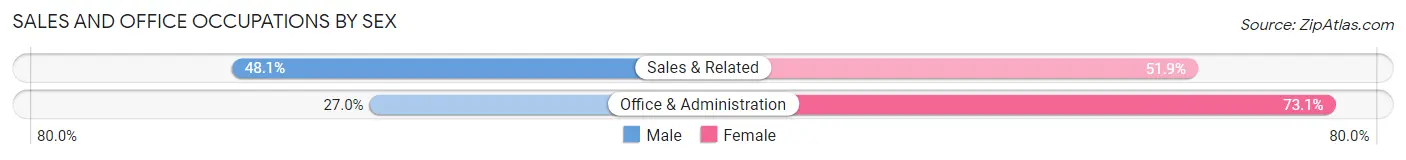
| Occupation | Male | Female |
| Sales & Related | 229 (48.1%) | 247 (51.9%) |
| Office & Administration | 245 (27.0%) | 664 (73.1%) |
| Total (Category) | 474 (34.2%) | 911 (65.8%) |
| Total (Overall) | 3,597 (55.2%) | 2,924 (44.8%) |
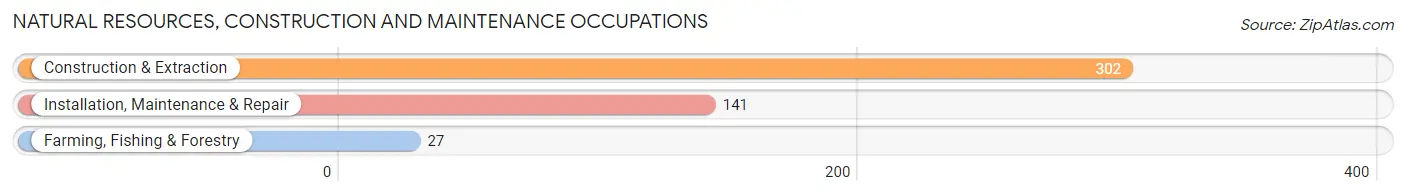
Natural Resources, Construction and Maintenance Occupations
The most common Natural Resources, Construction and Maintenance occupations in Canon City are Construction & Extraction (302 | 4.6%), Installation, Maintenance & Repair (141 | 2.2%), and Farming, Fishing & Forestry (27 | 0.4%).
Natural Resources, Construction and Maintenance Occupations by Sex
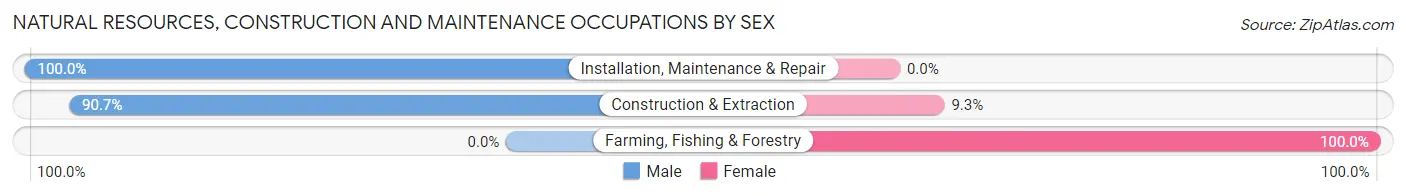
| Occupation | Male | Female |
| Farming, Fishing & Forestry | 0 (0.0%) | 27 (100.0%) |
| Construction & Extraction | 274 (90.7%) | 28 (9.3%) |
| Installation, Maintenance & Repair | 141 (100.0%) | 0 (0.0%) |
| Total (Category) | 415 (88.3%) | 55 (11.7%) |
| Total (Overall) | 3,597 (55.2%) | 2,924 (44.8%) |
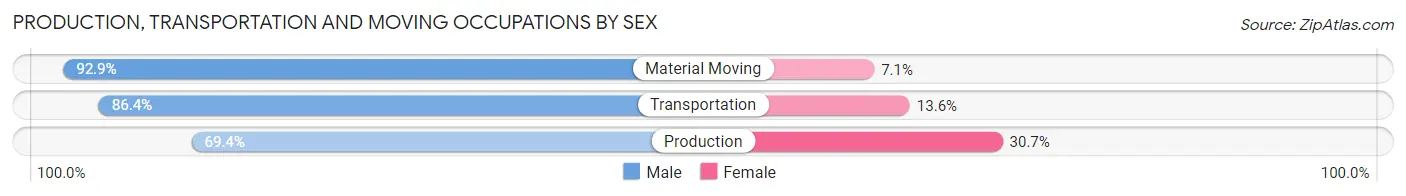
Production, Transportation and Moving Occupations
The most common Production, Transportation and Moving occupations in Canon City are Production (336 | 5.1%), Material Moving (169 | 2.6%), and Transportation (154 | 2.4%).
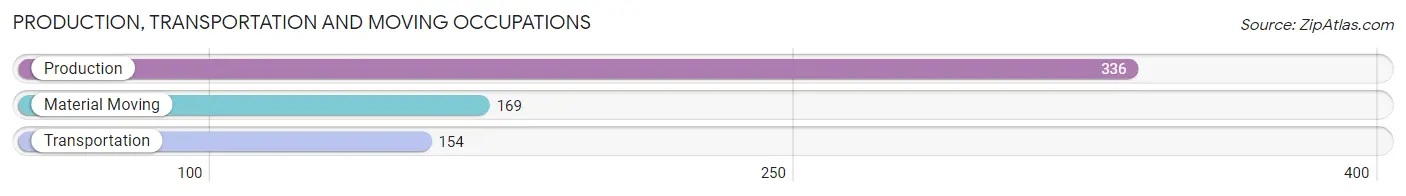
Production, Transportation and Moving Occupations by Sex
| Occupation | Male | Female |
| Production | 233 (69.4%) | 103 (30.6%) |
| Transportation | 133 (86.4%) | 21 (13.6%) |
| Material Moving | 157 (92.9%) | 12 (7.1%) |
| Total (Category) | 523 (79.4%) | 136 (20.6%) |
| Total (Overall) | 3,597 (55.2%) | 2,924 (44.8%) |
Employment Industries by Sex in Canon City
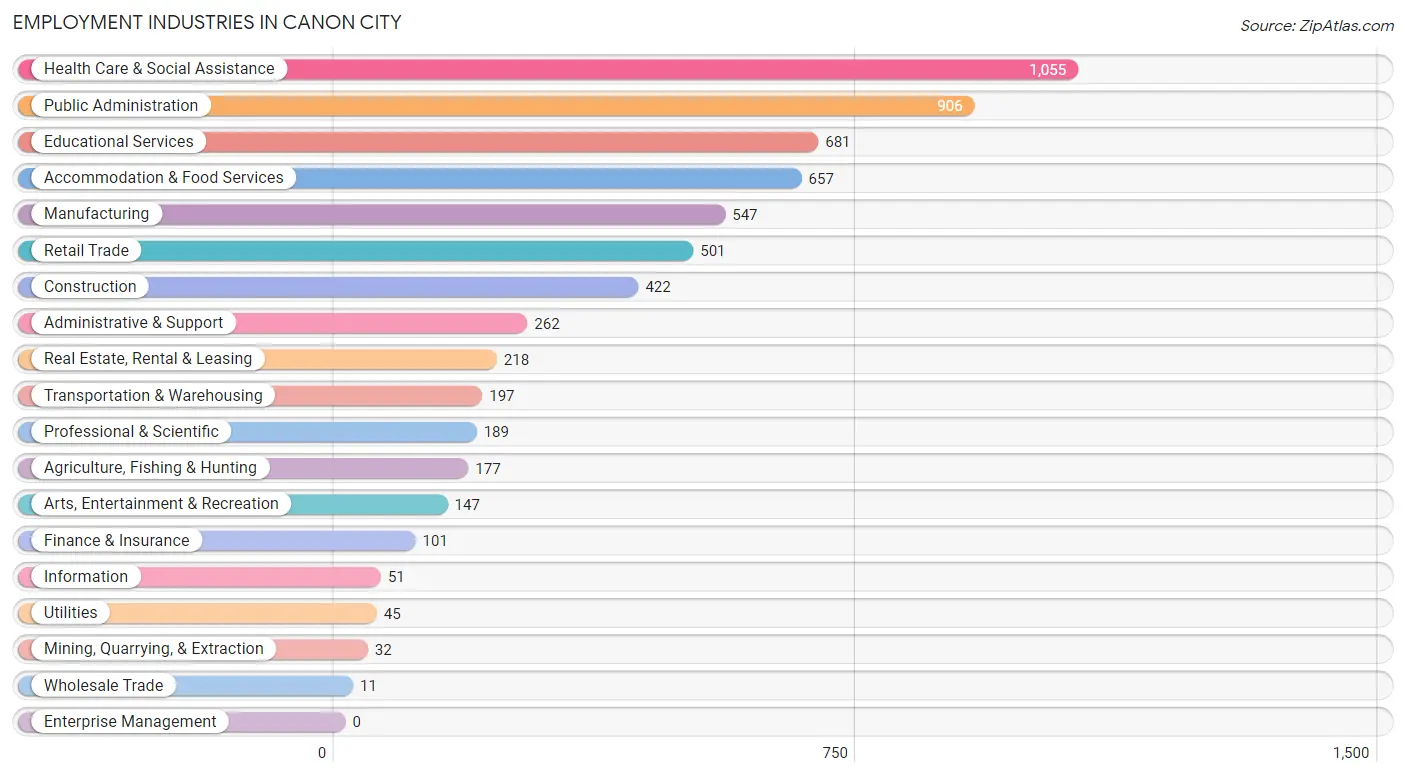
Employment Industries in Canon City
The major employment industries in Canon City include Health Care & Social Assistance (1,055 | 16.2%), Public Administration (906 | 13.9%), Educational Services (681 | 10.4%), Accommodation & Food Services (657 | 10.1%), and Manufacturing (547 | 8.4%).
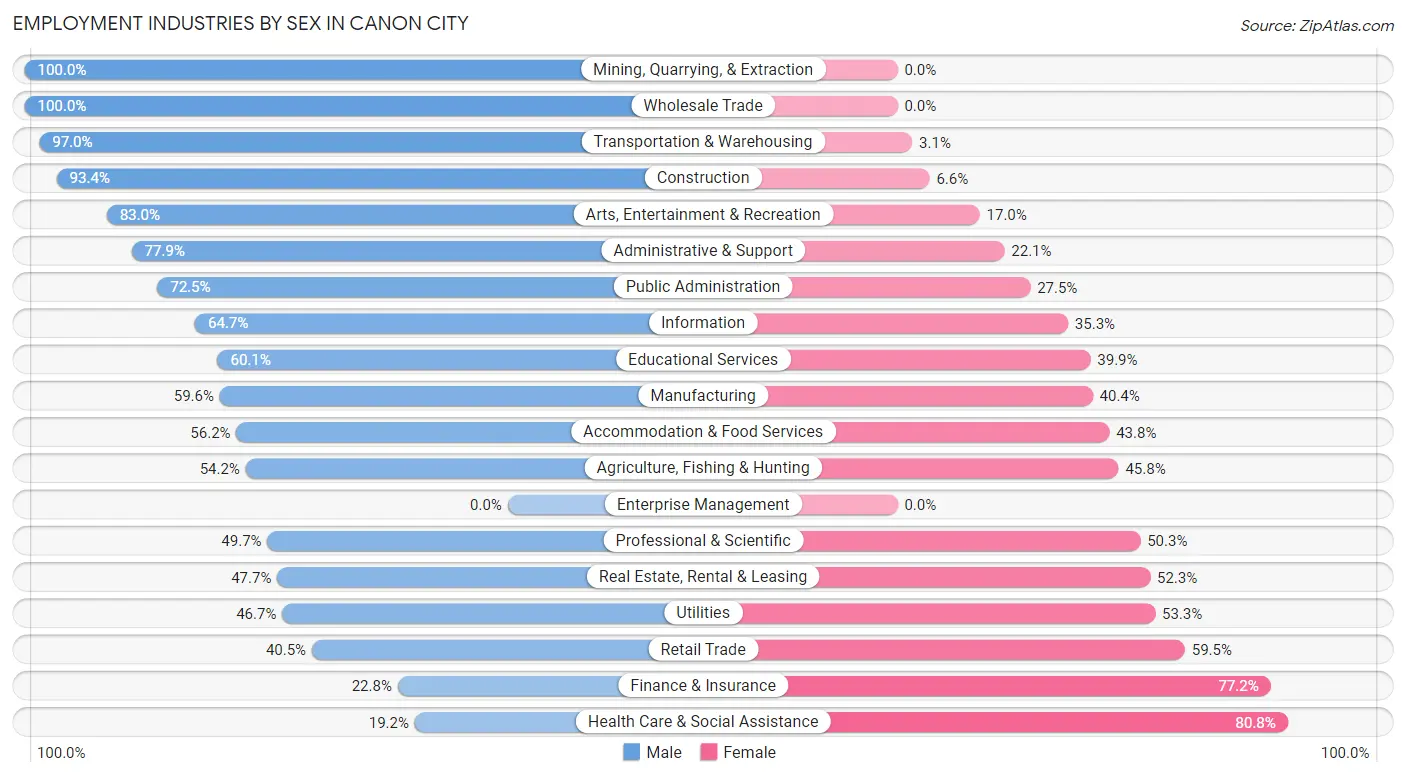
Employment Industries by Sex in Canon City
The Canon City industries that see more men than women are Mining, Quarrying, & Extraction (100.0%), Wholesale Trade (100.0%), and Transportation & Warehousing (97.0%), whereas the industries that tend to have a higher number of women are Health Care & Social Assistance (80.8%), Finance & Insurance (77.2%), and Retail Trade (59.5%).
| Industry | Male | Female |
| Agriculture, Fishing & Hunting | 96 (54.2%) | 81 (45.8%) |
| Mining, Quarrying, & Extraction | 32 (100.0%) | 0 (0.0%) |
| Construction | 394 (93.4%) | 28 (6.6%) |
| Manufacturing | 326 (59.6%) | 221 (40.4%) |
| Wholesale Trade | 11 (100.0%) | 0 (0.0%) |
| Retail Trade | 203 (40.5%) | 298 (59.5%) |
| Transportation & Warehousing | 191 (97.0%) | 6 (3.0%) |
| Utilities | 21 (46.7%) | 24 (53.3%) |
| Information | 33 (64.7%) | 18 (35.3%) |
| Finance & Insurance | 23 (22.8%) | 78 (77.2%) |
| Real Estate, Rental & Leasing | 104 (47.7%) | 114 (52.3%) |
| Professional & Scientific | 94 (49.7%) | 95 (50.3%) |
| Enterprise Management | 0 (0.0%) | 0 (0.0%) |
| Administrative & Support | 204 (77.9%) | 58 (22.1%) |
| Educational Services | 409 (60.1%) | 272 (39.9%) |
| Health Care & Social Assistance | 203 (19.2%) | 852 (80.8%) |
| Arts, Entertainment & Recreation | 122 (83.0%) | 25 (17.0%) |
| Accommodation & Food Services | 369 (56.2%) | 288 (43.8%) |
| Public Administration | 657 (72.5%) | 249 (27.5%) |
| Total | 3,597 (55.2%) | 2,924 (44.8%) |
Education in Canon City
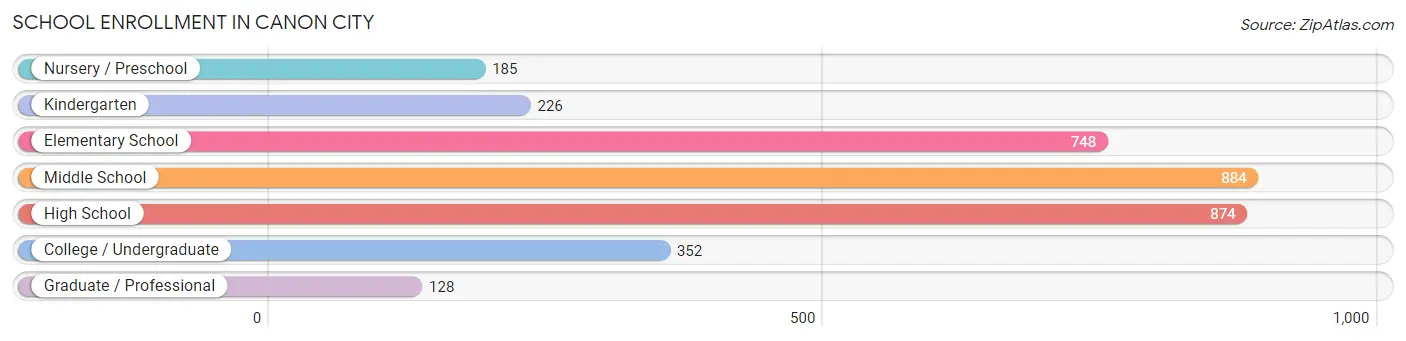
School Enrollment in Canon City
The most common levels of schooling among the 3,397 students in Canon City are middle school (884 | 26.0%), high school (874 | 25.7%), and elementary school (748 | 22.0%).
| School Level | # Students | % Students |
| Nursery / Preschool | 185 | 5.4% |
| Kindergarten | 226 | 6.7% |
| Elementary School | 748 | 22.0% |
| Middle School | 884 | 26.0% |
| High School | 874 | 25.7% |
| College / Undergraduate | 352 | 10.4% |
| Graduate / Professional | 128 | 3.8% |
| Total | 3,397 | 100.0% |
School Enrollment by Age by Funding Source in Canon City
Out of a total of 3,397 students who are enrolled in schools in Canon City, 241 (7.1%) attend a private institution, while the remaining 3,156 (92.9%) are enrolled in public schools. The age group of 35 years and over has the highest likelihood of being enrolled in private schools, with 35 (30.4% in the age bracket) enrolled. Conversely, the age group of 20 to 24 year olds has the lowest likelihood of being enrolled in a private school, with 44 (100.0% in the age bracket) attending a public institution.
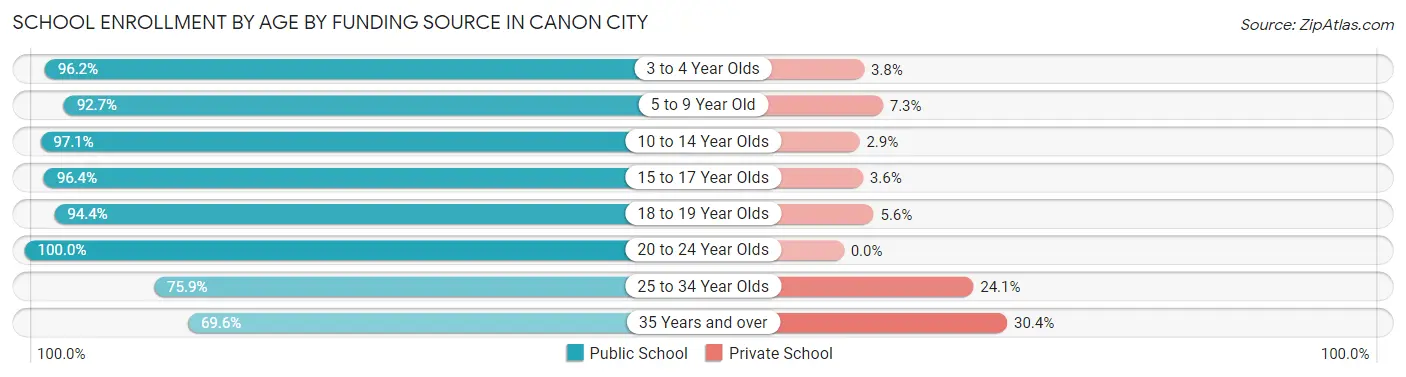
| Age Bracket | Public School | Private School |
| 3 to 4 Year Olds | 178 (96.2%) | 7 (3.8%) |
| 5 to 9 Year Old | 852 (92.7%) | 67 (7.3%) |
| 10 to 14 Year Olds | 989 (97.1%) | 30 (2.9%) |
| 15 to 17 Year Olds | 674 (96.4%) | 25 (3.6%) |
| 18 to 19 Year Olds | 119 (94.4%) | 7 (5.6%) |
| 20 to 24 Year Olds | 44 (100.0%) | 0 (0.0%) |
| 25 to 34 Year Olds | 220 (75.9%) | 70 (24.1%) |
| 35 Years and over | 80 (69.6%) | 35 (30.4%) |
| Total | 3,156 (92.9%) | 241 (7.1%) |
Educational Attainment by Field of Study in Canon City
Arts & humanities (590 | 17.1%), business (492 | 14.3%), education (463 | 13.4%), social sciences (336 | 9.7%), and science & technology (241 | 7.0%) are the most common fields of study among 3,448 individuals in Canon City who have obtained a bachelor's degree or higher.
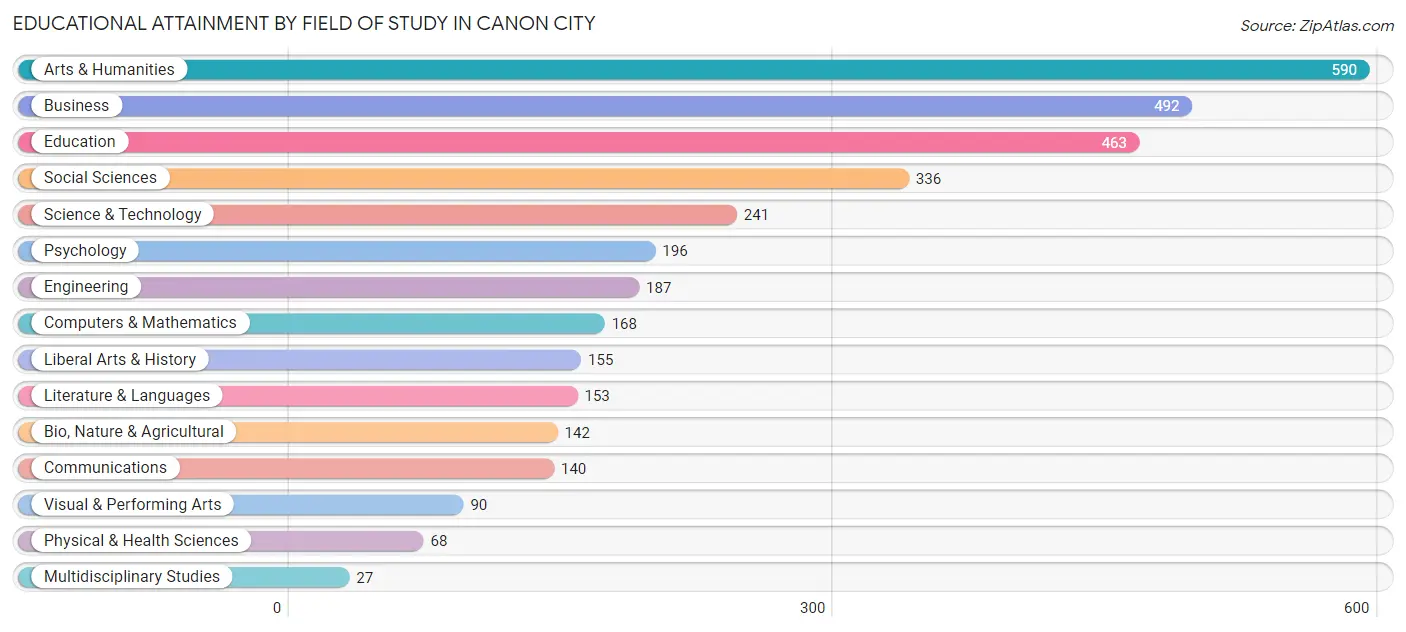
| Field of Study | # Graduates | % Graduates |
| Computers & Mathematics | 168 | 4.9% |
| Bio, Nature & Agricultural | 142 | 4.1% |
| Physical & Health Sciences | 68 | 2.0% |
| Psychology | 196 | 5.7% |
| Social Sciences | 336 | 9.7% |
| Engineering | 187 | 5.4% |
| Multidisciplinary Studies | 27 | 0.8% |
| Science & Technology | 241 | 7.0% |
| Business | 492 | 14.3% |
| Education | 463 | 13.4% |
| Literature & Languages | 153 | 4.4% |
| Liberal Arts & History | 155 | 4.5% |
| Visual & Performing Arts | 90 | 2.6% |
| Communications | 140 | 4.1% |
| Arts & Humanities | 590 | 17.1% |
| Total | 3,448 | 100.0% |
Transportation & Commute in Canon City
Vehicle Availability by Sex in Canon City
The most prevalent vehicle ownership categories in Canon City are males with 2 vehicles (1,288, accounting for 35.7%) and females with 2 vehicles (934, making up 44.6%).
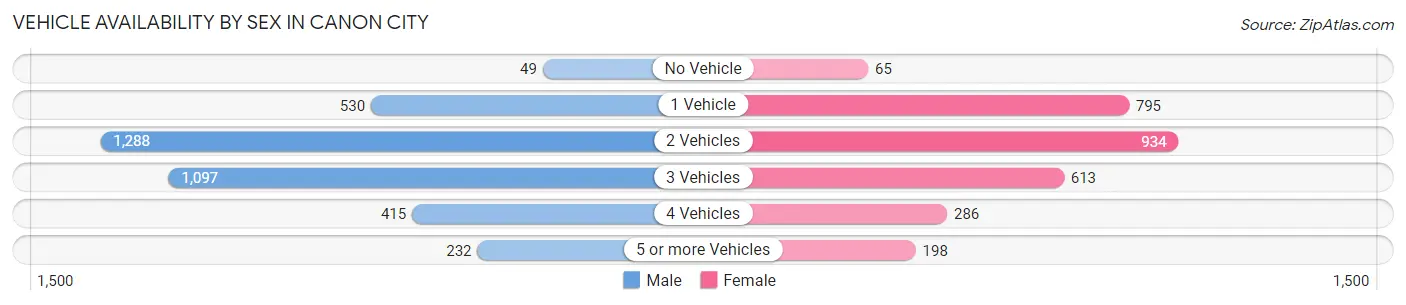
| Vehicles Available | Male | Female |
| No Vehicle | 49 (1.4%) | 65 (2.2%) |
| 1 Vehicle | 530 (14.7%) | 795 (27.5%) |
| 2 Vehicles | 1,288 (35.7%) | 934 (32.3%) |
| 3 Vehicles | 1,097 (30.4%) | 613 (21.2%) |
| 4 Vehicles | 415 (11.5%) | 286 (9.9%) |
| 5 or more Vehicles | 232 (6.4%) | 198 (6.9%) |
| Total | 3,611 (100.0%) | 2,891 (100.0%) |
Commute Time in Canon City
The most frequently occuring commute durations in Canon City are 5 to 9 minutes (1,541 commuters, 25.1%), 10 to 14 minutes (1,523 commuters, 24.8%), and 15 to 19 minutes (875 commuters, 14.2%).
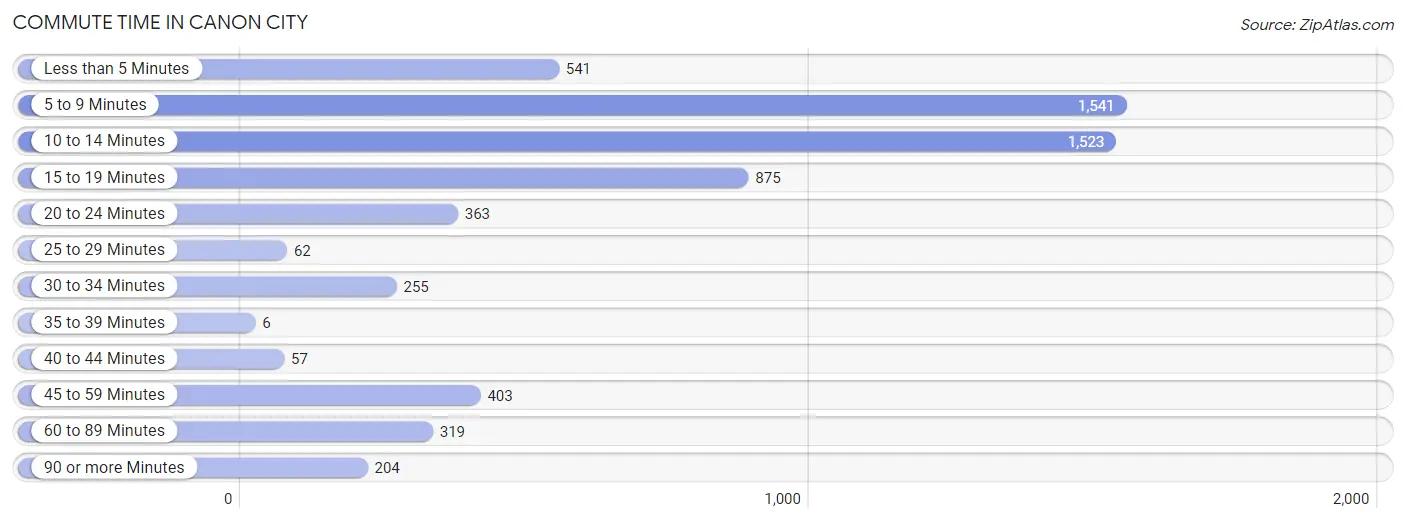
| Commute Time | # Commuters | % Commuters |
| Less than 5 Minutes | 541 | 8.8% |
| 5 to 9 Minutes | 1,541 | 25.1% |
| 10 to 14 Minutes | 1,523 | 24.8% |
| 15 to 19 Minutes | 875 | 14.2% |
| 20 to 24 Minutes | 363 | 5.9% |
| 25 to 29 Minutes | 62 | 1.0% |
| 30 to 34 Minutes | 255 | 4.2% |
| 35 to 39 Minutes | 6 | 0.1% |
| 40 to 44 Minutes | 57 | 0.9% |
| 45 to 59 Minutes | 403 | 6.6% |
| 60 to 89 Minutes | 319 | 5.2% |
| 90 or more Minutes | 204 | 3.3% |
Commute Time by Sex in Canon City
The most common commute times in Canon City are 10 to 14 minutes (914 commuters, 26.1%) for males and 5 to 9 minutes (955 commuters, 36.1%) for females.

| Commute Time | Male | Female |
| Less than 5 Minutes | 247 (7.0%) | 294 (11.1%) |
| 5 to 9 Minutes | 586 (16.7%) | 955 (36.1%) |
| 10 to 14 Minutes | 914 (26.1%) | 609 (23.0%) |
| 15 to 19 Minutes | 626 (17.9%) | 249 (9.4%) |
| 20 to 24 Minutes | 214 (6.1%) | 149 (5.6%) |
| 25 to 29 Minutes | 43 (1.2%) | 19 (0.7%) |
| 30 to 34 Minutes | 129 (3.7%) | 126 (4.8%) |
| 35 to 39 Minutes | 6 (0.2%) | 0 (0.0%) |
| 40 to 44 Minutes | 57 (1.6%) | 0 (0.0%) |
| 45 to 59 Minutes | 335 (9.6%) | 68 (2.6%) |
| 60 to 89 Minutes | 230 (6.6%) | 89 (3.4%) |
| 90 or more Minutes | 117 (3.3%) | 87 (3.3%) |
Time of Departure to Work by Sex in Canon City
The most frequent times of departure to work in Canon City are 5:30 AM to 5:59 AM (590, 16.8%) for males and 7:30 AM to 7:59 AM (747, 28.2%) for females.
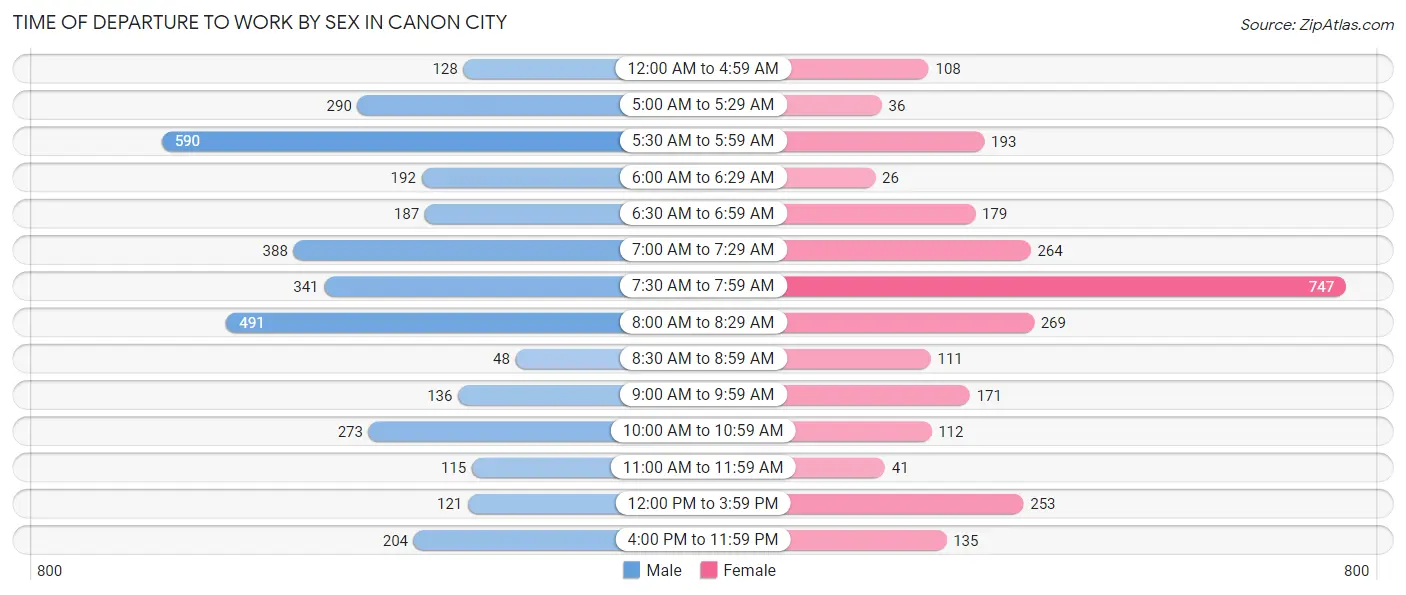
| Time of Departure | Male | Female |
| 12:00 AM to 4:59 AM | 128 (3.6%) | 108 (4.1%) |
| 5:00 AM to 5:29 AM | 290 (8.3%) | 36 (1.4%) |
| 5:30 AM to 5:59 AM | 590 (16.8%) | 193 (7.3%) |
| 6:00 AM to 6:29 AM | 192 (5.5%) | 26 (1.0%) |
| 6:30 AM to 6:59 AM | 187 (5.3%) | 179 (6.8%) |
| 7:00 AM to 7:29 AM | 388 (11.1%) | 264 (10.0%) |
| 7:30 AM to 7:59 AM | 341 (9.7%) | 747 (28.2%) |
| 8:00 AM to 8:29 AM | 491 (14.0%) | 269 (10.2%) |
| 8:30 AM to 8:59 AM | 48 (1.4%) | 111 (4.2%) |
| 9:00 AM to 9:59 AM | 136 (3.9%) | 171 (6.5%) |
| 10:00 AM to 10:59 AM | 273 (7.8%) | 112 (4.2%) |
| 11:00 AM to 11:59 AM | 115 (3.3%) | 41 (1.5%) |
| 12:00 PM to 3:59 PM | 121 (3.5%) | 253 (9.6%) |
| 4:00 PM to 11:59 PM | 204 (5.8%) | 135 (5.1%) |
| Total | 3,504 (100.0%) | 2,645 (100.0%) |
Housing Occupancy in Canon City
Occupancy by Ownership in Canon City
Of the total 7,176 dwellings in Canon City, owner-occupied units account for 4,957 (69.1%), while renter-occupied units make up 2,219 (30.9%).
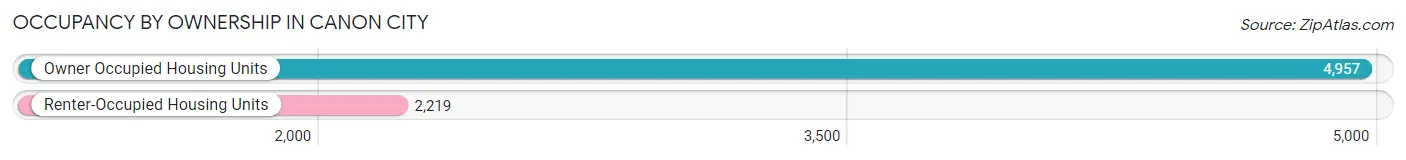
| Occupancy | # Housing Units | % Housing Units |
| Owner Occupied Housing Units | 4,957 | 69.1% |
| Renter-Occupied Housing Units | 2,219 | 30.9% |
| Total Occupied Housing Units | 7,176 | 100.0% |
Occupancy by Household Size in Canon City
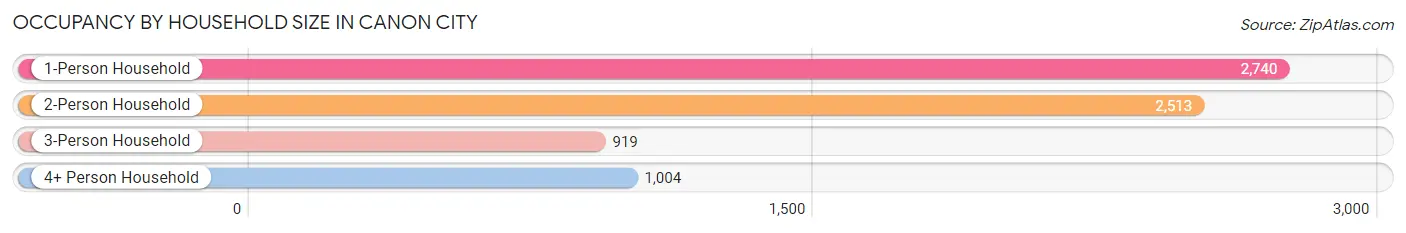
| Household Size | # Housing Units | % Housing Units |
| 1-Person Household | 2,740 | 38.2% |
| 2-Person Household | 2,513 | 35.0% |
| 3-Person Household | 919 | 12.8% |
| 4+ Person Household | 1,004 | 14.0% |
| Total Housing Units | 7,176 | 100.0% |
Occupancy by Ownership by Household Size in Canon City
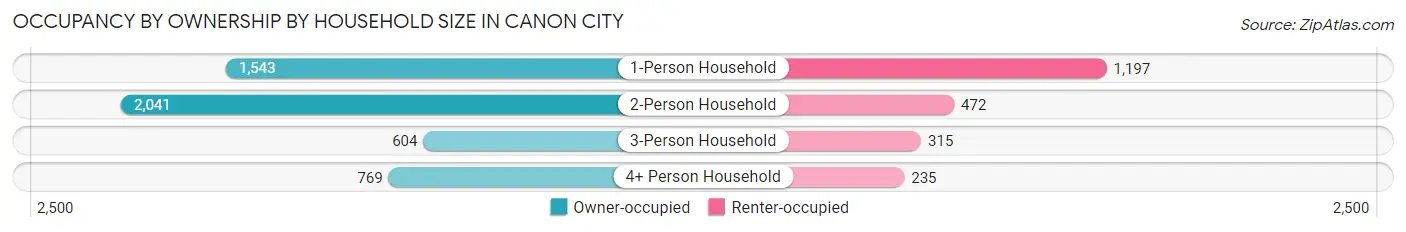
| Household Size | Owner-occupied | Renter-occupied |
| 1-Person Household | 1,543 (56.3%) | 1,197 (43.7%) |
| 2-Person Household | 2,041 (81.2%) | 472 (18.8%) |
| 3-Person Household | 604 (65.7%) | 315 (34.3%) |
| 4+ Person Household | 769 (76.6%) | 235 (23.4%) |
| Total Housing Units | 4,957 (69.1%) | 2,219 (30.9%) |
Occupancy by Educational Attainment in Canon City
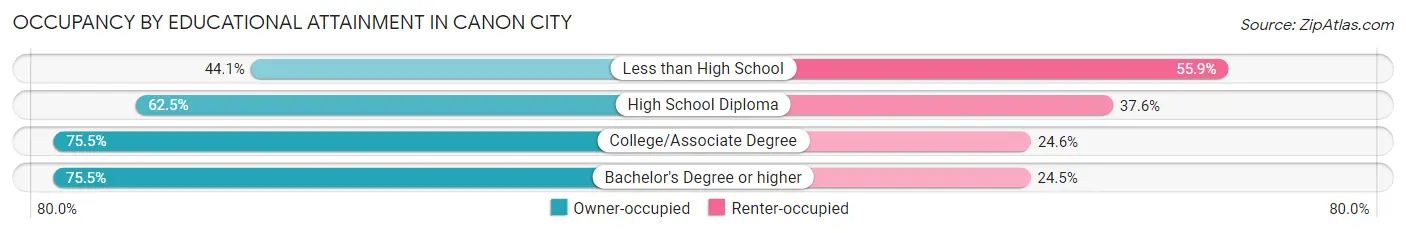
| Household Size | Owner-occupied | Renter-occupied |
| Less than High School | 245 (44.1%) | 310 (55.9%) |
| High School Diploma | 1,367 (62.5%) | 822 (37.6%) |
| College/Associate Degree | 2,022 (75.4%) | 658 (24.5%) |
| Bachelor's Degree or higher | 1,323 (75.5%) | 429 (24.5%) |
Occupancy by Age of Householder in Canon City
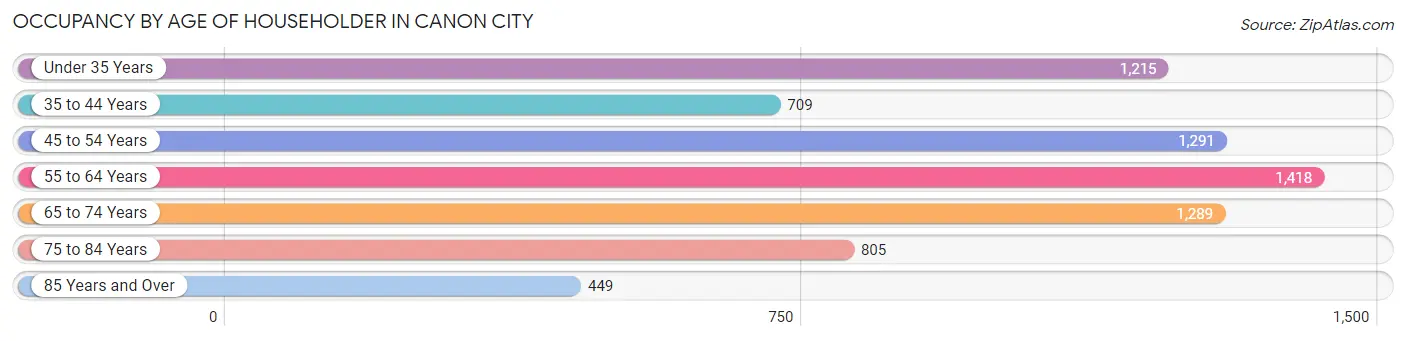
| Age Bracket | # Households | % Households |
| Under 35 Years | 1,215 | 16.9% |
| 35 to 44 Years | 709 | 9.9% |
| 45 to 54 Years | 1,291 | 18.0% |
| 55 to 64 Years | 1,418 | 19.8% |
| 65 to 74 Years | 1,289 | 18.0% |
| 75 to 84 Years | 805 | 11.2% |
| 85 Years and Over | 449 | 6.3% |
| Total | 7,176 | 100.0% |
Housing Finances in Canon City
Median Income by Occupancy in Canon City
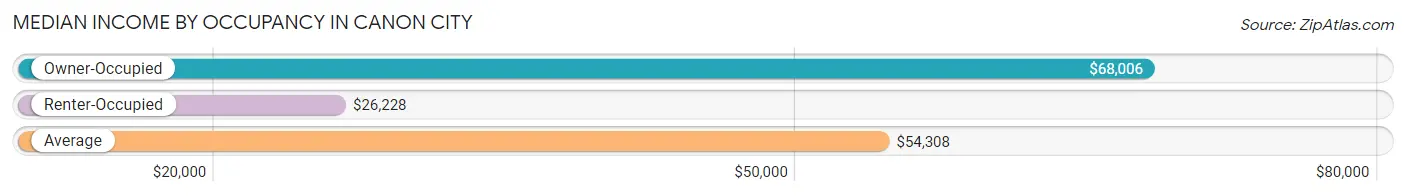
| Occupancy Type | # Households | Median Income |
| Owner-Occupied | 4,957 (69.1%) | $68,006 |
| Renter-Occupied | 2,219 (30.9%) | $26,228 |
| Average | 7,176 (100.0%) | $54,308 |
Occupancy by Householder Income Bracket in Canon City
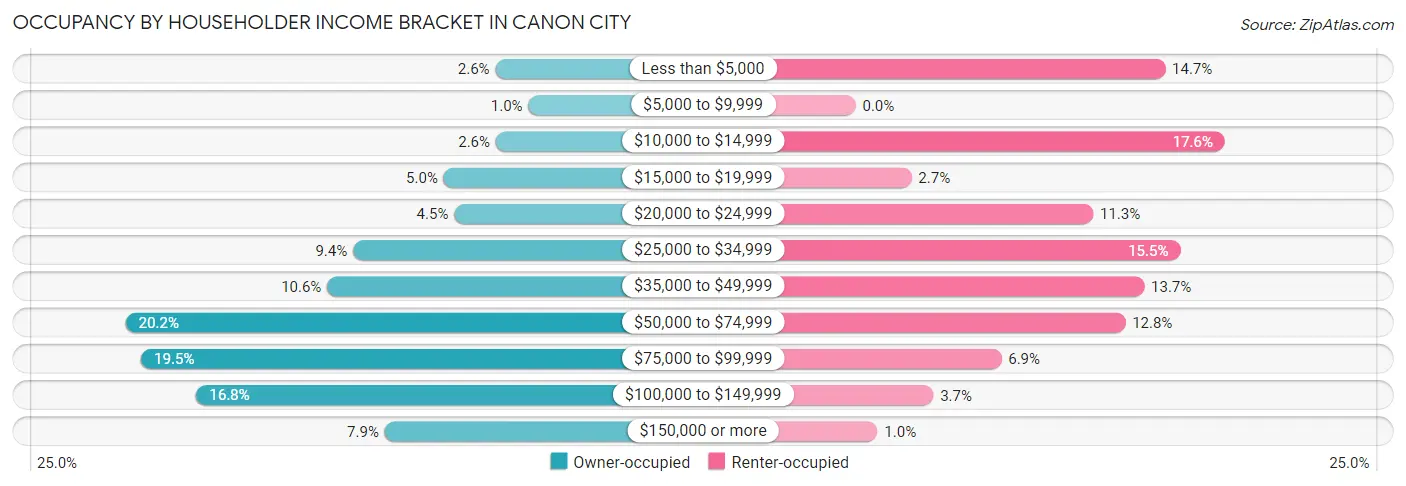
| Income Bracket | Owner-occupied | Renter-occupied |
| Less than $5,000 | 128 (2.6%) | 327 (14.7%) |
| $5,000 to $9,999 | 50 (1.0%) | 0 (0.0%) |
| $10,000 to $14,999 | 127 (2.6%) | 390 (17.6%) |
| $15,000 to $19,999 | 250 (5.0%) | 59 (2.7%) |
| $20,000 to $24,999 | 225 (4.5%) | 251 (11.3%) |
| $25,000 to $34,999 | 464 (9.4%) | 343 (15.5%) |
| $35,000 to $49,999 | 525 (10.6%) | 305 (13.7%) |
| $50,000 to $74,999 | 1,001 (20.2%) | 285 (12.8%) |
| $75,000 to $99,999 | 964 (19.5%) | 154 (6.9%) |
| $100,000 to $149,999 | 834 (16.8%) | 82 (3.7%) |
| $150,000 or more | 389 (7.9%) | 23 (1.0%) |
| Total | 4,957 (100.0%) | 2,219 (100.0%) |
Monthly Housing Cost Tiers in Canon City
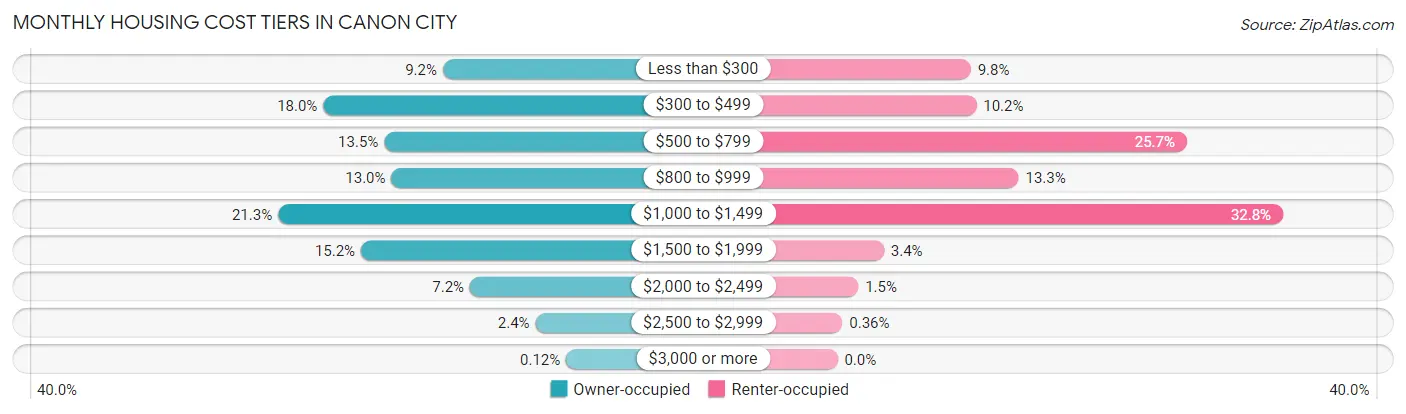
| Monthly Cost | Owner-occupied | Renter-occupied |
| Less than $300 | 456 (9.2%) | 218 (9.8%) |
| $300 to $499 | 893 (18.0%) | 227 (10.2%) |
| $500 to $799 | 670 (13.5%) | 571 (25.7%) |
| $800 to $999 | 644 (13.0%) | 296 (13.3%) |
| $1,000 to $1,499 | 1,058 (21.3%) | 728 (32.8%) |
| $1,500 to $1,999 | 755 (15.2%) | 76 (3.4%) |
| $2,000 to $2,499 | 357 (7.2%) | 34 (1.5%) |
| $2,500 to $2,999 | 118 (2.4%) | 8 (0.4%) |
| $3,000 or more | 6 (0.1%) | 0 (0.0%) |
| Total | 4,957 (100.0%) | 2,219 (100.0%) |
Physical Housing Characteristics in Canon City
Housing Structures in Canon City
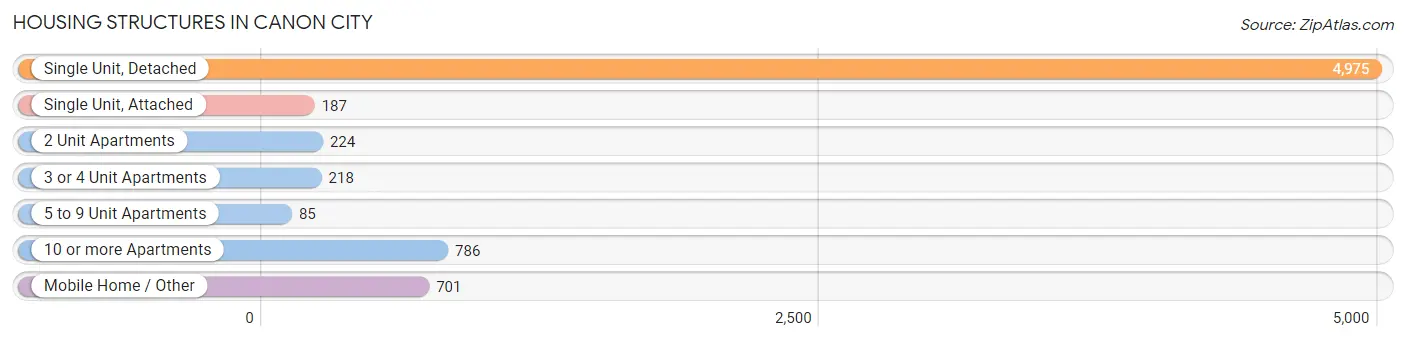
| Structure Type | # Housing Units | % Housing Units |
| Single Unit, Detached | 4,975 | 69.3% |
| Single Unit, Attached | 187 | 2.6% |
| 2 Unit Apartments | 224 | 3.1% |
| 3 or 4 Unit Apartments | 218 | 3.0% |
| 5 to 9 Unit Apartments | 85 | 1.2% |
| 10 or more Apartments | 786 | 11.0% |
| Mobile Home / Other | 701 | 9.8% |
| Total | 7,176 | 100.0% |
Housing Structures by Occupancy in Canon City
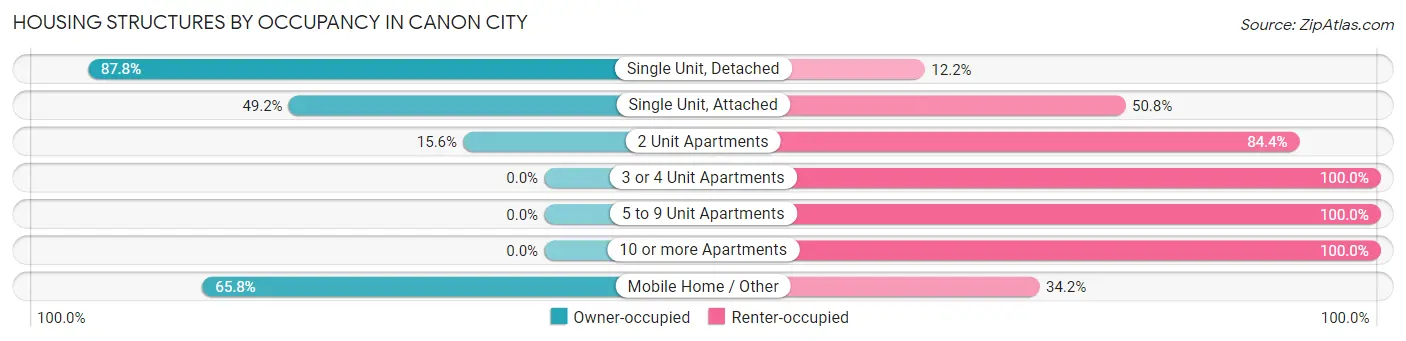
| Structure Type | Owner-occupied | Renter-occupied |
| Single Unit, Detached | 4,369 (87.8%) | 606 (12.2%) |
| Single Unit, Attached | 92 (49.2%) | 95 (50.8%) |
| 2 Unit Apartments | 35 (15.6%) | 189 (84.4%) |
| 3 or 4 Unit Apartments | 0 (0.0%) | 218 (100.0%) |
| 5 to 9 Unit Apartments | 0 (0.0%) | 85 (100.0%) |
| 10 or more Apartments | 0 (0.0%) | 786 (100.0%) |
| Mobile Home / Other | 461 (65.8%) | 240 (34.2%) |
| Total | 4,957 (69.1%) | 2,219 (30.9%) |
Housing Structures by Number of Rooms in Canon City
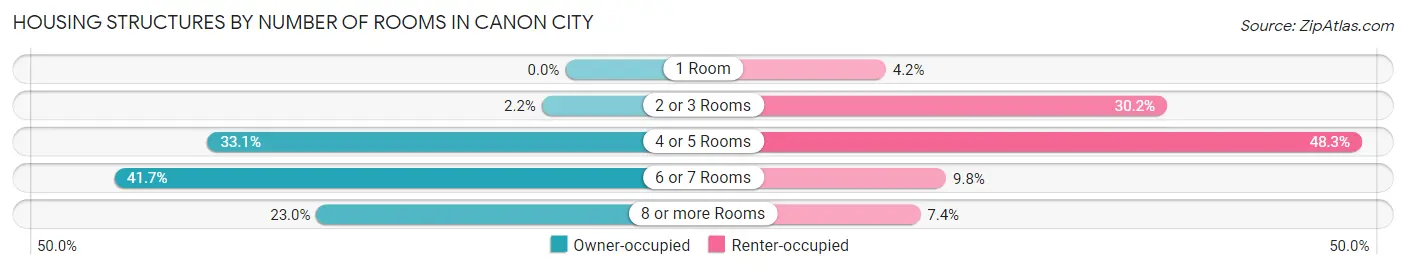
| Number of Rooms | Owner-occupied | Renter-occupied |
| 1 Room | 0 (0.0%) | 94 (4.2%) |
| 2 or 3 Rooms | 108 (2.2%) | 671 (30.2%) |
| 4 or 5 Rooms | 1,640 (33.1%) | 1,071 (48.3%) |
| 6 or 7 Rooms | 2,068 (41.7%) | 218 (9.8%) |
| 8 or more Rooms | 1,141 (23.0%) | 165 (7.4%) |
| Total | 4,957 (100.0%) | 2,219 (100.0%) |
Housing Structure by Heating Type in Canon City
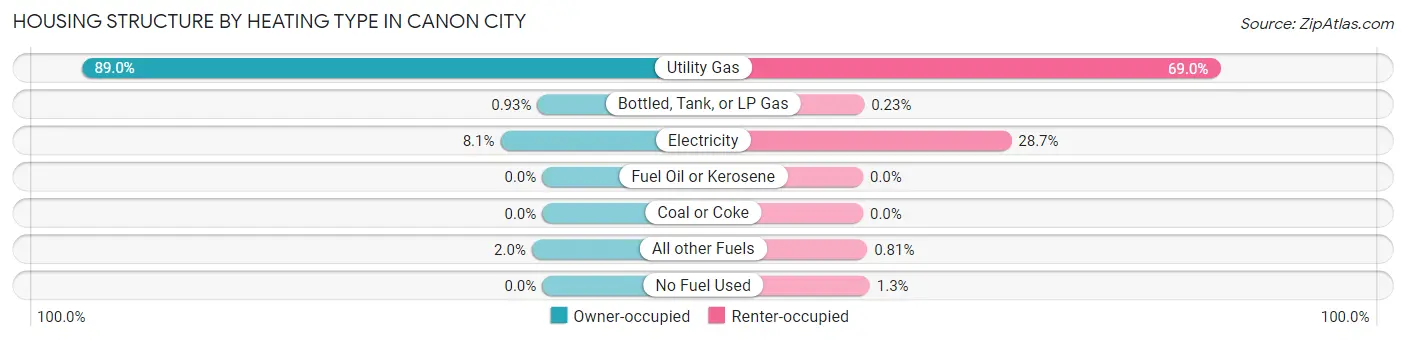
| Heating Type | Owner-occupied | Renter-occupied |
| Utility Gas | 4,412 (89.0%) | 1,531 (69.0%) |
| Bottled, Tank, or LP Gas | 46 (0.9%) | 5 (0.2%) |
| Electricity | 400 (8.1%) | 636 (28.7%) |
| Fuel Oil or Kerosene | 0 (0.0%) | 0 (0.0%) |
| Coal or Coke | 0 (0.0%) | 0 (0.0%) |
| All other Fuels | 99 (2.0%) | 18 (0.8%) |
| No Fuel Used | 0 (0.0%) | 29 (1.3%) |
| Total | 4,957 (100.0%) | 2,219 (100.0%) |
Household Vehicle Usage in Canon City
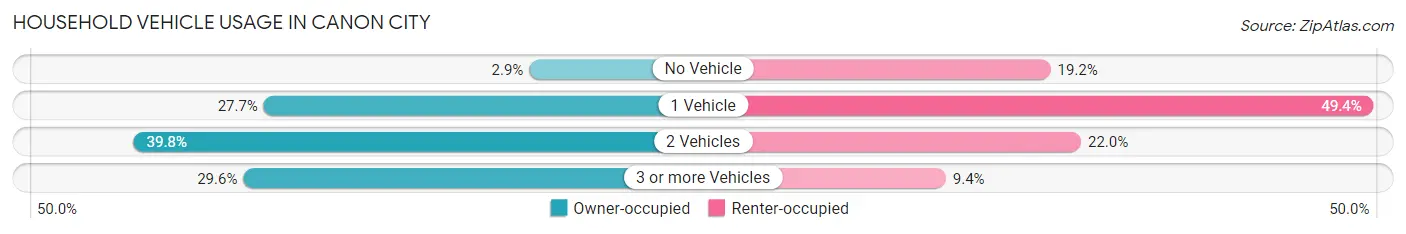
| Vehicles per Household | Owner-occupied | Renter-occupied |
| No Vehicle | 144 (2.9%) | 426 (19.2%) |
| 1 Vehicle | 1,372 (27.7%) | 1,095 (49.3%) |
| 2 Vehicles | 1,974 (39.8%) | 489 (22.0%) |
| 3 or more Vehicles | 1,467 (29.6%) | 209 (9.4%) |
| Total | 4,957 (100.0%) | 2,219 (100.0%) |
Real Estate & Mortgages in Canon City
Real Estate and Mortgage Overview in Canon City
| Characteristic | Without Mortgage | With Mortgage |
| Housing Units | 1,913 | 3,044 |
| Median Property Value | $265,300 | $260,600 |
| Median Household Income | $60,709 | $307 |
| Monthly Housing Costs | $429 | $6 |
| Real Estate Taxes | $1,012 | $87 |
Property Value by Mortgage Status in Canon City
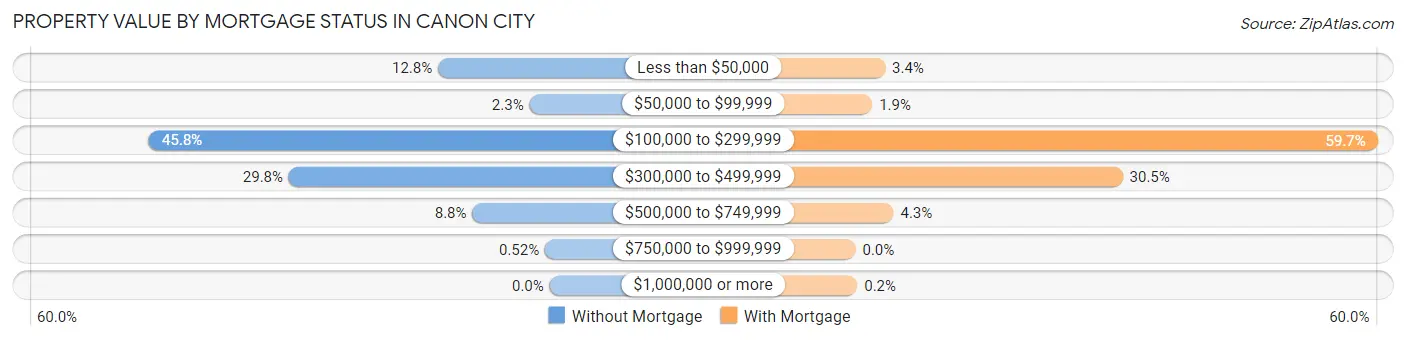
| Property Value | Without Mortgage | With Mortgage |
| Less than $50,000 | 244 (12.8%) | 103 (3.4%) |
| $50,000 to $99,999 | 44 (2.3%) | 58 (1.9%) |
| $100,000 to $299,999 | 876 (45.8%) | 1,816 (59.7%) |
| $300,000 to $499,999 | 570 (29.8%) | 929 (30.5%) |
| $500,000 to $749,999 | 169 (8.8%) | 132 (4.3%) |
| $750,000 to $999,999 | 10 (0.5%) | 0 (0.0%) |
| $1,000,000 or more | 0 (0.0%) | 6 (0.2%) |
| Total | 1,913 (100.0%) | 3,044 (100.0%) |
Household Income by Mortgage Status in Canon City
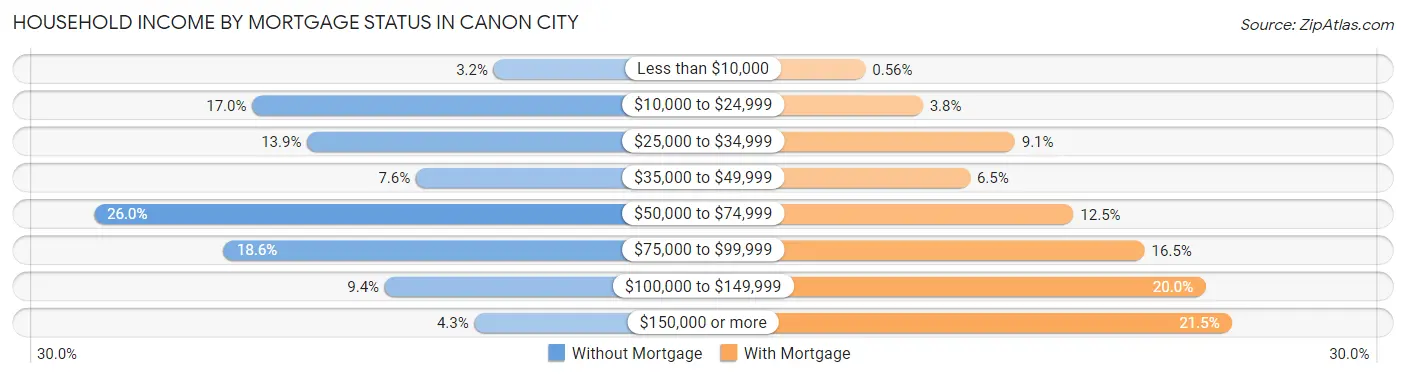
| Household Income | Without Mortgage | With Mortgage |
| Less than $10,000 | 61 (3.2%) | 17 (0.6%) |
| $10,000 to $24,999 | 325 (17.0%) | 117 (3.8%) |
| $25,000 to $34,999 | 265 (13.9%) | 277 (9.1%) |
| $35,000 to $49,999 | 146 (7.6%) | 199 (6.5%) |
| $50,000 to $74,999 | 498 (26.0%) | 379 (12.4%) |
| $75,000 to $99,999 | 356 (18.6%) | 503 (16.5%) |
| $100,000 to $149,999 | 180 (9.4%) | 608 (20.0%) |
| $150,000 or more | 82 (4.3%) | 654 (21.5%) |
| Total | 1,913 (100.0%) | 3,044 (100.0%) |
Property Value to Household Income Ratio in Canon City
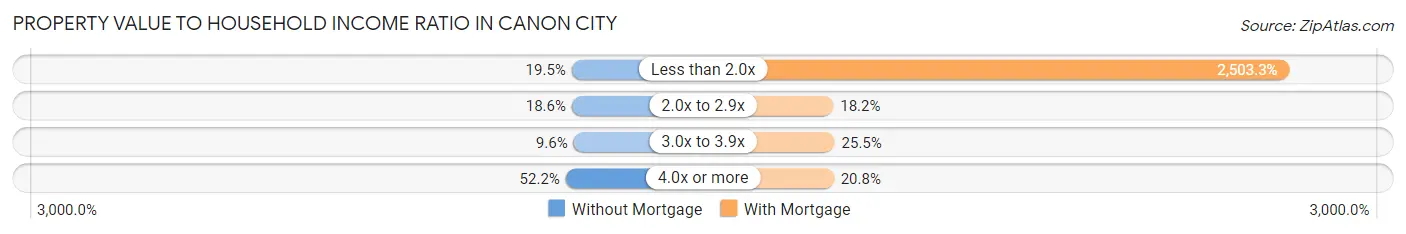
| Value-to-Income Ratio | Without Mortgage | With Mortgage |
| Less than 2.0x | 373 (19.5%) | 76,199 (2,503.2%) |
| 2.0x to 2.9x | 356 (18.6%) | 554 (18.2%) |
| 3.0x to 3.9x | 183 (9.6%) | 775 (25.5%) |
| 4.0x or more | 999 (52.2%) | 634 (20.8%) |
| Total | 1,913 (100.0%) | 3,044 (100.0%) |
Real Estate Taxes by Mortgage Status in Canon City
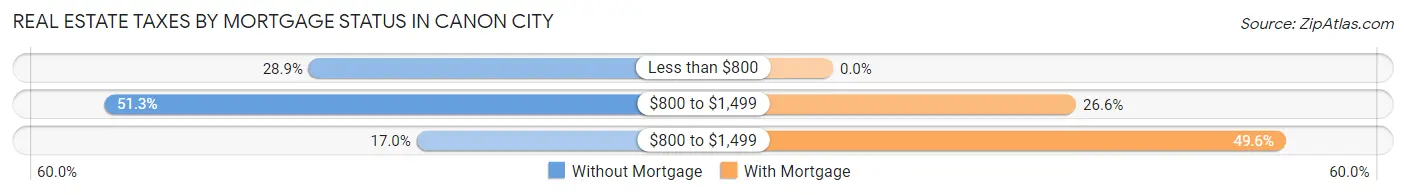
| Property Taxes | Without Mortgage | With Mortgage |
| Less than $800 | 552 (28.9%) | 0 (0.0%) |
| $800 to $1,499 | 981 (51.3%) | 811 (26.6%) |
| $800 to $1,499 | 326 (17.0%) | 1,510 (49.6%) |
| Total | 1,913 (100.0%) | 3,044 (100.0%) |
Health & Disability in Canon City
Health Insurance Coverage by Age in Canon City
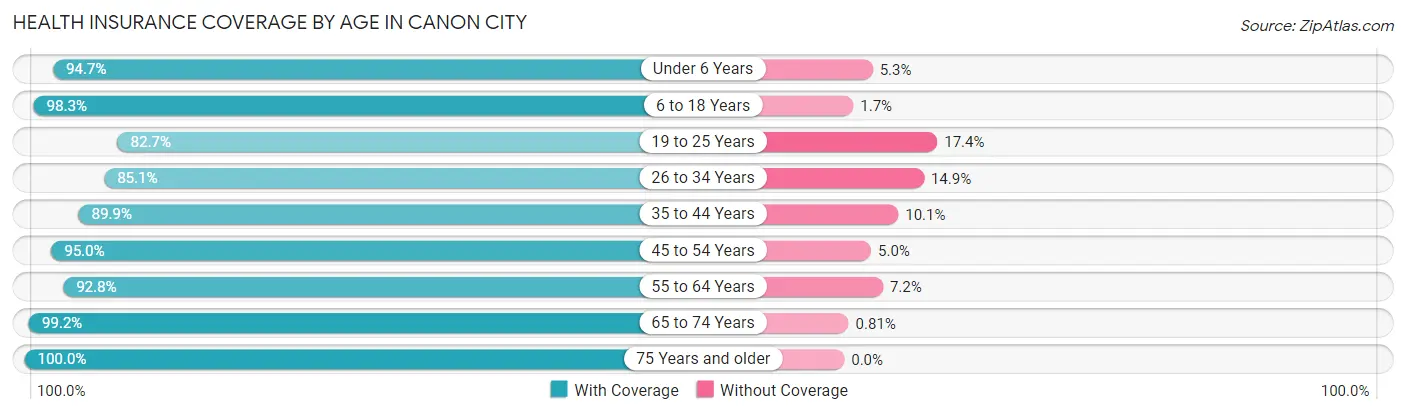
| Age Bracket | With Coverage | Without Coverage |
| Under 6 Years | 1,037 (94.7%) | 58 (5.3%) |
| 6 to 18 Years | 2,557 (98.3%) | 44 (1.7%) |
| 19 to 25 Years | 943 (82.7%) | 198 (17.3%) |
| 26 to 34 Years | 1,558 (85.1%) | 272 (14.9%) |
| 35 to 44 Years | 1,268 (89.9%) | 142 (10.1%) |
| 45 to 54 Years | 1,810 (95.0%) | 95 (5.0%) |
| 55 to 64 Years | 2,085 (92.8%) | 162 (7.2%) |
| 65 to 74 Years | 1,970 (99.2%) | 16 (0.8%) |
| 75 Years and older | 1,825 (100.0%) | 0 (0.0%) |
| Total | 15,053 (93.9%) | 987 (6.1%) |
Health Insurance Coverage by Citizenship Status in Canon City
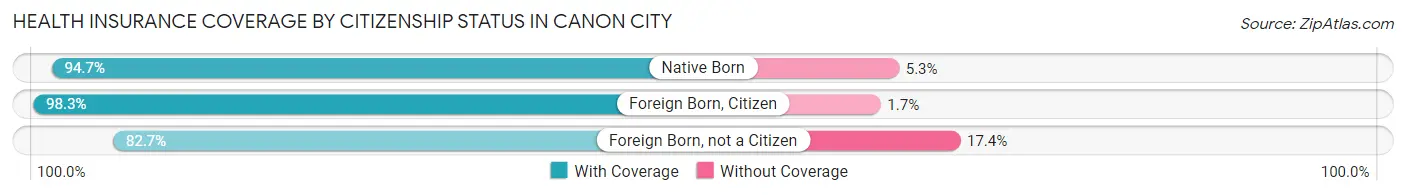
| Citizenship Status | With Coverage | Without Coverage |
| Native Born | 1,037 (94.7%) | 58 (5.3%) |
| Foreign Born, Citizen | 2,557 (98.3%) | 44 (1.7%) |
| Foreign Born, not a Citizen | 943 (82.7%) | 198 (17.3%) |
Health Insurance Coverage by Household Income in Canon City
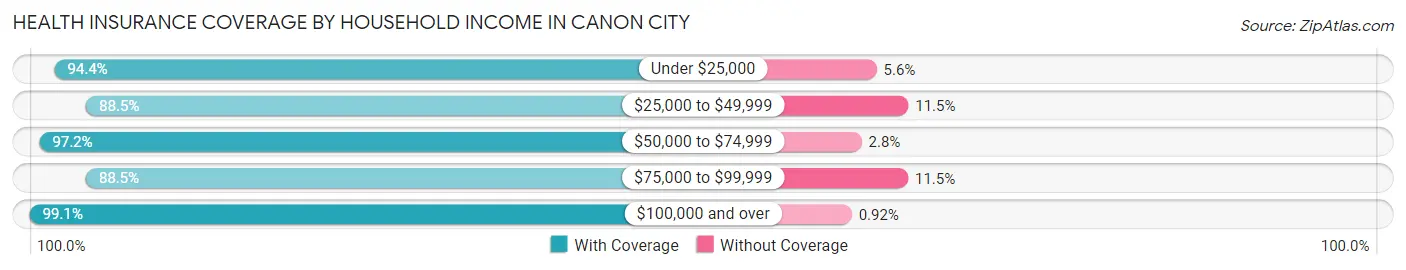
| Household Income | With Coverage | Without Coverage |
| Under $25,000 | 2,666 (94.4%) | 158 (5.6%) |
| $25,000 to $49,999 | 2,473 (88.5%) | 322 (11.5%) |
| $50,000 to $74,999 | 3,014 (97.2%) | 86 (2.8%) |
| $75,000 to $99,999 | 2,971 (88.5%) | 385 (11.5%) |
| $100,000 and over | 3,868 (99.1%) | 36 (0.9%) |
Public vs Private Health Insurance Coverage by Age in Canon City
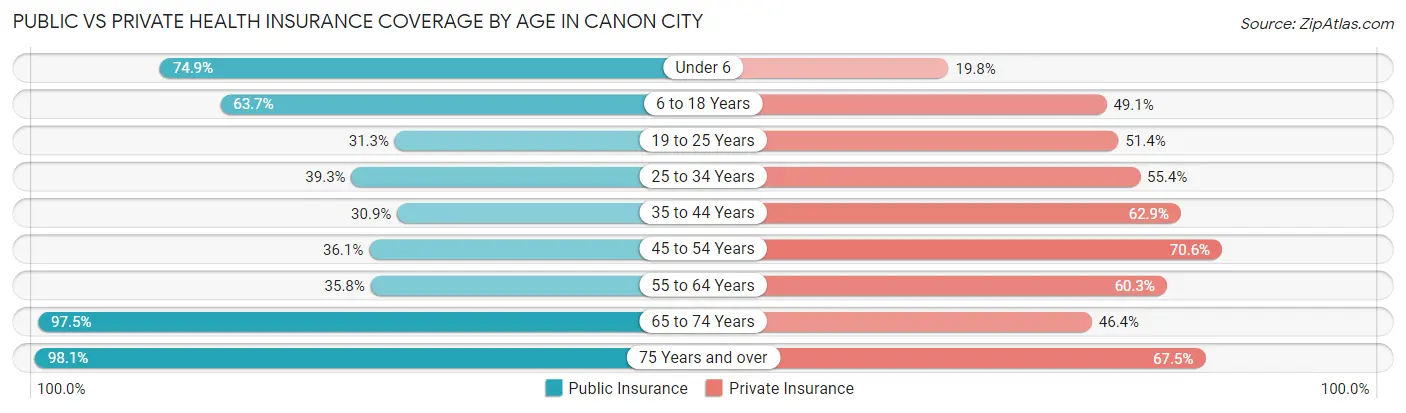
| Age Bracket | Public Insurance | Private Insurance |
| Under 6 | 820 (74.9%) | 217 (19.8%) |
| 6 to 18 Years | 1,656 (63.7%) | 1,278 (49.1%) |
| 19 to 25 Years | 357 (31.3%) | 586 (51.4%) |
| 25 to 34 Years | 720 (39.3%) | 1,013 (55.4%) |
| 35 to 44 Years | 435 (30.8%) | 887 (62.9%) |
| 45 to 54 Years | 687 (36.1%) | 1,344 (70.6%) |
| 55 to 64 Years | 804 (35.8%) | 1,355 (60.3%) |
| 65 to 74 Years | 1,936 (97.5%) | 922 (46.4%) |
| 75 Years and over | 1,790 (98.1%) | 1,231 (67.4%) |
| Total | 9,205 (57.4%) | 8,833 (55.1%) |
Disability Status by Sex by Age in Canon City
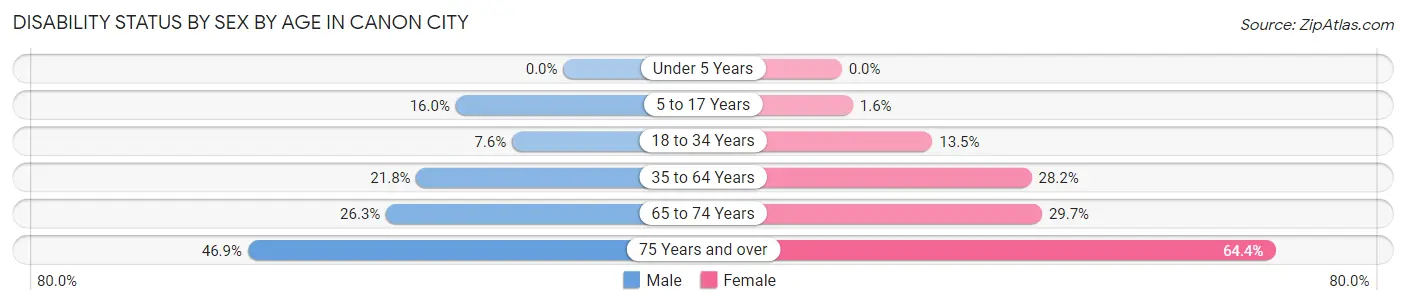
| Age Bracket | Male | Female |
| Under 5 Years | 0 (0.0%) | 0 (0.0%) |
| 5 to 17 Years | 233 (16.0%) | 20 (1.6%) |
| 18 to 34 Years | 136 (7.6%) | 170 (13.5%) |
| 35 to 64 Years | 549 (21.8%) | 858 (28.2%) |
| 65 to 74 Years | 226 (26.3%) | 335 (29.7%) |
| 75 Years and over | 336 (46.9%) | 713 (64.3%) |
Disability Class by Sex by Age in Canon City
Disability Class: Hearing Difficulty
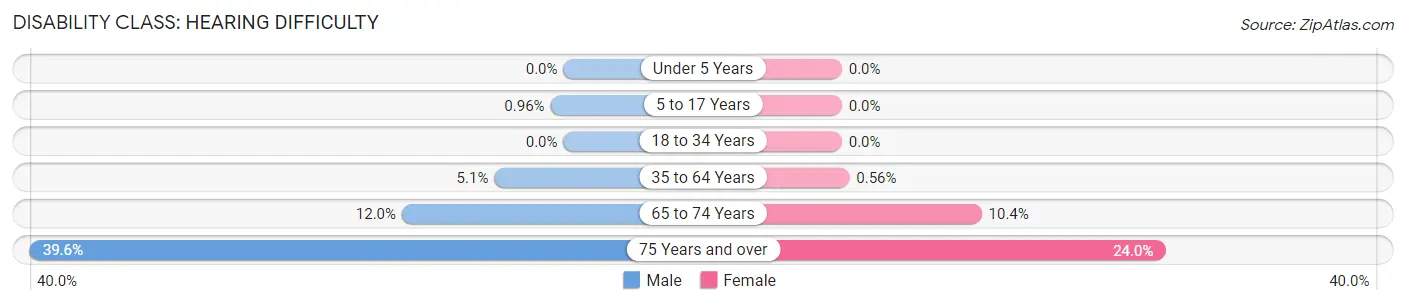
| Age Bracket | Male | Female |
| Under 5 Years | 0 (0.0%) | 0 (0.0%) |
| 5 to 17 Years | 14 (1.0%) | 0 (0.0%) |
| 18 to 34 Years | 0 (0.0%) | 0 (0.0%) |
| 35 to 64 Years | 129 (5.1%) | 17 (0.6%) |
| 65 to 74 Years | 103 (12.0%) | 117 (10.4%) |
| 75 Years and over | 284 (39.6%) | 266 (24.0%) |
Disability Class: Vision Difficulty
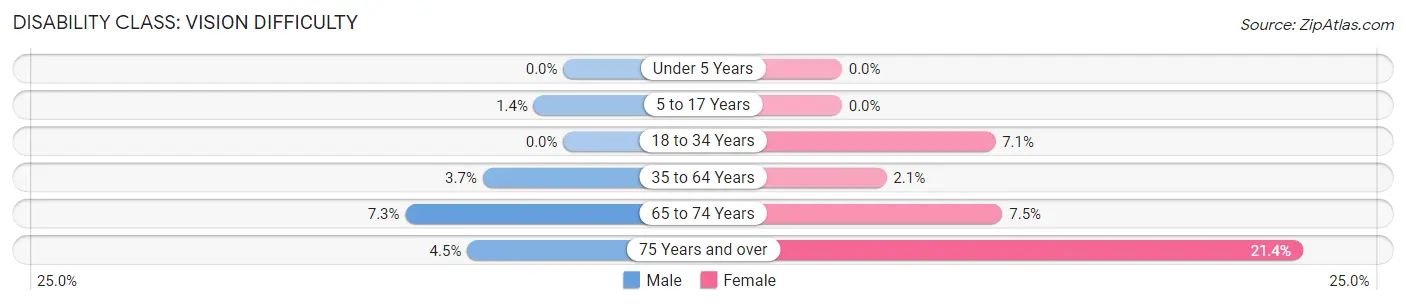
| Age Bracket | Male | Female |
| Under 5 Years | 0 (0.0%) | 0 (0.0%) |
| 5 to 17 Years | 20 (1.4%) | 0 (0.0%) |
| 18 to 34 Years | 0 (0.0%) | 90 (7.1%) |
| 35 to 64 Years | 94 (3.7%) | 63 (2.1%) |
| 65 to 74 Years | 63 (7.3%) | 84 (7.4%) |
| 75 Years and over | 32 (4.5%) | 237 (21.4%) |
Disability Class: Cognitive Difficulty
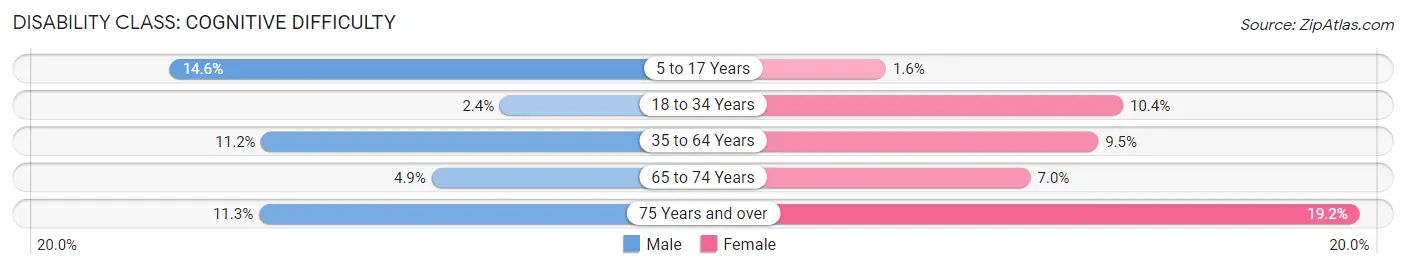
| Age Bracket | Male | Female |
| 5 to 17 Years | 213 (14.6%) | 20 (1.6%) |
| 18 to 34 Years | 42 (2.4%) | 132 (10.4%) |
| 35 to 64 Years | 282 (11.2%) | 290 (9.5%) |
| 65 to 74 Years | 42 (4.9%) | 79 (7.0%) |
| 75 Years and over | 81 (11.3%) | 213 (19.2%) |
Disability Class: Ambulatory Difficulty
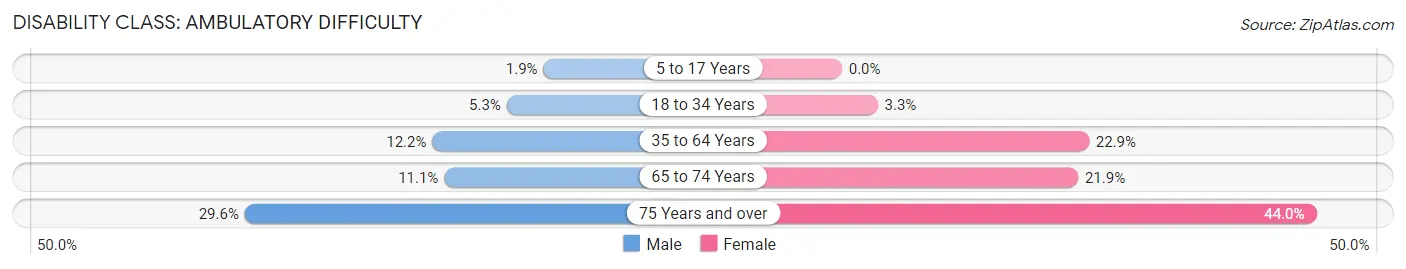
| Age Bracket | Male | Female |
| 5 to 17 Years | 27 (1.8%) | 0 (0.0%) |
| 18 to 34 Years | 94 (5.3%) | 42 (3.3%) |
| 35 to 64 Years | 306 (12.2%) | 698 (22.9%) |
| 65 to 74 Years | 95 (11.1%) | 247 (21.9%) |
| 75 Years and over | 212 (29.6%) | 488 (44.0%) |
Disability Class: Self-Care Difficulty
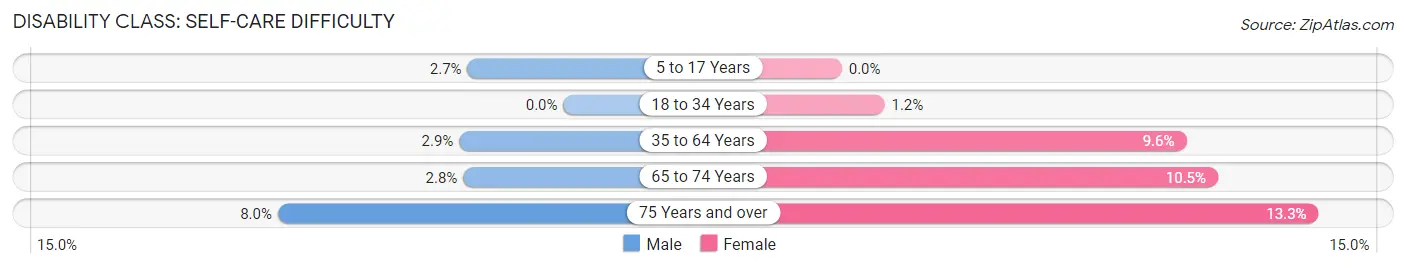
| Age Bracket | Male | Female |
| 5 to 17 Years | 39 (2.7%) | 0 (0.0%) |
| 18 to 34 Years | 0 (0.0%) | 15 (1.2%) |
| 35 to 64 Years | 73 (2.9%) | 292 (9.6%) |
| 65 to 74 Years | 24 (2.8%) | 118 (10.5%) |
| 75 Years and over | 57 (8.0%) | 147 (13.3%) |
Technology Access in Canon City
Computing Device Access in Canon City
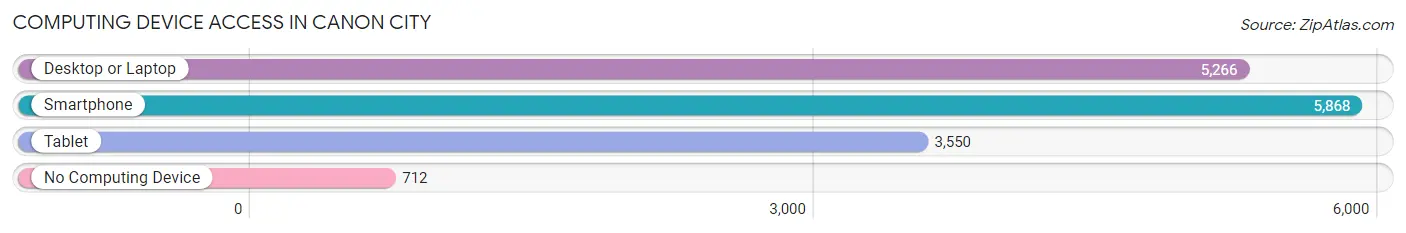
| Device Type | # Households | % Households |
| Desktop or Laptop | 5,266 | 73.4% |
| Smartphone | 5,868 | 81.8% |
| Tablet | 3,550 | 49.5% |
| No Computing Device | 712 | 9.9% |
| Total | 7,176 | 100.0% |
Internet Access in Canon City
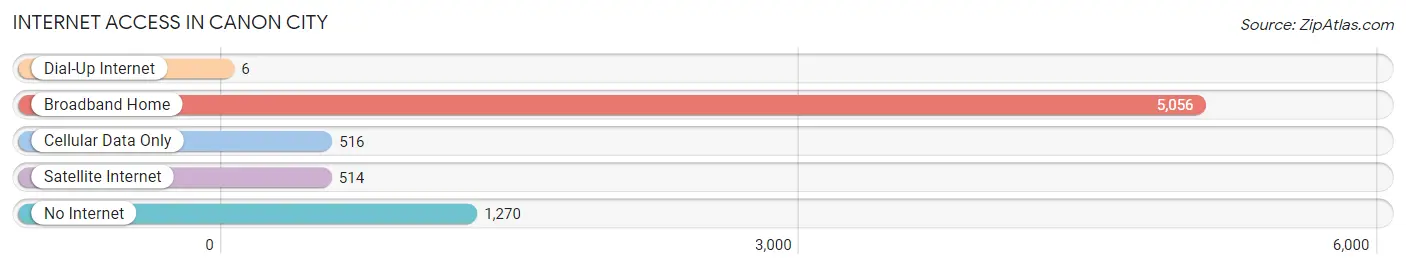
| Internet Type | # Households | % Households |
| Dial-Up Internet | 6 | 0.1% |
| Broadband Home | 5,056 | 70.5% |
| Cellular Data Only | 516 | 7.2% |
| Satellite Internet | 514 | 7.2% |
| No Internet | 1,270 | 17.7% |
| Total | 7,176 | 100.0% |
Canon City Summary
Canon City is a city located in Fremont County, Colorado, United States. The city is situated along the Arkansas River in the foothills of the Rocky Mountains. As of the 2010 census, the population of Canon City was 16,400.
History
The area that is now Canon City was first inhabited by the Ute people, who lived in the area for centuries before the arrival of European settlers. The first Europeans to settle in the area were miners and ranchers, who arrived in the late 19th century. The town was founded in 1858 by a group of miners who named it Canon City after the nearby Canon de la Almagra, a deep canyon carved by the Arkansas River.
The town quickly grew, and by the 1880s it had become a major center for mining and ranching. The town was incorporated in 1872, and by the turn of the century it had become a major railroad hub, with the Denver and Rio Grande Western Railroad running through the city.
In the early 20th century, Canon City became a popular tourist destination, with many visitors coming to take advantage of the area’s natural beauty. The city also became a center for the arts, with many galleries and museums opening in the area.
Geography
Canon City is located in the foothills of the Rocky Mountains, at the confluence of the Arkansas River and Fourmile Creek. The city is situated at an elevation of 5,541 feet (1,689 m).
The city covers an area of 8.3 square miles (21.5 km2), of which 8.2 square miles (21.3 km2) is land and 0.1 square miles (0.2 km2) is water.
Economy
Canon City’s economy is largely based on tourism, with many visitors coming to take advantage of the area’s natural beauty. The city is also home to several manufacturing companies, including a paper mill, a steel mill, and a cement plant.
The city is also home to several educational institutions, including the University of Colorado at Colorado Springs, Pikes Peak Community College, and the Colorado School of Mines.
Demographics
As of the 2010 census, there were 16,400 people, 6,845 households, and 4,092 families residing in the city. The population density was 1,972.3 people per square mile (761.2/km2). There were 7,541 housing units at an average density of 912.2 per square mile (352.3/km2).
The racial makeup of the city was 87.2% White, 0.7% African American, 1.2% Native American, 0.7% Asian, 0.1% Pacific Islander, 8.2% from other races, and 2.0% from two or more races. Hispanic or Latino of any race were 16.3% of the population.
The median income for a household in the city was $35,945, and the median income for a family was $45,945. Males had a median income of $32,945 versus $25,945 for females. The per capita income for the city was $19,945. About 11.2% of families and 14.2% of the population were below the poverty line, including 19.2% of those under age 18 and 8.2% of those age 65 or over.
Common Questions
What is Per Capita Income in Canon City?
Per Capita income in Canon City is $27,824.
What is the Median Family Income in Canon City?
Median Family Income in Canon City is $76,270.
What is the Median Household income in Canon City?
Median Household Income in Canon City is $54,308.
What is Income or Wage Gap in Canon City?
Income or Wage Gap in Canon City is 39.4%.
Women in Canon City earn 60.6 cents for every dollar earned by a man.
What is Inequality or Gini Index in Canon City?
Inequality or Gini Index in Canon City is 0.43.
What is the Total Population of Canon City?
Total Population of Canon City is 17,059.
What is the Total Male Population of Canon City?
Total Male Population of Canon City is 8,725.
What is the Total Female Population of Canon City?
Total Female Population of Canon City is 8,334.
What is the Ratio of Males per 100 Females in Canon City?
There are 104.69 Males per 100 Females in Canon City.
What is the Ratio of Females per 100 Males in Canon City?
There are 95.52 Females per 100 Males in Canon City.
What is the Median Population Age in Canon City?
Median Population Age in Canon City is 44.8 Years.
What is the Average Family Size in Canon City
Average Family Size in Canon City is 3.0 People.
What is the Average Household Size in Canon City
Average Household Size in Canon City is 2.2 People.
How Large is the Labor Force in Canon City?
There are 6,880 People in the Labor Forcein in Canon City.
What is the Percentage of People in the Labor Force in Canon City?
49.4% of People are in the Labor Force in Canon City.
What is the Unemployment Rate in Canon City?
Unemployment Rate in Canon City is 4.8%.