Burlington, CO Map & Demographics
Burlington Map
Burlington Overview
$35,799
PER CAPITA INCOME
$75,592
AVG FAMILY INCOME
$61,528
AVG HOUSEHOLD INCOME
49.8%
WAGE / INCOME GAP [ % ]
50.2¢/ $1
WAGE / INCOME GAP [ $ ]
0.42
INEQUALITY / GINI INDEX
3,184
TOTAL POPULATION
1,527
MALE POPULATION
1,657
FEMALE POPULATION
92.15
MALES / 100 FEMALES
108.51
FEMALES / 100 MALES
39.8
MEDIAN AGE
2.8
AVG FAMILY SIZE
2.2
AVG HOUSEHOLD SIZE
1,783
LABOR FORCE [ PEOPLE ]
72.3%
PERCENT IN LABOR FORCE
2.6%
UNEMPLOYMENT RATE
Burlington Zip Codes
Burlington Area Codes
Income in Burlington
Income Overview in Burlington
Per Capita Income in Burlington is $35,799, while median incomes of families and households are $75,592 and $61,528 respectively.
| Characteristic | Number | Measure |
| Per Capita Income | 3,184 | $35,799 |
| Median Family Income | 916 | $75,592 |
| Mean Family Income | 916 | $96,213 |
| Median Household Income | 1,397 | $61,528 |
| Mean Household Income | 1,397 | $84,630 |
| Income Deficit | 916 | $0 |
| Wage / Income Gap (%) | 3,184 | 49.81% |
| Wage / Income Gap ($) | 3,184 | 50.19¢ per $1 |
| Gini / Inequality Index | 3,184 | 0.42 |
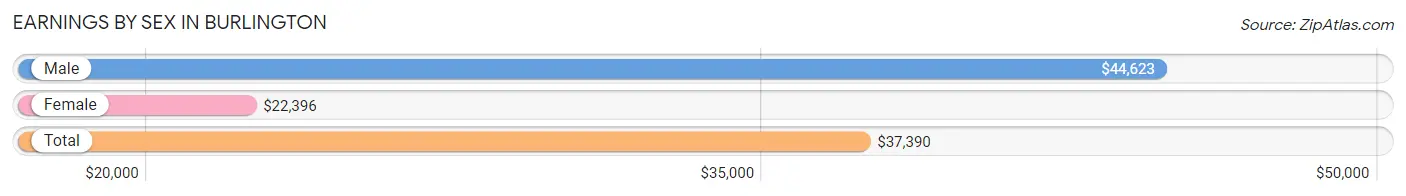
Earnings by Sex in Burlington
Average Earnings in Burlington are $37,390, $44,623 for men and $22,396 for women, a difference of 49.8%.
| Sex | Number | Average Earnings |
| Male | 933 (48.7%) | $44,623 |
| Female | 983 (51.3%) | $22,396 |
| Total | 1,916 (100.0%) | $37,390 |
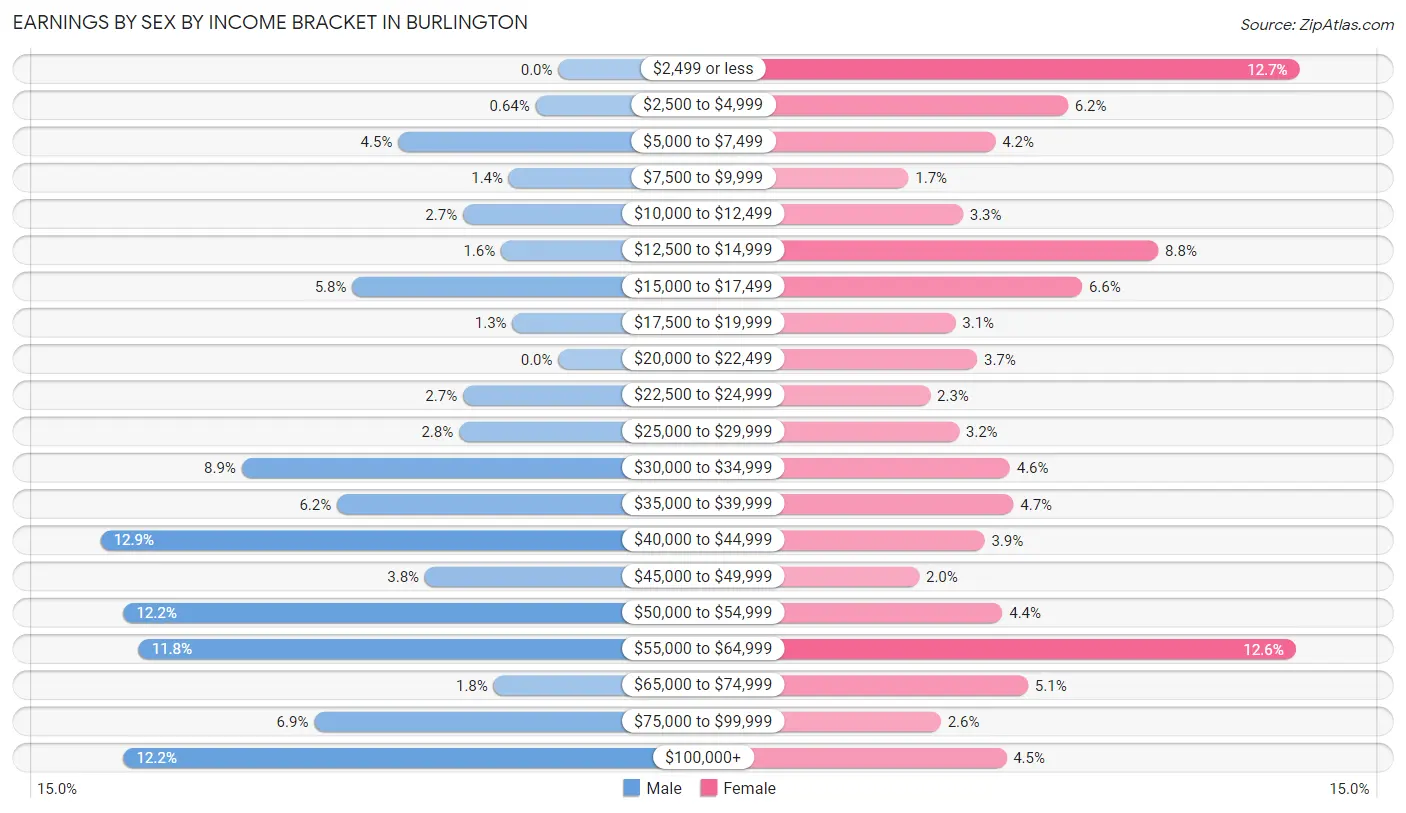
Earnings by Sex by Income Bracket in Burlington
The most common earnings brackets in Burlington are $40,000 to $44,999 for men (120 | 12.9%) and $2,499 or less for women (125 | 12.7%).
| Income | Male | Female |
| $2,499 or less | 0 (0.0%) | 125 (12.7%) |
| $2,500 to $4,999 | 6 (0.6%) | 61 (6.2%) |
| $5,000 to $7,499 | 42 (4.5%) | 41 (4.2%) |
| $7,500 to $9,999 | 13 (1.4%) | 17 (1.7%) |
| $10,000 to $12,499 | 25 (2.7%) | 32 (3.3%) |
| $12,500 to $14,999 | 15 (1.6%) | 86 (8.7%) |
| $15,000 to $17,499 | 54 (5.8%) | 65 (6.6%) |
| $17,500 to $19,999 | 12 (1.3%) | 30 (3.0%) |
| $20,000 to $22,499 | 0 (0.0%) | 36 (3.7%) |
| $22,500 to $24,999 | 25 (2.7%) | 23 (2.3%) |
| $25,000 to $29,999 | 26 (2.8%) | 31 (3.2%) |
| $30,000 to $34,999 | 83 (8.9%) | 45 (4.6%) |
| $35,000 to $39,999 | 58 (6.2%) | 46 (4.7%) |
| $40,000 to $44,999 | 120 (12.9%) | 38 (3.9%) |
| $45,000 to $49,999 | 35 (3.7%) | 20 (2.0%) |
| $50,000 to $54,999 | 114 (12.2%) | 43 (4.4%) |
| $55,000 to $64,999 | 110 (11.8%) | 124 (12.6%) |
| $65,000 to $74,999 | 17 (1.8%) | 50 (5.1%) |
| $75,000 to $99,999 | 64 (6.9%) | 26 (2.6%) |
| $100,000+ | 114 (12.2%) | 44 (4.5%) |
| Total | 933 (100.0%) | 983 (100.0%) |
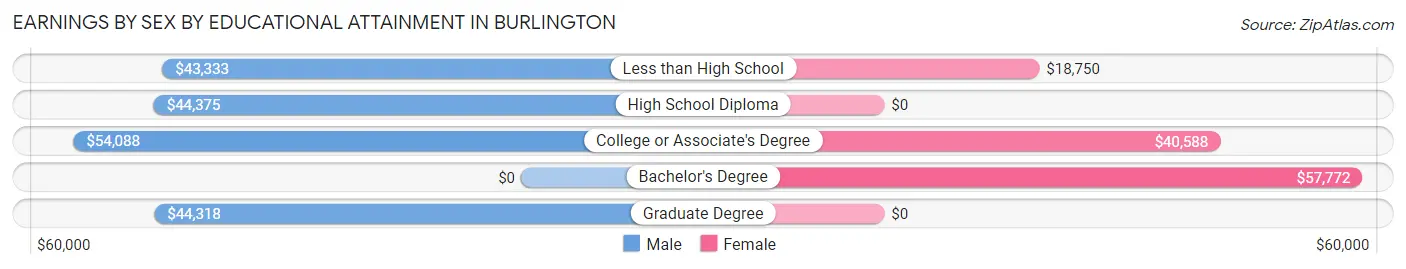
Earnings by Sex by Educational Attainment in Burlington
Average earnings in Burlington are $52,279 for men and $34,150 for women, a difference of 34.7%. Men with an educational attainment of college or associate's degree enjoy the highest average annual earnings of $54,088, while those with less than high school education earn the least with $43,333. Women with an educational attainment of bachelor's degree earn the most with the average annual earnings of $57,772, while those with less than high school education have the smallest earnings of $18,750.
| Educational Attainment | Male Income | Female Income |
| Less than High School | $43,333 | $18,750 |
| High School Diploma | $44,375 | $0 |
| College or Associate's Degree | $54,088 | $40,588 |
| Bachelor's Degree | - | - |
| Graduate Degree | $44,318 | $0 |
| Total | $52,279 | $34,150 |
Family Income in Burlington
Family Income Brackets in Burlington
According to the Burlington family income data, there are 229 families falling into the $50,000 to $74,999 income range, which is the most common income bracket and makes up 25.0% of all families. Conversely, the less than $10,000 income bracket is the least frequent group with only 7 families (0.8%) belonging to this category.
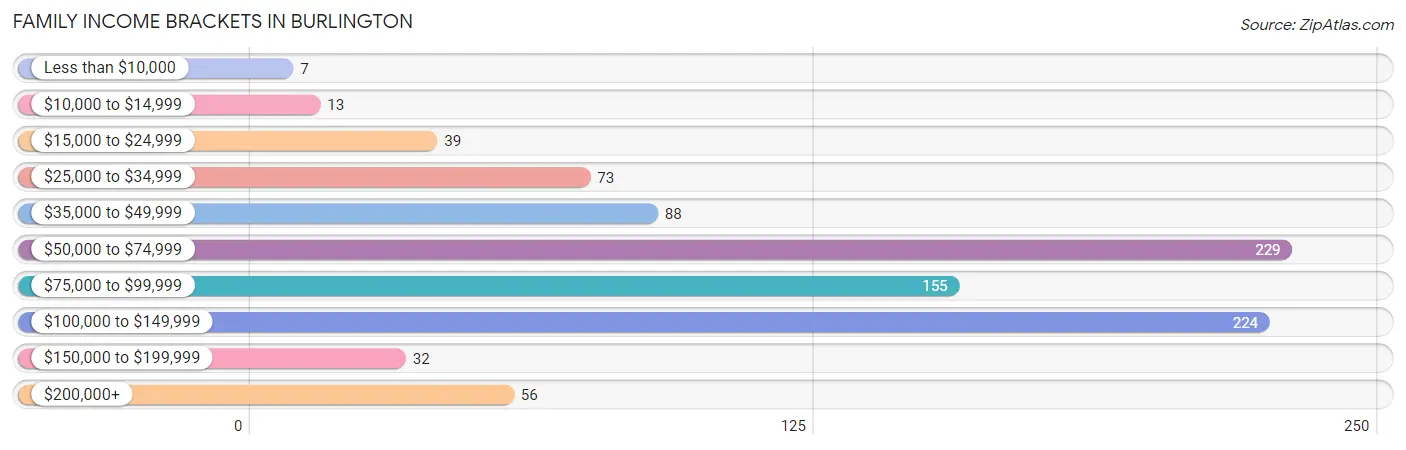
| Income Bracket | # Families | % Families |
| Less than $10,000 | 7 | 0.8% |
| $10,000 to $14,999 | 13 | 1.4% |
| $15,000 to $24,999 | 39 | 4.3% |
| $25,000 to $34,999 | 73 | 8.0% |
| $35,000 to $49,999 | 88 | 9.6% |
| $50,000 to $74,999 | 229 | 25.0% |
| $75,000 to $99,999 | 155 | 16.9% |
| $100,000 to $149,999 | 224 | 24.5% |
| $150,000 to $199,999 | 32 | 3.5% |
| $200,000+ | 56 | 6.1% |
Family Income by Famaliy Size in Burlington
5-person families (98 | 10.7%) account for the highest median family income in Burlington with $103,750 per family, while 2-person families (460 | 50.2%) have the highest median income of $37,960 per family member.
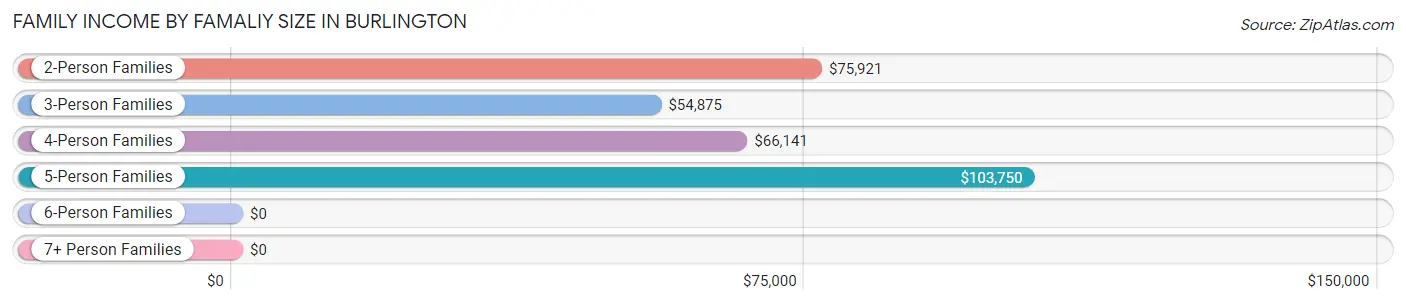
| Income Bracket | # Families | Median Income |
| 2-Person Families | 460 (50.2%) | $75,921 |
| 3-Person Families | 177 (19.3%) | $54,875 |
| 4-Person Families | 181 (19.8%) | $66,141 |
| 5-Person Families | 98 (10.7%) | $103,750 |
| 6-Person Families | 0 (0.0%) | $0 |
| 7+ Person Families | 0 (0.0%) | $0 |
| Total | 916 (100.0%) | $75,592 |
Family Income by Number of Earners in Burlington
The median family income in Burlington is $75,592, with families comprising 3+ earners (106) having the highest median family income of $103,233, while families with no earners (92) have the lowest median family income of $35,938, accounting for 11.6% and 10.0% of families, respectively.
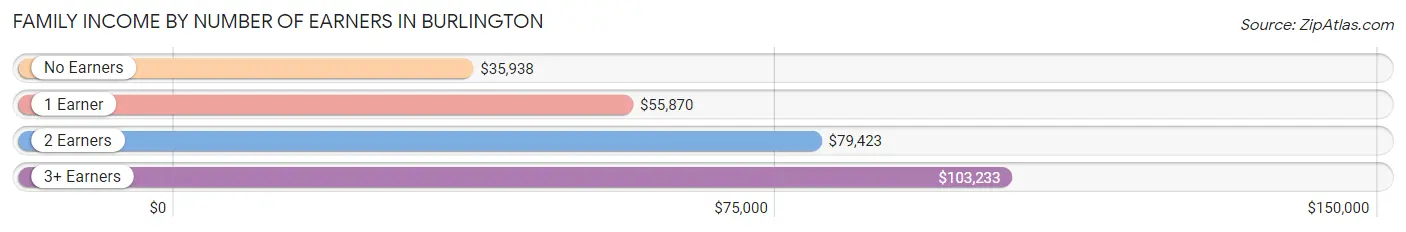
| Number of Earners | # Families | Median Income |
| No Earners | 92 (10.0%) | $35,938 |
| 1 Earner | 232 (25.3%) | $55,870 |
| 2 Earners | 486 (53.1%) | $79,423 |
| 3+ Earners | 106 (11.6%) | $103,233 |
| Total | 916 (100.0%) | $75,592 |
Household Income in Burlington
Household Income Brackets in Burlington
With 326 households falling in the category, the $50,000 to $74,999 income range is the most frequent in Burlington, accounting for 23.3% of all households. In contrast, only 7 households (0.5%) fall into the less than $10,000 income bracket, making it the least populous group.
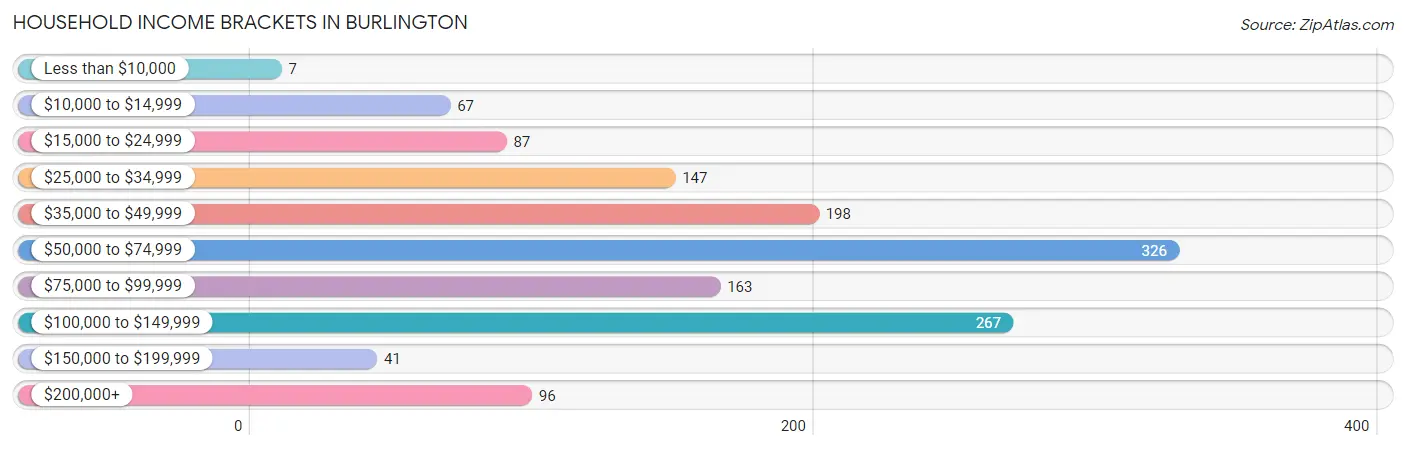
| Income Bracket | # Households | % Households |
| Less than $10,000 | 7 | 0.5% |
| $10,000 to $14,999 | 67 | 4.8% |
| $15,000 to $24,999 | 87 | 6.2% |
| $25,000 to $34,999 | 147 | 10.5% |
| $35,000 to $49,999 | 198 | 14.2% |
| $50,000 to $74,999 | 326 | 23.3% |
| $75,000 to $99,999 | 163 | 11.7% |
| $100,000 to $149,999 | 267 | 19.1% |
| $150,000 to $199,999 | 41 | 2.9% |
| $200,000+ | 96 | 6.9% |
Household Income by Householder Age in Burlington
The median household income in Burlington is $61,528, with the highest median household income of $72,465 found in the 45 to 64 years age bracket for the primary householder. A total of 555 households (39.7%) fall into this category. Meanwhile, the 15 to 24 years age bracket for the primary householder has the lowest median household income of $0, with 114 households (8.2%) in this group.
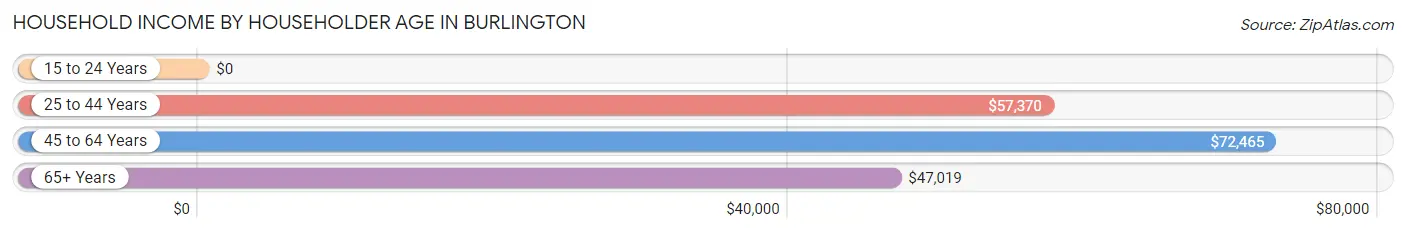
| Income Bracket | # Households | Median Income |
| 15 to 24 Years | 114 (8.2%) | $0 |
| 25 to 44 Years | 457 (32.7%) | $57,370 |
| 45 to 64 Years | 555 (39.7%) | $72,465 |
| 65+ Years | 271 (19.4%) | $47,019 |
| Total | 1,397 (100.0%) | $61,528 |
Poverty in Burlington
Income Below Poverty by Sex and Age in Burlington
With 3.7% poverty level for males and 7.7% for females among the residents of Burlington, 15 year old males and 75 year old and over females are the most vulnerable to poverty, with 10 males (30.3%) and 18 females (17.5%) in their respective age groups living below the poverty level.
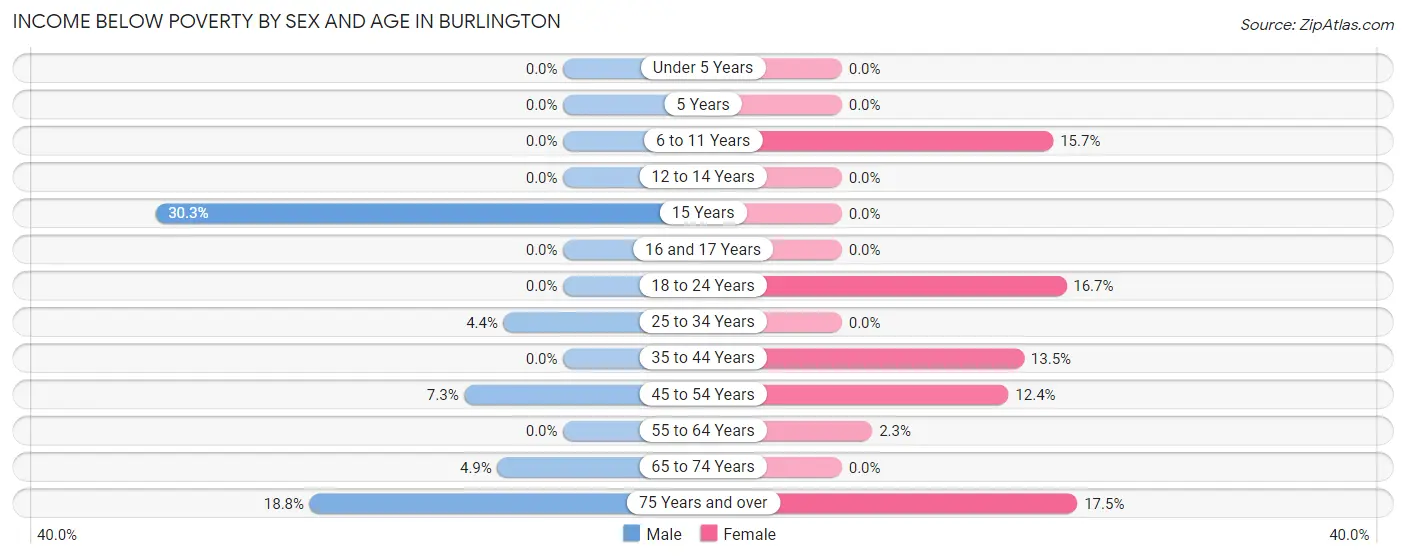
| Age Bracket | Male | Female |
| Under 5 Years | 0 (0.0%) | 0 (0.0%) |
| 5 Years | 0 (0.0%) | 0 (0.0%) |
| 6 to 11 Years | 0 (0.0%) | 19 (15.7%) |
| 12 to 14 Years | 0 (0.0%) | 0 (0.0%) |
| 15 Years | 10 (30.3%) | 0 (0.0%) |
| 16 and 17 Years | 0 (0.0%) | 0 (0.0%) |
| 18 to 24 Years | 0 (0.0%) | 26 (16.7%) |
| 25 to 34 Years | 8 (4.4%) | 0 (0.0%) |
| 35 to 44 Years | 0 (0.0%) | 33 (13.5%) |
| 45 to 54 Years | 13 (7.3%) | 24 (12.4%) |
| 55 to 64 Years | 0 (0.0%) | 6 (2.3%) |
| 65 to 74 Years | 8 (4.9%) | 0 (0.0%) |
| 75 Years and over | 16 (18.8%) | 18 (17.5%) |
| Total | 55 (3.7%) | 126 (7.7%) |
Income Above Poverty by Sex and Age in Burlington
According to the poverty statistics in Burlington, males aged under 5 years and females aged under 5 years are the age groups that are most secure financially, with 100.0% of males and 100.0% of females in these age groups living above the poverty line.
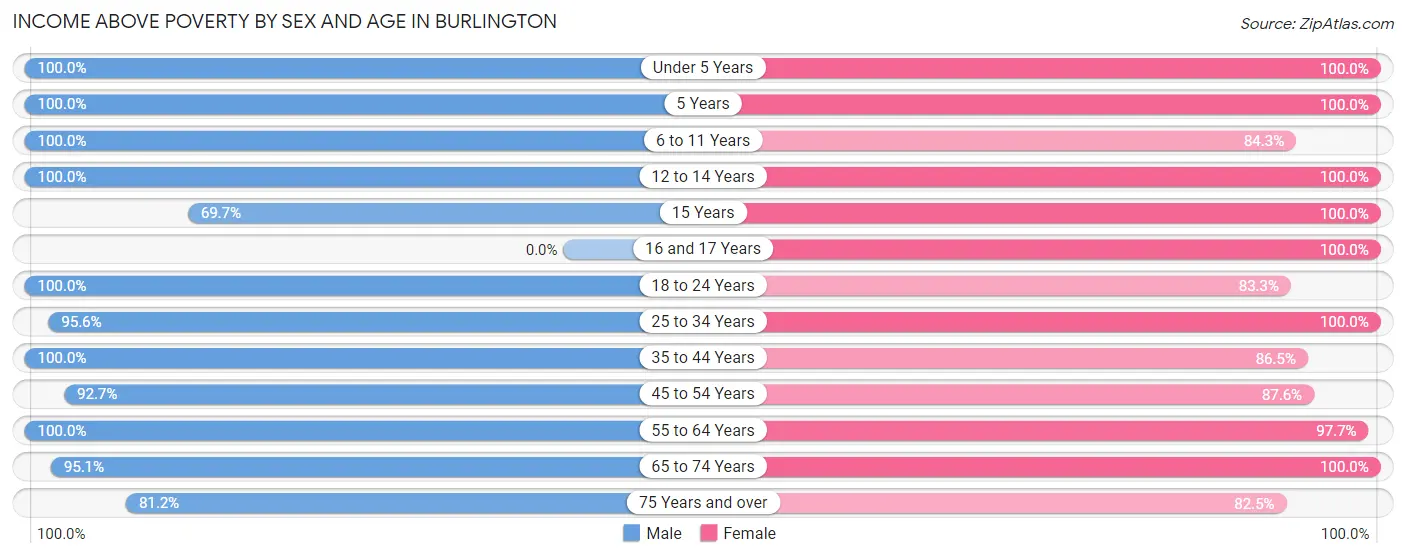
| Age Bracket | Male | Female |
| Under 5 Years | 119 (100.0%) | 63 (100.0%) |
| 5 Years | 26 (100.0%) | 35 (100.0%) |
| 6 to 11 Years | 179 (100.0%) | 102 (84.3%) |
| 12 to 14 Years | 34 (100.0%) | 68 (100.0%) |
| 15 Years | 23 (69.7%) | 33 (100.0%) |
| 16 and 17 Years | 0 (0.0%) | 84 (100.0%) |
| 18 to 24 Years | 126 (100.0%) | 130 (83.3%) |
| 25 to 34 Years | 173 (95.6%) | 115 (100.0%) |
| 35 to 44 Years | 173 (100.0%) | 211 (86.5%) |
| 45 to 54 Years | 164 (92.7%) | 170 (87.6%) |
| 55 to 64 Years | 190 (100.0%) | 260 (97.7%) |
| 65 to 74 Years | 156 (95.1%) | 150 (100.0%) |
| 75 Years and over | 69 (81.2%) | 85 (82.5%) |
| Total | 1,432 (96.3%) | 1,506 (92.3%) |
Income Below Poverty Among Married-Couple Families in Burlington
The poverty statistics for married-couple families in Burlington show that 2.4% or 16 of the total 674 families live below the poverty line. Families with no children have the highest poverty rate of 4.8%, comprising of 16 families. On the other hand, families with 1 or 2 children have the lowest poverty rate of 0.0%, which includes 0 families.
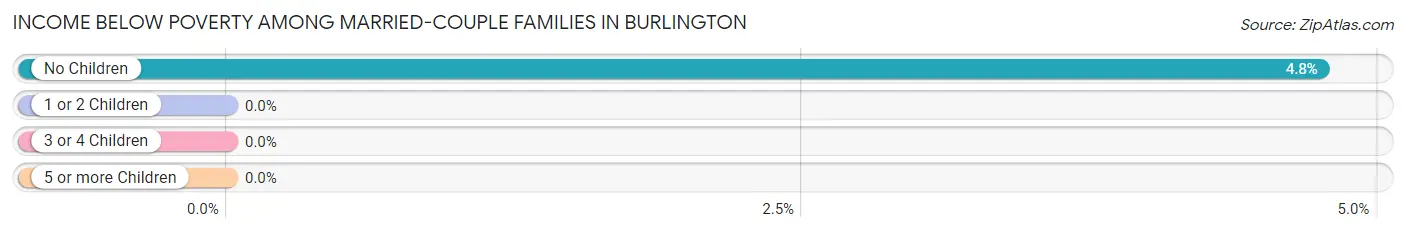
| Children | Above Poverty | Below Poverty |
| No Children | 321 (95.3%) | 16 (4.8%) |
| 1 or 2 Children | 309 (100.0%) | 0 (0.0%) |
| 3 or 4 Children | 28 (100.0%) | 0 (0.0%) |
| 5 or more Children | 0 (0.0%) | 0 (0.0%) |
| Total | 658 (97.6%) | 16 (2.4%) |
Income Below Poverty Among Single-Parent Households in Burlington
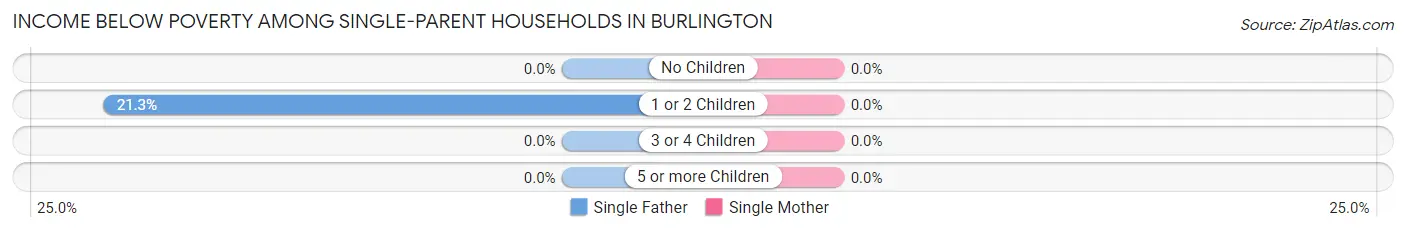
| Children | Single Father | Single Mother |
| No Children | 0 (0.0%) | 0 (0.0%) |
| 1 or 2 Children | 13 (21.3%) | 0 (0.0%) |
| 3 or 4 Children | 0 (0.0%) | 0 (0.0%) |
| 5 or more Children | 0 (0.0%) | 0 (0.0%) |
| Total | 13 (18.8%) | 0 (0.0%) |
Income Below Poverty Among Married-Couple vs Single-Parent Households in Burlington
The poverty data for Burlington shows that 16 of the married-couple family households (2.4%) and 13 of the single-parent households (5.4%) are living below the poverty level. Within the married-couple family households, those with no children have the highest poverty rate, with 16 households (4.8%) falling below the poverty line. Among the single-parent households, those with 1 or 2 children have the highest poverty rate, with 13 household (7.6%) living below poverty.
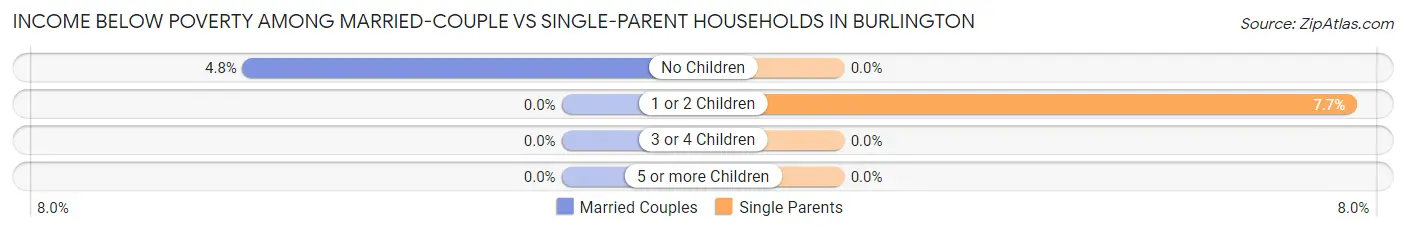
| Children | Married-Couple Families | Single-Parent Households |
| No Children | 16 (4.8%) | 0 (0.0%) |
| 1 or 2 Children | 0 (0.0%) | 13 (7.6%) |
| 3 or 4 Children | 0 (0.0%) | 0 (0.0%) |
| 5 or more Children | 0 (0.0%) | 0 (0.0%) |
| Total | 16 (2.4%) | 13 (5.4%) |
Race in Burlington
The most populous races in Burlington are White / Caucasian (2,600 | 81.7%), Hispanic or Latino (878 | 27.6%), and Some other Race (380 | 11.9%).
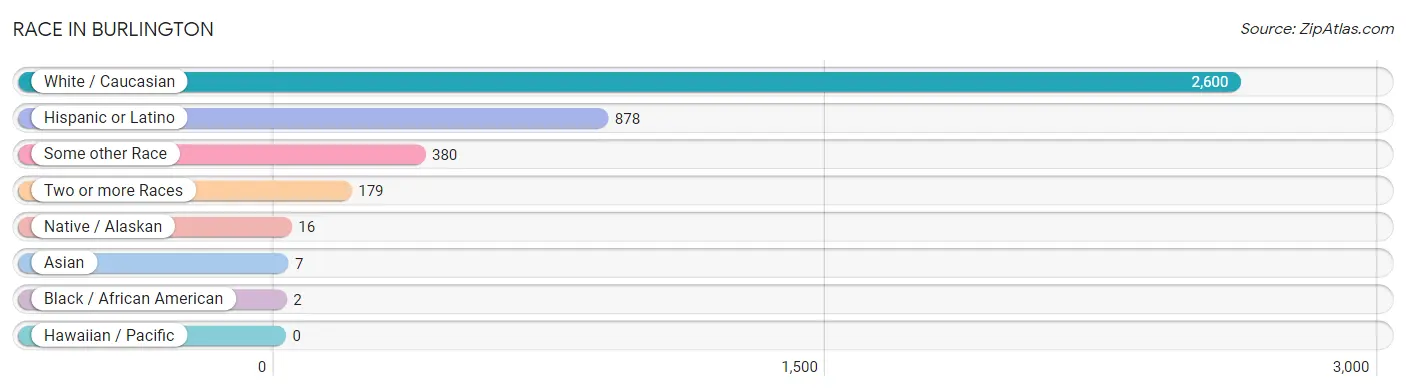
| Race | # Population | % Population |
| Asian | 7 | 0.2% |
| Black / African American | 2 | 0.1% |
| Hawaiian / Pacific | 0 | 0.0% |
| Hispanic or Latino | 878 | 27.6% |
| Native / Alaskan | 16 | 0.5% |
| White / Caucasian | 2,600 | 81.7% |
| Two or more Races | 179 | 5.6% |
| Some other Race | 380 | 11.9% |
| Total | 3,184 | 100.0% |
Ancestry in Burlington
The most populous ancestries reported in Burlington are Mexican (855 | 26.9%), German (779 | 24.5%), Irish (255 | 8.0%), American (211 | 6.6%), and English (183 | 5.8%), together accounting for 71.7% of all Burlington residents.
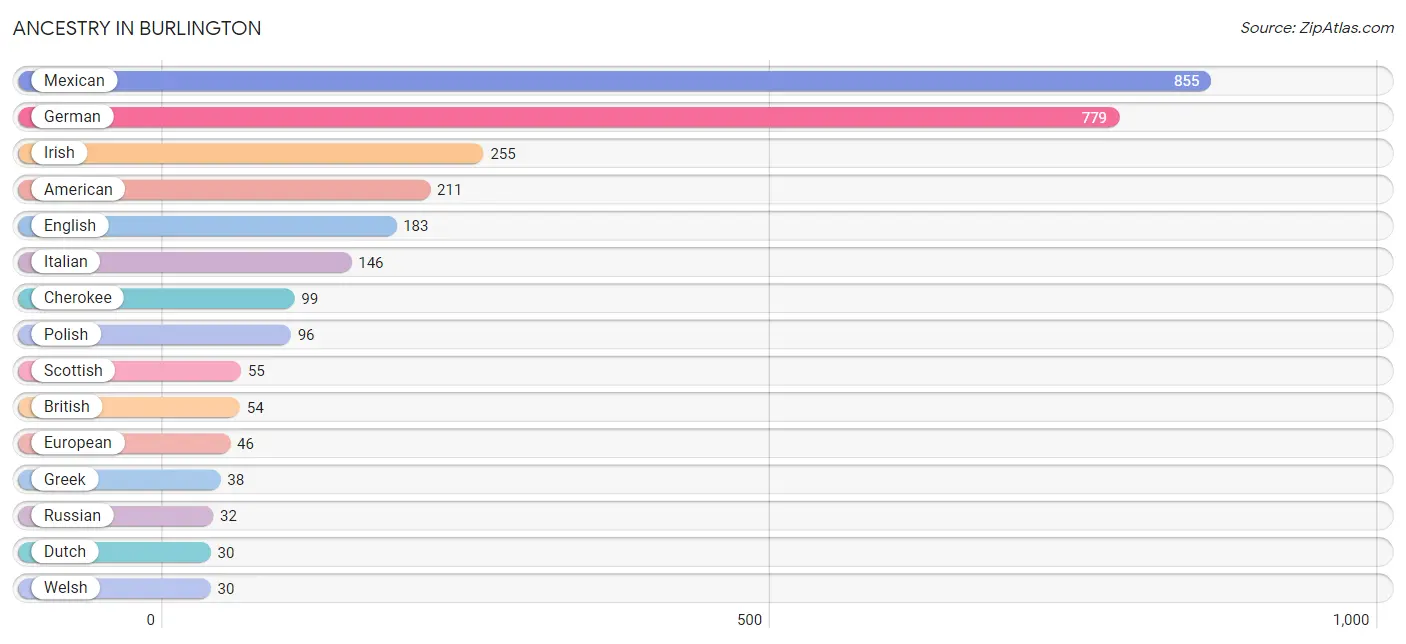
| Ancestry | # Population | % Population |
| American | 211 | 6.6% |
| British | 54 | 1.7% |
| Burmese | 7 | 0.2% |
| Canadian | 10 | 0.3% |
| Cherokee | 99 | 3.1% |
| Chippewa | 10 | 0.3% |
| Czech | 21 | 0.7% |
| Danish | 23 | 0.7% |
| Dutch | 30 | 0.9% |
| English | 183 | 5.8% |
| European | 46 | 1.4% |
| French | 23 | 0.7% |
| German | 779 | 24.5% |
| Greek | 38 | 1.2% |
| Hungarian | 26 | 0.8% |
| Irish | 255 | 8.0% |
| Italian | 146 | 4.6% |
| Mexican | 855 | 26.9% |
| Norwegian | 6 | 0.2% |
| Pennsylvania German | 26 | 0.8% |
| Polish | 96 | 3.0% |
| Romanian | 7 | 0.2% |
| Russian | 32 | 1.0% |
| Scotch-Irish | 20 | 0.6% |
| Scottish | 55 | 1.7% |
| Sierra Leonean | 2 | 0.1% |
| Spanish | 23 | 0.7% |
| Subsaharan African | 2 | 0.1% |
| Swedish | 10 | 0.3% |
| Welsh | 30 | 0.9% | View All 30 Rows |
Immigrants in Burlington
The most numerous immigrant groups reported in Burlington came from Central America (332 | 10.4%), Latin America (332 | 10.4%), Mexico (332 | 10.4%), Asia (7 | 0.2%), and Eastern Asia (7 | 0.2%), together accounting for 31.7% of all Burlington residents.
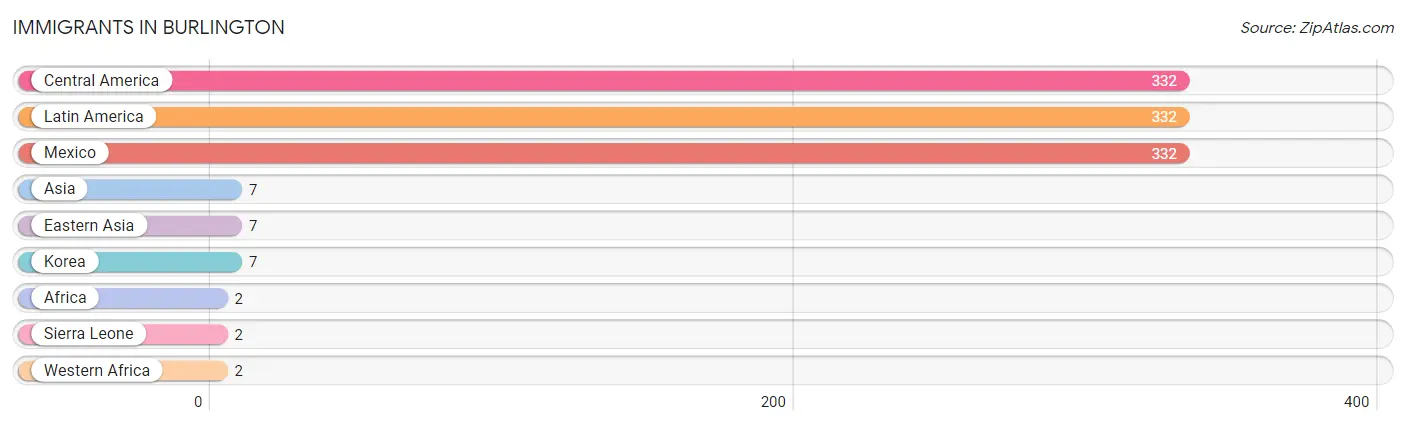
| Immigration Origin | # Population | % Population |
| Africa | 2 | 0.1% |
| Asia | 7 | 0.2% |
| Central America | 332 | 10.4% |
| Eastern Asia | 7 | 0.2% |
| Korea | 7 | 0.2% |
| Latin America | 332 | 10.4% |
| Mexico | 332 | 10.4% |
| Sierra Leone | 2 | 0.1% |
| Western Africa | 2 | 0.1% | View All 9 Rows |
Sex and Age in Burlington
Sex and Age in Burlington
The most populous age groups in Burlington are 5 to 9 Years (148 | 9.7%) for men and 60 to 64 Years (172 | 10.4%) for women.
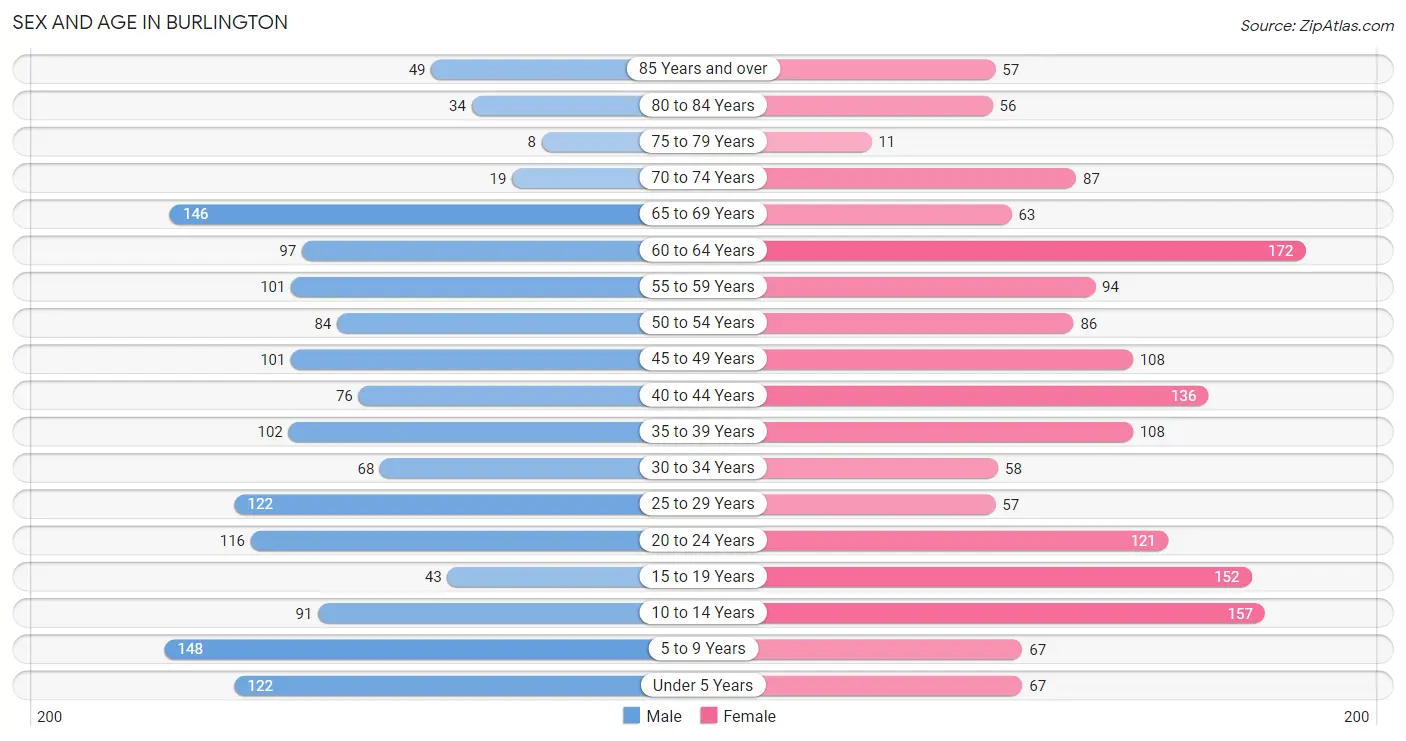
| Age Bracket | Male | Female |
| Under 5 Years | 122 (8.0%) | 67 (4.0%) |
| 5 to 9 Years | 148 (9.7%) | 67 (4.0%) |
| 10 to 14 Years | 91 (6.0%) | 157 (9.5%) |
| 15 to 19 Years | 43 (2.8%) | 152 (9.2%) |
| 20 to 24 Years | 116 (7.6%) | 121 (7.3%) |
| 25 to 29 Years | 122 (8.0%) | 57 (3.4%) |
| 30 to 34 Years | 68 (4.4%) | 58 (3.5%) |
| 35 to 39 Years | 102 (6.7%) | 108 (6.5%) |
| 40 to 44 Years | 76 (5.0%) | 136 (8.2%) |
| 45 to 49 Years | 101 (6.6%) | 108 (6.5%) |
| 50 to 54 Years | 84 (5.5%) | 86 (5.2%) |
| 55 to 59 Years | 101 (6.6%) | 94 (5.7%) |
| 60 to 64 Years | 97 (6.4%) | 172 (10.4%) |
| 65 to 69 Years | 146 (9.6%) | 63 (3.8%) |
| 70 to 74 Years | 19 (1.2%) | 87 (5.2%) |
| 75 to 79 Years | 8 (0.5%) | 11 (0.7%) |
| 80 to 84 Years | 34 (2.2%) | 56 (3.4%) |
| 85 Years and over | 49 (3.2%) | 57 (3.4%) |
| Total | 1,527 (100.0%) | 1,657 (100.0%) |
Families and Households in Burlington
Median Family Size in Burlington
The median family size in Burlington is 2.77 persons per family, with married-couple families (674 | 73.6%) accounting for the largest median family size of 2.79 persons per family. On the other hand, single male/father families (69 | 7.5%) represent the smallest median family size with 2.52 persons per family.
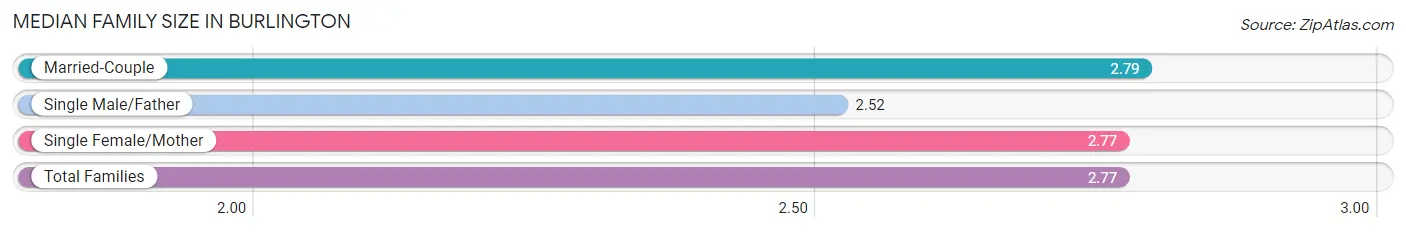
| Family Type | # Families | Family Size |
| Married-Couple | 674 (73.6%) | 2.79 |
| Single Male/Father | 69 (7.5%) | 2.52 |
| Single Female/Mother | 173 (18.9%) | 2.77 |
| Total Families | 916 (100.0%) | 2.77 |
Median Household Size in Burlington
The median household size in Burlington is 2.21 persons per household, with single male/father households (69 | 4.9%) accounting for the largest median household size of 3.03 persons per household. non-family households (481 | 34.4%) represent the smallest median household size with 1.04 persons per household.
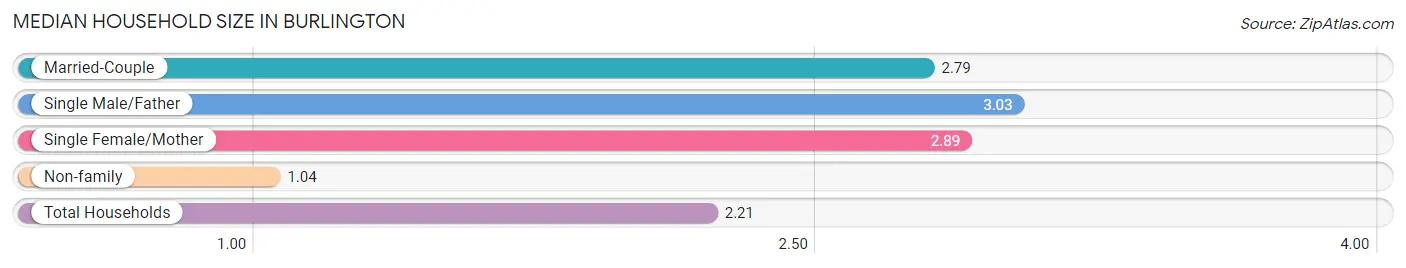
| Household Type | # Households | Household Size |
| Married-Couple | 674 (48.2%) | 2.79 |
| Single Male/Father | 69 (4.9%) | 3.03 |
| Single Female/Mother | 173 (12.4%) | 2.89 |
| Non-family | 481 (34.4%) | 1.04 |
| Total Households | 1,397 (100.0%) | 2.21 |
Household Size by Marriage Status in Burlington
Out of a total of 1,397 households in Burlington, 916 (65.6%) are family households, while 481 (34.4%) are nonfamily households. The most numerous type of family households are 2-person households, comprising 432, and the most common type of nonfamily households are 1-person households, comprising 443.
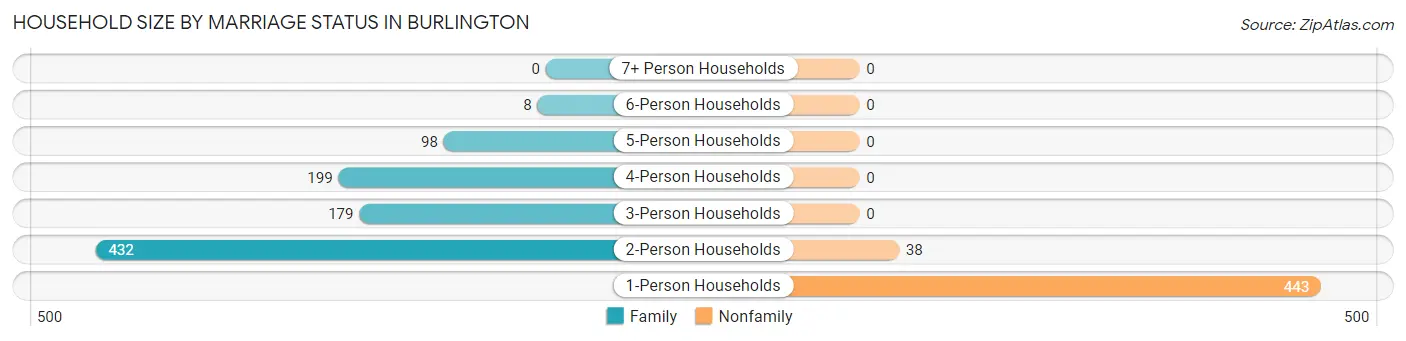
| Household Size | Family Households | Nonfamily Households |
| 1-Person Households | - | 443 (31.7%) |
| 2-Person Households | 432 (30.9%) | 38 (2.7%) |
| 3-Person Households | 179 (12.8%) | 0 (0.0%) |
| 4-Person Households | 199 (14.2%) | 0 (0.0%) |
| 5-Person Households | 98 (7.0%) | 0 (0.0%) |
| 6-Person Households | 8 (0.6%) | 0 (0.0%) |
| 7+ Person Households | 0 (0.0%) | 0 (0.0%) |
| Total | 916 (65.6%) | 481 (34.4%) |
Female Fertility in Burlington
Fertility by Age in Burlington
Average fertility rate in Burlington is 103.0 births per 1,000 women. Women in the age bracket of 20 to 34 years have the highest fertility rate with 322.0 births per 1,000 women. Women in the age bracket of 20 to 34 years acount for 100.0% of all women with births.
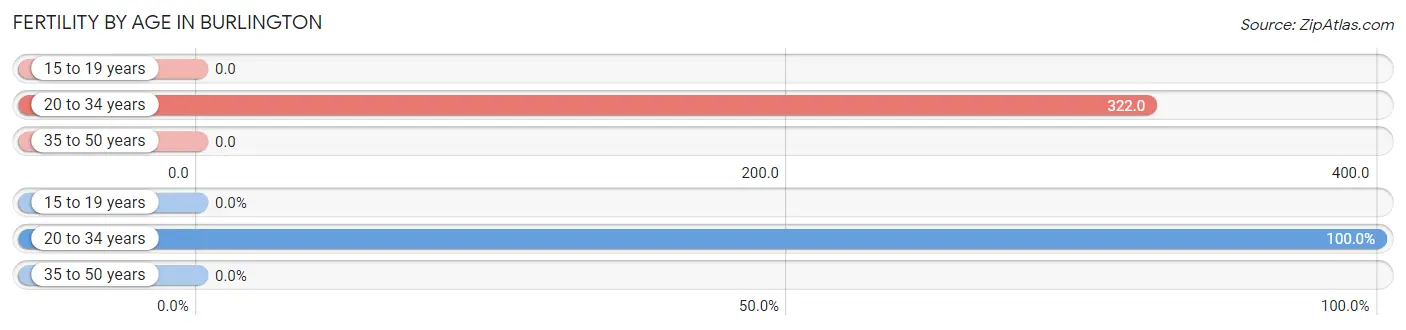
| Age Bracket | Women with Births | Births / 1,000 Women |
| 15 to 19 years | 0 (0.0%) | 0.0 |
| 20 to 34 years | 76 (100.0%) | 322.0 |
| 35 to 50 years | 0 (0.0%) | 0.0 |
| Total | 76 (100.0%) | 103.0 |
Fertility by Age by Marriage Status in Burlington
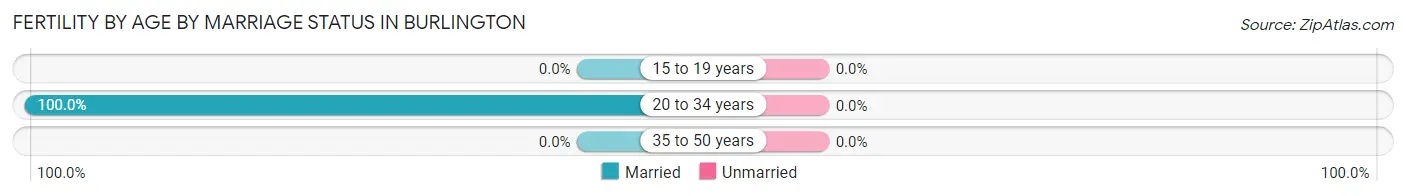
| Age Bracket | Married | Unmarried |
| 15 to 19 years | 0 (0.0%) | 0 (0.0%) |
| 20 to 34 years | 76 (100.0%) | 0 (0.0%) |
| 35 to 50 years | 0 (0.0%) | 0 (0.0%) |
| Total | 76 (100.0%) | 0 (0.0%) |
Fertility by Education in Burlington
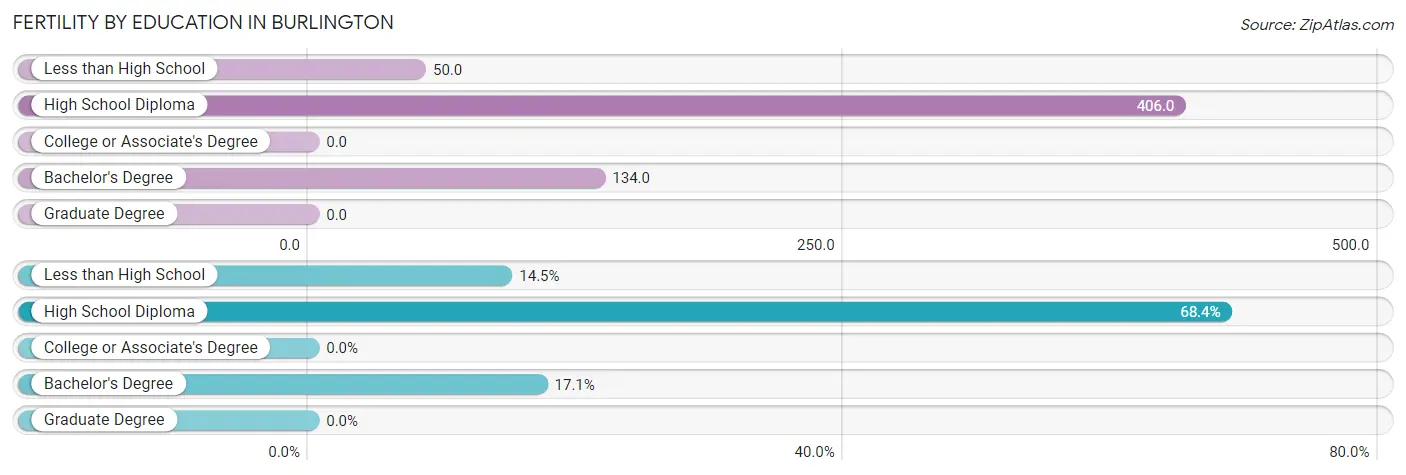
| Educational Attainment | Women with Births | Births / 1,000 Women |
| Less than High School | 11 (14.5%) | 50.0 |
| High School Diploma | 52 (68.4%) | 406.0 |
| College or Associate's Degree | 0 (0.0%) | 0.0 |
| Bachelor's Degree | 13 (17.1%) | 134.0 |
| Graduate Degree | 0 (0.0%) | 0.0 |
| Total | 76 (100.0%) | 103.0 |
Fertility by Education by Marriage Status in Burlington
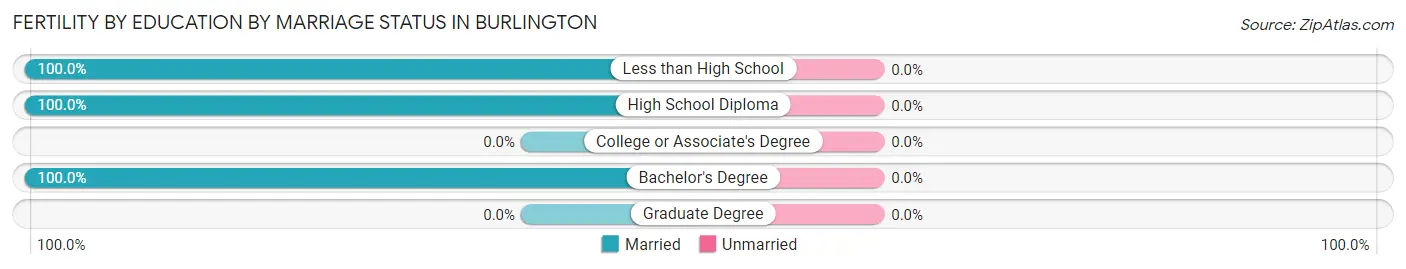
| Educational Attainment | Married | Unmarried |
| Less than High School | 11 (100.0%) | 0 (0.0%) |
| High School Diploma | 52 (100.0%) | 0 (0.0%) |
| College or Associate's Degree | 0 (0.0%) | 0 (0.0%) |
| Bachelor's Degree | 13 (100.0%) | 0 (0.0%) |
| Graduate Degree | 0 (0.0%) | 0 (0.0%) |
| Total | 76 (100.0%) | 0 (0.0%) |
Employment Characteristics in Burlington
Employment by Class of Employer in Burlington
Among the 1,688 employed individuals in Burlington, private company employees (1,063 | 63.0%), local government employees (227 | 13.5%), and state government employees (90 | 5.3%) make up the most common classes of employment.
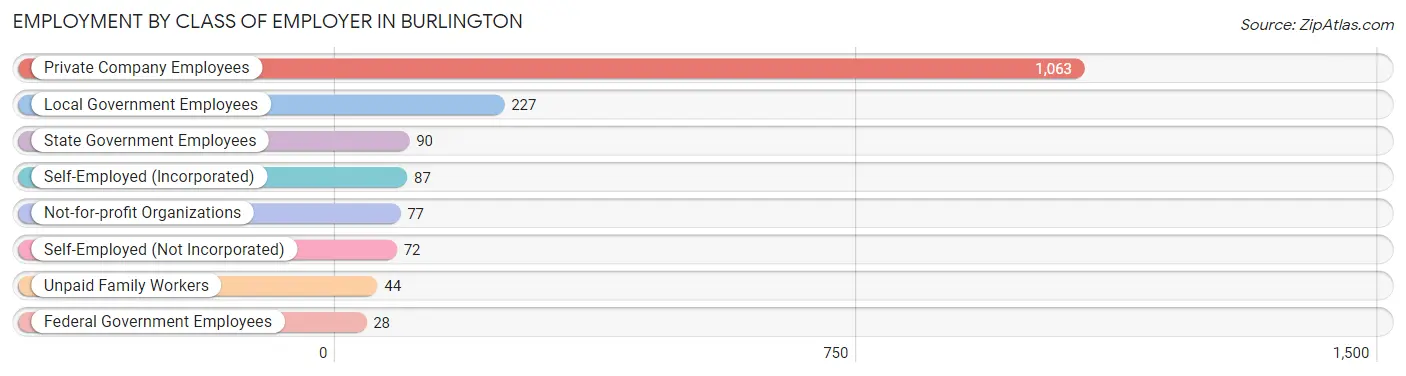
| Employer Class | # Employees | % Employees |
| Private Company Employees | 1,063 | 63.0% |
| Self-Employed (Incorporated) | 87 | 5.1% |
| Self-Employed (Not Incorporated) | 72 | 4.3% |
| Not-for-profit Organizations | 77 | 4.6% |
| Local Government Employees | 227 | 13.5% |
| State Government Employees | 90 | 5.3% |
| Federal Government Employees | 28 | 1.7% |
| Unpaid Family Workers | 44 | 2.6% |
| Total | 1,688 | 100.0% |
Employment Status by Age in Burlington
According to the labor force statistics for Burlington, out of the total population over 16 years of age (2,466), 72.3% or 1,783 individuals are in the labor force, with 2.6% or 46 of them unemployed. The age group with the highest labor force participation rate is 25 to 29 years, with 95.0% or 170 individuals in the labor force. Within the labor force, the 20 to 24 years age range has the highest percentage of unemployed individuals, with 10.0% or 22 of them being unemployed.
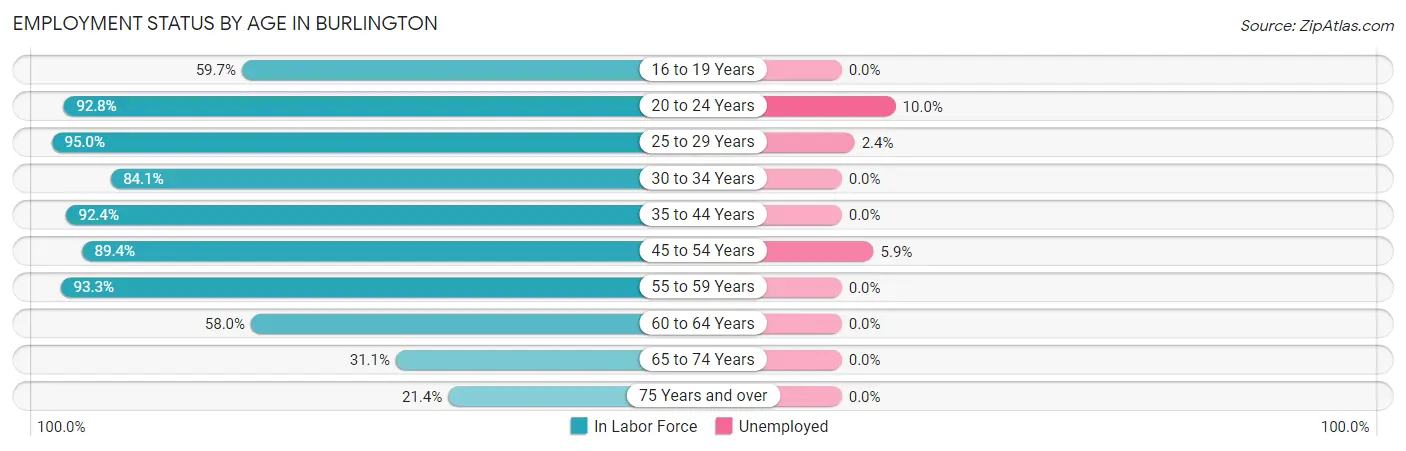
| Age Bracket | In Labor Force | Unemployed |
| 16 to 19 Years | 77 (59.7%) | 0 (0.0%) |
| 20 to 24 Years | 220 (92.8%) | 22 (10.0%) |
| 25 to 29 Years | 170 (95.0%) | 4 (2.4%) |
| 30 to 34 Years | 106 (84.1%) | 0 (0.0%) |
| 35 to 44 Years | 390 (92.4%) | 0 (0.0%) |
| 45 to 54 Years | 339 (89.4%) | 20 (5.9%) |
| 55 to 59 Years | 182 (93.3%) | 0 (0.0%) |
| 60 to 64 Years | 156 (58.0%) | 0 (0.0%) |
| 65 to 74 Years | 98 (31.1%) | 0 (0.0%) |
| 75 Years and over | 46 (21.4%) | 0 (0.0%) |
| Total | 1,783 (72.3%) | 46 (2.6%) |
Employment Status by Educational Attainment in Burlington
According to labor force statistics for Burlington, 85.5% of individuals (1,342) out of the total population between 25 and 64 years of age (1,570) are in the labor force, with 1.8% or 24 of them being unemployed. The group with the highest labor force participation rate are those with the educational attainment of bachelor's degree or higher, with 92.4% or 219 individuals in the labor force. Within the labor force, individuals with high school diploma education have the highest percentage of unemployment, with 3.6% or 13 of them being unemployed.
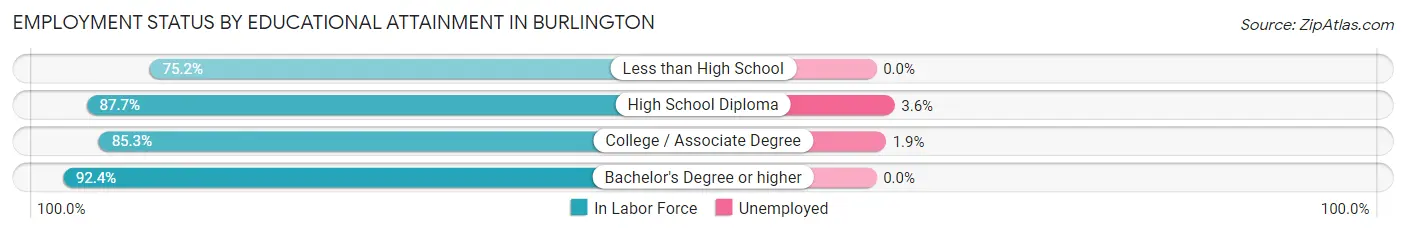
| Educational Attainment | In Labor Force | Unemployed |
| Less than High School | 170 (75.2%) | 0 (0.0%) |
| High School Diploma | 362 (87.7%) | 15 (3.6%) |
| College / Associate Degree | 592 (85.3%) | 13 (1.9%) |
| Bachelor's Degree or higher | 219 (92.4%) | 0 (0.0%) |
| Total | 1,342 (85.5%) | 28 (1.8%) |
Employment Occupations by Sex in Burlington
Management, Business, Science and Arts Occupations
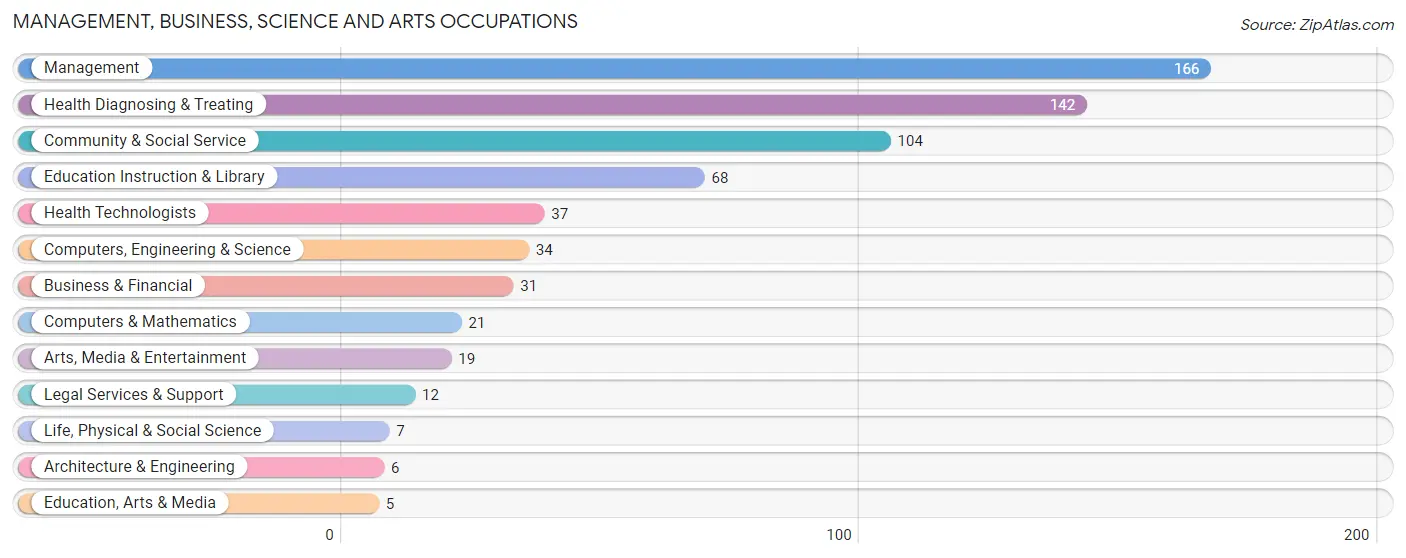
The most common Management, Business, Science and Arts occupations in Burlington are Management (166 | 9.6%), Health Diagnosing & Treating (142 | 8.2%), Community & Social Service (104 | 6.0%), Education Instruction & Library (68 | 3.9%), and Health Technologists (37 | 2.1%).
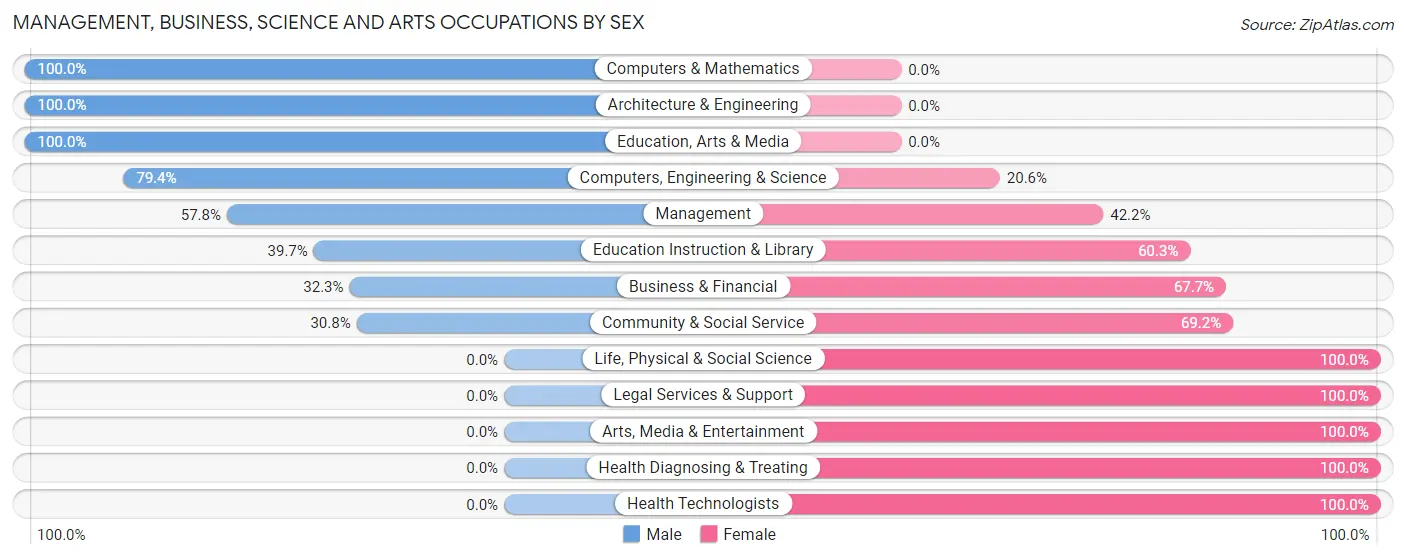
Management, Business, Science and Arts Occupations by Sex
Within the Management, Business, Science and Arts occupations in Burlington, the most male-oriented occupations are Computers & Mathematics (100.0%), Architecture & Engineering (100.0%), and Education, Arts & Media (100.0%), while the most female-oriented occupations are Life, Physical & Social Science (100.0%), Legal Services & Support (100.0%), and Arts, Media & Entertainment (100.0%).
| Occupation | Male | Female |
| Management | 96 (57.8%) | 70 (42.2%) |
| Business & Financial | 10 (32.3%) | 21 (67.7%) |
| Computers, Engineering & Science | 27 (79.4%) | 7 (20.6%) |
| Computers & Mathematics | 21 (100.0%) | 0 (0.0%) |
| Architecture & Engineering | 6 (100.0%) | 0 (0.0%) |
| Life, Physical & Social Science | 0 (0.0%) | 7 (100.0%) |
| Community & Social Service | 32 (30.8%) | 72 (69.2%) |
| Education, Arts & Media | 5 (100.0%) | 0 (0.0%) |
| Legal Services & Support | 0 (0.0%) | 12 (100.0%) |
| Education Instruction & Library | 27 (39.7%) | 41 (60.3%) |
| Arts, Media & Entertainment | 0 (0.0%) | 19 (100.0%) |
| Health Diagnosing & Treating | 0 (0.0%) | 142 (100.0%) |
| Health Technologists | 0 (0.0%) | 37 (100.0%) |
| Total (Category) | 165 (34.6%) | 312 (65.4%) |
| Total (Overall) | 891 (51.3%) | 847 (48.7%) |
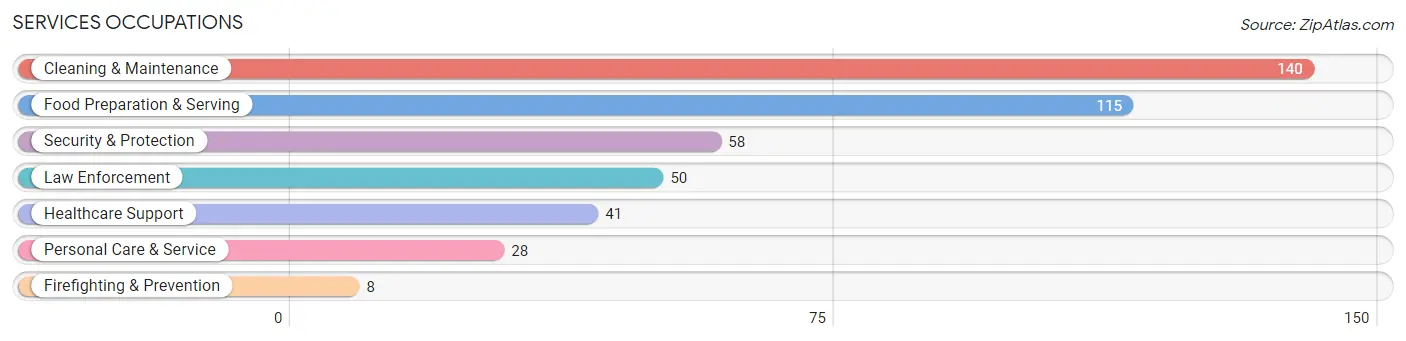
Services Occupations
The most common Services occupations in Burlington are Cleaning & Maintenance (140 | 8.1%), Food Preparation & Serving (115 | 6.6%), Security & Protection (58 | 3.3%), Law Enforcement (50 | 2.9%), and Healthcare Support (41 | 2.4%).
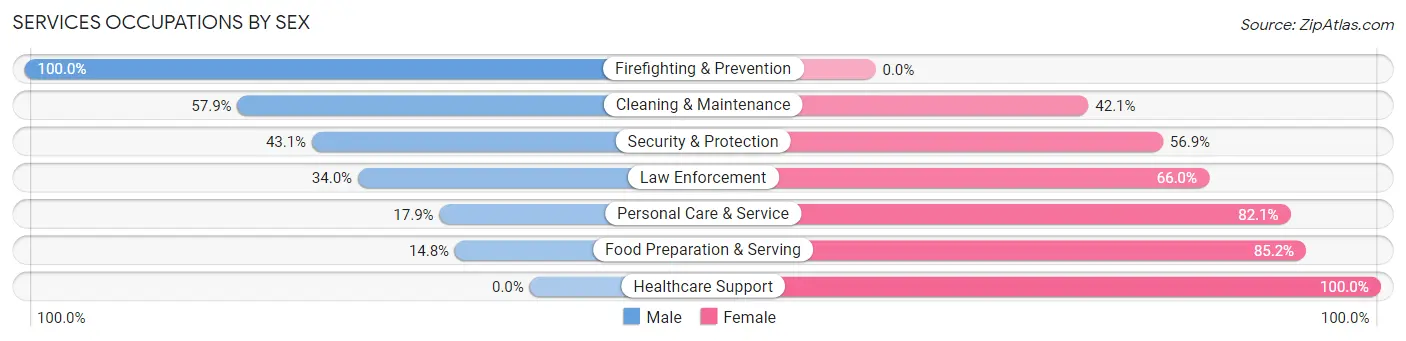
Services Occupations by Sex
Within the Services occupations in Burlington, the most male-oriented occupations are Firefighting & Prevention (100.0%), Cleaning & Maintenance (57.9%), and Security & Protection (43.1%), while the most female-oriented occupations are Healthcare Support (100.0%), Food Preparation & Serving (85.2%), and Personal Care & Service (82.1%).
| Occupation | Male | Female |
| Healthcare Support | 0 (0.0%) | 41 (100.0%) |
| Security & Protection | 25 (43.1%) | 33 (56.9%) |
| Firefighting & Prevention | 8 (100.0%) | 0 (0.0%) |
| Law Enforcement | 17 (34.0%) | 33 (66.0%) |
| Food Preparation & Serving | 17 (14.8%) | 98 (85.2%) |
| Cleaning & Maintenance | 81 (57.9%) | 59 (42.1%) |
| Personal Care & Service | 5 (17.9%) | 23 (82.1%) |
| Total (Category) | 128 (33.5%) | 254 (66.5%) |
| Total (Overall) | 891 (51.3%) | 847 (48.7%) |
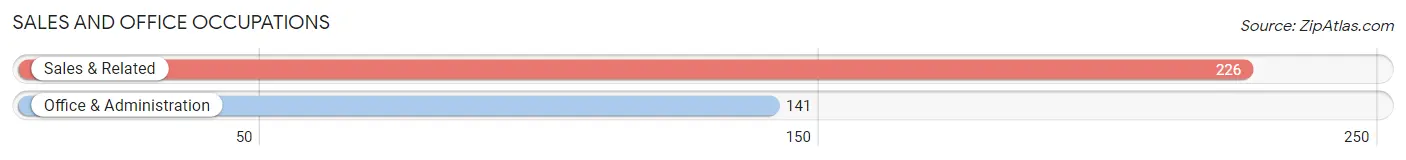
Sales and Office Occupations
The most common Sales and Office occupations in Burlington are Sales & Related (226 | 13.0%), and Office & Administration (141 | 8.1%).
Sales and Office Occupations by Sex
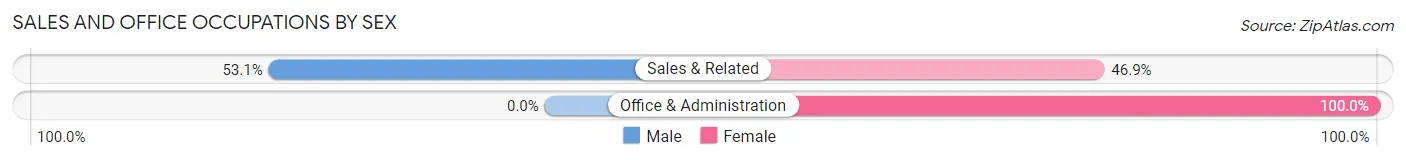
| Occupation | Male | Female |
| Sales & Related | 120 (53.1%) | 106 (46.9%) |
| Office & Administration | 0 (0.0%) | 141 (100.0%) |
| Total (Category) | 120 (32.7%) | 247 (67.3%) |
| Total (Overall) | 891 (51.3%) | 847 (48.7%) |
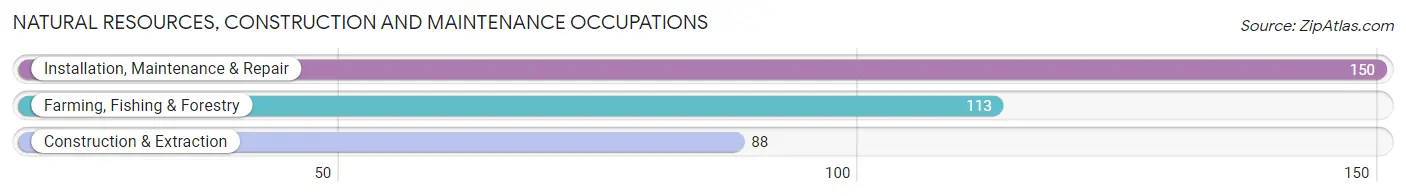
Natural Resources, Construction and Maintenance Occupations
The most common Natural Resources, Construction and Maintenance occupations in Burlington are Installation, Maintenance & Repair (150 | 8.6%), Farming, Fishing & Forestry (113 | 6.5%), and Construction & Extraction (88 | 5.1%).
Natural Resources, Construction and Maintenance Occupations by Sex
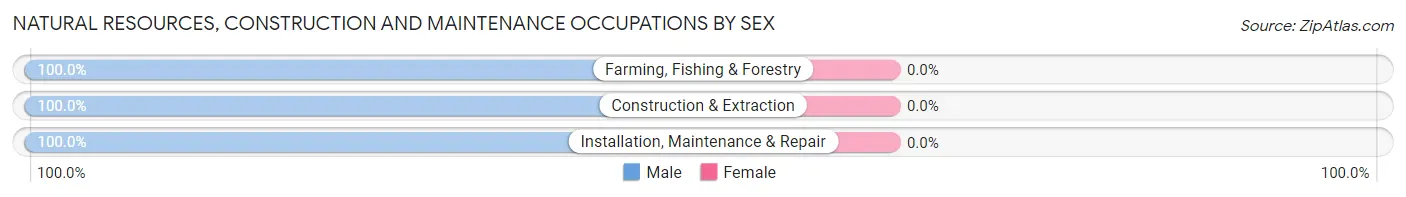
| Occupation | Male | Female |
| Farming, Fishing & Forestry | 113 (100.0%) | 0 (0.0%) |
| Construction & Extraction | 88 (100.0%) | 0 (0.0%) |
| Installation, Maintenance & Repair | 150 (100.0%) | 0 (0.0%) |
| Total (Category) | 351 (100.0%) | 0 (0.0%) |
| Total (Overall) | 891 (51.3%) | 847 (48.7%) |
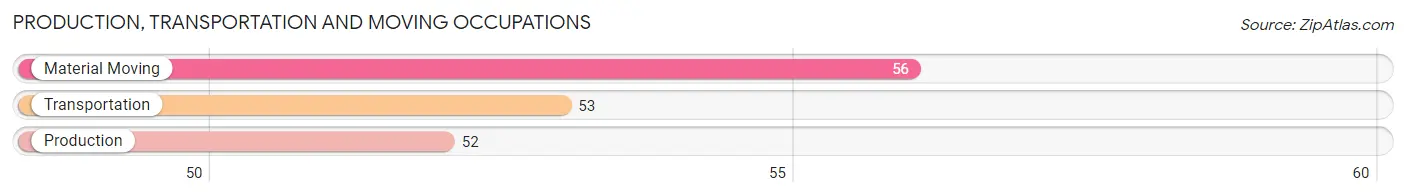
Production, Transportation and Moving Occupations
The most common Production, Transportation and Moving occupations in Burlington are Material Moving (56 | 3.2%), Transportation (53 | 3.0%), and Production (52 | 3.0%).
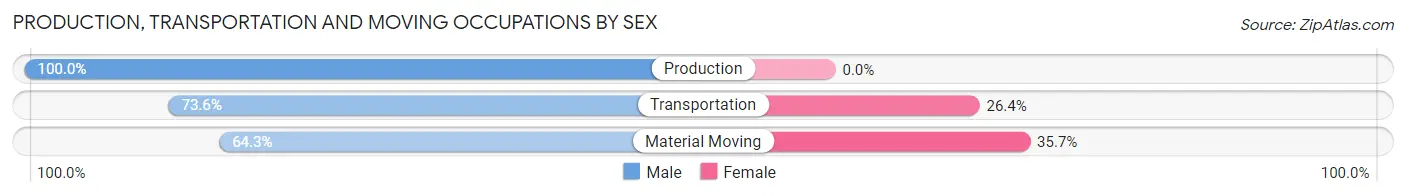
Production, Transportation and Moving Occupations by Sex
| Occupation | Male | Female |
| Production | 52 (100.0%) | 0 (0.0%) |
| Transportation | 39 (73.6%) | 14 (26.4%) |
| Material Moving | 36 (64.3%) | 20 (35.7%) |
| Total (Category) | 127 (78.9%) | 34 (21.1%) |
| Total (Overall) | 891 (51.3%) | 847 (48.7%) |
Employment Industries by Sex in Burlington
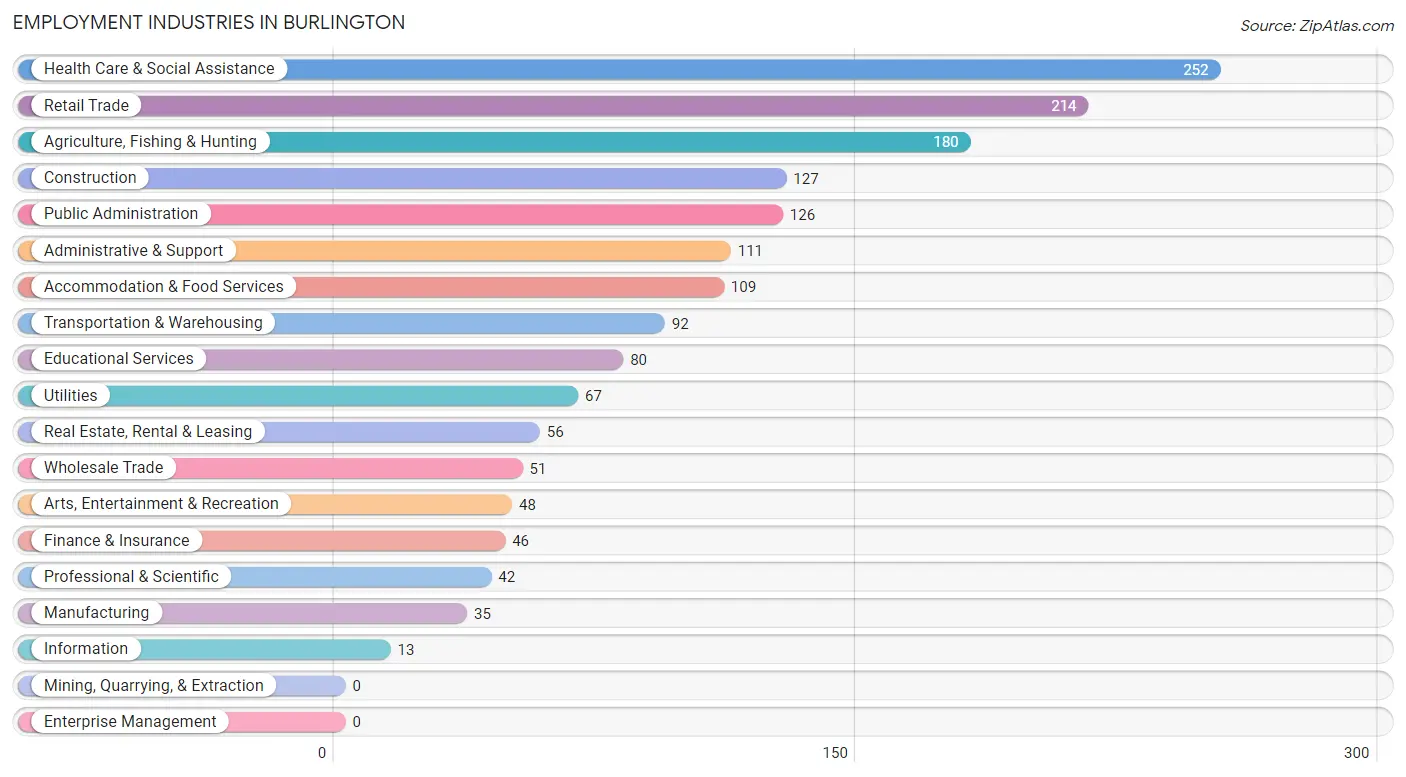
Employment Industries in Burlington
The major employment industries in Burlington include Health Care & Social Assistance (252 | 14.5%), Retail Trade (214 | 12.3%), Agriculture, Fishing & Hunting (180 | 10.4%), Construction (127 | 7.3%), and Public Administration (126 | 7.2%).
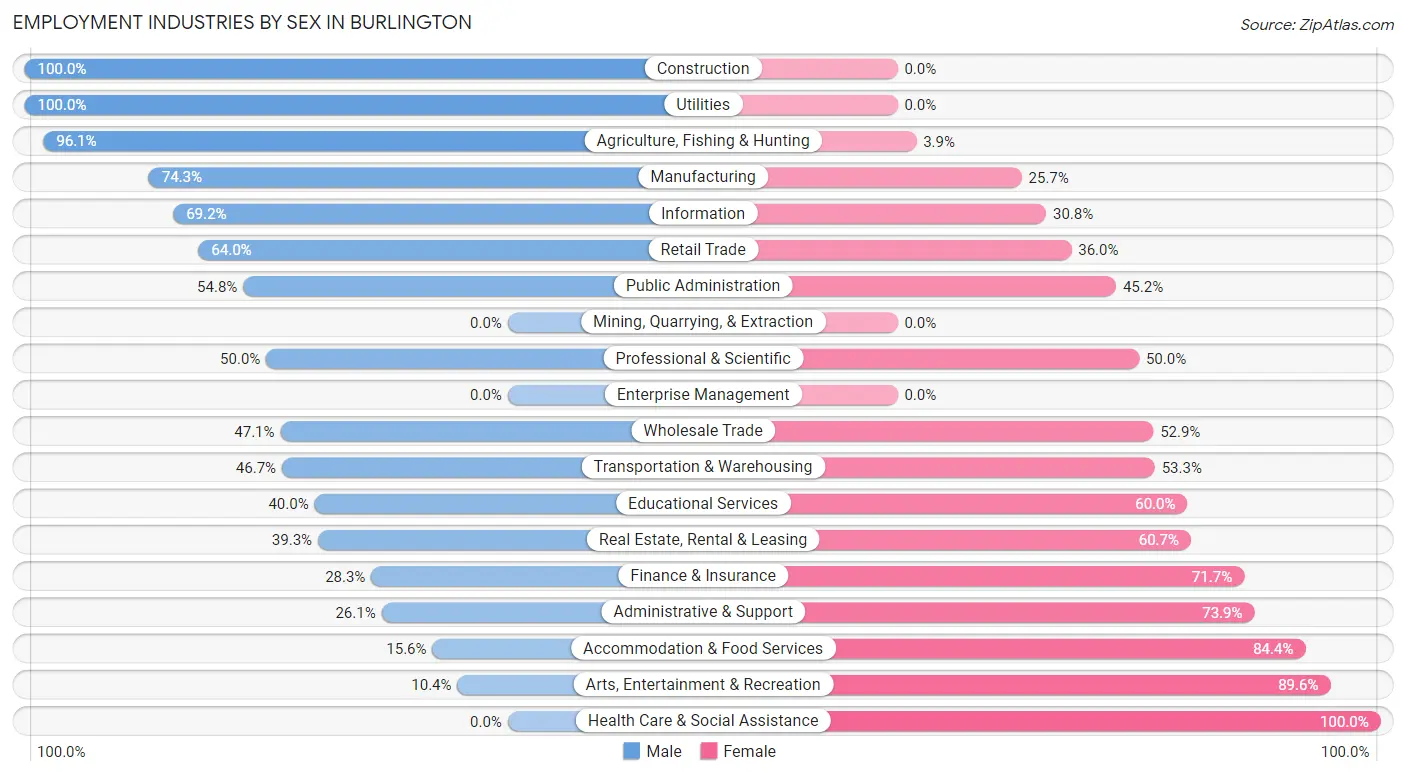
Employment Industries by Sex in Burlington
The Burlington industries that see more men than women are Construction (100.0%), Utilities (100.0%), and Agriculture, Fishing & Hunting (96.1%), whereas the industries that tend to have a higher number of women are Health Care & Social Assistance (100.0%), Arts, Entertainment & Recreation (89.6%), and Accommodation & Food Services (84.4%).
| Industry | Male | Female |
| Agriculture, Fishing & Hunting | 173 (96.1%) | 7 (3.9%) |
| Mining, Quarrying, & Extraction | 0 (0.0%) | 0 (0.0%) |
| Construction | 127 (100.0%) | 0 (0.0%) |
| Manufacturing | 26 (74.3%) | 9 (25.7%) |
| Wholesale Trade | 24 (47.1%) | 27 (52.9%) |
| Retail Trade | 137 (64.0%) | 77 (36.0%) |
| Transportation & Warehousing | 43 (46.7%) | 49 (53.3%) |
| Utilities | 67 (100.0%) | 0 (0.0%) |
| Information | 9 (69.2%) | 4 (30.8%) |
| Finance & Insurance | 13 (28.3%) | 33 (71.7%) |
| Real Estate, Rental & Leasing | 22 (39.3%) | 34 (60.7%) |
| Professional & Scientific | 21 (50.0%) | 21 (50.0%) |
| Enterprise Management | 0 (0.0%) | 0 (0.0%) |
| Administrative & Support | 29 (26.1%) | 82 (73.9%) |
| Educational Services | 32 (40.0%) | 48 (60.0%) |
| Health Care & Social Assistance | 0 (0.0%) | 252 (100.0%) |
| Arts, Entertainment & Recreation | 5 (10.4%) | 43 (89.6%) |
| Accommodation & Food Services | 17 (15.6%) | 92 (84.4%) |
| Public Administration | 69 (54.8%) | 57 (45.2%) |
| Total | 891 (51.3%) | 847 (48.7%) |
Education in Burlington
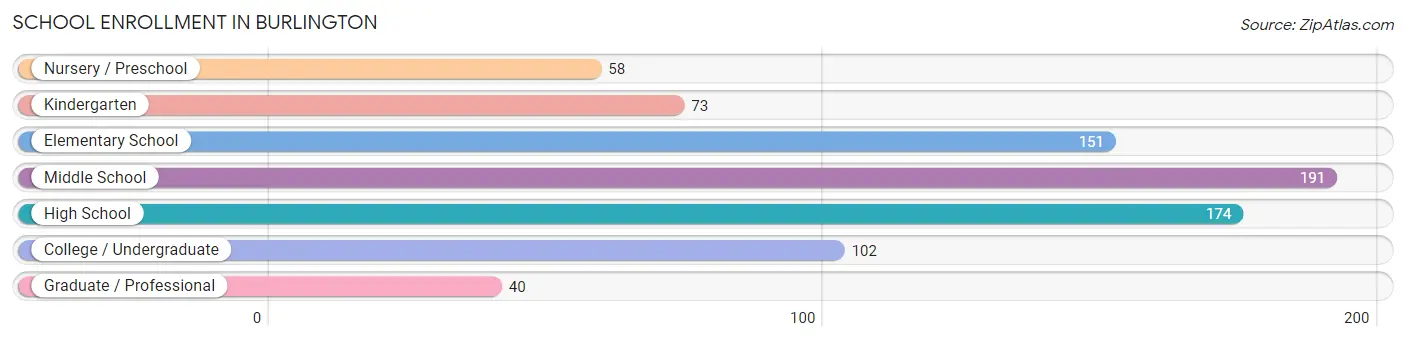
School Enrollment in Burlington
The most common levels of schooling among the 789 students in Burlington are middle school (191 | 24.2%), high school (174 | 22.1%), and elementary school (151 | 19.1%).
| School Level | # Students | % Students |
| Nursery / Preschool | 58 | 7.3% |
| Kindergarten | 73 | 9.2% |
| Elementary School | 151 | 19.1% |
| Middle School | 191 | 24.2% |
| High School | 174 | 22.1% |
| College / Undergraduate | 102 | 12.9% |
| Graduate / Professional | 40 | 5.1% |
| Total | 789 | 100.0% |
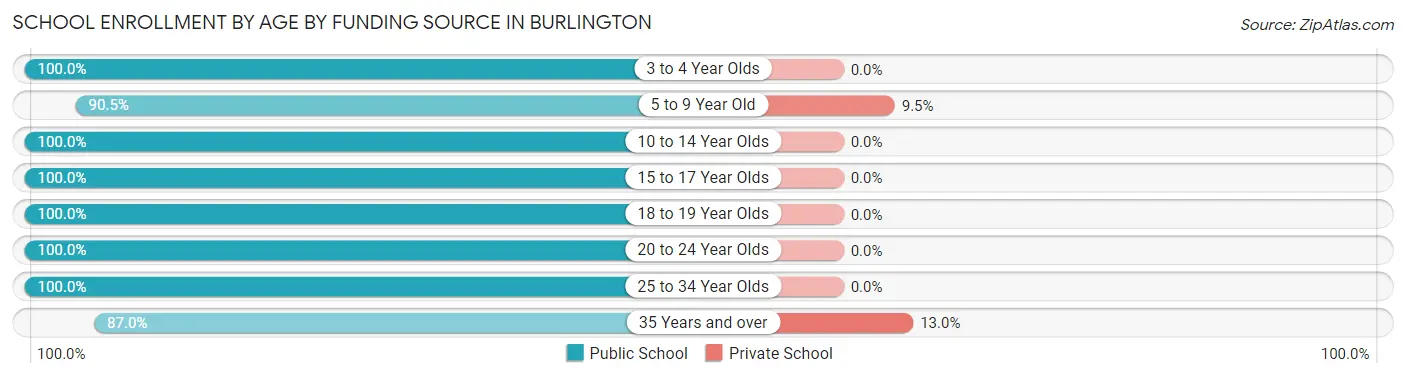
School Enrollment by Age by Funding Source in Burlington
Out of a total of 789 students who are enrolled in schools in Burlington, 27 (3.4%) attend a private institution, while the remaining 762 (96.6%) are enrolled in public schools. The age group of 35 years and over has the highest likelihood of being enrolled in private schools, with 7 (13.0% in the age bracket) enrolled. Conversely, the age group of 3 to 4 year olds has the lowest likelihood of being enrolled in a private school, with 15 (100.0% in the age bracket) attending a public institution.
| Age Bracket | Public School | Private School |
| 3 to 4 Year Olds | 15 (100.0%) | 0 (0.0%) |
| 5 to 9 Year Old | 190 (90.5%) | 20 (9.5%) |
| 10 to 14 Year Olds | 248 (100.0%) | 0 (0.0%) |
| 15 to 17 Year Olds | 150 (100.0%) | 0 (0.0%) |
| 18 to 19 Year Olds | 35 (100.0%) | 0 (0.0%) |
| 20 to 24 Year Olds | 54 (100.0%) | 0 (0.0%) |
| 25 to 34 Year Olds | 23 (100.0%) | 0 (0.0%) |
| 35 Years and over | 47 (87.0%) | 7 (13.0%) |
| Total | 762 (96.6%) | 27 (3.4%) |
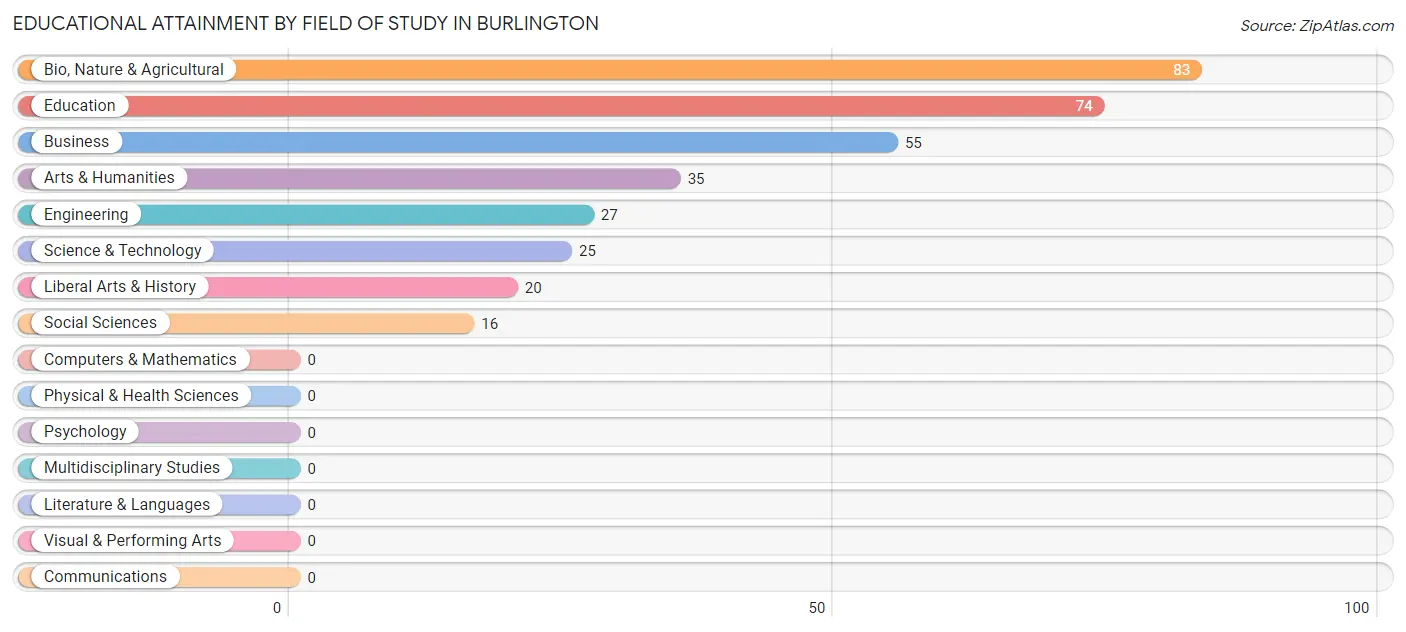
Educational Attainment by Field of Study in Burlington
Bio, nature & agricultural (83 | 24.8%), education (74 | 22.1%), business (55 | 16.4%), arts & humanities (35 | 10.4%), and engineering (27 | 8.1%) are the most common fields of study among 335 individuals in Burlington who have obtained a bachelor's degree or higher.
| Field of Study | # Graduates | % Graduates |
| Computers & Mathematics | 0 | 0.0% |
| Bio, Nature & Agricultural | 83 | 24.8% |
| Physical & Health Sciences | 0 | 0.0% |
| Psychology | 0 | 0.0% |
| Social Sciences | 16 | 4.8% |
| Engineering | 27 | 8.1% |
| Multidisciplinary Studies | 0 | 0.0% |
| Science & Technology | 25 | 7.5% |
| Business | 55 | 16.4% |
| Education | 74 | 22.1% |
| Literature & Languages | 0 | 0.0% |
| Liberal Arts & History | 20 | 6.0% |
| Visual & Performing Arts | 0 | 0.0% |
| Communications | 0 | 0.0% |
| Arts & Humanities | 35 | 10.4% |
| Total | 335 | 100.0% |
Transportation & Commute in Burlington
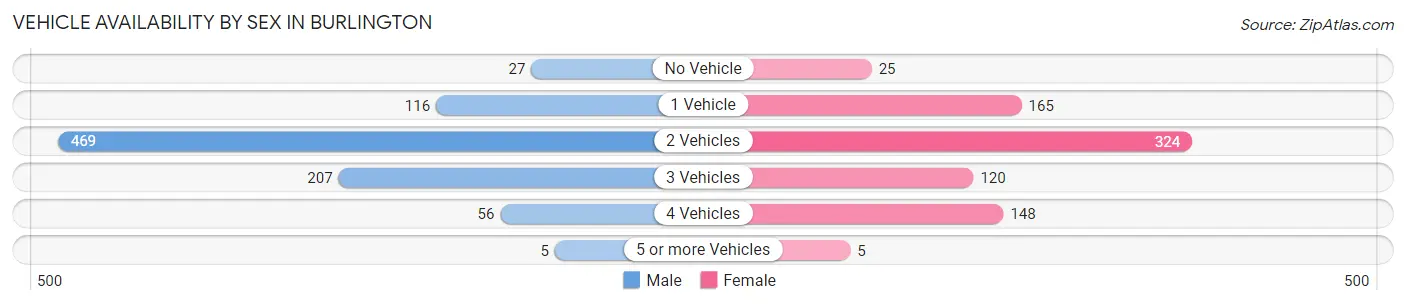
Vehicle Availability by Sex in Burlington
The most prevalent vehicle ownership categories in Burlington are males with 2 vehicles (469, accounting for 53.3%) and females with 2 vehicles (324, making up 59.6%).
| Vehicles Available | Male | Female |
| No Vehicle | 27 (3.1%) | 25 (3.2%) |
| 1 Vehicle | 116 (13.2%) | 165 (21.0%) |
| 2 Vehicles | 469 (53.3%) | 324 (41.2%) |
| 3 Vehicles | 207 (23.5%) | 120 (15.2%) |
| 4 Vehicles | 56 (6.4%) | 148 (18.8%) |
| 5 or more Vehicles | 5 (0.6%) | 5 (0.6%) |
| Total | 880 (100.0%) | 787 (100.0%) |
Commute Time in Burlington
The most frequently occuring commute durations in Burlington are 5 to 9 minutes (652 commuters, 41.6%), 10 to 14 minutes (290 commuters, 18.5%), and less than 5 minutes (187 commuters, 11.9%).
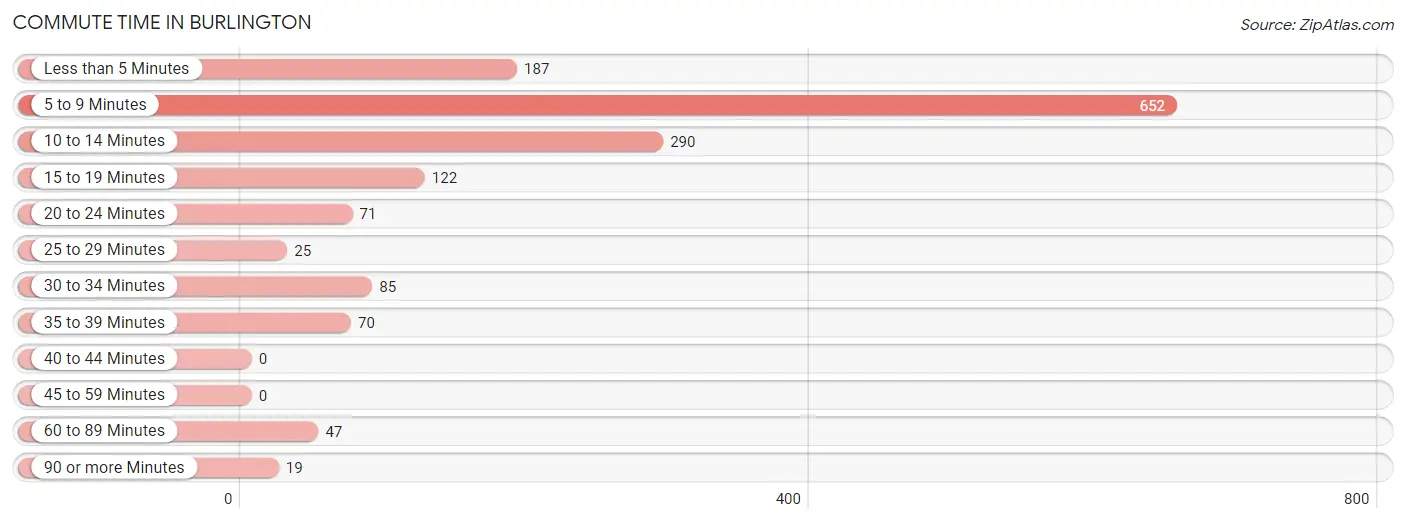
| Commute Time | # Commuters | % Commuters |
| Less than 5 Minutes | 187 | 11.9% |
| 5 to 9 Minutes | 652 | 41.6% |
| 10 to 14 Minutes | 290 | 18.5% |
| 15 to 19 Minutes | 122 | 7.8% |
| 20 to 24 Minutes | 71 | 4.5% |
| 25 to 29 Minutes | 25 | 1.6% |
| 30 to 34 Minutes | 85 | 5.4% |
| 35 to 39 Minutes | 70 | 4.5% |
| 40 to 44 Minutes | 0 | 0.0% |
| 45 to 59 Minutes | 0 | 0.0% |
| 60 to 89 Minutes | 47 | 3.0% |
| 90 or more Minutes | 19 | 1.2% |
Commute Time by Sex in Burlington
The most common commute times in Burlington are 5 to 9 minutes (341 commuters, 41.3%) for males and 5 to 9 minutes (311 commuters, 41.9%) for females.
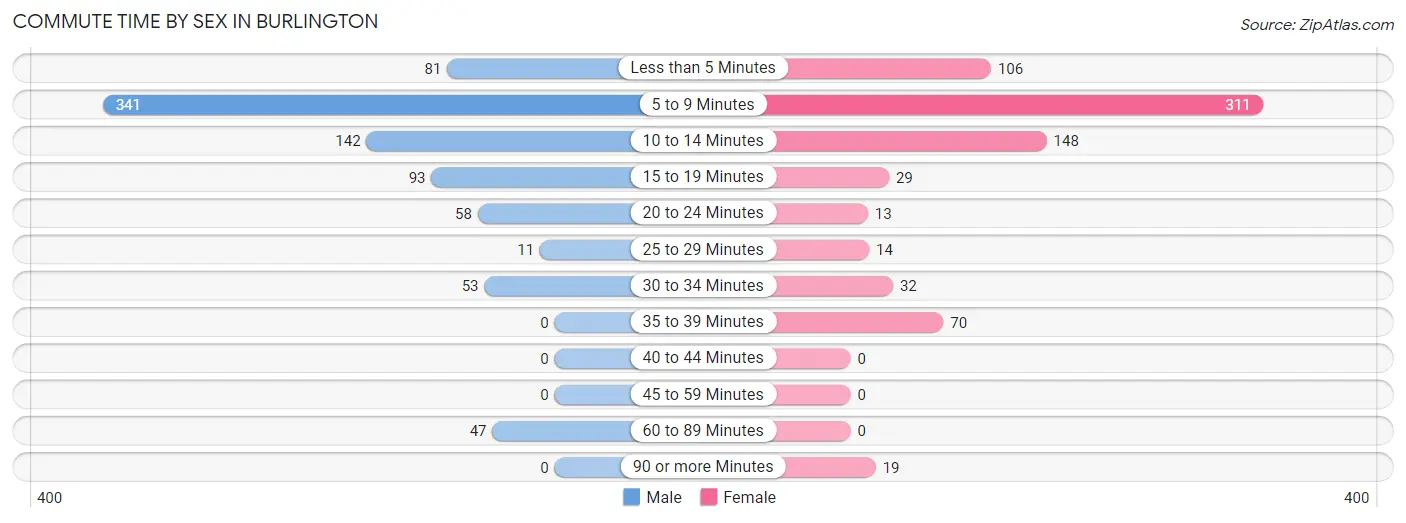
| Commute Time | Male | Female |
| Less than 5 Minutes | 81 (9.8%) | 106 (14.3%) |
| 5 to 9 Minutes | 341 (41.3%) | 311 (41.9%) |
| 10 to 14 Minutes | 142 (17.2%) | 148 (20.0%) |
| 15 to 19 Minutes | 93 (11.3%) | 29 (3.9%) |
| 20 to 24 Minutes | 58 (7.0%) | 13 (1.8%) |
| 25 to 29 Minutes | 11 (1.3%) | 14 (1.9%) |
| 30 to 34 Minutes | 53 (6.4%) | 32 (4.3%) |
| 35 to 39 Minutes | 0 (0.0%) | 70 (9.4%) |
| 40 to 44 Minutes | 0 (0.0%) | 0 (0.0%) |
| 45 to 59 Minutes | 0 (0.0%) | 0 (0.0%) |
| 60 to 89 Minutes | 47 (5.7%) | 0 (0.0%) |
| 90 or more Minutes | 0 (0.0%) | 19 (2.6%) |
Time of Departure to Work by Sex in Burlington
The most frequent times of departure to work in Burlington are 7:00 AM to 7:29 AM (153, 18.5%) for males and 7:30 AM to 7:59 AM (129, 17.4%) for females.
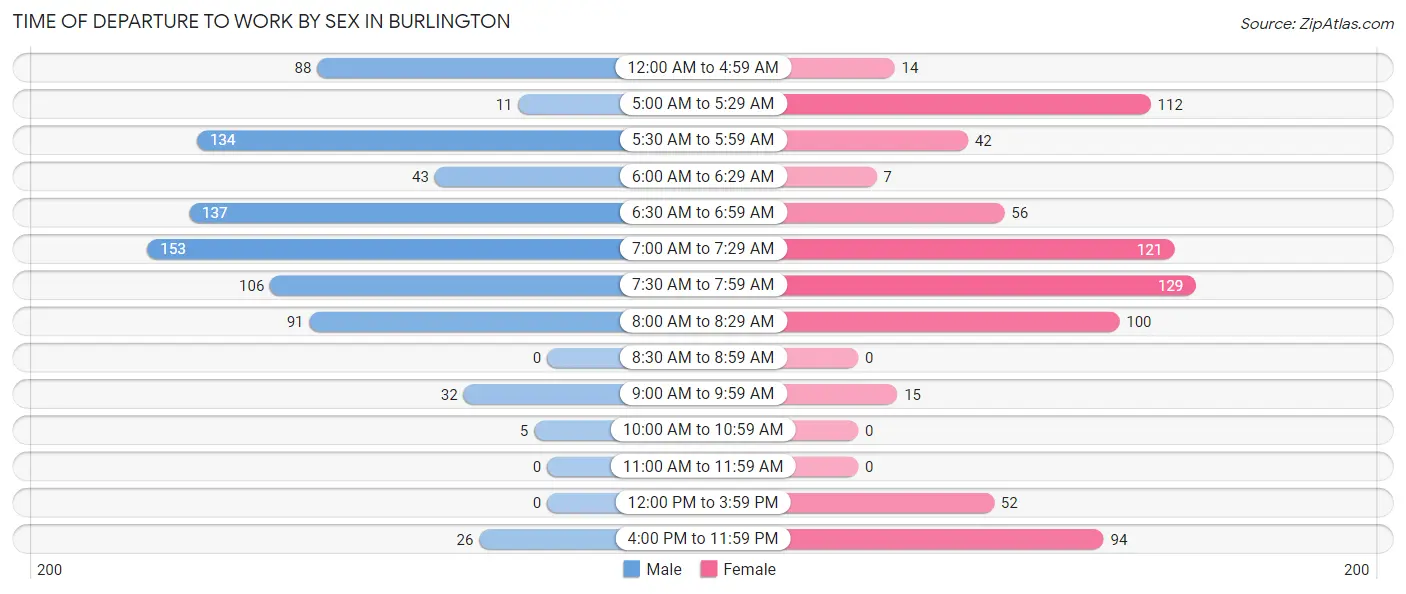
| Time of Departure | Male | Female |
| 12:00 AM to 4:59 AM | 88 (10.6%) | 14 (1.9%) |
| 5:00 AM to 5:29 AM | 11 (1.3%) | 112 (15.1%) |
| 5:30 AM to 5:59 AM | 134 (16.2%) | 42 (5.7%) |
| 6:00 AM to 6:29 AM | 43 (5.2%) | 7 (0.9%) |
| 6:30 AM to 6:59 AM | 137 (16.6%) | 56 (7.5%) |
| 7:00 AM to 7:29 AM | 153 (18.5%) | 121 (16.3%) |
| 7:30 AM to 7:59 AM | 106 (12.8%) | 129 (17.4%) |
| 8:00 AM to 8:29 AM | 91 (11.0%) | 100 (13.5%) |
| 8:30 AM to 8:59 AM | 0 (0.0%) | 0 (0.0%) |
| 9:00 AM to 9:59 AM | 32 (3.9%) | 15 (2.0%) |
| 10:00 AM to 10:59 AM | 5 (0.6%) | 0 (0.0%) |
| 11:00 AM to 11:59 AM | 0 (0.0%) | 0 (0.0%) |
| 12:00 PM to 3:59 PM | 0 (0.0%) | 52 (7.0%) |
| 4:00 PM to 11:59 PM | 26 (3.2%) | 94 (12.7%) |
| Total | 826 (100.0%) | 742 (100.0%) |
Housing Occupancy in Burlington
Occupancy by Ownership in Burlington
Of the total 1,397 dwellings in Burlington, owner-occupied units account for 896 (64.1%), while renter-occupied units make up 501 (35.9%).
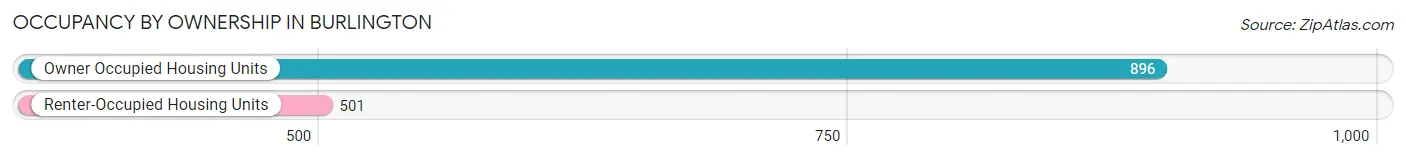
| Occupancy | # Housing Units | % Housing Units |
| Owner Occupied Housing Units | 896 | 64.1% |
| Renter-Occupied Housing Units | 501 | 35.9% |
| Total Occupied Housing Units | 1,397 | 100.0% |
Occupancy by Household Size in Burlington
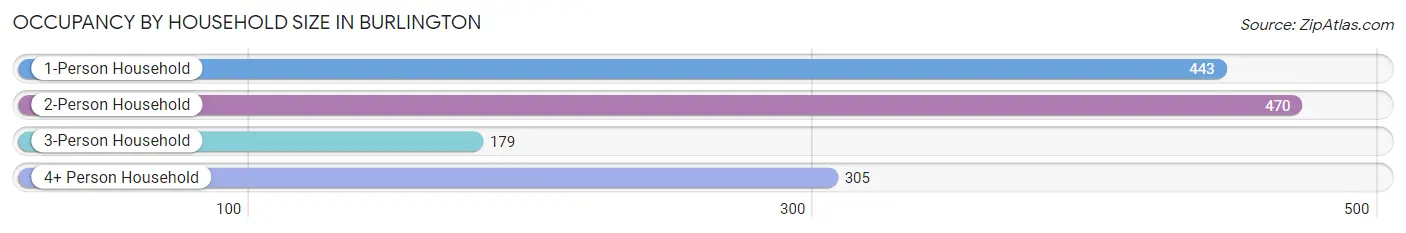
| Household Size | # Housing Units | % Housing Units |
| 1-Person Household | 443 | 31.7% |
| 2-Person Household | 470 | 33.6% |
| 3-Person Household | 179 | 12.8% |
| 4+ Person Household | 305 | 21.8% |
| Total Housing Units | 1,397 | 100.0% |
Occupancy by Ownership by Household Size in Burlington
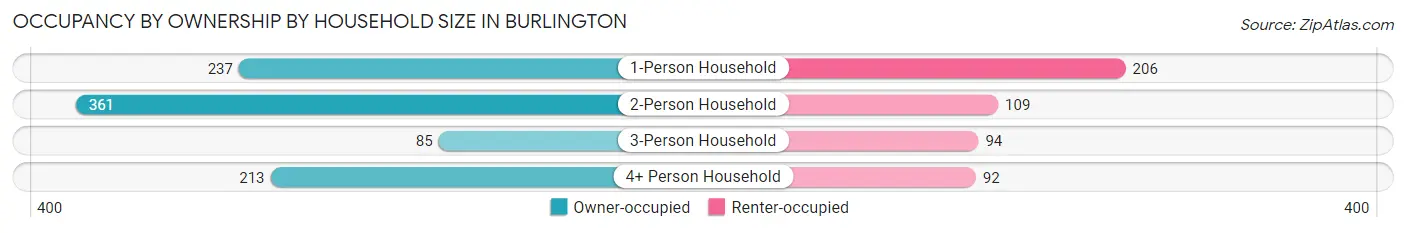
| Household Size | Owner-occupied | Renter-occupied |
| 1-Person Household | 237 (53.5%) | 206 (46.5%) |
| 2-Person Household | 361 (76.8%) | 109 (23.2%) |
| 3-Person Household | 85 (47.5%) | 94 (52.5%) |
| 4+ Person Household | 213 (69.8%) | 92 (30.2%) |
| Total Housing Units | 896 (64.1%) | 501 (35.9%) |
Occupancy by Educational Attainment in Burlington
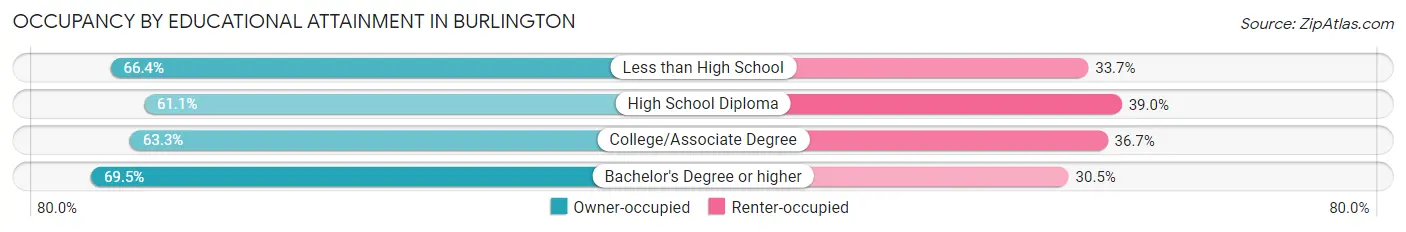
| Household Size | Owner-occupied | Renter-occupied |
| Less than High School | 138 (66.3%) | 70 (33.7%) |
| High School Diploma | 232 (61.1%) | 148 (39.0%) |
| College/Associate Degree | 369 (63.3%) | 214 (36.7%) |
| Bachelor's Degree or higher | 157 (69.5%) | 69 (30.5%) |
Occupancy by Age of Householder in Burlington
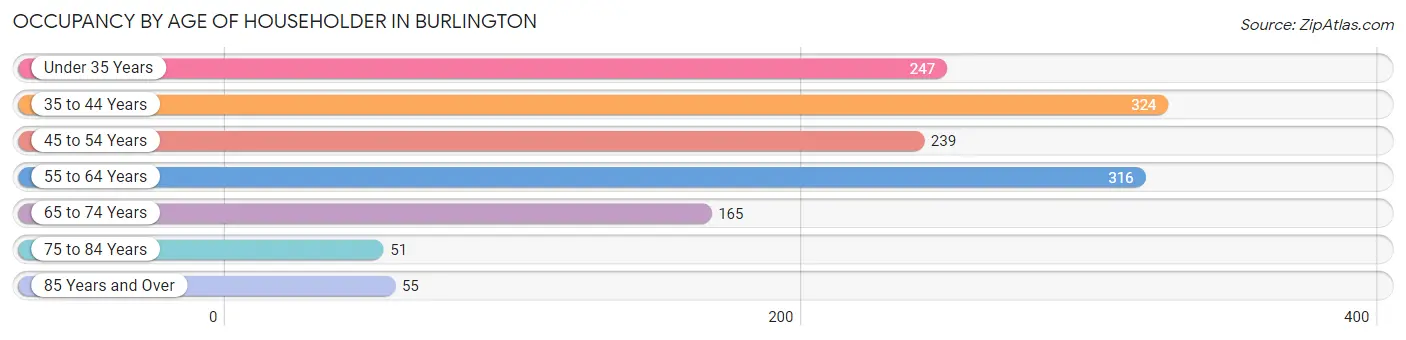
| Age Bracket | # Households | % Households |
| Under 35 Years | 247 | 17.7% |
| 35 to 44 Years | 324 | 23.2% |
| 45 to 54 Years | 239 | 17.1% |
| 55 to 64 Years | 316 | 22.6% |
| 65 to 74 Years | 165 | 11.8% |
| 75 to 84 Years | 51 | 3.6% |
| 85 Years and Over | 55 | 3.9% |
| Total | 1,397 | 100.0% |
Housing Finances in Burlington
Median Income by Occupancy in Burlington
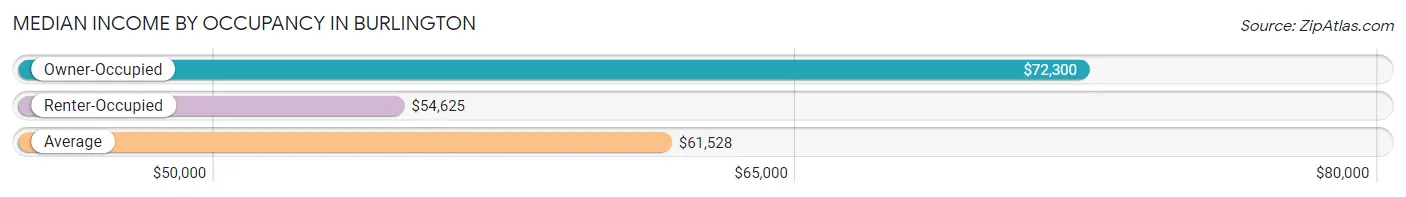
| Occupancy Type | # Households | Median Income |
| Owner-Occupied | 896 (64.1%) | $72,300 |
| Renter-Occupied | 501 (35.9%) | $54,625 |
| Average | 1,397 (100.0%) | $61,528 |
Occupancy by Householder Income Bracket in Burlington
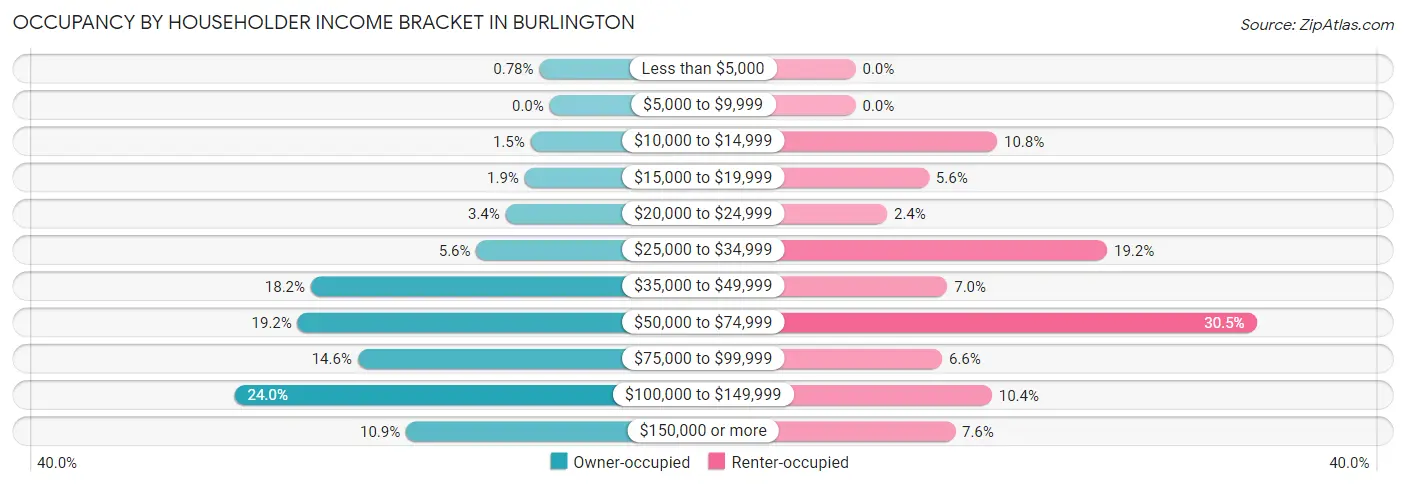
| Income Bracket | Owner-occupied | Renter-occupied |
| Less than $5,000 | 7 (0.8%) | 0 (0.0%) |
| $5,000 to $9,999 | 0 (0.0%) | 0 (0.0%) |
| $10,000 to $14,999 | 13 (1.5%) | 54 (10.8%) |
| $15,000 to $19,999 | 17 (1.9%) | 28 (5.6%) |
| $20,000 to $24,999 | 30 (3.4%) | 12 (2.4%) |
| $25,000 to $34,999 | 50 (5.6%) | 96 (19.2%) |
| $35,000 to $49,999 | 163 (18.2%) | 35 (7.0%) |
| $50,000 to $74,999 | 172 (19.2%) | 153 (30.5%) |
| $75,000 to $99,999 | 131 (14.6%) | 33 (6.6%) |
| $100,000 to $149,999 | 215 (24.0%) | 52 (10.4%) |
| $150,000 or more | 98 (10.9%) | 38 (7.6%) |
| Total | 896 (100.0%) | 501 (100.0%) |
Monthly Housing Cost Tiers in Burlington
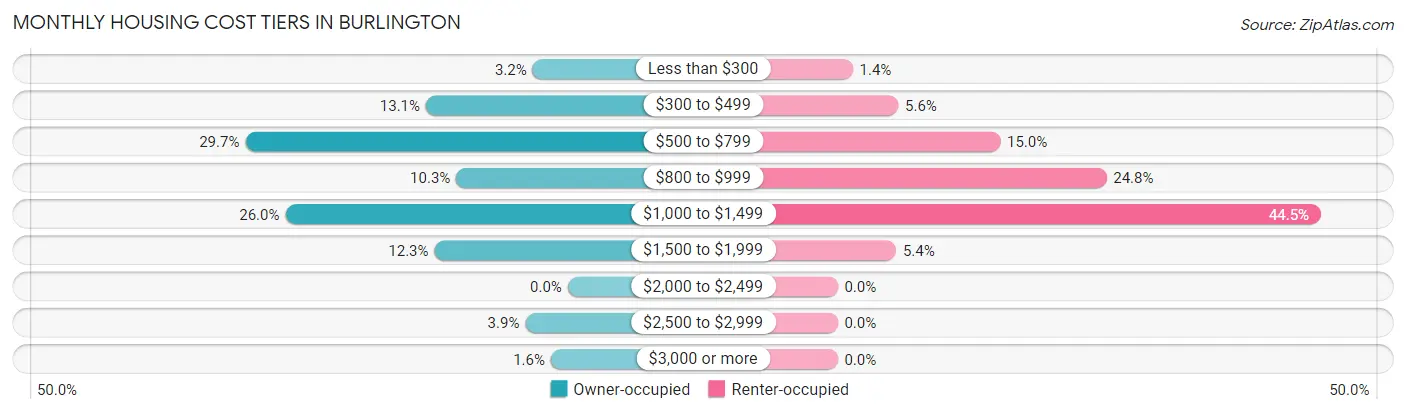
| Monthly Cost | Owner-occupied | Renter-occupied |
| Less than $300 | 29 (3.2%) | 7 (1.4%) |
| $300 to $499 | 117 (13.1%) | 28 (5.6%) |
| $500 to $799 | 266 (29.7%) | 75 (15.0%) |
| $800 to $999 | 92 (10.3%) | 124 (24.7%) |
| $1,000 to $1,499 | 233 (26.0%) | 223 (44.5%) |
| $1,500 to $1,999 | 110 (12.3%) | 27 (5.4%) |
| $2,000 to $2,499 | 0 (0.0%) | 0 (0.0%) |
| $2,500 to $2,999 | 35 (3.9%) | 0 (0.0%) |
| $3,000 or more | 14 (1.6%) | 0 (0.0%) |
| Total | 896 (100.0%) | 501 (100.0%) |
Physical Housing Characteristics in Burlington
Housing Structures in Burlington
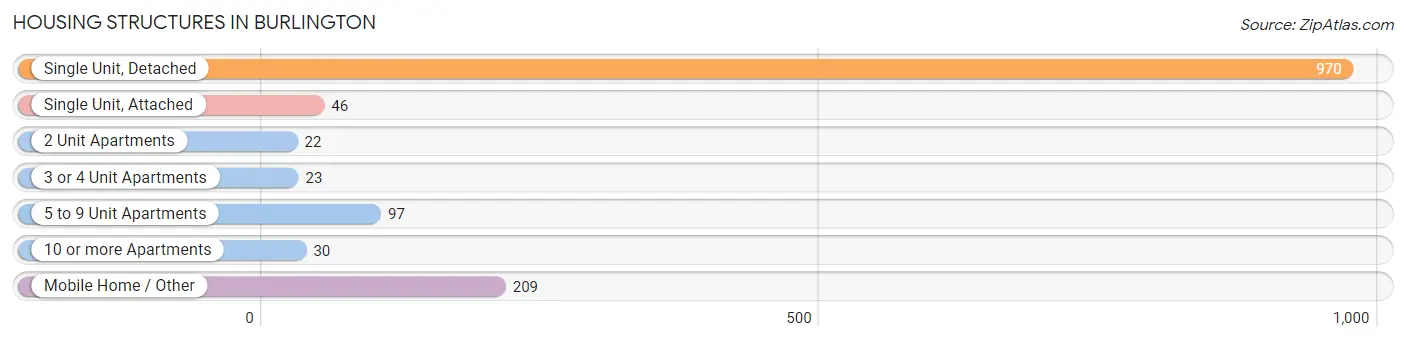
| Structure Type | # Housing Units | % Housing Units |
| Single Unit, Detached | 970 | 69.4% |
| Single Unit, Attached | 46 | 3.3% |
| 2 Unit Apartments | 22 | 1.6% |
| 3 or 4 Unit Apartments | 23 | 1.7% |
| 5 to 9 Unit Apartments | 97 | 6.9% |
| 10 or more Apartments | 30 | 2.1% |
| Mobile Home / Other | 209 | 15.0% |
| Total | 1,397 | 100.0% |
Housing Structures by Occupancy in Burlington
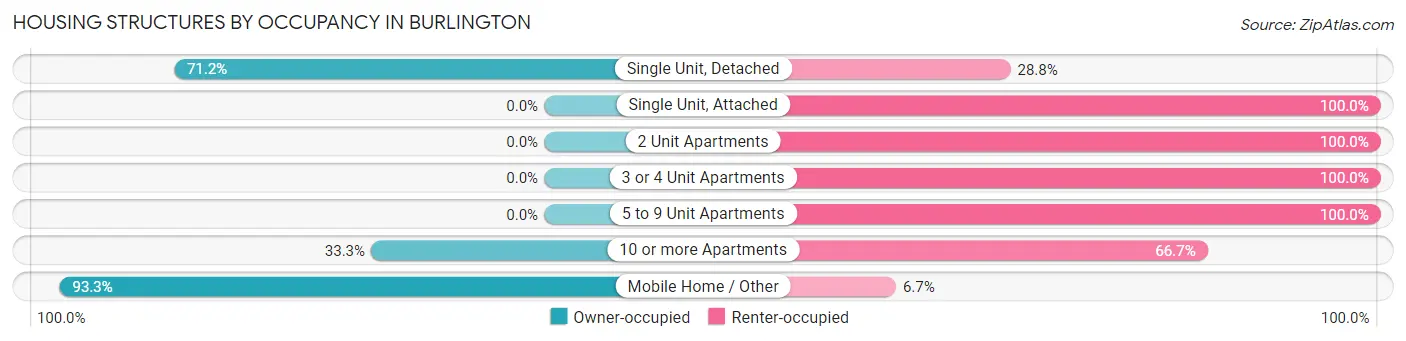
| Structure Type | Owner-occupied | Renter-occupied |
| Single Unit, Detached | 691 (71.2%) | 279 (28.8%) |
| Single Unit, Attached | 0 (0.0%) | 46 (100.0%) |
| 2 Unit Apartments | 0 (0.0%) | 22 (100.0%) |
| 3 or 4 Unit Apartments | 0 (0.0%) | 23 (100.0%) |
| 5 to 9 Unit Apartments | 0 (0.0%) | 97 (100.0%) |
| 10 or more Apartments | 10 (33.3%) | 20 (66.7%) |
| Mobile Home / Other | 195 (93.3%) | 14 (6.7%) |
| Total | 896 (64.1%) | 501 (35.9%) |
Housing Structures by Number of Rooms in Burlington
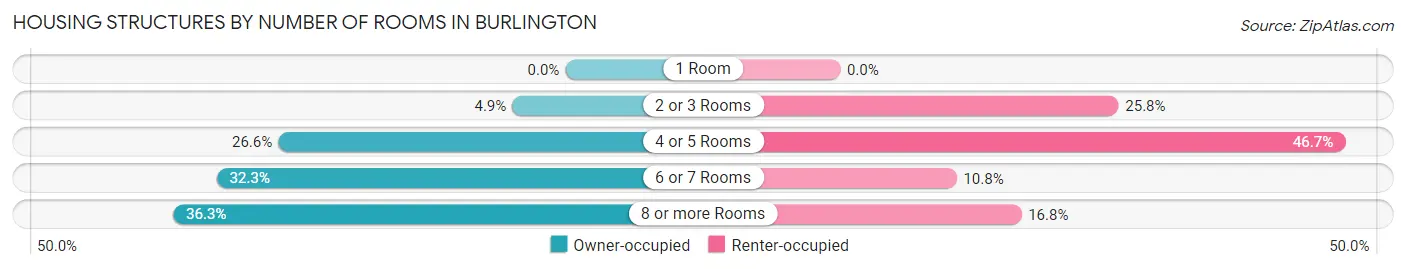
| Number of Rooms | Owner-occupied | Renter-occupied |
| 1 Room | 0 (0.0%) | 0 (0.0%) |
| 2 or 3 Rooms | 44 (4.9%) | 129 (25.8%) |
| 4 or 5 Rooms | 238 (26.6%) | 234 (46.7%) |
| 6 or 7 Rooms | 289 (32.3%) | 54 (10.8%) |
| 8 or more Rooms | 325 (36.3%) | 84 (16.8%) |
| Total | 896 (100.0%) | 501 (100.0%) |
Housing Structure by Heating Type in Burlington
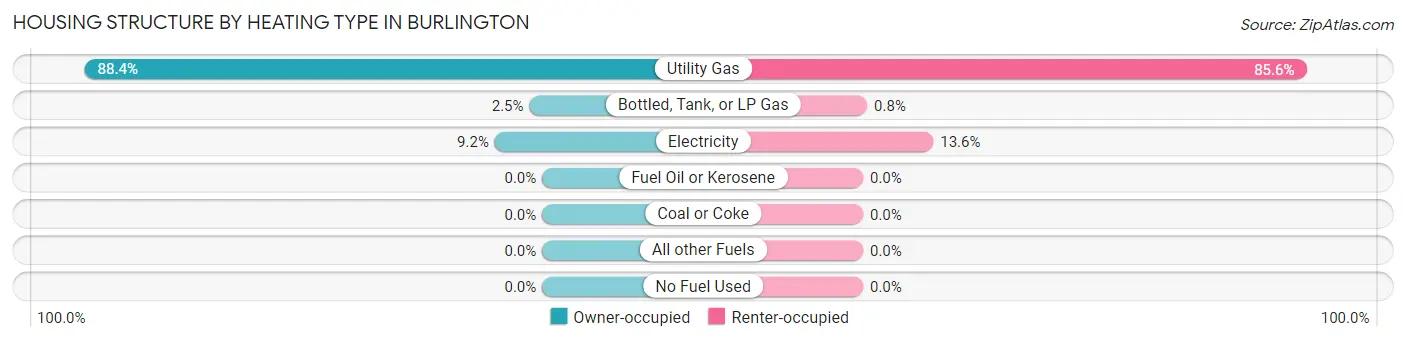
| Heating Type | Owner-occupied | Renter-occupied |
| Utility Gas | 792 (88.4%) | 429 (85.6%) |
| Bottled, Tank, or LP Gas | 22 (2.5%) | 4 (0.8%) |
| Electricity | 82 (9.1%) | 68 (13.6%) |
| Fuel Oil or Kerosene | 0 (0.0%) | 0 (0.0%) |
| Coal or Coke | 0 (0.0%) | 0 (0.0%) |
| All other Fuels | 0 (0.0%) | 0 (0.0%) |
| No Fuel Used | 0 (0.0%) | 0 (0.0%) |
| Total | 896 (100.0%) | 501 (100.0%) |
Household Vehicle Usage in Burlington
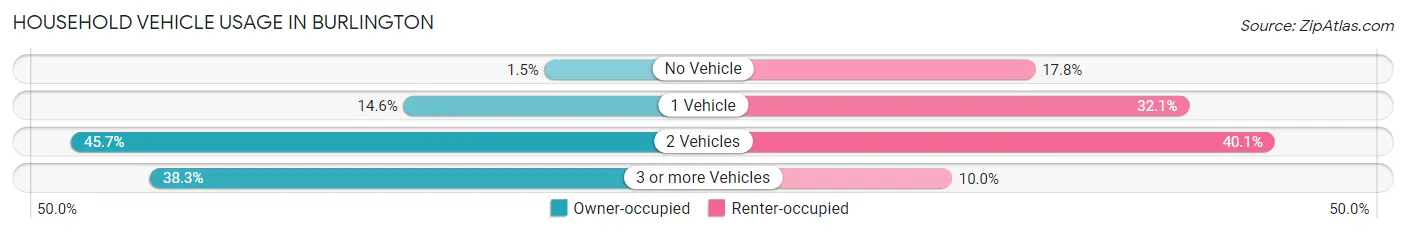
| Vehicles per Household | Owner-occupied | Renter-occupied |
| No Vehicle | 13 (1.5%) | 89 (17.8%) |
| 1 Vehicle | 131 (14.6%) | 161 (32.1%) |
| 2 Vehicles | 409 (45.7%) | 201 (40.1%) |
| 3 or more Vehicles | 343 (38.3%) | 50 (10.0%) |
| Total | 896 (100.0%) | 501 (100.0%) |
Real Estate & Mortgages in Burlington
Real Estate and Mortgage Overview in Burlington
| Characteristic | Without Mortgage | With Mortgage |
| Housing Units | 432 | 464 |
| Median Property Value | - | - |
| Median Household Income | $70,903 | $90 |
| Monthly Housing Costs | $545 | $14 |
| Real Estate Taxes | $482 | $6 |
Property Value by Mortgage Status in Burlington
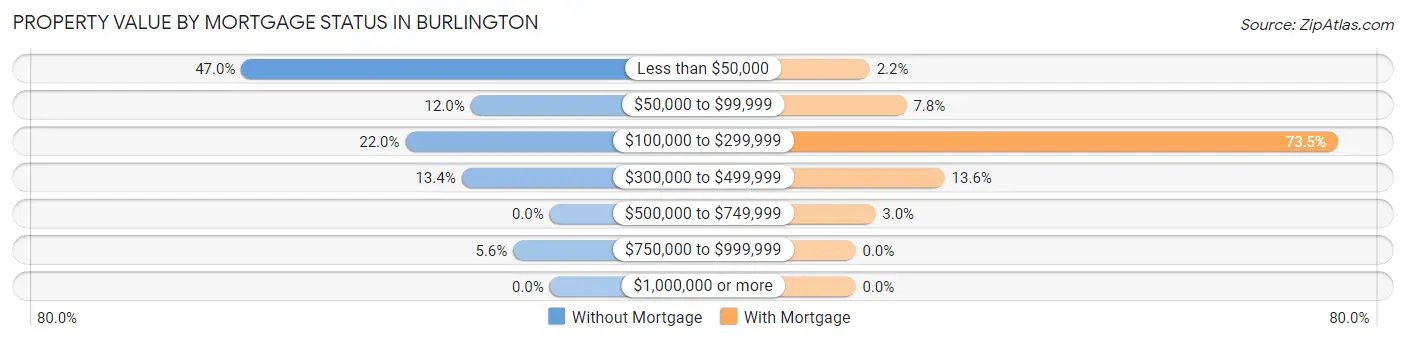
| Property Value | Without Mortgage | With Mortgage |
| Less than $50,000 | 203 (47.0%) | 10 (2.2%) |
| $50,000 to $99,999 | 52 (12.0%) | 36 (7.8%) |
| $100,000 to $299,999 | 95 (22.0%) | 341 (73.5%) |
| $300,000 to $499,999 | 58 (13.4%) | 63 (13.6%) |
| $500,000 to $749,999 | 0 (0.0%) | 14 (3.0%) |
| $750,000 to $999,999 | 24 (5.6%) | 0 (0.0%) |
| $1,000,000 or more | 0 (0.0%) | 0 (0.0%) |
| Total | 432 (100.0%) | 464 (100.0%) |
Household Income by Mortgage Status in Burlington
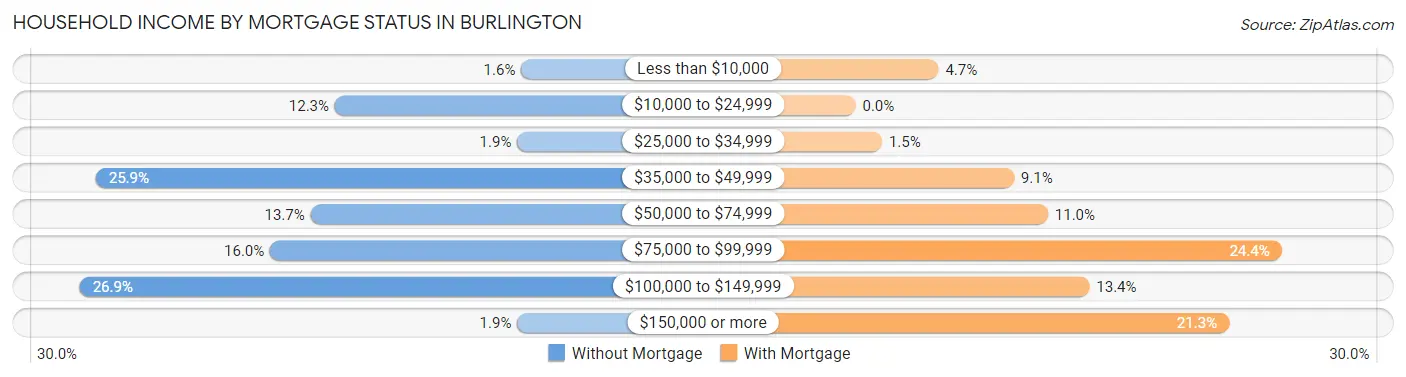
| Household Income | Without Mortgage | With Mortgage |
| Less than $10,000 | 7 (1.6%) | 22 (4.7%) |
| $10,000 to $24,999 | 53 (12.3%) | 0 (0.0%) |
| $25,000 to $34,999 | 8 (1.8%) | 7 (1.5%) |
| $35,000 to $49,999 | 112 (25.9%) | 42 (9.0%) |
| $50,000 to $74,999 | 59 (13.7%) | 51 (11.0%) |
| $75,000 to $99,999 | 69 (16.0%) | 113 (24.3%) |
| $100,000 to $149,999 | 116 (26.9%) | 62 (13.4%) |
| $150,000 or more | 8 (1.8%) | 99 (21.3%) |
| Total | 432 (100.0%) | 464 (100.0%) |
Property Value to Household Income Ratio in Burlington
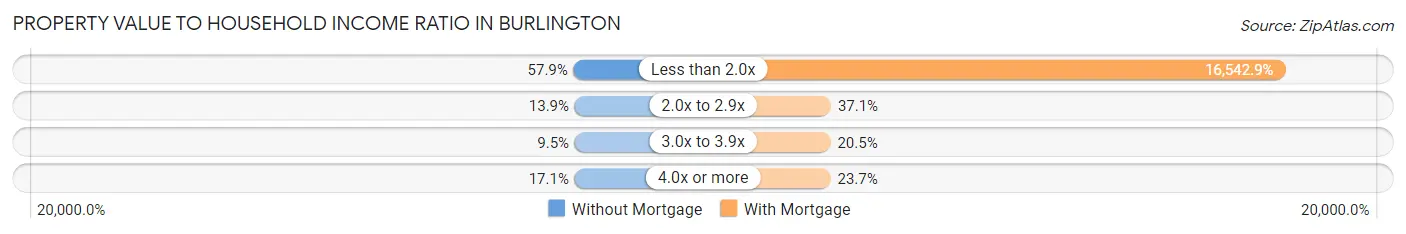
| Value-to-Income Ratio | Without Mortgage | With Mortgage |
| Less than 2.0x | 250 (57.9%) | 76,759 (16,542.9%) |
| 2.0x to 2.9x | 60 (13.9%) | 172 (37.1%) |
| 3.0x to 3.9x | 41 (9.5%) | 95 (20.5%) |
| 4.0x or more | 74 (17.1%) | 110 (23.7%) |
| Total | 432 (100.0%) | 464 (100.0%) |
Real Estate Taxes by Mortgage Status in Burlington
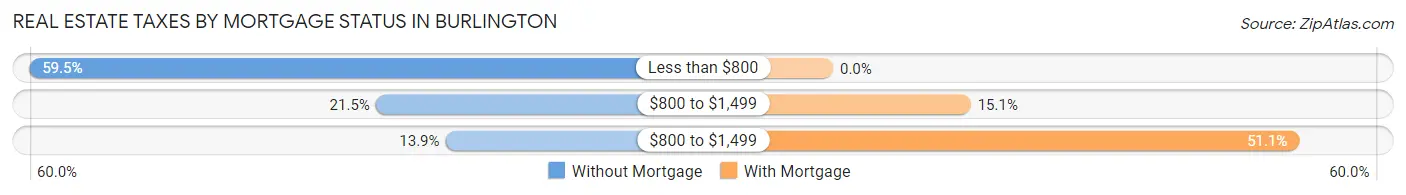
| Property Taxes | Without Mortgage | With Mortgage |
| Less than $800 | 257 (59.5%) | 0 (0.0%) |
| $800 to $1,499 | 93 (21.5%) | 70 (15.1%) |
| $800 to $1,499 | 60 (13.9%) | 237 (51.1%) |
| Total | 432 (100.0%) | 464 (100.0%) |
Health & Disability in Burlington
Health Insurance Coverage by Age in Burlington
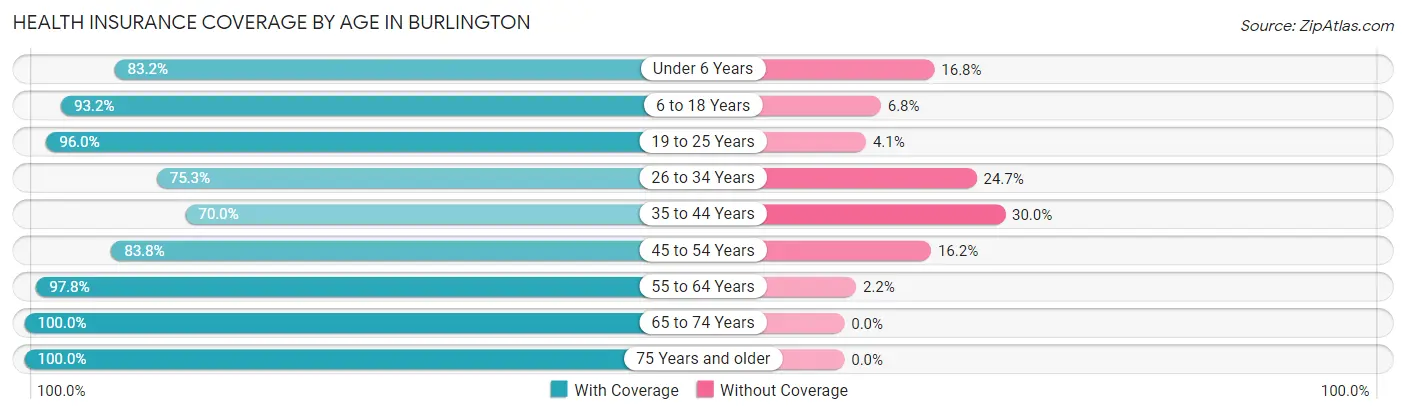
| Age Bracket | With Coverage | Without Coverage |
| Under 6 Years | 208 (83.2%) | 42 (16.8%) |
| 6 to 18 Years | 547 (93.2%) | 40 (6.8%) |
| 19 to 25 Years | 237 (96.0%) | 10 (4.1%) |
| 26 to 34 Years | 223 (75.3%) | 73 (24.7%) |
| 35 to 44 Years | 292 (70.0%) | 125 (30.0%) |
| 45 to 54 Years | 311 (83.8%) | 60 (16.2%) |
| 55 to 64 Years | 446 (97.8%) | 10 (2.2%) |
| 65 to 74 Years | 314 (100.0%) | 0 (0.0%) |
| 75 Years and older | 188 (100.0%) | 0 (0.0%) |
| Total | 2,766 (88.5%) | 360 (11.5%) |
Health Insurance Coverage by Citizenship Status in Burlington
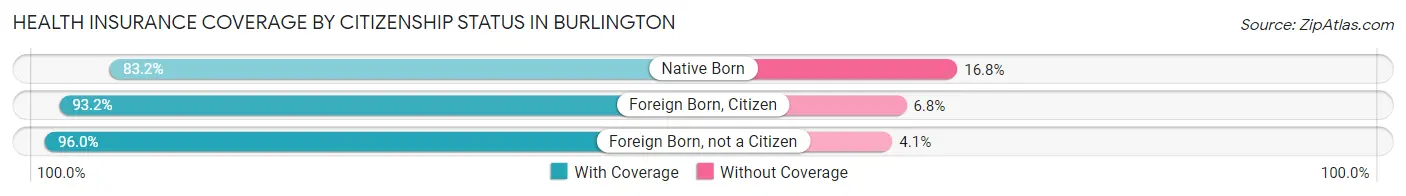
| Citizenship Status | With Coverage | Without Coverage |
| Native Born | 208 (83.2%) | 42 (16.8%) |
| Foreign Born, Citizen | 547 (93.2%) | 40 (6.8%) |
| Foreign Born, not a Citizen | 237 (96.0%) | 10 (4.1%) |
Health Insurance Coverage by Household Income in Burlington
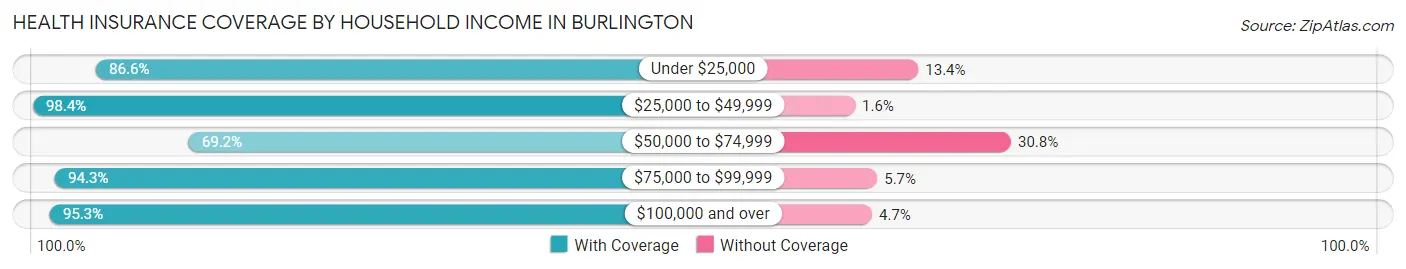
| Household Income | With Coverage | Without Coverage |
| Under $25,000 | 226 (86.6%) | 35 (13.4%) |
| $25,000 to $49,999 | 629 (98.4%) | 10 (1.6%) |
| $50,000 to $74,999 | 551 (69.2%) | 245 (30.8%) |
| $75,000 to $99,999 | 380 (94.3%) | 23 (5.7%) |
| $100,000 and over | 944 (95.3%) | 47 (4.7%) |
Public vs Private Health Insurance Coverage by Age in Burlington
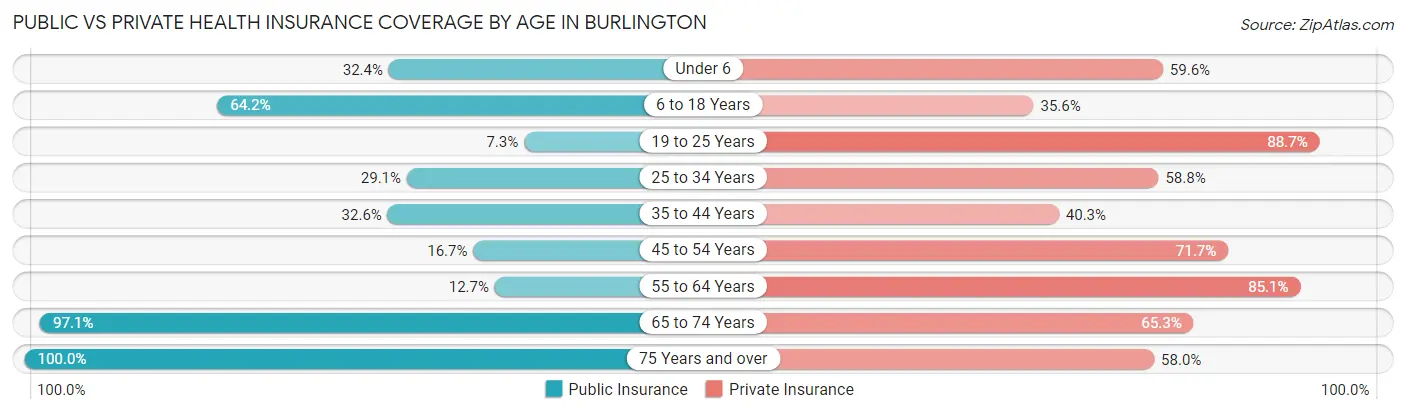
| Age Bracket | Public Insurance | Private Insurance |
| Under 6 | 81 (32.4%) | 149 (59.6%) |
| 6 to 18 Years | 377 (64.2%) | 209 (35.6%) |
| 19 to 25 Years | 18 (7.3%) | 219 (88.7%) |
| 25 to 34 Years | 86 (29.0%) | 174 (58.8%) |
| 35 to 44 Years | 136 (32.6%) | 168 (40.3%) |
| 45 to 54 Years | 62 (16.7%) | 266 (71.7%) |
| 55 to 64 Years | 58 (12.7%) | 388 (85.1%) |
| 65 to 74 Years | 305 (97.1%) | 205 (65.3%) |
| 75 Years and over | 188 (100.0%) | 109 (58.0%) |
| Total | 1,311 (41.9%) | 1,887 (60.4%) |
Disability Status by Sex by Age in Burlington
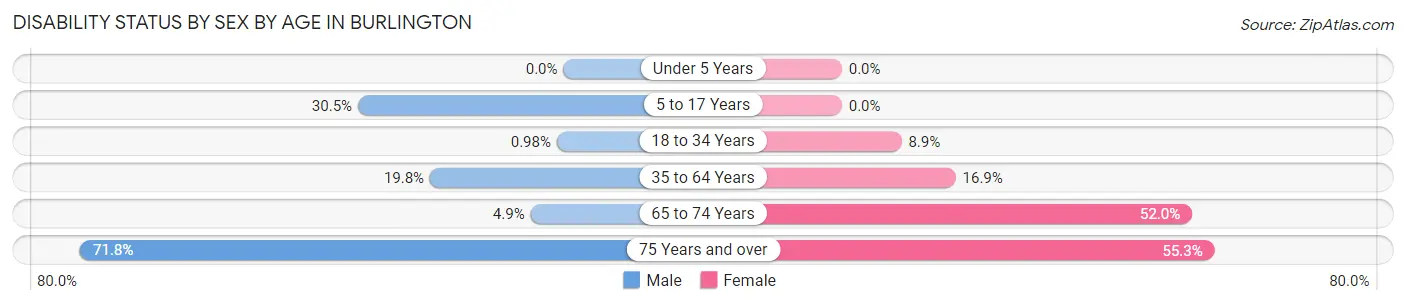
| Age Bracket | Male | Female |
| Under 5 Years | 0 (0.0%) | 0 (0.0%) |
| 5 to 17 Years | 83 (30.5%) | 0 (0.0%) |
| 18 to 34 Years | 3 (1.0%) | 24 (8.9%) |
| 35 to 64 Years | 107 (19.8%) | 119 (16.9%) |
| 65 to 74 Years | 8 (4.9%) | 78 (52.0%) |
| 75 Years and over | 61 (71.8%) | 57 (55.3%) |
Disability Class by Sex by Age in Burlington
Disability Class: Hearing Difficulty
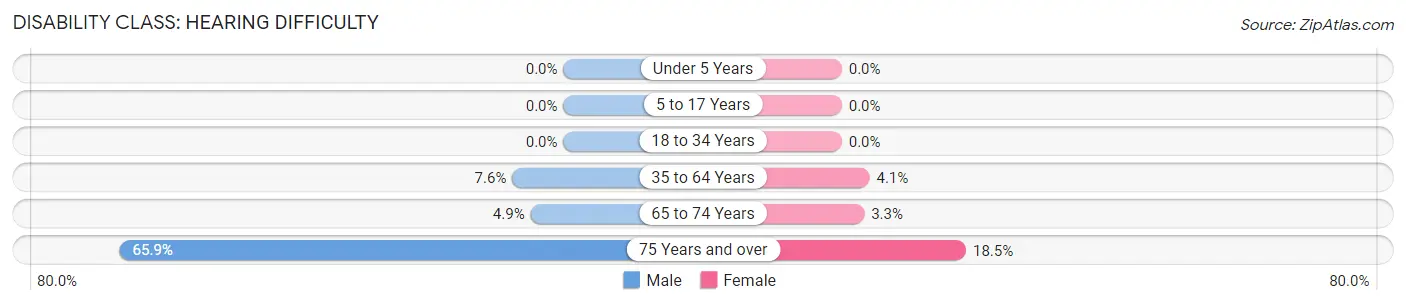
| Age Bracket | Male | Female |
| Under 5 Years | 0 (0.0%) | 0 (0.0%) |
| 5 to 17 Years | 0 (0.0%) | 0 (0.0%) |
| 18 to 34 Years | 0 (0.0%) | 0 (0.0%) |
| 35 to 64 Years | 41 (7.6%) | 29 (4.1%) |
| 65 to 74 Years | 8 (4.9%) | 5 (3.3%) |
| 75 Years and over | 56 (65.9%) | 19 (18.4%) |
Disability Class: Vision Difficulty
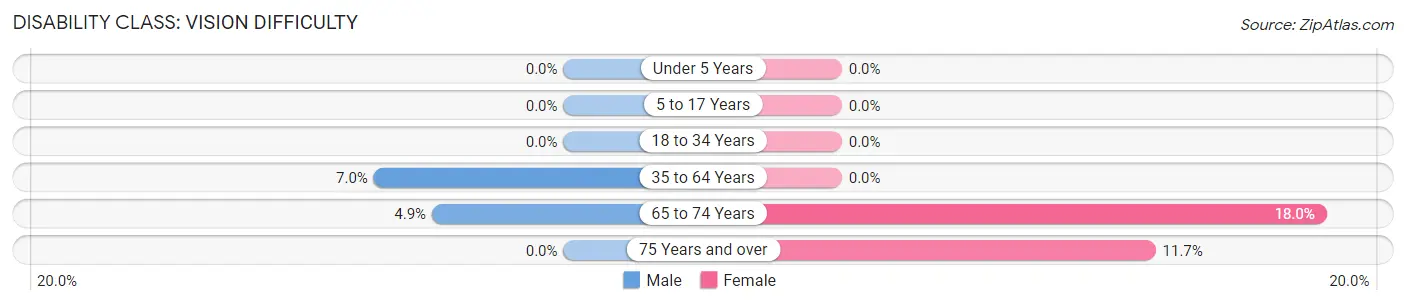
| Age Bracket | Male | Female |
| Under 5 Years | 0 (0.0%) | 0 (0.0%) |
| 5 to 17 Years | 0 (0.0%) | 0 (0.0%) |
| 18 to 34 Years | 0 (0.0%) | 0 (0.0%) |
| 35 to 64 Years | 38 (7.0%) | 0 (0.0%) |
| 65 to 74 Years | 8 (4.9%) | 27 (18.0%) |
| 75 Years and over | 0 (0.0%) | 12 (11.7%) |
Disability Class: Cognitive Difficulty
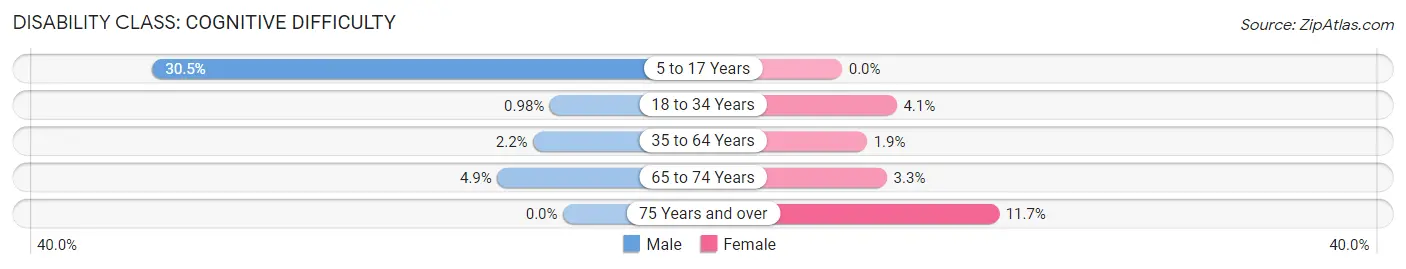
| Age Bracket | Male | Female |
| 5 to 17 Years | 83 (30.5%) | 0 (0.0%) |
| 18 to 34 Years | 3 (1.0%) | 11 (4.1%) |
| 35 to 64 Years | 12 (2.2%) | 13 (1.8%) |
| 65 to 74 Years | 8 (4.9%) | 5 (3.3%) |
| 75 Years and over | 0 (0.0%) | 12 (11.7%) |
Disability Class: Ambulatory Difficulty
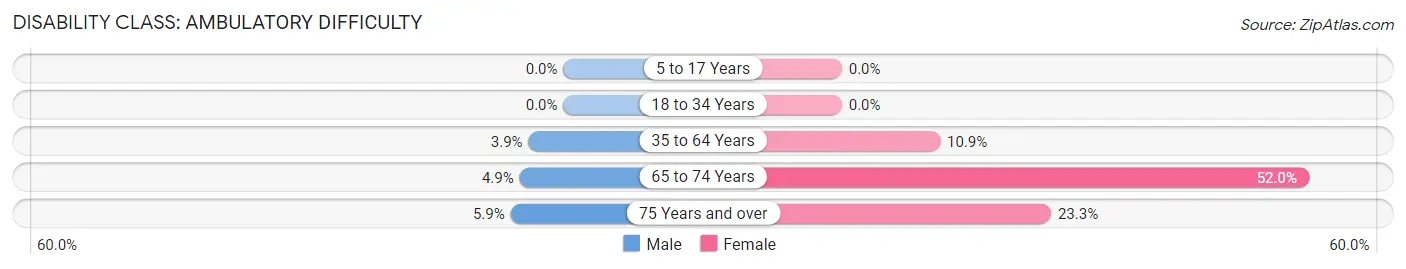
| Age Bracket | Male | Female |
| 5 to 17 Years | 0 (0.0%) | 0 (0.0%) |
| 18 to 34 Years | 0 (0.0%) | 0 (0.0%) |
| 35 to 64 Years | 21 (3.9%) | 77 (10.9%) |
| 65 to 74 Years | 8 (4.9%) | 78 (52.0%) |
| 75 Years and over | 5 (5.9%) | 24 (23.3%) |
Disability Class: Self-Care Difficulty
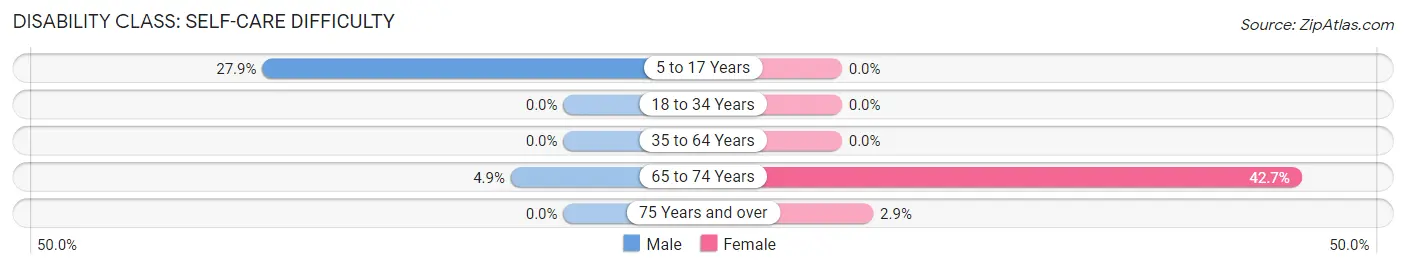
| Age Bracket | Male | Female |
| 5 to 17 Years | 76 (27.9%) | 0 (0.0%) |
| 18 to 34 Years | 0 (0.0%) | 0 (0.0%) |
| 35 to 64 Years | 0 (0.0%) | 0 (0.0%) |
| 65 to 74 Years | 8 (4.9%) | 64 (42.7%) |
| 75 Years and over | 0 (0.0%) | 3 (2.9%) |
Technology Access in Burlington
Computing Device Access in Burlington
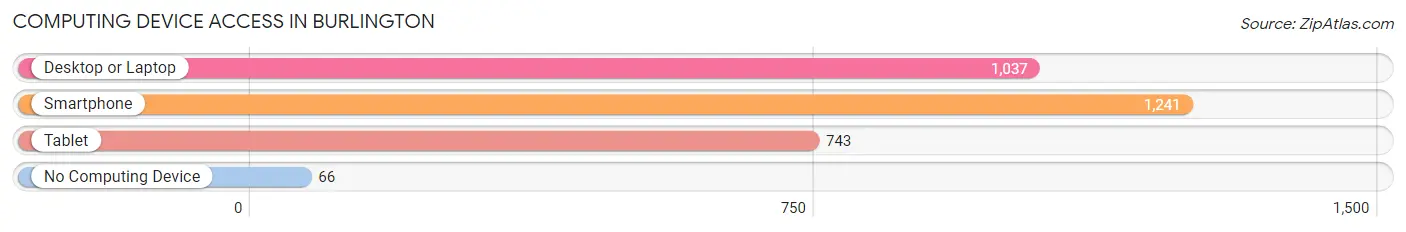
| Device Type | # Households | % Households |
| Desktop or Laptop | 1,037 | 74.2% |
| Smartphone | 1,241 | 88.8% |
| Tablet | 743 | 53.2% |
| No Computing Device | 66 | 4.7% |
| Total | 1,397 | 100.0% |
Internet Access in Burlington
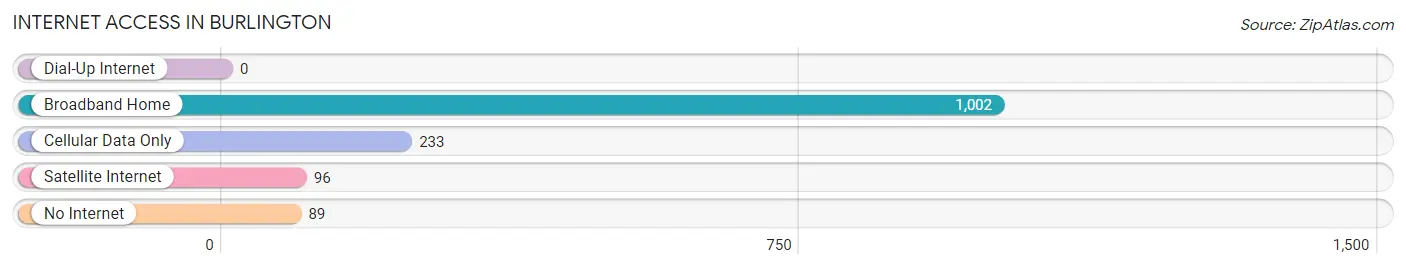
| Internet Type | # Households | % Households |
| Dial-Up Internet | 0 | 0.0% |
| Broadband Home | 1,002 | 71.7% |
| Cellular Data Only | 233 | 16.7% |
| Satellite Internet | 96 | 6.9% |
| No Internet | 89 | 6.4% |
| Total | 1,397 | 100.0% |
Burlington Summary
Burlington, Colorado is a small town located in the eastern plains of the state, approximately 50 miles northeast of Denver. It is the county seat of Kit Carson County and is home to a population of approximately 4,000 people. The town was founded in 1887 and has a rich history of agriculture, ranching, and railroad development.
Geography
Burlington is located in the eastern plains of Colorado, in the South Platte River Valley. The town is situated at an elevation of 4,719 feet and is surrounded by rolling hills and prairies. The town is located in the High Plains region of the state, which is characterized by dry, windy conditions and a semi-arid climate. The average annual precipitation is approximately 15 inches, with most of the precipitation occurring in the spring and summer months. The average temperature in Burlington is around 50 degrees Fahrenheit, with temperatures ranging from the low 30s in the winter to the high 90s in the summer.
Economy
The economy of Burlington is largely based on agriculture and ranching. The town is home to several large farms and ranches, which produce a variety of crops, including corn, wheat, and hay. The town is also home to several feedlots, which provide feed for the local livestock industry. In addition, Burlington is home to several manufacturing and processing plants, which produce a variety of products, including food, clothing, and furniture.
The town is also home to several retail stores, restaurants, and other businesses. The town is served by two major highways, Interstate 70 and US Highway 287, which provide access to Denver and other major cities in the region.
Demographics
As of the 2010 census, the population of Burlington was 4,087. The racial makeup of the town was 94.3% White, 0.7% African American, 0.7% Native American, 0.3% Asian, 0.1% Pacific Islander, 2.2% from other races, and 1.9% from two or more races. Hispanic or Latino of any race were 6.3% of the population.
The median income for a household in Burlington was $37,917, and the median income for a family was $45,938. The per capita income for the town was $18,945. About 11.2% of families and 14.2% of the population were below the poverty line, including 18.2% of those under age 18 and 8.2% of those age 65 or over.
Burlington is served by the Burlington School District, which includes two elementary schools, one middle school, and one high school. The town is also home to several churches, a library, and a museum.
Burlington is a small town with a rich history and a vibrant economy. The town is home to a diverse population and is served by several major highways, providing access to Denver and other major cities in the region. The town is also home to several farms and ranches, which provide a variety of products to the local economy. The town is served by the Burlington School District, which provides educational opportunities for the town's children.
Common Questions
What is Per Capita Income in Burlington?
Per Capita income in Burlington is $35,799.
What is the Median Family Income in Burlington?
Median Family Income in Burlington is $75,592.
What is the Median Household income in Burlington?
Median Household Income in Burlington is $61,528.
What is Income or Wage Gap in Burlington?
Income or Wage Gap in Burlington is 49.8%.
Women in Burlington earn 50.2 cents for every dollar earned by a man.
What is Inequality or Gini Index in Burlington?
Inequality or Gini Index in Burlington is 0.42.
What is the Total Population of Burlington?
Total Population of Burlington is 3,184.
What is the Total Male Population of Burlington?
Total Male Population of Burlington is 1,527.
What is the Total Female Population of Burlington?
Total Female Population of Burlington is 1,657.
What is the Ratio of Males per 100 Females in Burlington?
There are 92.15 Males per 100 Females in Burlington.
What is the Ratio of Females per 100 Males in Burlington?
There are 108.51 Females per 100 Males in Burlington.
What is the Median Population Age in Burlington?
Median Population Age in Burlington is 39.8 Years.
What is the Average Family Size in Burlington
Average Family Size in Burlington is 2.8 People.
What is the Average Household Size in Burlington
Average Household Size in Burlington is 2.2 People.
How Large is the Labor Force in Burlington?
There are 1,783 People in the Labor Forcein in Burlington.
What is the Percentage of People in the Labor Force in Burlington?
72.3% of People are in the Labor Force in Burlington.
What is the Unemployment Rate in Burlington?
Unemployment Rate in Burlington is 2.6%.