Brookside, CO Map & Demographics
Brookside Map
Brookside Overview
$41,948
PER CAPITA INCOME
$65,000
AVG FAMILY INCOME
$57,188
AVG HOUSEHOLD INCOME
63.6%
WAGE / INCOME GAP [ % ]
36.4¢/ $1
WAGE / INCOME GAP [ $ ]
$4,638
FAMILY INCOME DEFICIT
0.50
INEQUALITY / GINI INDEX
290
TOTAL POPULATION
152
MALE POPULATION
138
FEMALE POPULATION
110.14
MALES / 100 FEMALES
90.79
FEMALES / 100 MALES
53.8
MEDIAN AGE
2.7
AVG FAMILY SIZE
2.3
AVG HOUSEHOLD SIZE
137
LABOR FORCE [ PEOPLE ]
52.9%
PERCENT IN LABOR FORCE
20.4%
UNEMPLOYMENT RATE
Brookside Area Codes
Income in Brookside
Income Overview in Brookside
Per Capita Income in Brookside is $41,948, while median incomes of families and households are $65,000 and $57,188 respectively.
| Characteristic | Number | Measure |
| Per Capita Income | 290 | $41,948 |
| Median Family Income | 86 | $65,000 |
| Mean Family Income | 86 | $106,437 |
| Median Household Income | 127 | $57,188 |
| Mean Household Income | 127 | $89,719 |
| Income Deficit | 86 | $4,638 |
| Wage / Income Gap (%) | 290 | 63.60% |
| Wage / Income Gap ($) | 290 | 36.40¢ per $1 |
| Gini / Inequality Index | 290 | 0.50 |
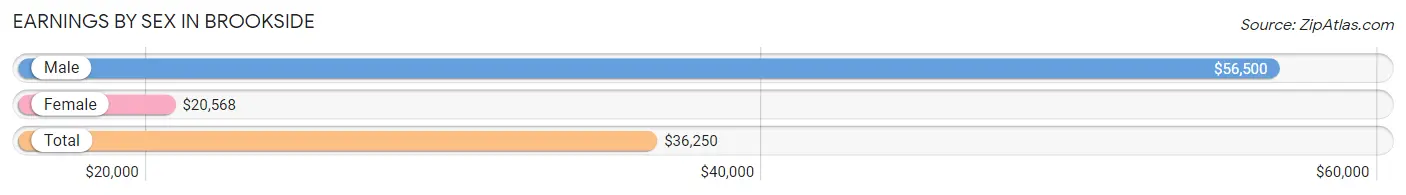
Earnings by Sex in Brookside
Average Earnings in Brookside are $36,250, $56,500 for men and $20,568 for women, a difference of 63.6%.
| Sex | Number | Average Earnings |
| Male | 74 (54.8%) | $56,500 |
| Female | 61 (45.2%) | $20,568 |
| Total | 135 (100.0%) | $36,250 |
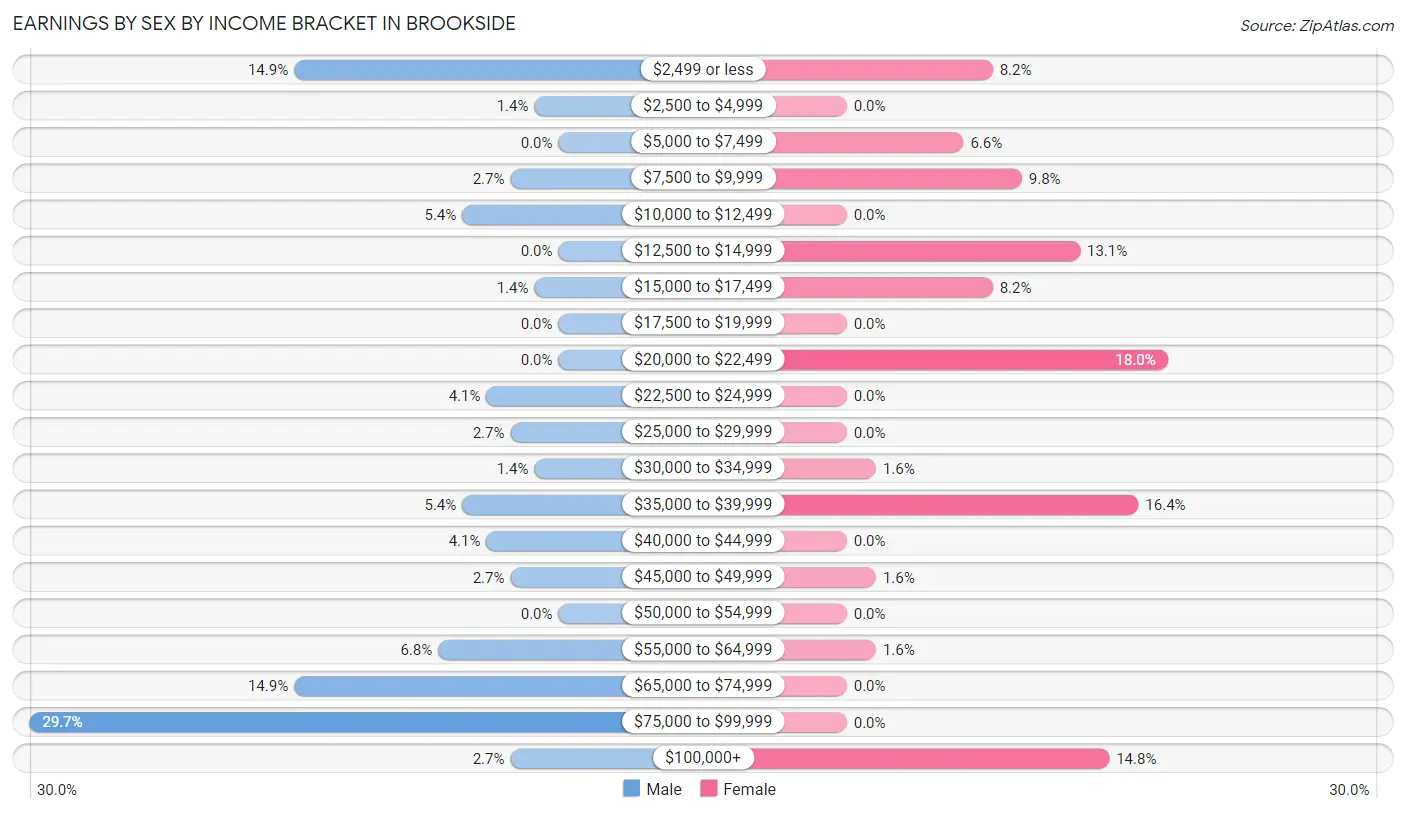
Earnings by Sex by Income Bracket in Brookside
The most common earnings brackets in Brookside are $75,000 to $99,999 for men (22 | 29.7%) and $20,000 to $22,499 for women (11 | 18.0%).
| Income | Male | Female |
| $2,499 or less | 11 (14.9%) | 5 (8.2%) |
| $2,500 to $4,999 | 1 (1.3%) | 0 (0.0%) |
| $5,000 to $7,499 | 0 (0.0%) | 4 (6.6%) |
| $7,500 to $9,999 | 2 (2.7%) | 6 (9.8%) |
| $10,000 to $12,499 | 4 (5.4%) | 0 (0.0%) |
| $12,500 to $14,999 | 0 (0.0%) | 8 (13.1%) |
| $15,000 to $17,499 | 1 (1.3%) | 5 (8.2%) |
| $17,500 to $19,999 | 0 (0.0%) | 0 (0.0%) |
| $20,000 to $22,499 | 0 (0.0%) | 11 (18.0%) |
| $22,500 to $24,999 | 3 (4.1%) | 0 (0.0%) |
| $25,000 to $29,999 | 2 (2.7%) | 0 (0.0%) |
| $30,000 to $34,999 | 1 (1.3%) | 1 (1.6%) |
| $35,000 to $39,999 | 4 (5.4%) | 10 (16.4%) |
| $40,000 to $44,999 | 3 (4.1%) | 0 (0.0%) |
| $45,000 to $49,999 | 2 (2.7%) | 1 (1.6%) |
| $50,000 to $54,999 | 0 (0.0%) | 0 (0.0%) |
| $55,000 to $64,999 | 5 (6.8%) | 1 (1.6%) |
| $65,000 to $74,999 | 11 (14.9%) | 0 (0.0%) |
| $75,000 to $99,999 | 22 (29.7%) | 0 (0.0%) |
| $100,000+ | 2 (2.7%) | 9 (14.7%) |
| Total | 74 (100.0%) | 61 (100.0%) |
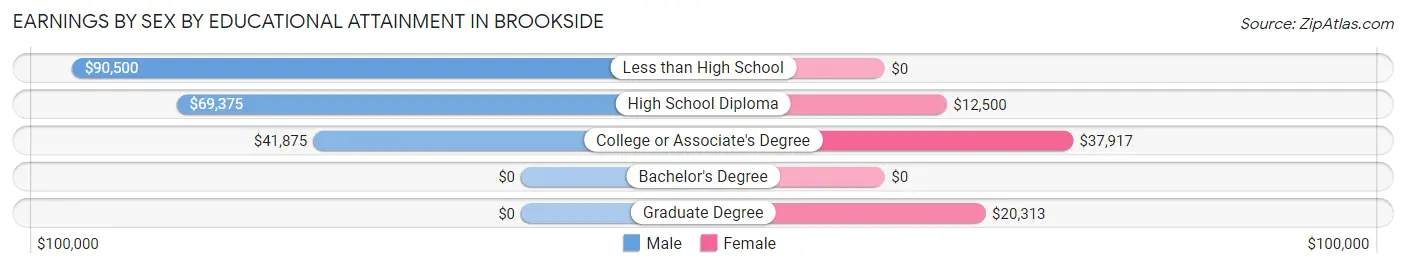
Earnings by Sex by Educational Attainment in Brookside
Average earnings in Brookside are $56,500 for men and $21,023 for women, a difference of 62.8%. Men with an educational attainment of less than high school enjoy the highest average annual earnings of $90,500, while those with college or associate's degree education earn the least with $41,875. Women with an educational attainment of college or associate's degree earn the most with the average annual earnings of $37,917, while those with high school diploma education have the smallest earnings of $12,500.
| Educational Attainment | Male Income | Female Income |
| Less than High School | $90,500 | $0 |
| High School Diploma | $69,375 | $12,500 |
| College or Associate's Degree | $41,875 | $37,917 |
| Bachelor's Degree | - | - |
| Graduate Degree | - | - |
| Total | $56,500 | $21,023 |
Family Income in Brookside
Family Income Brackets in Brookside
According to the Brookside family income data, there are 21 families falling into the $50,000 to $74,999 income range, which is the most common income bracket and makes up 24.4% of all families.
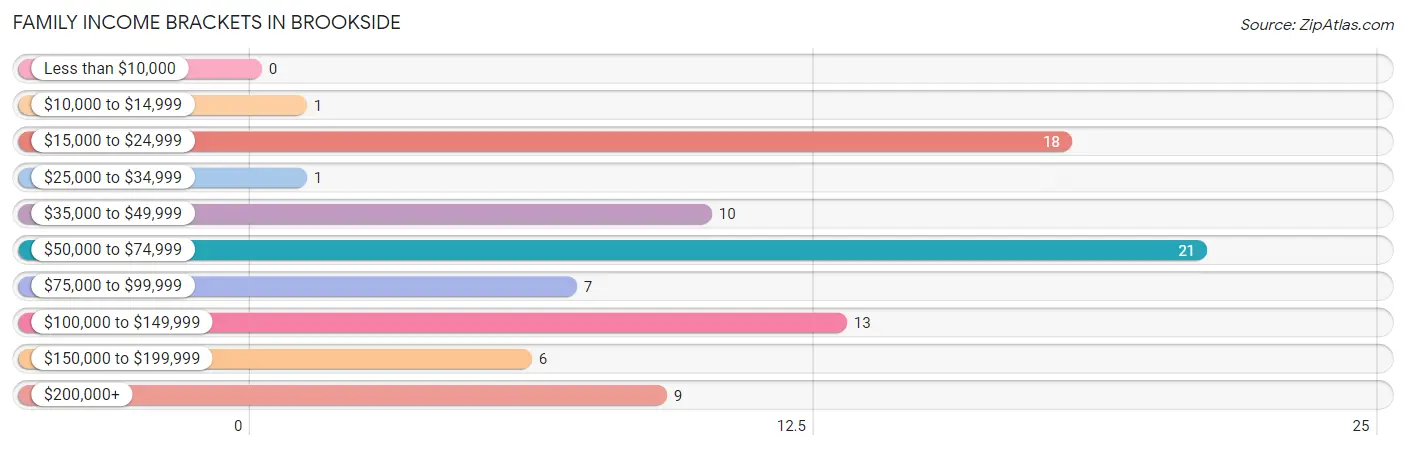
| Income Bracket | # Families | % Families |
| Less than $10,000 | 0 | 0.0% |
| $10,000 to $14,999 | 1 | 1.2% |
| $15,000 to $24,999 | 18 | 20.9% |
| $25,000 to $34,999 | 1 | 1.2% |
| $35,000 to $49,999 | 10 | 11.6% |
| $50,000 to $74,999 | 21 | 24.4% |
| $75,000 to $99,999 | 7 | 8.1% |
| $100,000 to $149,999 | 13 | 15.1% |
| $150,000 to $199,999 | 6 | 7.0% |
| $200,000+ | 9 | 10.5% |
Family Income by Famaliy Size in Brookside
2-person families (55 | 63.9%) account for the highest median family income in Brookside with $64,375 per family, while 2-person families (55 | 63.9%) have the highest median income of $32,188 per family member.
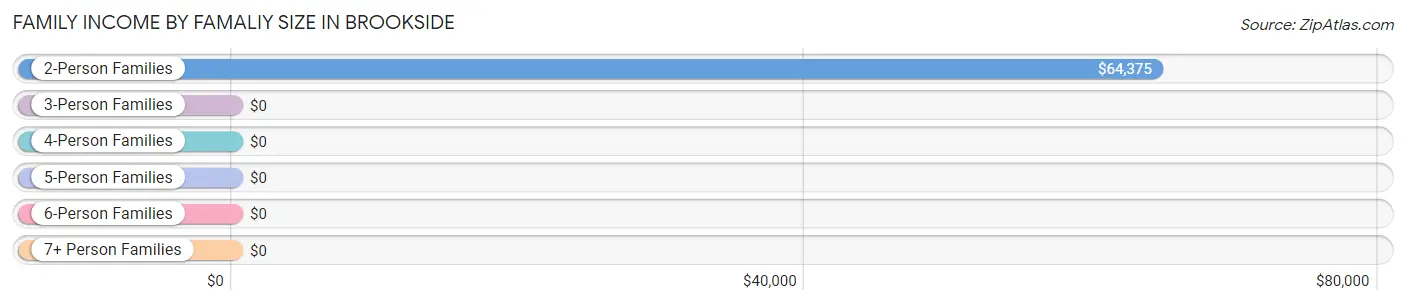
| Income Bracket | # Families | Median Income |
| 2-Person Families | 55 (63.9%) | $64,375 |
| 3-Person Families | 10 (11.6%) | $0 |
| 4-Person Families | 17 (19.8%) | $0 |
| 5-Person Families | 4 (4.6%) | $0 |
| 6-Person Families | 0 (0.0%) | $0 |
| 7+ Person Families | 0 (0.0%) | $0 |
| Total | 86 (100.0%) | $65,000 |
Family Income by Number of Earners in Brookside
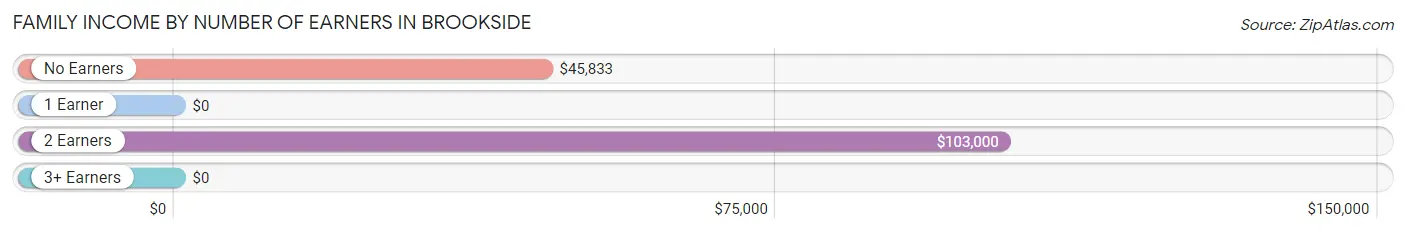
| Number of Earners | # Families | Median Income |
| No Earners | 30 (34.9%) | $45,833 |
| 1 Earner | 19 (22.1%) | $0 |
| 2 Earners | 34 (39.5%) | $103,000 |
| 3+ Earners | 3 (3.5%) | $0 |
| Total | 86 (100.0%) | $65,000 |
Household Income in Brookside
Household Income Brackets in Brookside
With 39 households falling in the category, the $15,000 to $24,999 income range is the most frequent in Brookside, accounting for 30.7% of all households. In contrast, only 1 households (0.8%) fall into the less than $10,000 income bracket, making it the least populous group.
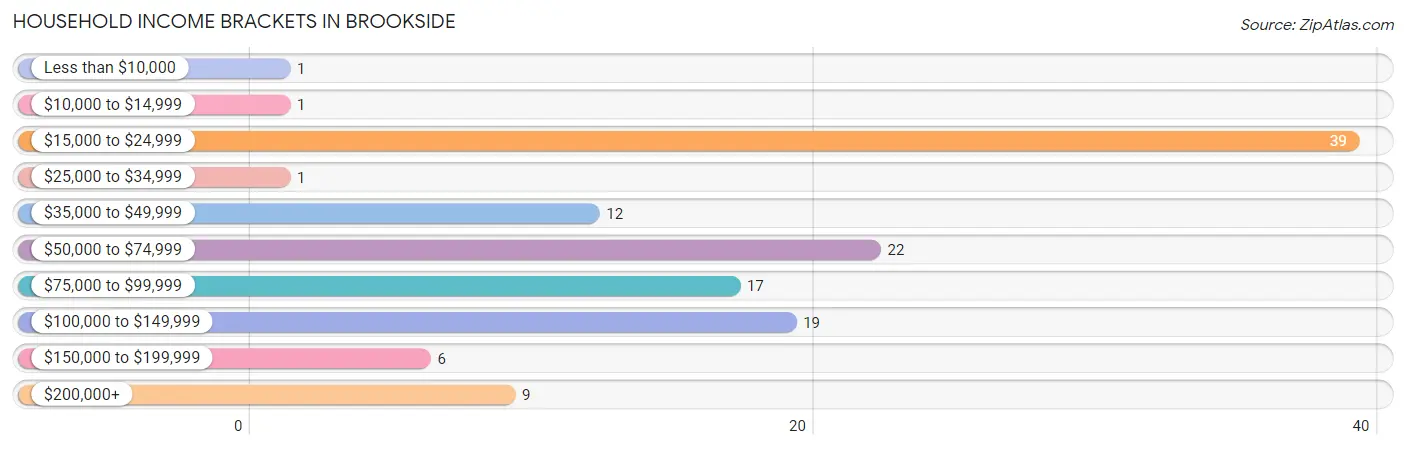
| Income Bracket | # Households | % Households |
| Less than $10,000 | 1 | 0.8% |
| $10,000 to $14,999 | 1 | 0.8% |
| $15,000 to $24,999 | 39 | 30.7% |
| $25,000 to $34,999 | 1 | 0.8% |
| $35,000 to $49,999 | 12 | 9.4% |
| $50,000 to $74,999 | 22 | 17.3% |
| $75,000 to $99,999 | 17 | 13.4% |
| $100,000 to $149,999 | 19 | 15.0% |
| $150,000 to $199,999 | 6 | 4.7% |
| $200,000+ | 9 | 7.1% |
Household Income by Householder Age in Brookside
The median household income in Brookside is $57,188, with the highest median household income of $83,250 found in the 45 to 64 years age bracket for the primary householder. A total of 61 households (48.0%) fall into this category. Meanwhile, the 15 to 24 years age bracket for the primary householder has the lowest median household income of $0, with 4 households (3.2%) in this group.
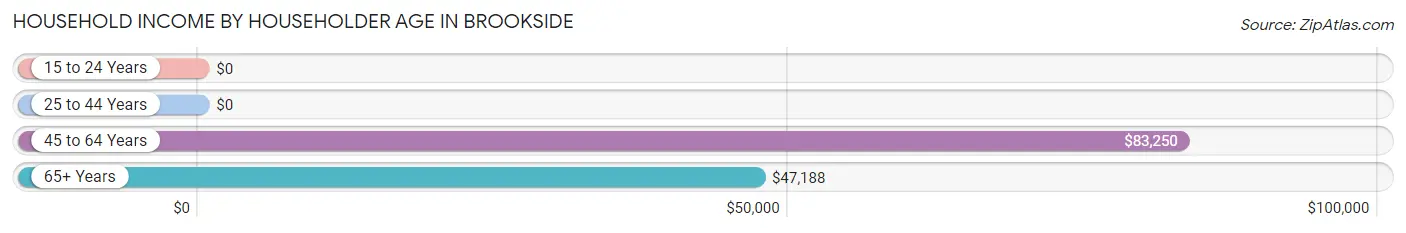
| Income Bracket | # Households | Median Income |
| 15 to 24 Years | 4 (3.2%) | $0 |
| 25 to 44 Years | 31 (24.4%) | $0 |
| 45 to 64 Years | 61 (48.0%) | $83,250 |
| 65+ Years | 31 (24.4%) | $47,188 |
| Total | 127 (100.0%) | $57,188 |
Poverty in Brookside
Income Below Poverty by Sex and Age in Brookside
With 14.5% poverty level for males and 8.7% for females among the residents of Brookside, 16 and 17 year old males and 12 to 14 year old females are the most vulnerable to poverty, with 2 males (100.0%) and 3 females (75.0%) in their respective age groups living below the poverty level.
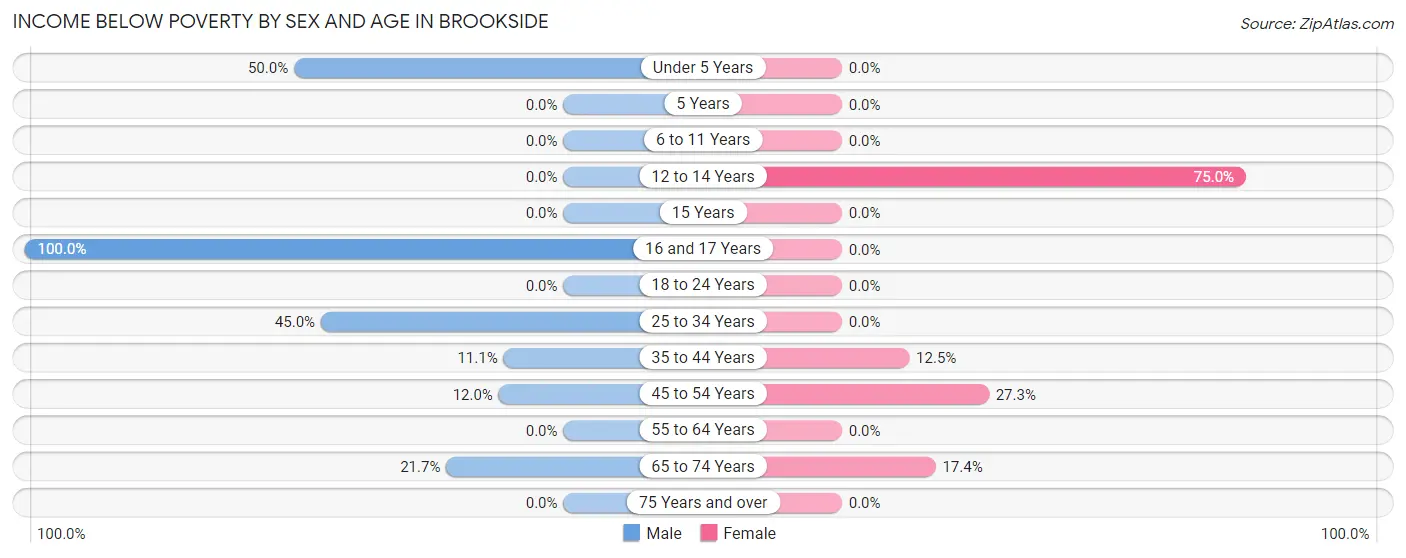
| Age Bracket | Male | Female |
| Under 5 Years | 1 (50.0%) | 0 (0.0%) |
| 5 Years | 0 (0.0%) | 0 (0.0%) |
| 6 to 11 Years | 0 (0.0%) | 0 (0.0%) |
| 12 to 14 Years | 0 (0.0%) | 3 (75.0%) |
| 15 Years | 0 (0.0%) | 0 (0.0%) |
| 16 and 17 Years | 2 (100.0%) | 0 (0.0%) |
| 18 to 24 Years | 0 (0.0%) | 0 (0.0%) |
| 25 to 34 Years | 9 (45.0%) | 0 (0.0%) |
| 35 to 44 Years | 2 (11.1%) | 2 (12.5%) |
| 45 to 54 Years | 3 (12.0%) | 3 (27.3%) |
| 55 to 64 Years | 0 (0.0%) | 0 (0.0%) |
| 65 to 74 Years | 5 (21.7%) | 4 (17.4%) |
| 75 Years and over | 0 (0.0%) | 0 (0.0%) |
| Total | 22 (14.5%) | 12 (8.7%) |
Income Above Poverty by Sex and Age in Brookside
According to the poverty statistics in Brookside, males aged 6 to 11 years and females aged 6 to 11 years are the age groups that are most secure financially, with 100.0% of males and 100.0% of females in these age groups living above the poverty line.
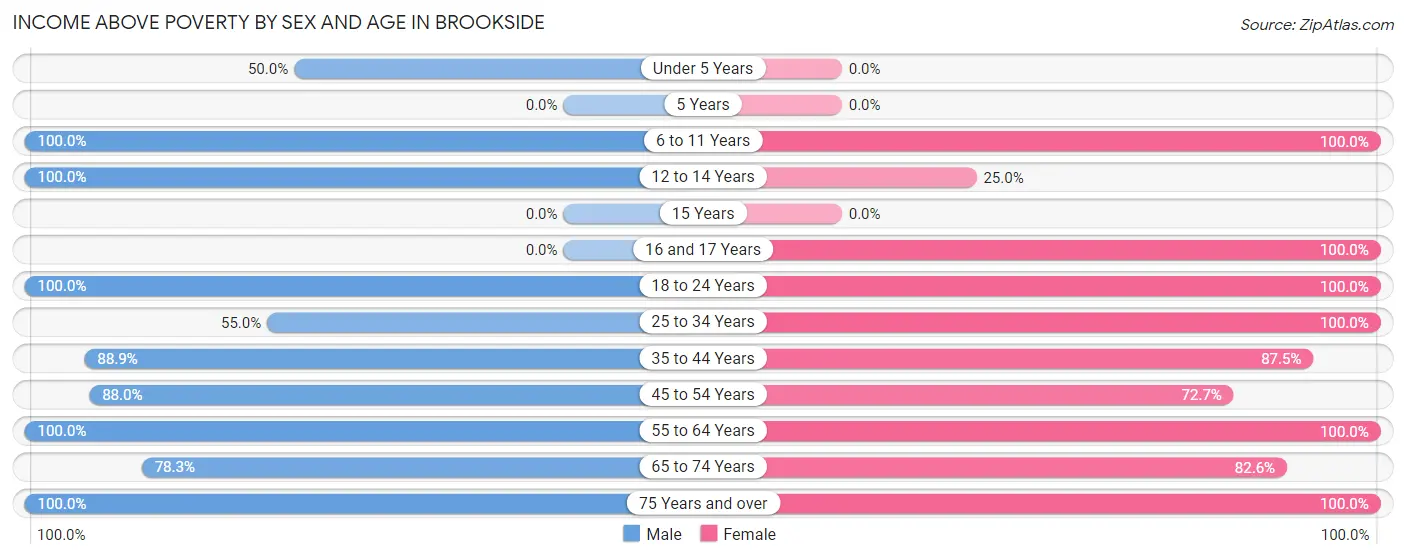
| Age Bracket | Male | Female |
| Under 5 Years | 1 (50.0%) | 0 (0.0%) |
| 5 Years | 0 (0.0%) | 0 (0.0%) |
| 6 to 11 Years | 5 (100.0%) | 11 (100.0%) |
| 12 to 14 Years | 9 (100.0%) | 1 (25.0%) |
| 15 Years | 0 (0.0%) | 0 (0.0%) |
| 16 and 17 Years | 0 (0.0%) | 1 (100.0%) |
| 18 to 24 Years | 7 (100.0%) | 12 (100.0%) |
| 25 to 34 Years | 11 (55.0%) | 10 (100.0%) |
| 35 to 44 Years | 16 (88.9%) | 14 (87.5%) |
| 45 to 54 Years | 22 (88.0%) | 8 (72.7%) |
| 55 to 64 Years | 36 (100.0%) | 39 (100.0%) |
| 65 to 74 Years | 18 (78.3%) | 19 (82.6%) |
| 75 Years and over | 5 (100.0%) | 11 (100.0%) |
| Total | 130 (85.5%) | 126 (91.3%) |
Income Below Poverty Among Married-Couple Families in Brookside
The poverty statistics for married-couple families in Brookside show that 9.8% or 8 of the total 82 families live below the poverty line. Families with 1 or 2 children have the highest poverty rate of 31.2%, comprising of 5 families. On the other hand, families with 3 or 4 children have the lowest poverty rate of 0.0%, which includes 0 families.
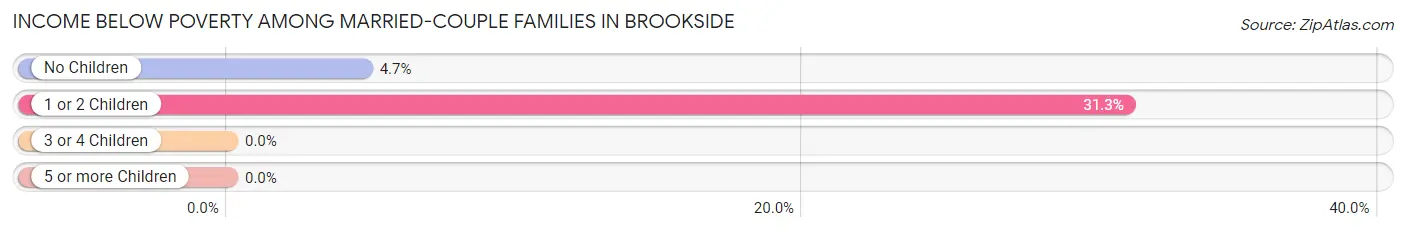
| Children | Above Poverty | Below Poverty |
| No Children | 61 (95.3%) | 3 (4.7%) |
| 1 or 2 Children | 11 (68.8%) | 5 (31.2%) |
| 3 or 4 Children | 2 (100.0%) | 0 (0.0%) |
| 5 or more Children | 0 (0.0%) | 0 (0.0%) |
| Total | 74 (90.2%) | 8 (9.8%) |
Income Below Poverty Among Single-Parent Households in Brookside
| Children | Single Father | Single Mother |
| No Children | 0 (0.0%) | 0 (0.0%) |
| 1 or 2 Children | 0 (0.0%) | 0 (0.0%) |
| 3 or 4 Children | 0 (0.0%) | 0 (0.0%) |
| 5 or more Children | 0 (0.0%) | 0 (0.0%) |
| Total | 0 (0.0%) | 0 (0.0%) |
Income Below Poverty Among Married-Couple vs Single-Parent Households in Brookside
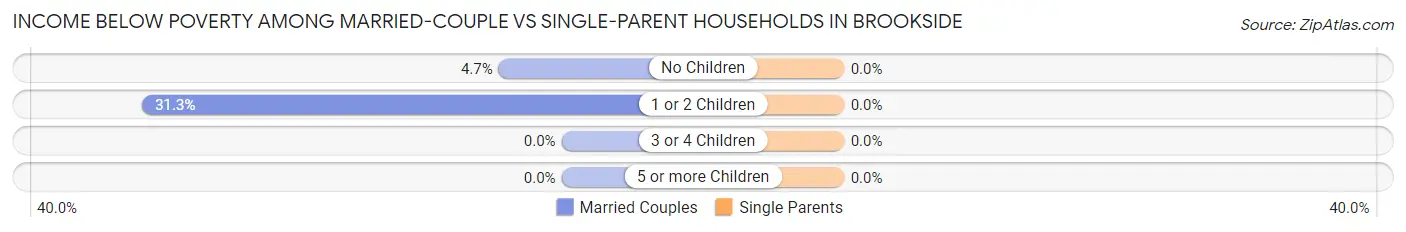
| Children | Married-Couple Families | Single-Parent Households |
| No Children | 3 (4.7%) | 0 (0.0%) |
| 1 or 2 Children | 5 (31.2%) | 0 (0.0%) |
| 3 or 4 Children | 0 (0.0%) | 0 (0.0%) |
| 5 or more Children | 0 (0.0%) | 0 (0.0%) |
| Total | 8 (9.8%) | 0 (0.0%) |
Race in Brookside
The most populous races in Brookside are White / Caucasian (255 | 87.9%), Hispanic or Latino (28 | 9.7%), and Two or more Races (25 | 8.6%).
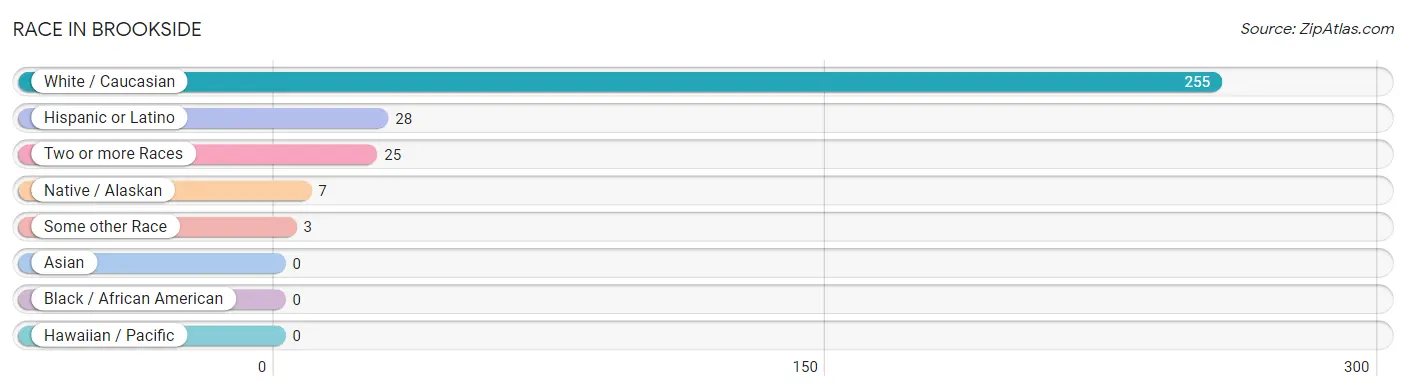
| Race | # Population | % Population |
| Asian | 0 | 0.0% |
| Black / African American | 0 | 0.0% |
| Hawaiian / Pacific | 0 | 0.0% |
| Hispanic or Latino | 28 | 9.7% |
| Native / Alaskan | 7 | 2.4% |
| White / Caucasian | 255 | 87.9% |
| Two or more Races | 25 | 8.6% |
| Some other Race | 3 | 1.0% |
| Total | 290 | 100.0% |
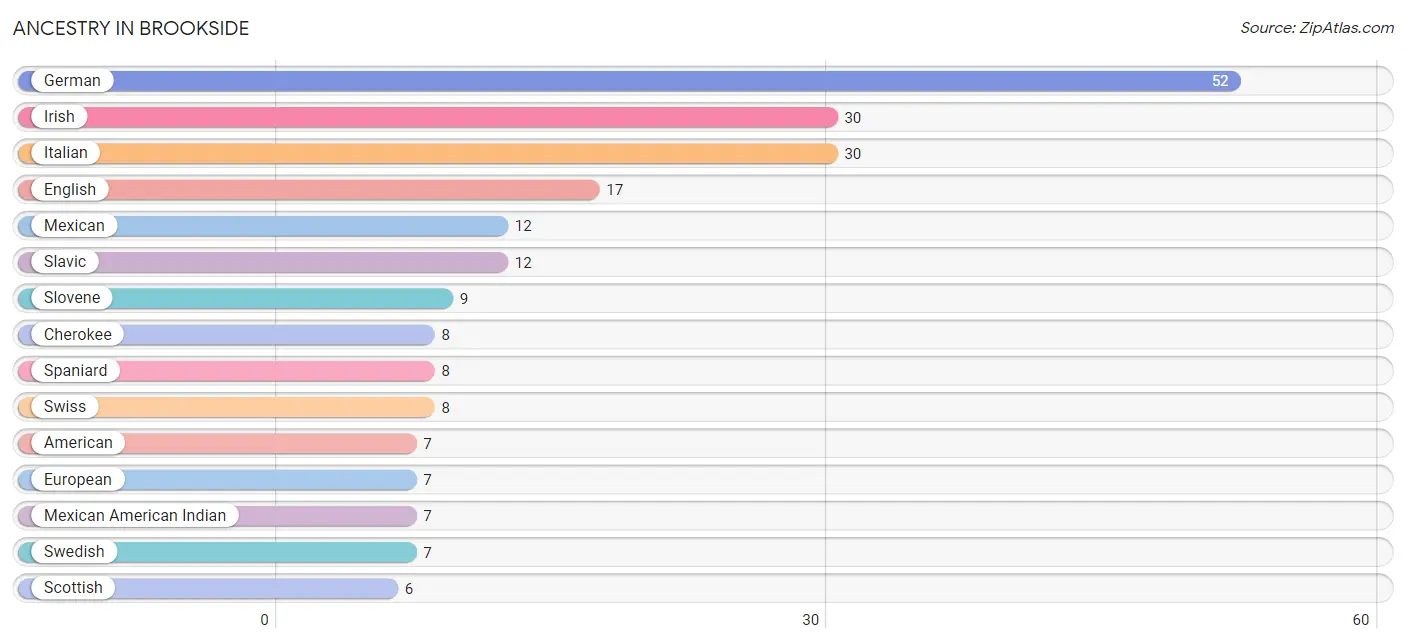
Ancestry in Brookside
The most populous ancestries reported in Brookside are German (52 | 17.9%), Irish (30 | 10.3%), Italian (30 | 10.3%), English (17 | 5.9%), and Mexican (12 | 4.1%), together accounting for 48.6% of all Brookside residents.
| Ancestry | # Population | % Population |
| American | 7 | 2.4% |
| Canadian | 1 | 0.3% |
| Cherokee | 8 | 2.8% |
| Croatian | 5 | 1.7% |
| Czech | 3 | 1.0% |
| Czechoslovakian | 1 | 0.3% |
| Danish | 3 | 1.0% |
| Dutch | 4 | 1.4% |
| English | 17 | 5.9% |
| European | 7 | 2.4% |
| French | 2 | 0.7% |
| German | 52 | 17.9% |
| Greek | 1 | 0.3% |
| Hungarian | 4 | 1.4% |
| Irish | 30 | 10.3% |
| Italian | 30 | 10.3% |
| Mexican | 12 | 4.1% |
| Mexican American Indian | 7 | 2.4% |
| Norwegian | 5 | 1.7% |
| Polish | 3 | 1.0% |
| Scottish | 6 | 2.1% |
| Slavic | 12 | 4.1% |
| Slovene | 9 | 3.1% |
| Spaniard | 8 | 2.8% |
| Swedish | 7 | 2.4% |
| Swiss | 8 | 2.8% |
| Yugoslavian | 2 | 0.7% | View All 27 Rows |
Immigrants in Brookside
The most numerous immigrant groups reported in Brookside came from Europe (2 | 0.7%), Germany (2 | 0.7%), and Western Europe (2 | 0.7%), together accounting for 2.1% of all Brookside residents.

| Immigration Origin | # Population | % Population |
| Europe | 2 | 0.7% |
| Germany | 2 | 0.7% |
| Western Europe | 2 | 0.7% | View All 3 Rows |
Sex and Age in Brookside
Sex and Age in Brookside
The most populous age groups in Brookside are 50 to 54 Years (25 | 16.5%) for men and 55 to 59 Years (22 | 15.9%) for women.
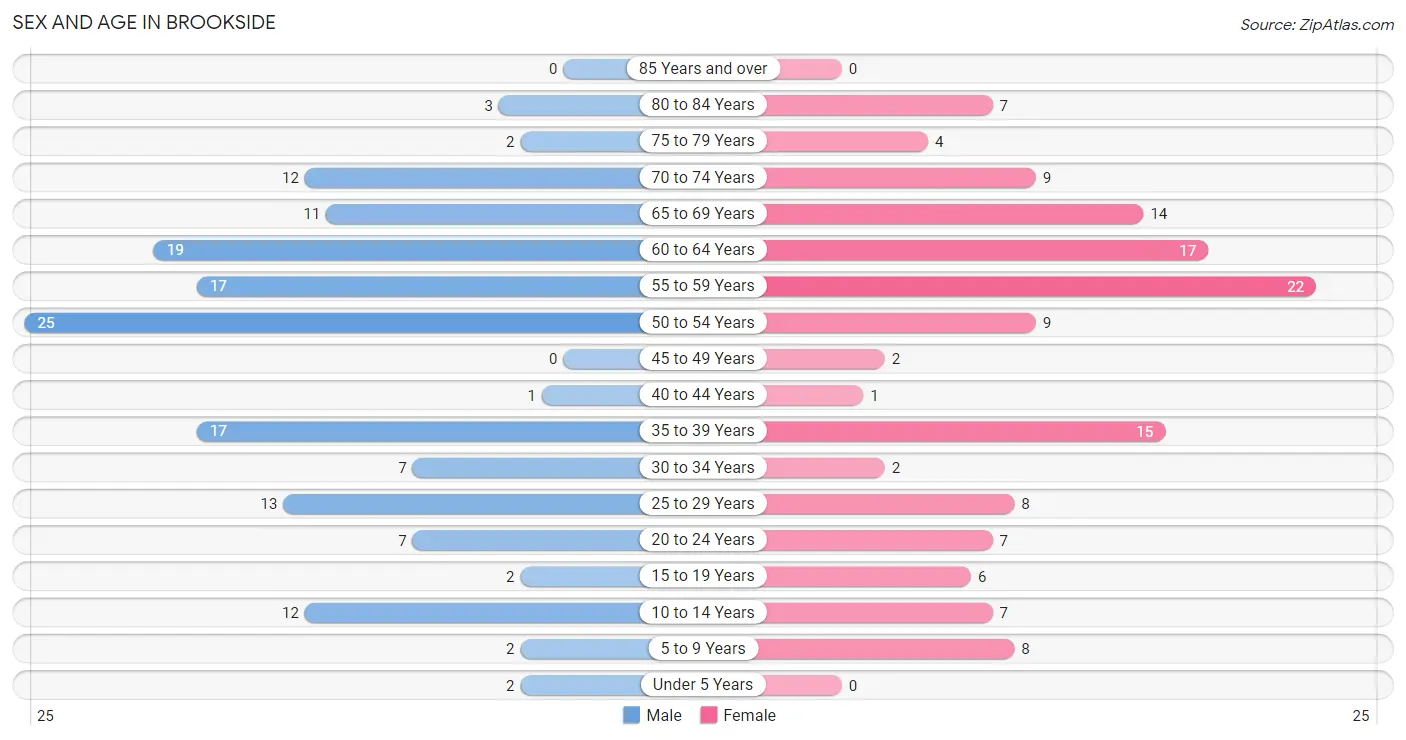
| Age Bracket | Male | Female |
| Under 5 Years | 2 (1.3%) | 0 (0.0%) |
| 5 to 9 Years | 2 (1.3%) | 8 (5.8%) |
| 10 to 14 Years | 12 (7.9%) | 7 (5.1%) |
| 15 to 19 Years | 2 (1.3%) | 6 (4.3%) |
| 20 to 24 Years | 7 (4.6%) | 7 (5.1%) |
| 25 to 29 Years | 13 (8.6%) | 8 (5.8%) |
| 30 to 34 Years | 7 (4.6%) | 2 (1.5%) |
| 35 to 39 Years | 17 (11.2%) | 15 (10.9%) |
| 40 to 44 Years | 1 (0.7%) | 1 (0.7%) |
| 45 to 49 Years | 0 (0.0%) | 2 (1.5%) |
| 50 to 54 Years | 25 (16.5%) | 9 (6.5%) |
| 55 to 59 Years | 17 (11.2%) | 22 (15.9%) |
| 60 to 64 Years | 19 (12.5%) | 17 (12.3%) |
| 65 to 69 Years | 11 (7.2%) | 14 (10.1%) |
| 70 to 74 Years | 12 (7.9%) | 9 (6.5%) |
| 75 to 79 Years | 2 (1.3%) | 4 (2.9%) |
| 80 to 84 Years | 3 (2.0%) | 7 (5.1%) |
| 85 Years and over | 0 (0.0%) | 0 (0.0%) |
| Total | 152 (100.0%) | 138 (100.0%) |
Families and Households in Brookside
Median Family Size in Brookside
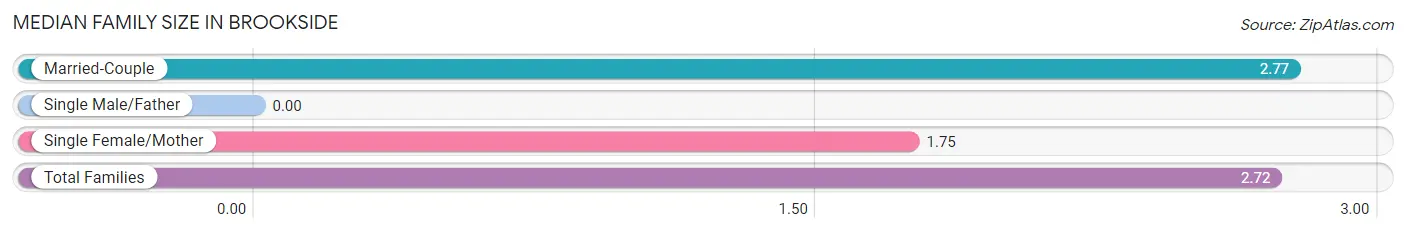
| Family Type | # Families | Family Size |
| Married-Couple | 82 (95.4%) | 2.77 |
| Single Male/Father | 0 (0.0%) | - |
| Single Female/Mother | 4 (4.6%) | 1.75 |
| Total Families | 86 (100.0%) | 2.72 |
Median Household Size in Brookside
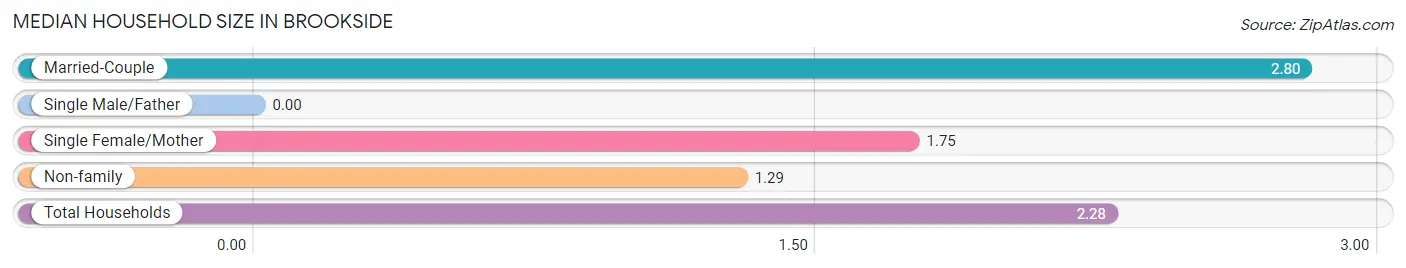
| Household Type | # Households | Household Size |
| Married-Couple | 82 (64.6%) | 2.80 |
| Single Male/Father | 0 (0.0%) | - |
| Single Female/Mother | 4 (3.2%) | 1.75 |
| Non-family | 41 (32.3%) | 1.29 |
| Total Households | 127 (100.0%) | 2.28 |
Household Size by Marriage Status in Brookside
Out of a total of 127 households in Brookside, 86 (67.7%) are family households, while 41 (32.3%) are nonfamily households. The most numerous type of family households are 2-person households, comprising 55, and the most common type of nonfamily households are 1-person households, comprising 28.
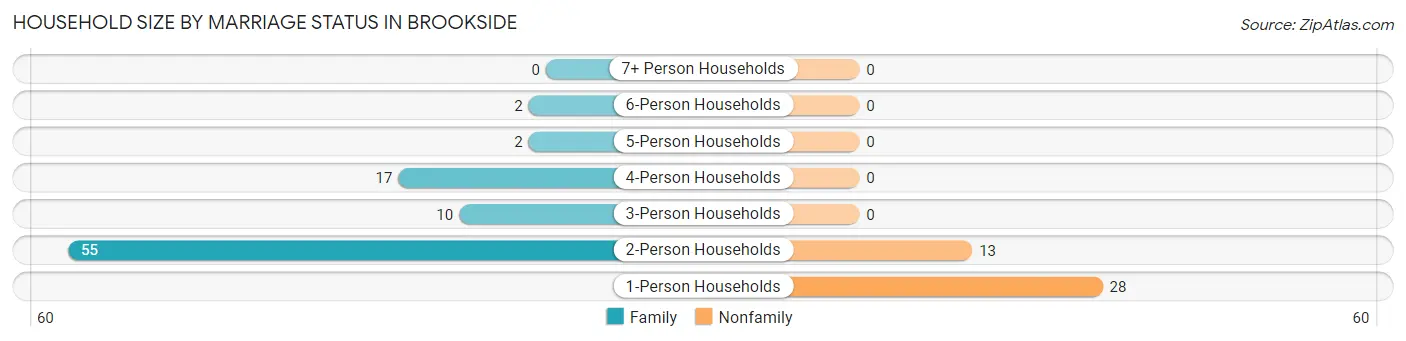
| Household Size | Family Households | Nonfamily Households |
| 1-Person Households | - | 28 (22.1%) |
| 2-Person Households | 55 (43.3%) | 13 (10.2%) |
| 3-Person Households | 10 (7.9%) | 0 (0.0%) |
| 4-Person Households | 17 (13.4%) | 0 (0.0%) |
| 5-Person Households | 2 (1.6%) | 0 (0.0%) |
| 6-Person Households | 2 (1.6%) | 0 (0.0%) |
| 7+ Person Households | 0 (0.0%) | 0 (0.0%) |
| Total | 86 (67.7%) | 41 (32.3%) |
Female Fertility in Brookside
Fertility by Age in Brookside
Average fertility rate in Brookside is 48.0 births per 1,000 women. Women in the age bracket of 35 to 50 years have the highest fertility rate with 105.0 births per 1,000 women. Women in the age bracket of 35 to 50 years acount for 100.0% of all women with births.
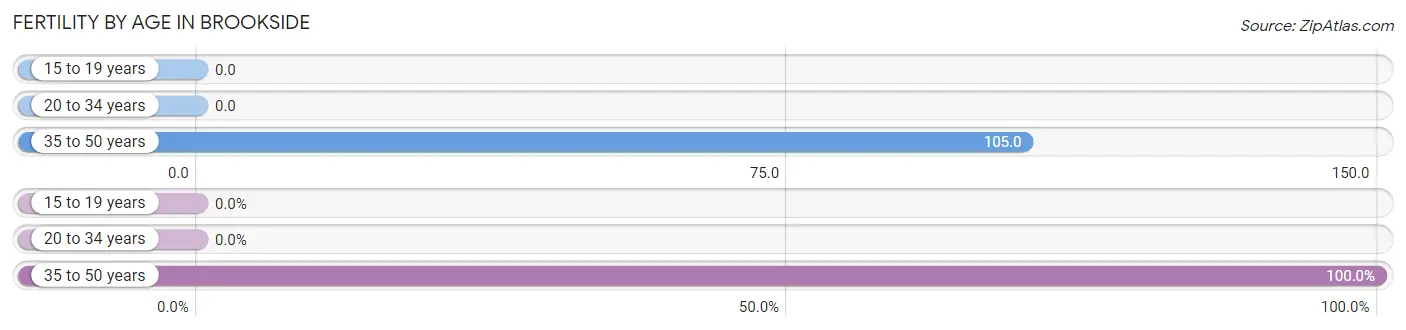
| Age Bracket | Women with Births | Births / 1,000 Women |
| 15 to 19 years | 0 (0.0%) | 0.0 |
| 20 to 34 years | 0 (0.0%) | 0.0 |
| 35 to 50 years | 2 (100.0%) | 105.0 |
| Total | 2 (100.0%) | 48.0 |
Fertility by Age by Marriage Status in Brookside
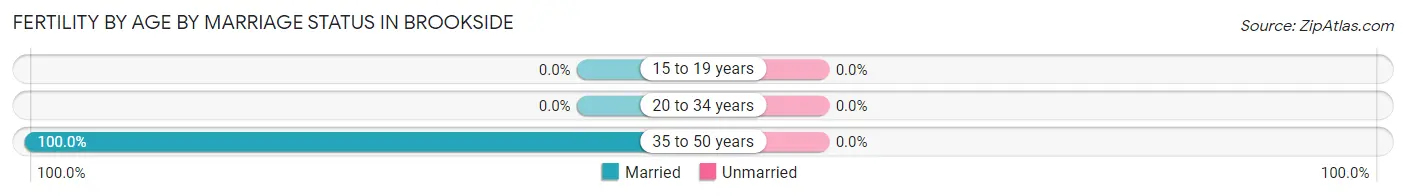
| Age Bracket | Married | Unmarried |
| 15 to 19 years | 0 (0.0%) | 0 (0.0%) |
| 20 to 34 years | 0 (0.0%) | 0 (0.0%) |
| 35 to 50 years | 2 (100.0%) | 0 (0.0%) |
| Total | 2 (100.0%) | 0 (0.0%) |
Fertility by Education in Brookside
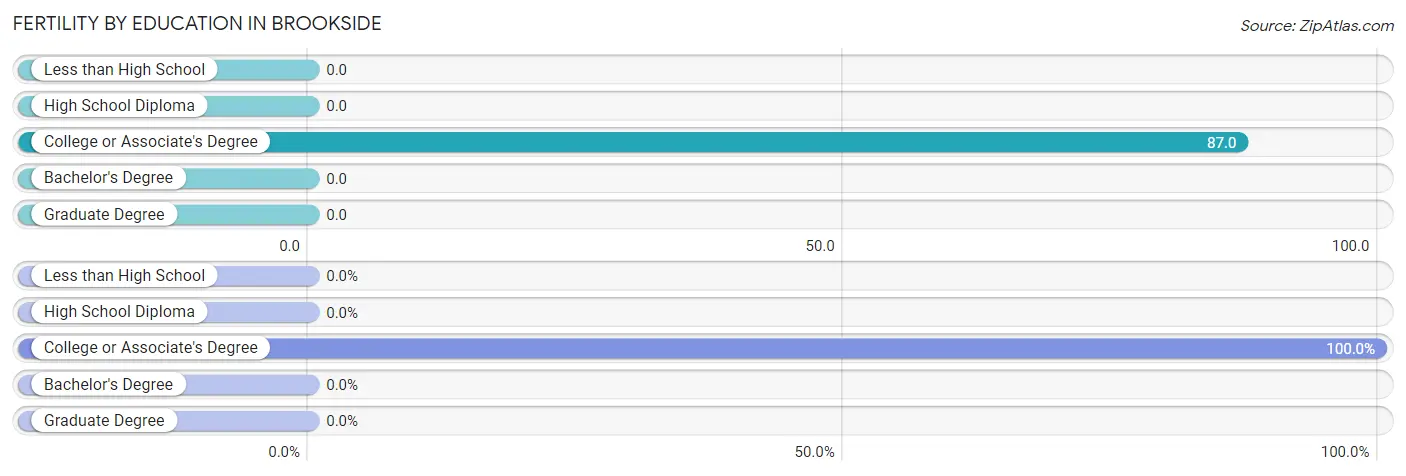
| Educational Attainment | Women with Births | Births / 1,000 Women |
| Less than High School | 0 (0.0%) | 0.0 |
| High School Diploma | 0 (0.0%) | 0.0 |
| College or Associate's Degree | 2 (100.0%) | 87.0 |
| Bachelor's Degree | 0 (0.0%) | 0.0 |
| Graduate Degree | 0 (0.0%) | 0.0 |
| Total | 2 (100.0%) | 48.0 |
Fertility by Education by Marriage Status in Brookside
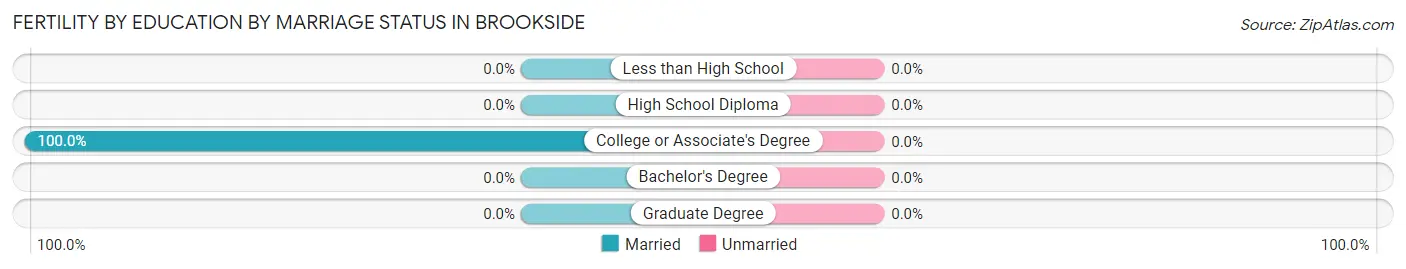
| Educational Attainment | Married | Unmarried |
| Less than High School | 0 (0.0%) | 0 (0.0%) |
| High School Diploma | 0 (0.0%) | 0 (0.0%) |
| College or Associate's Degree | 2 (100.0%) | 0 (0.0%) |
| Bachelor's Degree | 0 (0.0%) | 0 (0.0%) |
| Graduate Degree | 0 (0.0%) | 0 (0.0%) |
| Total | 2 (100.0%) | 0 (0.0%) |
Employment Characteristics in Brookside
Employment by Class of Employer in Brookside
Among the 109 employed individuals in Brookside, private company employees (52 | 47.7%), not-for-profit organizations (26 | 23.8%), and self-employed (not incorporated) (20 | 18.3%) make up the most common classes of employment.
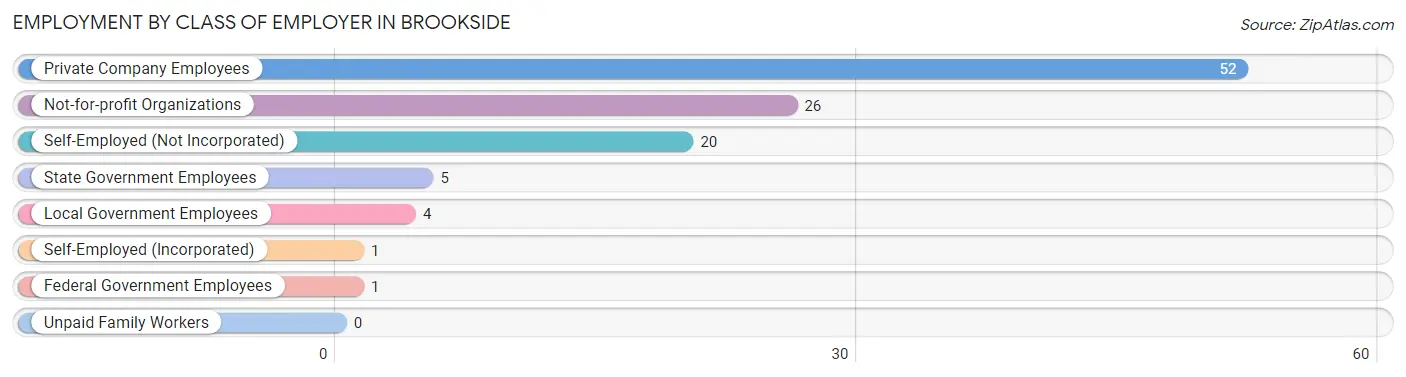
| Employer Class | # Employees | % Employees |
| Private Company Employees | 52 | 47.7% |
| Self-Employed (Incorporated) | 1 | 0.9% |
| Self-Employed (Not Incorporated) | 20 | 18.3% |
| Not-for-profit Organizations | 26 | 23.8% |
| Local Government Employees | 4 | 3.7% |
| State Government Employees | 5 | 4.6% |
| Federal Government Employees | 1 | 0.9% |
| Unpaid Family Workers | 0 | 0.0% |
| Total | 109 | 100.0% |
Employment Status by Age in Brookside
According to the labor force statistics for Brookside, out of the total population over 16 years of age (259), 52.9% or 137 individuals are in the labor force, with 20.4% or 28 of them unemployed. The age group with the highest labor force participation rate is 20 to 24 years, with 100.0% or 14 individuals in the labor force. Within the labor force, the 30 to 34 years age range has the highest percentage of unemployed individuals, with 77.8% or 7 of them being unemployed.
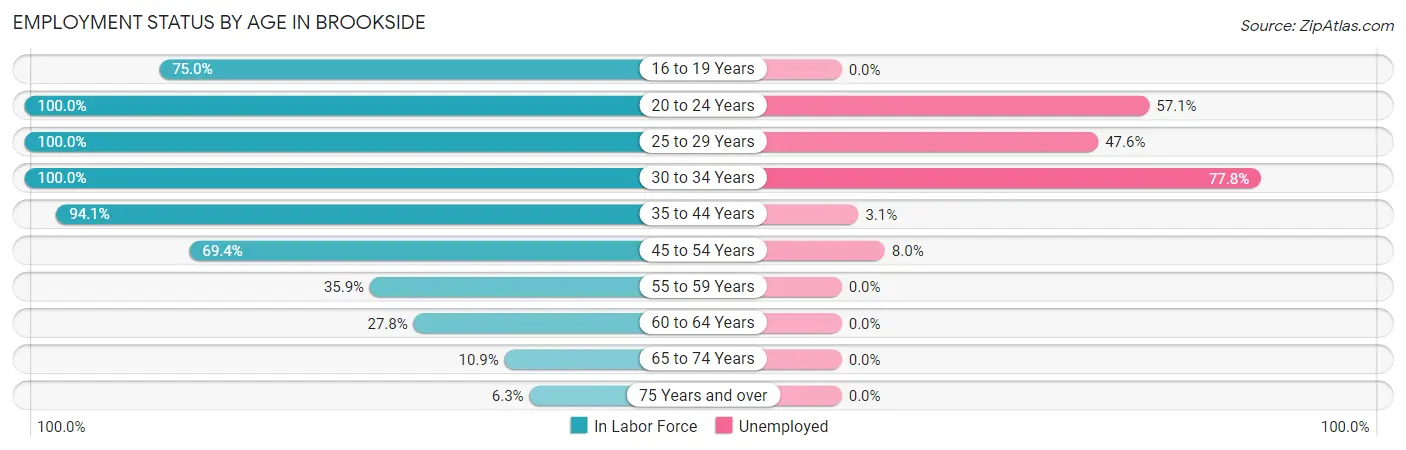
| Age Bracket | In Labor Force | Unemployed |
| 16 to 19 Years | 6 (75.0%) | 0 (0.0%) |
| 20 to 24 Years | 14 (100.0%) | 8 (57.1%) |
| 25 to 29 Years | 21 (100.0%) | 10 (47.6%) |
| 30 to 34 Years | 9 (100.0%) | 7 (77.8%) |
| 35 to 44 Years | 32 (94.1%) | 1 (3.1%) |
| 45 to 54 Years | 25 (69.4%) | 2 (8.0%) |
| 55 to 59 Years | 14 (35.9%) | 0 (0.0%) |
| 60 to 64 Years | 10 (27.8%) | 0 (0.0%) |
| 65 to 74 Years | 5 (10.9%) | 0 (0.0%) |
| 75 Years and over | 1 (6.3%) | 0 (0.0%) |
| Total | 137 (52.9%) | 28 (20.4%) |
Employment Status by Educational Attainment in Brookside
According to labor force statistics for Brookside, 63.4% of individuals (111) out of the total population between 25 and 64 years of age (175) are in the labor force, with 18.0% or 20 of them being unemployed. The group with the highest labor force participation rate are those with the educational attainment of less than high school, with 84.6% or 11 individuals in the labor force. Within the labor force, individuals with less than high school education have the highest percentage of unemployment, with 36.4% or 4 of them being unemployed.
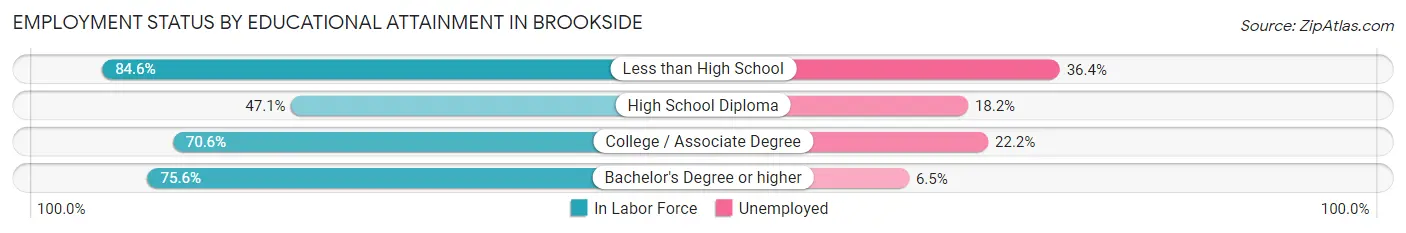
| Educational Attainment | In Labor Force | Unemployed |
| Less than High School | 11 (84.6%) | 5 (36.4%) |
| High School Diploma | 33 (47.1%) | 13 (18.2%) |
| College / Associate Degree | 36 (70.6%) | 11 (22.2%) |
| Bachelor's Degree or higher | 31 (75.6%) | 3 (6.5%) |
| Total | 111 (63.4%) | 32 (18.0%) |
Employment Occupations by Sex in Brookside
Management, Business, Science and Arts Occupations
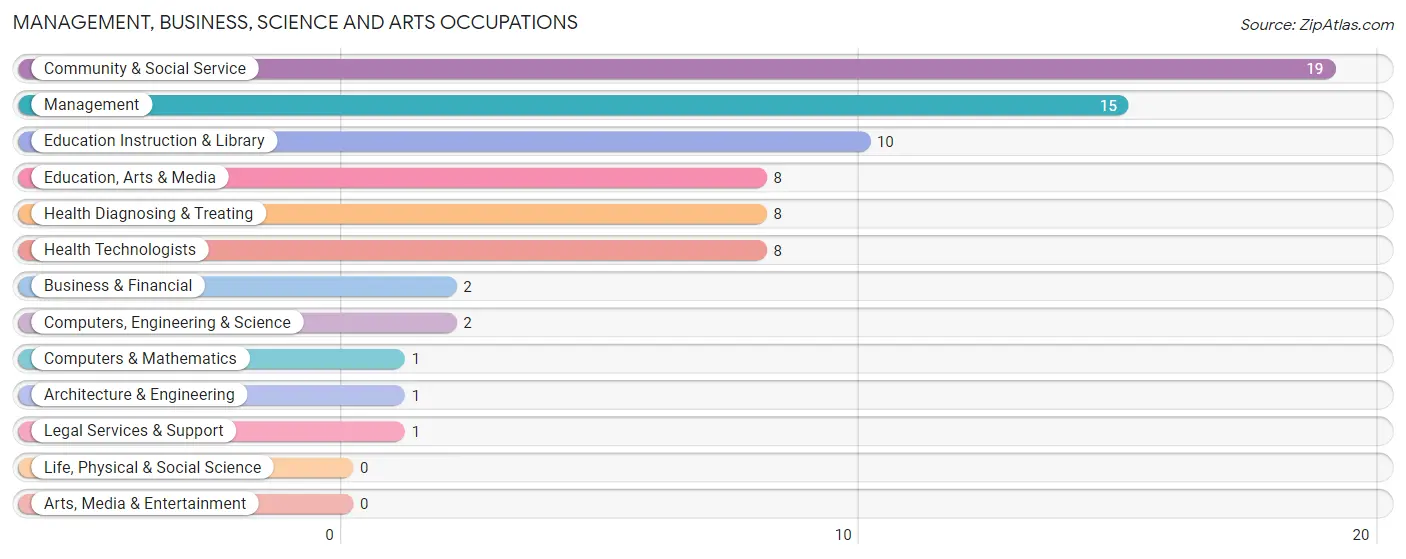
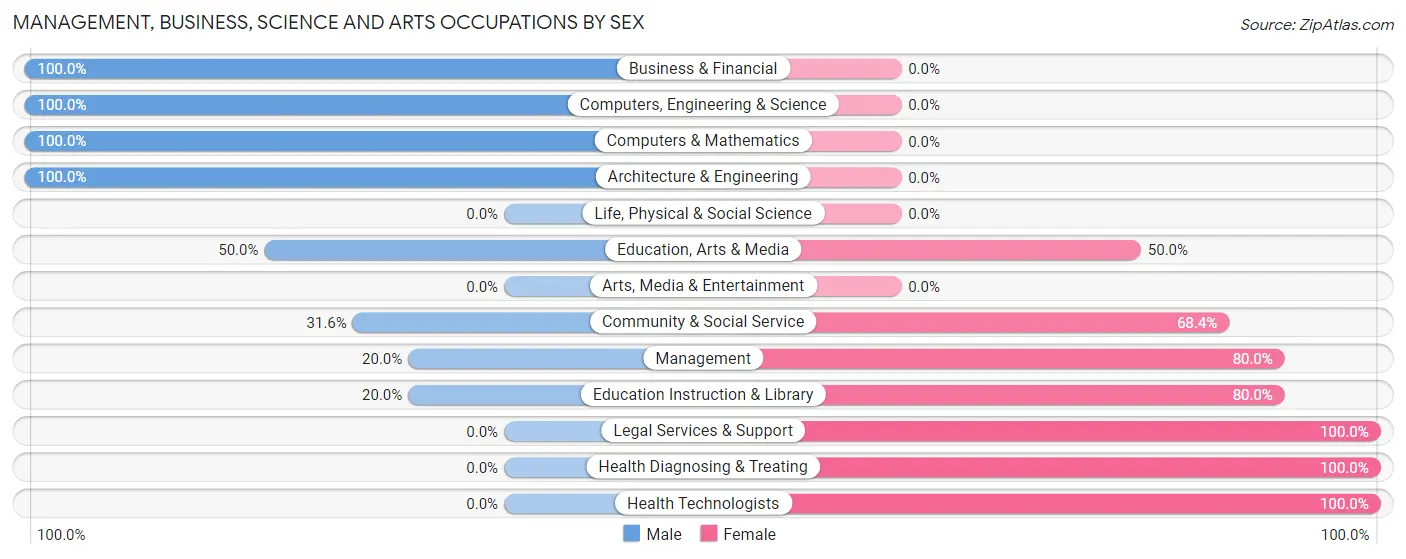
The most common Management, Business, Science and Arts occupations in Brookside are Community & Social Service (19 | 17.4%), Management (15 | 13.8%), Education Instruction & Library (10 | 9.2%), Education, Arts & Media (8 | 7.3%), and Health Diagnosing & Treating (8 | 7.3%).
Management, Business, Science and Arts Occupations by Sex
Within the Management, Business, Science and Arts occupations in Brookside, the most male-oriented occupations are Business & Financial (100.0%), Computers, Engineering & Science (100.0%), and Computers & Mathematics (100.0%), while the most female-oriented occupations are Legal Services & Support (100.0%), Health Diagnosing & Treating (100.0%), and Health Technologists (100.0%).
| Occupation | Male | Female |
| Management | 3 (20.0%) | 12 (80.0%) |
| Business & Financial | 2 (100.0%) | 0 (0.0%) |
| Computers, Engineering & Science | 2 (100.0%) | 0 (0.0%) |
| Computers & Mathematics | 1 (100.0%) | 0 (0.0%) |
| Architecture & Engineering | 1 (100.0%) | 0 (0.0%) |
| Life, Physical & Social Science | 0 (0.0%) | 0 (0.0%) |
| Community & Social Service | 6 (31.6%) | 13 (68.4%) |
| Education, Arts & Media | 4 (50.0%) | 4 (50.0%) |
| Legal Services & Support | 0 (0.0%) | 1 (100.0%) |
| Education Instruction & Library | 2 (20.0%) | 8 (80.0%) |
| Arts, Media & Entertainment | 0 (0.0%) | 0 (0.0%) |
| Health Diagnosing & Treating | 0 (0.0%) | 8 (100.0%) |
| Health Technologists | 0 (0.0%) | 8 (100.0%) |
| Total (Category) | 13 (28.3%) | 33 (71.7%) |
| Total (Overall) | 59 (54.1%) | 50 (45.9%) |
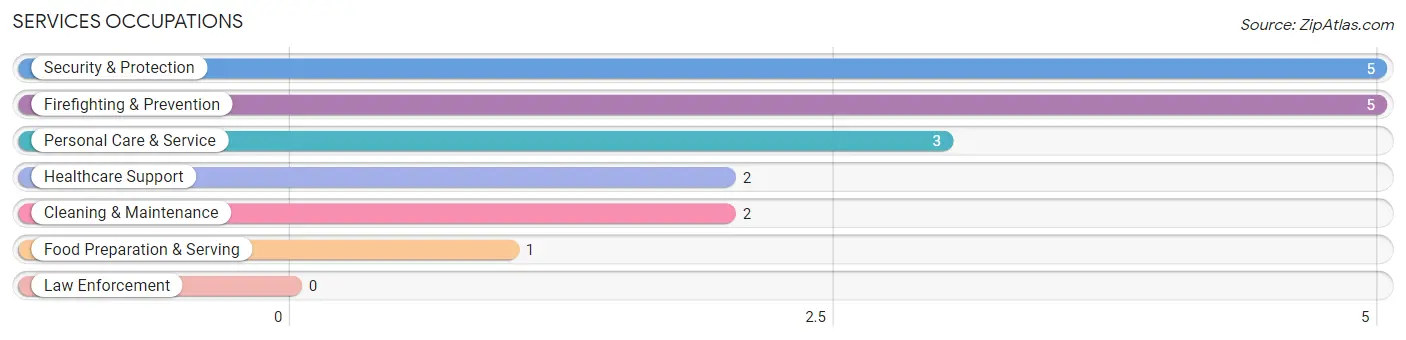
Services Occupations
The most common Services occupations in Brookside are Security & Protection (5 | 4.6%), Firefighting & Prevention (5 | 4.6%), Personal Care & Service (3 | 2.8%), Healthcare Support (2 | 1.8%), and Cleaning & Maintenance (2 | 1.8%).
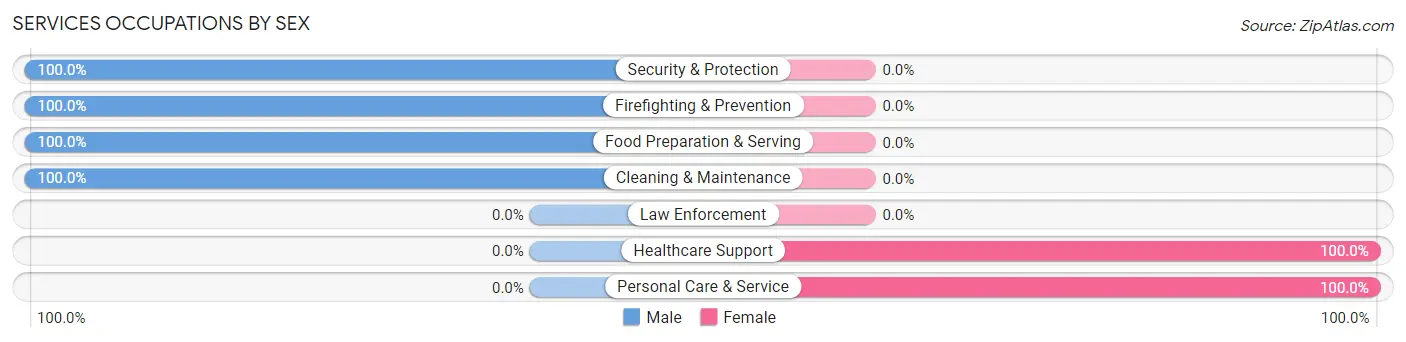
Services Occupations by Sex
Within the Services occupations in Brookside, the most male-oriented occupations are Security & Protection (100.0%), Firefighting & Prevention (100.0%), and Food Preparation & Serving (100.0%), while the most female-oriented occupations are Healthcare Support (100.0%), and Personal Care & Service (100.0%).
| Occupation | Male | Female |
| Healthcare Support | 0 (0.0%) | 2 (100.0%) |
| Security & Protection | 5 (100.0%) | 0 (0.0%) |
| Firefighting & Prevention | 5 (100.0%) | 0 (0.0%) |
| Law Enforcement | 0 (0.0%) | 0 (0.0%) |
| Food Preparation & Serving | 1 (100.0%) | 0 (0.0%) |
| Cleaning & Maintenance | 2 (100.0%) | 0 (0.0%) |
| Personal Care & Service | 0 (0.0%) | 3 (100.0%) |
| Total (Category) | 8 (61.5%) | 5 (38.5%) |
| Total (Overall) | 59 (54.1%) | 50 (45.9%) |
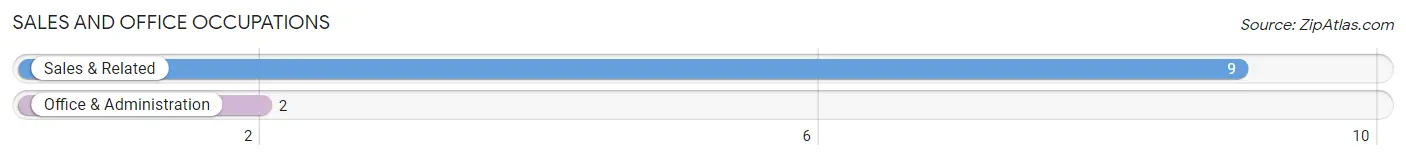
Sales and Office Occupations
The most common Sales and Office occupations in Brookside are Sales & Related (9 | 8.3%), and Office & Administration (2 | 1.8%).
Sales and Office Occupations by Sex
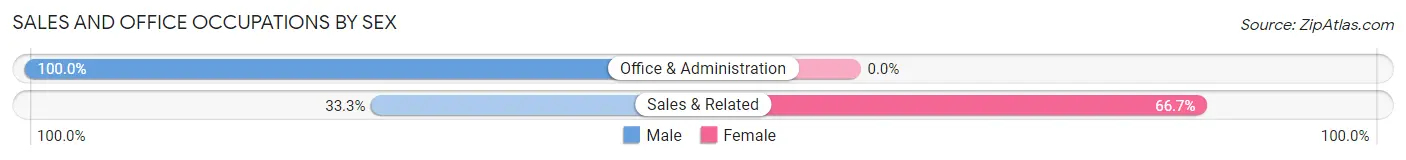
| Occupation | Male | Female |
| Sales & Related | 3 (33.3%) | 6 (66.7%) |
| Office & Administration | 2 (100.0%) | 0 (0.0%) |
| Total (Category) | 5 (45.5%) | 6 (54.5%) |
| Total (Overall) | 59 (54.1%) | 50 (45.9%) |
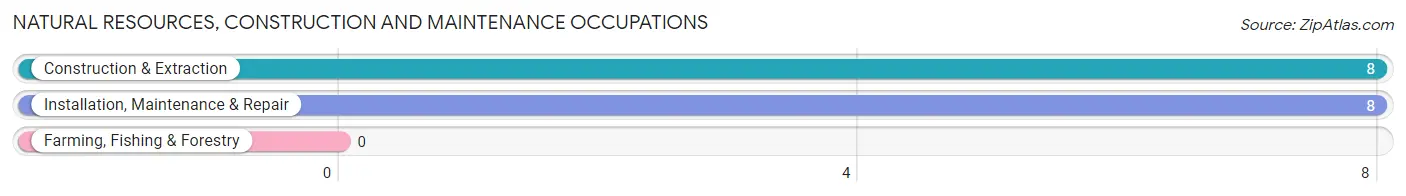
Natural Resources, Construction and Maintenance Occupations
The most common Natural Resources, Construction and Maintenance occupations in Brookside are Construction & Extraction (8 | 7.3%), and Installation, Maintenance & Repair (8 | 7.3%).
Natural Resources, Construction and Maintenance Occupations by Sex
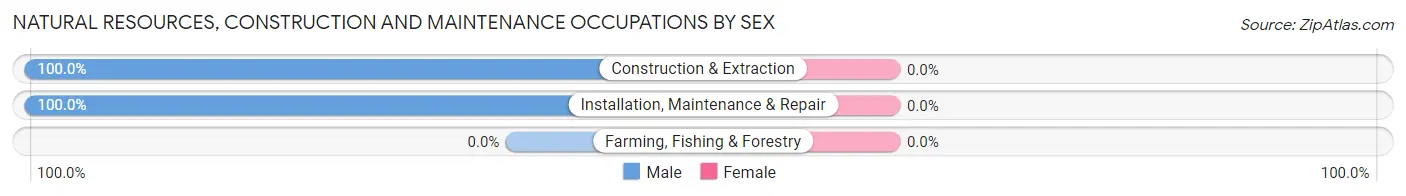
| Occupation | Male | Female |
| Farming, Fishing & Forestry | 0 (0.0%) | 0 (0.0%) |
| Construction & Extraction | 8 (100.0%) | 0 (0.0%) |
| Installation, Maintenance & Repair | 8 (100.0%) | 0 (0.0%) |
| Total (Category) | 16 (100.0%) | 0 (0.0%) |
| Total (Overall) | 59 (54.1%) | 50 (45.9%) |
Production, Transportation and Moving Occupations
The most common Production, Transportation and Moving occupations in Brookside are Transportation (21 | 19.3%), and Production (2 | 1.8%).
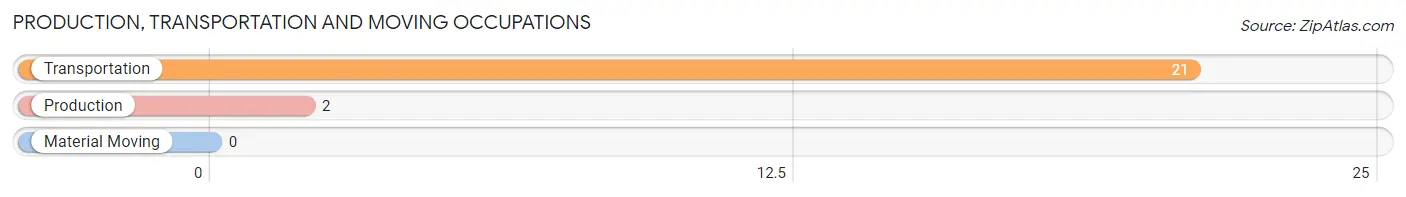
Production, Transportation and Moving Occupations by Sex
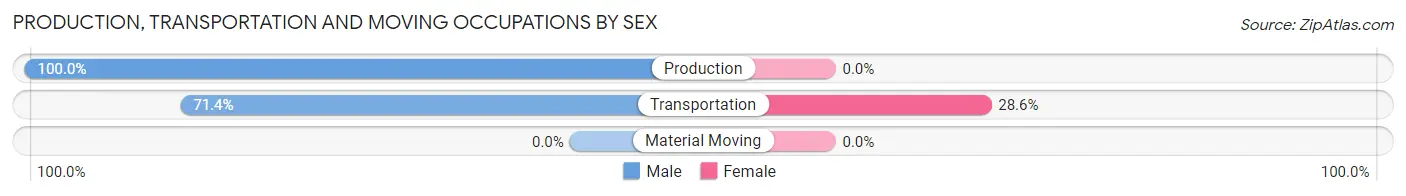
| Occupation | Male | Female |
| Production | 2 (100.0%) | 0 (0.0%) |
| Transportation | 15 (71.4%) | 6 (28.6%) |
| Material Moving | 0 (0.0%) | 0 (0.0%) |
| Total (Category) | 17 (73.9%) | 6 (26.1%) |
| Total (Overall) | 59 (54.1%) | 50 (45.9%) |
Employment Industries by Sex in Brookside
Employment Industries in Brookside
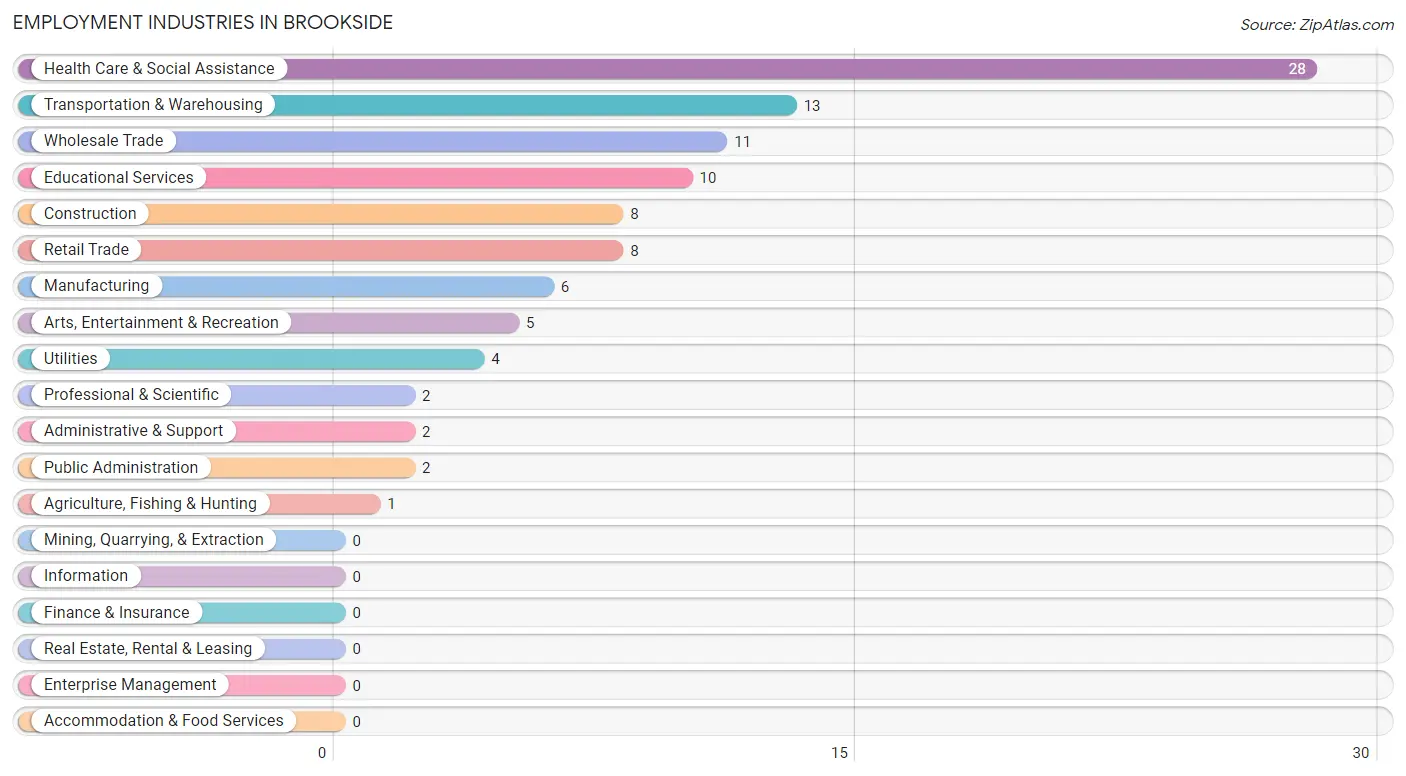
The major employment industries in Brookside include Health Care & Social Assistance (28 | 25.7%), Transportation & Warehousing (13 | 11.9%), Wholesale Trade (11 | 10.1%), Educational Services (10 | 9.2%), and Construction (8 | 7.3%).
Employment Industries by Sex in Brookside
The Brookside industries that see more men than women are Construction (100.0%), Manufacturing (100.0%), and Wholesale Trade (100.0%), whereas the industries that tend to have a higher number of women are Agriculture, Fishing & Hunting (100.0%), Arts, Entertainment & Recreation (100.0%), and Public Administration (100.0%).
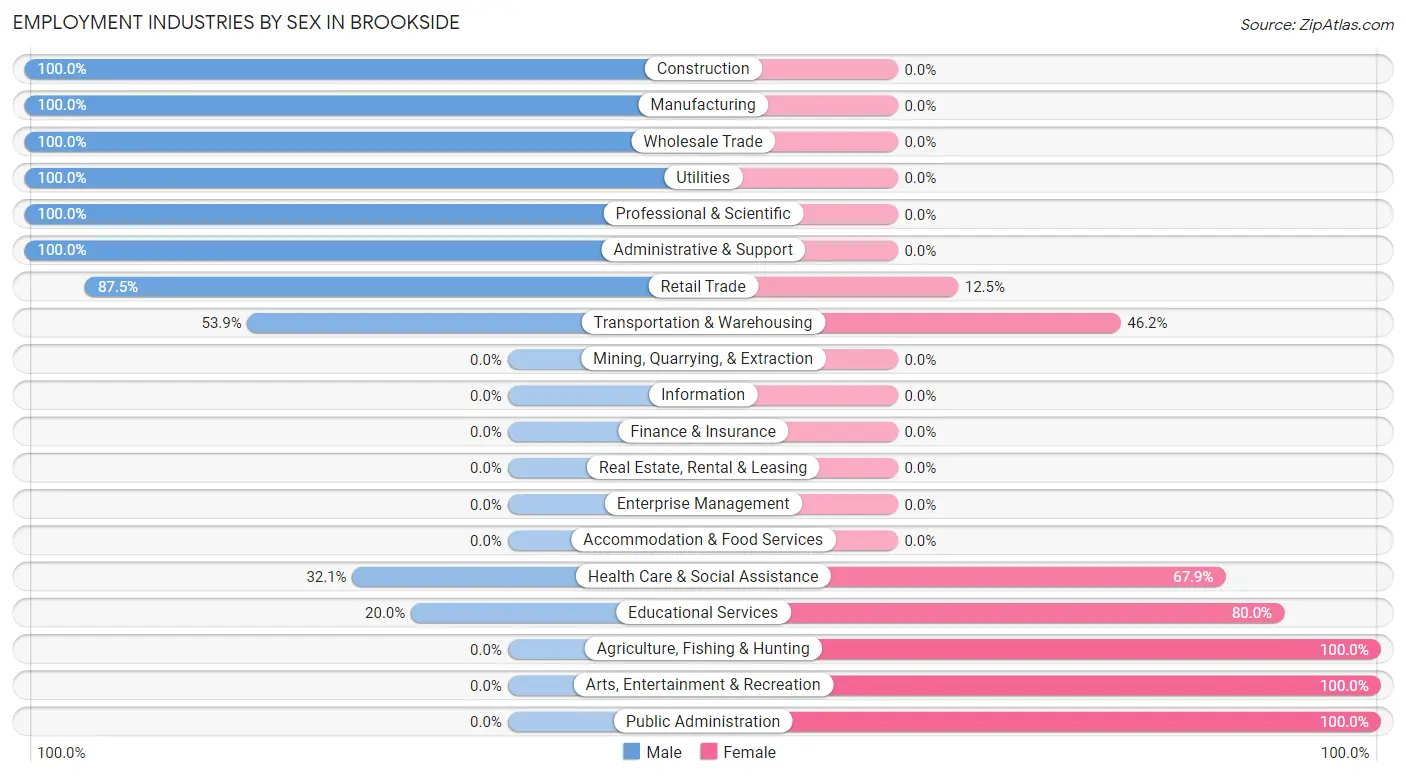
| Industry | Male | Female |
| Agriculture, Fishing & Hunting | 0 (0.0%) | 1 (100.0%) |
| Mining, Quarrying, & Extraction | 0 (0.0%) | 0 (0.0%) |
| Construction | 8 (100.0%) | 0 (0.0%) |
| Manufacturing | 6 (100.0%) | 0 (0.0%) |
| Wholesale Trade | 11 (100.0%) | 0 (0.0%) |
| Retail Trade | 7 (87.5%) | 1 (12.5%) |
| Transportation & Warehousing | 7 (53.8%) | 6 (46.2%) |
| Utilities | 4 (100.0%) | 0 (0.0%) |
| Information | 0 (0.0%) | 0 (0.0%) |
| Finance & Insurance | 0 (0.0%) | 0 (0.0%) |
| Real Estate, Rental & Leasing | 0 (0.0%) | 0 (0.0%) |
| Professional & Scientific | 2 (100.0%) | 0 (0.0%) |
| Enterprise Management | 0 (0.0%) | 0 (0.0%) |
| Administrative & Support | 2 (100.0%) | 0 (0.0%) |
| Educational Services | 2 (20.0%) | 8 (80.0%) |
| Health Care & Social Assistance | 9 (32.1%) | 19 (67.9%) |
| Arts, Entertainment & Recreation | 0 (0.0%) | 5 (100.0%) |
| Accommodation & Food Services | 0 (0.0%) | 0 (0.0%) |
| Public Administration | 0 (0.0%) | 2 (100.0%) |
| Total | 59 (54.1%) | 50 (45.9%) |
Education in Brookside
School Enrollment in Brookside
The most common levels of schooling among the 41 students in Brookside are middle school (18 | 43.9%), elementary school (11 | 26.8%), and college / undergraduate (9 | 22.0%).
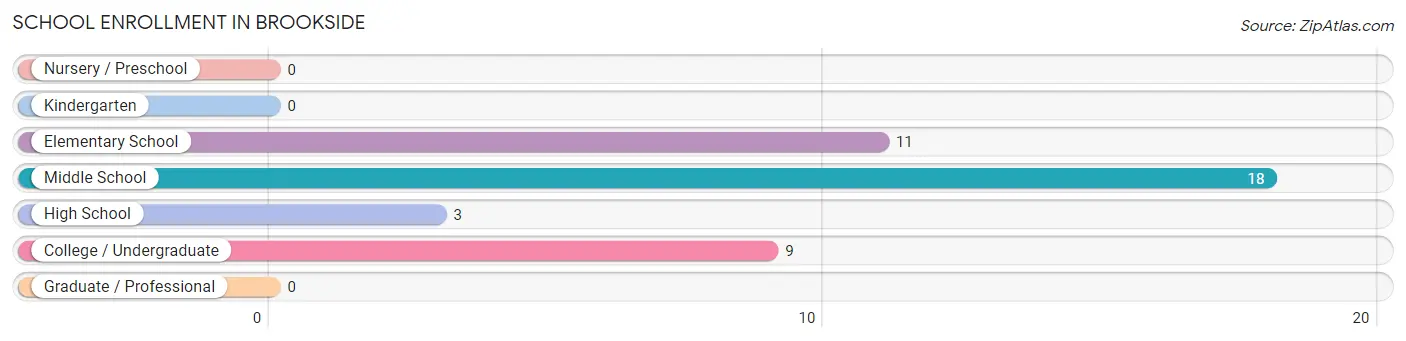
| School Level | # Students | % Students |
| Nursery / Preschool | 0 | 0.0% |
| Kindergarten | 0 | 0.0% |
| Elementary School | 11 | 26.8% |
| Middle School | 18 | 43.9% |
| High School | 3 | 7.3% |
| College / Undergraduate | 9 | 22.0% |
| Graduate / Professional | 0 | 0.0% |
| Total | 41 | 100.0% |
School Enrollment by Age by Funding Source in Brookside
Out of a total of 41 students who are enrolled in schools in Brookside, 15 (36.6%) attend a private institution, while the remaining 26 (63.4%) are enrolled in public schools. The age group of 18 to 19 year olds has the highest likelihood of being enrolled in private schools, with 5 (100.0% in the age bracket) enrolled. Conversely, the age group of 15 to 17 year olds has the lowest likelihood of being enrolled in a private school, with 3 (100.0% in the age bracket) attending a public institution.
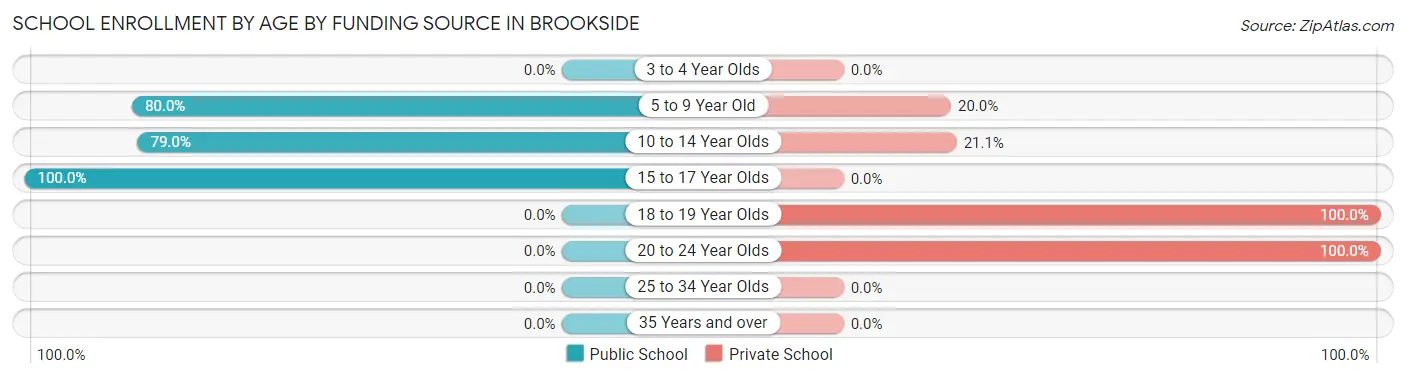
| Age Bracket | Public School | Private School |
| 3 to 4 Year Olds | 0 (0.0%) | 0 (0.0%) |
| 5 to 9 Year Old | 8 (80.0%) | 2 (20.0%) |
| 10 to 14 Year Olds | 15 (78.9%) | 4 (21.0%) |
| 15 to 17 Year Olds | 3 (100.0%) | 0 (0.0%) |
| 18 to 19 Year Olds | 0 (0.0%) | 5 (100.0%) |
| 20 to 24 Year Olds | 0 (0.0%) | 4 (100.0%) |
| 25 to 34 Year Olds | 0 (0.0%) | 0 (0.0%) |
| 35 Years and over | 0 (0.0%) | 0 (0.0%) |
| Total | 26 (63.4%) | 15 (36.6%) |
Educational Attainment by Field of Study in Brookside
Education (15 | 25.4%), psychology (11 | 18.6%), science & technology (9 | 15.2%), bio, nature & agricultural (7 | 11.9%), and physical & health sciences (7 | 11.9%) are the most common fields of study among 59 individuals in Brookside who have obtained a bachelor's degree or higher.
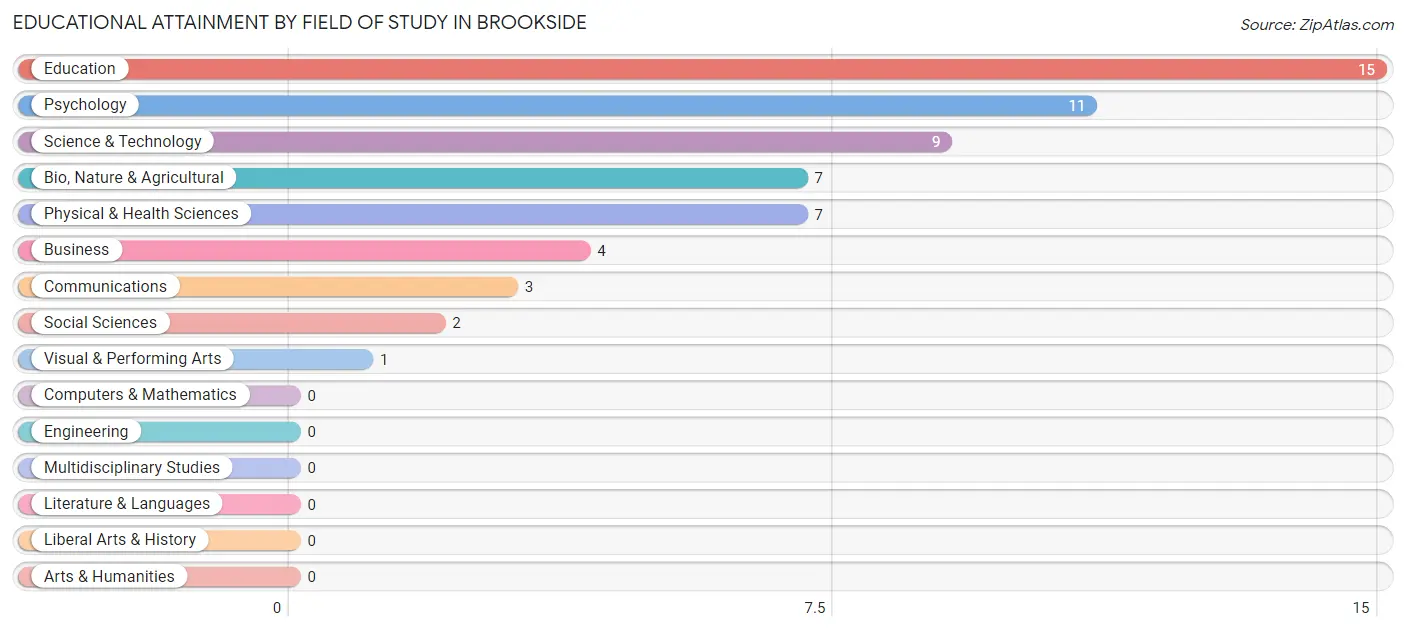
| Field of Study | # Graduates | % Graduates |
| Computers & Mathematics | 0 | 0.0% |
| Bio, Nature & Agricultural | 7 | 11.9% |
| Physical & Health Sciences | 7 | 11.9% |
| Psychology | 11 | 18.6% |
| Social Sciences | 2 | 3.4% |
| Engineering | 0 | 0.0% |
| Multidisciplinary Studies | 0 | 0.0% |
| Science & Technology | 9 | 15.2% |
| Business | 4 | 6.8% |
| Education | 15 | 25.4% |
| Literature & Languages | 0 | 0.0% |
| Liberal Arts & History | 0 | 0.0% |
| Visual & Performing Arts | 1 | 1.7% |
| Communications | 3 | 5.1% |
| Arts & Humanities | 0 | 0.0% |
| Total | 59 | 100.0% |
Transportation & Commute in Brookside
Vehicle Availability by Sex in Brookside
The most prevalent vehicle ownership categories in Brookside are males with 2 vehicles (23, accounting for 39.0%) and females with 2 vehicles (30, making up 46.0%).
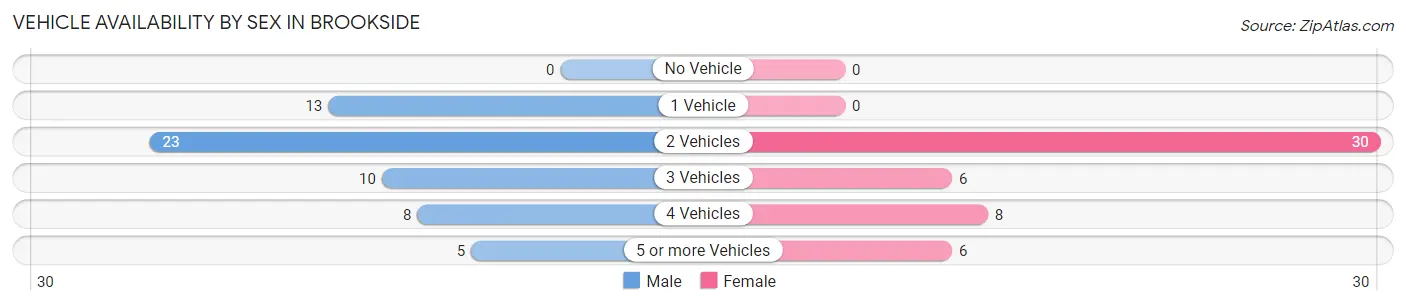
| Vehicles Available | Male | Female |
| No Vehicle | 0 (0.0%) | 0 (0.0%) |
| 1 Vehicle | 13 (22.0%) | 0 (0.0%) |
| 2 Vehicles | 23 (39.0%) | 30 (60.0%) |
| 3 Vehicles | 10 (17.0%) | 6 (12.0%) |
| 4 Vehicles | 8 (13.6%) | 8 (16.0%) |
| 5 or more Vehicles | 5 (8.5%) | 6 (12.0%) |
| Total | 59 (100.0%) | 50 (100.0%) |
Commute Time in Brookside
The most frequently occuring commute durations in Brookside are 5 to 9 minutes (29 commuters, 29.6%), 10 to 14 minutes (27 commuters, 27.6%), and 15 to 19 minutes (16 commuters, 16.3%).
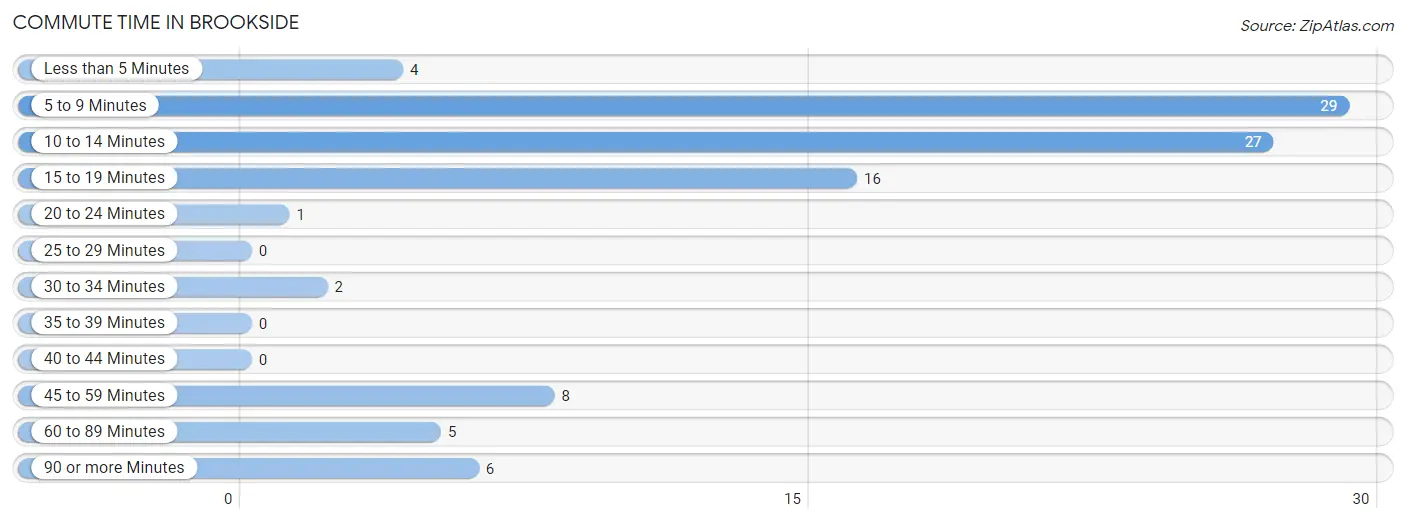
| Commute Time | # Commuters | % Commuters |
| Less than 5 Minutes | 4 | 4.1% |
| 5 to 9 Minutes | 29 | 29.6% |
| 10 to 14 Minutes | 27 | 27.6% |
| 15 to 19 Minutes | 16 | 16.3% |
| 20 to 24 Minutes | 1 | 1.0% |
| 25 to 29 Minutes | 0 | 0.0% |
| 30 to 34 Minutes | 2 | 2.0% |
| 35 to 39 Minutes | 0 | 0.0% |
| 40 to 44 Minutes | 0 | 0.0% |
| 45 to 59 Minutes | 8 | 8.2% |
| 60 to 89 Minutes | 5 | 5.1% |
| 90 or more Minutes | 6 | 6.1% |
Commute Time by Sex in Brookside
The most common commute times in Brookside are 5 to 9 minutes (24 commuters, 42.1%) for males and 10 to 14 minutes (15 commuters, 36.6%) for females.
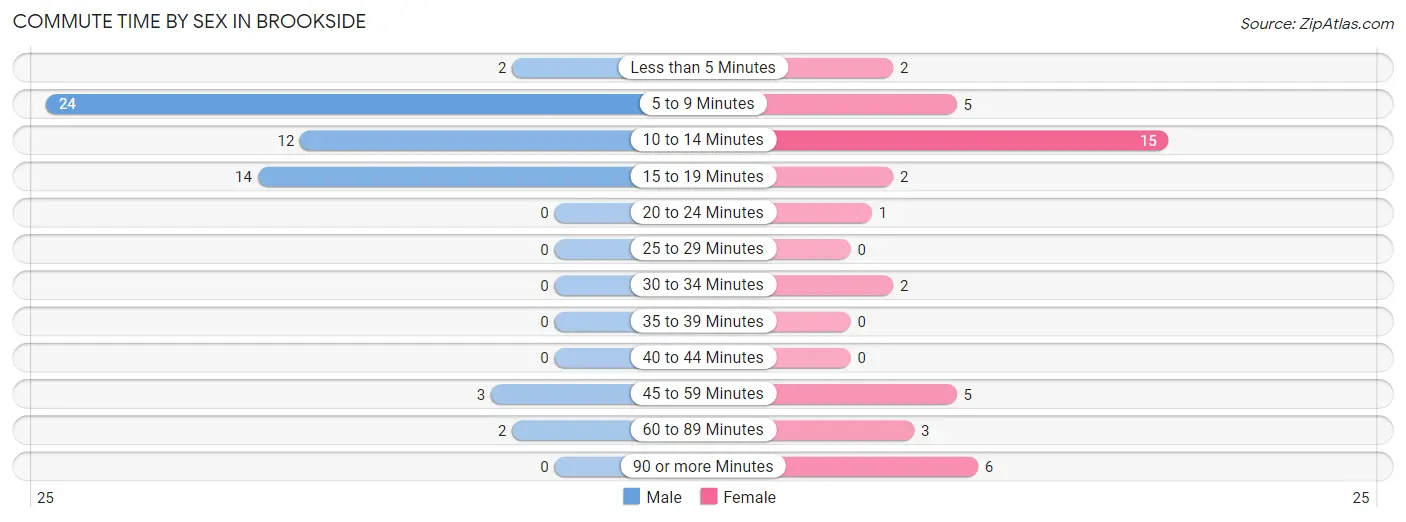
| Commute Time | Male | Female |
| Less than 5 Minutes | 2 (3.5%) | 2 (4.9%) |
| 5 to 9 Minutes | 24 (42.1%) | 5 (12.2%) |
| 10 to 14 Minutes | 12 (21.0%) | 15 (36.6%) |
| 15 to 19 Minutes | 14 (24.6%) | 2 (4.9%) |
| 20 to 24 Minutes | 0 (0.0%) | 1 (2.4%) |
| 25 to 29 Minutes | 0 (0.0%) | 0 (0.0%) |
| 30 to 34 Minutes | 0 (0.0%) | 2 (4.9%) |
| 35 to 39 Minutes | 0 (0.0%) | 0 (0.0%) |
| 40 to 44 Minutes | 0 (0.0%) | 0 (0.0%) |
| 45 to 59 Minutes | 3 (5.3%) | 5 (12.2%) |
| 60 to 89 Minutes | 2 (3.5%) | 3 (7.3%) |
| 90 or more Minutes | 0 (0.0%) | 6 (14.6%) |
Time of Departure to Work by Sex in Brookside
The most frequent times of departure to work in Brookside are 7:00 AM to 7:29 AM (15, 26.3%) for males and 6:30 AM to 6:59 AM (14, 34.2%) for females.
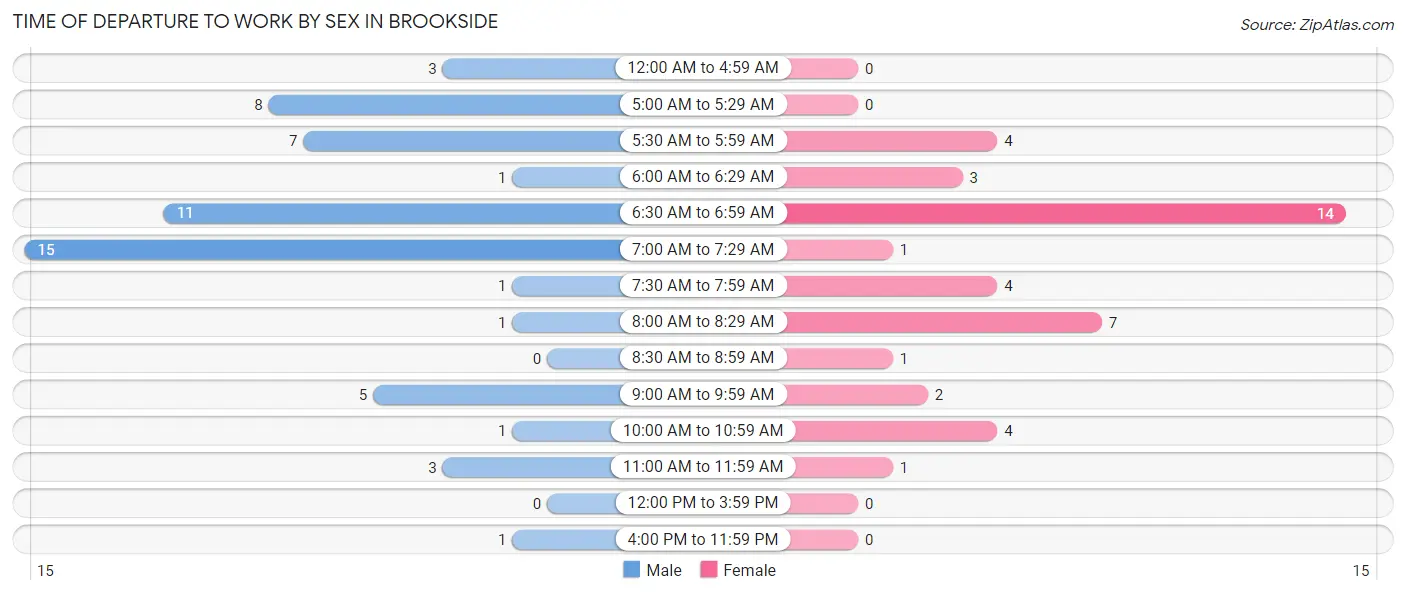
| Time of Departure | Male | Female |
| 12:00 AM to 4:59 AM | 3 (5.3%) | 0 (0.0%) |
| 5:00 AM to 5:29 AM | 8 (14.0%) | 0 (0.0%) |
| 5:30 AM to 5:59 AM | 7 (12.3%) | 4 (9.8%) |
| 6:00 AM to 6:29 AM | 1 (1.8%) | 3 (7.3%) |
| 6:30 AM to 6:59 AM | 11 (19.3%) | 14 (34.2%) |
| 7:00 AM to 7:29 AM | 15 (26.3%) | 1 (2.4%) |
| 7:30 AM to 7:59 AM | 1 (1.8%) | 4 (9.8%) |
| 8:00 AM to 8:29 AM | 1 (1.8%) | 7 (17.1%) |
| 8:30 AM to 8:59 AM | 0 (0.0%) | 1 (2.4%) |
| 9:00 AM to 9:59 AM | 5 (8.8%) | 2 (4.9%) |
| 10:00 AM to 10:59 AM | 1 (1.8%) | 4 (9.8%) |
| 11:00 AM to 11:59 AM | 3 (5.3%) | 1 (2.4%) |
| 12:00 PM to 3:59 PM | 0 (0.0%) | 0 (0.0%) |
| 4:00 PM to 11:59 PM | 1 (1.8%) | 0 (0.0%) |
| Total | 57 (100.0%) | 41 (100.0%) |
Housing Occupancy in Brookside
Occupancy by Ownership in Brookside
Of the total 127 dwellings in Brookside, owner-occupied units account for 105 (82.7%), while renter-occupied units make up 22 (17.3%).
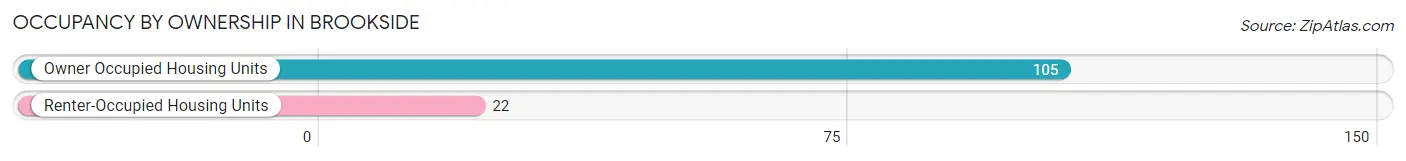
| Occupancy | # Housing Units | % Housing Units |
| Owner Occupied Housing Units | 105 | 82.7% |
| Renter-Occupied Housing Units | 22 | 17.3% |
| Total Occupied Housing Units | 127 | 100.0% |
Occupancy by Household Size in Brookside
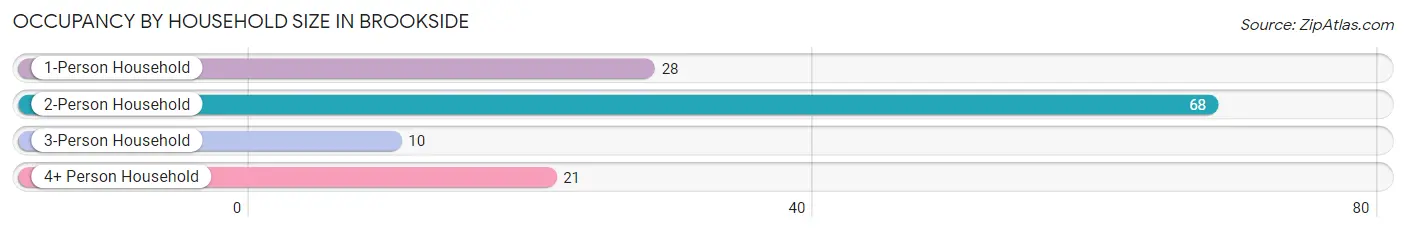
| Household Size | # Housing Units | % Housing Units |
| 1-Person Household | 28 | 22.1% |
| 2-Person Household | 68 | 53.5% |
| 3-Person Household | 10 | 7.9% |
| 4+ Person Household | 21 | 16.5% |
| Total Housing Units | 127 | 100.0% |
Occupancy by Ownership by Household Size in Brookside
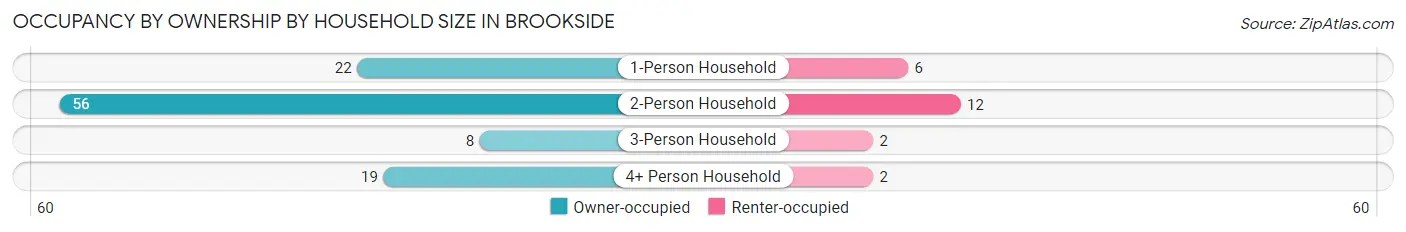
| Household Size | Owner-occupied | Renter-occupied |
| 1-Person Household | 22 (78.6%) | 6 (21.4%) |
| 2-Person Household | 56 (82.4%) | 12 (17.6%) |
| 3-Person Household | 8 (80.0%) | 2 (20.0%) |
| 4+ Person Household | 19 (90.5%) | 2 (9.5%) |
| Total Housing Units | 105 (82.7%) | 22 (17.3%) |
Occupancy by Educational Attainment in Brookside
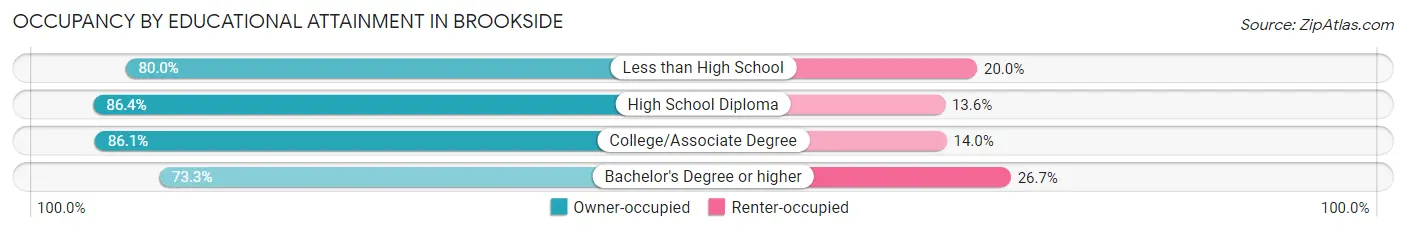
| Household Size | Owner-occupied | Renter-occupied |
| Less than High School | 8 (80.0%) | 2 (20.0%) |
| High School Diploma | 38 (86.4%) | 6 (13.6%) |
| College/Associate Degree | 37 (86.1%) | 6 (14.0%) |
| Bachelor's Degree or higher | 22 (73.3%) | 8 (26.7%) |
Occupancy by Age of Householder in Brookside
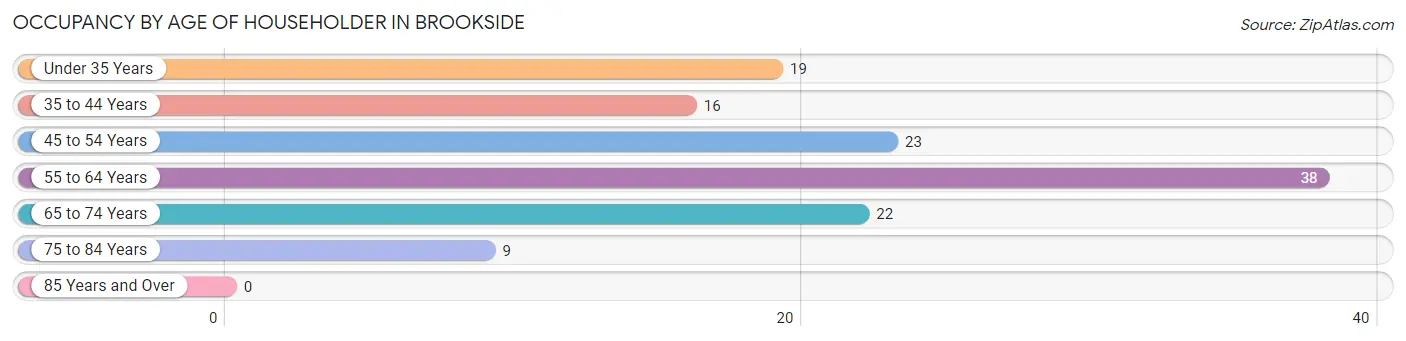
| Age Bracket | # Households | % Households |
| Under 35 Years | 19 | 15.0% |
| 35 to 44 Years | 16 | 12.6% |
| 45 to 54 Years | 23 | 18.1% |
| 55 to 64 Years | 38 | 29.9% |
| 65 to 74 Years | 22 | 17.3% |
| 75 to 84 Years | 9 | 7.1% |
| 85 Years and Over | 0 | 0.0% |
| Total | 127 | 100.0% |
Housing Finances in Brookside
Median Income by Occupancy in Brookside
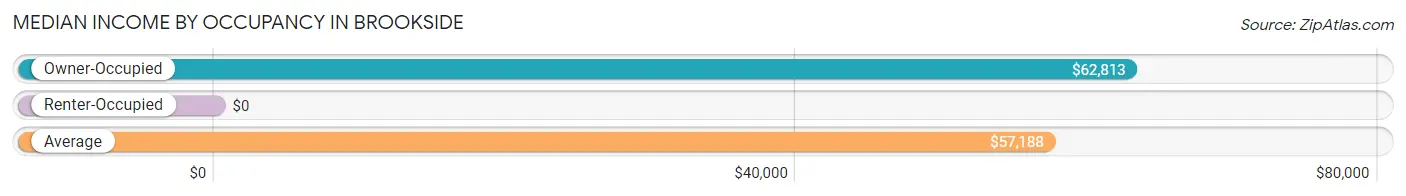
| Occupancy Type | # Households | Median Income |
| Owner-Occupied | 105 (82.7%) | $62,813 |
| Renter-Occupied | 22 (17.3%) | $0 |
| Average | 127 (100.0%) | $57,188 |
Occupancy by Householder Income Bracket in Brookside
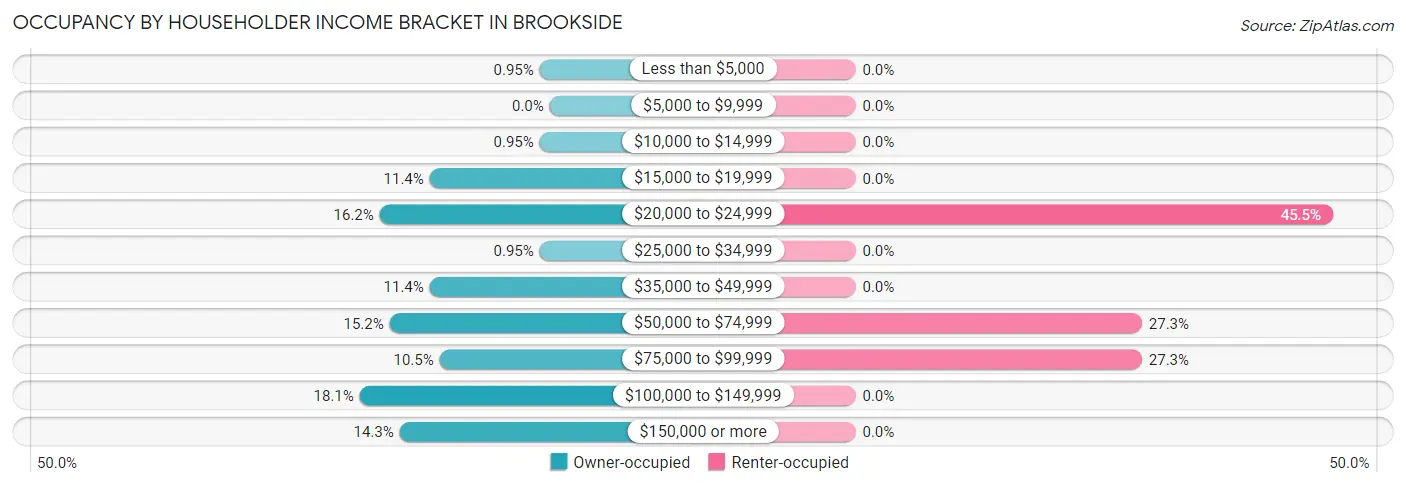
| Income Bracket | Owner-occupied | Renter-occupied |
| Less than $5,000 | 1 (0.9%) | 0 (0.0%) |
| $5,000 to $9,999 | 0 (0.0%) | 0 (0.0%) |
| $10,000 to $14,999 | 1 (0.9%) | 0 (0.0%) |
| $15,000 to $19,999 | 12 (11.4%) | 0 (0.0%) |
| $20,000 to $24,999 | 17 (16.2%) | 10 (45.5%) |
| $25,000 to $34,999 | 1 (0.9%) | 0 (0.0%) |
| $35,000 to $49,999 | 12 (11.4%) | 0 (0.0%) |
| $50,000 to $74,999 | 16 (15.2%) | 6 (27.3%) |
| $75,000 to $99,999 | 11 (10.5%) | 6 (27.3%) |
| $100,000 to $149,999 | 19 (18.1%) | 0 (0.0%) |
| $150,000 or more | 15 (14.3%) | 0 (0.0%) |
| Total | 105 (100.0%) | 22 (100.0%) |
Monthly Housing Cost Tiers in Brookside
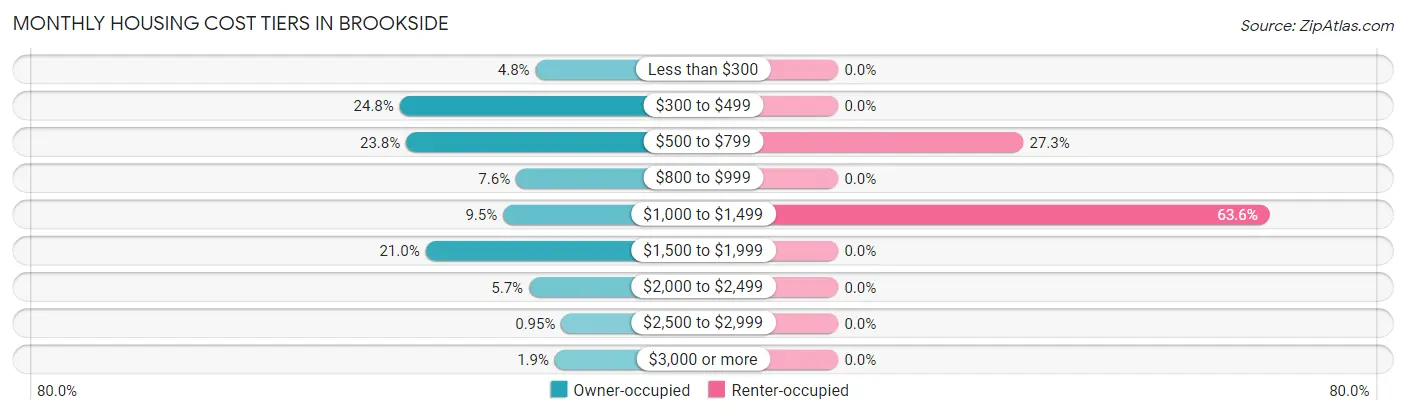
| Monthly Cost | Owner-occupied | Renter-occupied |
| Less than $300 | 5 (4.8%) | 0 (0.0%) |
| $300 to $499 | 26 (24.8%) | 0 (0.0%) |
| $500 to $799 | 25 (23.8%) | 6 (27.3%) |
| $800 to $999 | 8 (7.6%) | 0 (0.0%) |
| $1,000 to $1,499 | 10 (9.5%) | 14 (63.6%) |
| $1,500 to $1,999 | 22 (20.9%) | 0 (0.0%) |
| $2,000 to $2,499 | 6 (5.7%) | 0 (0.0%) |
| $2,500 to $2,999 | 1 (0.9%) | 0 (0.0%) |
| $3,000 or more | 2 (1.9%) | 0 (0.0%) |
| Total | 105 (100.0%) | 22 (100.0%) |
Physical Housing Characteristics in Brookside
Housing Structures in Brookside
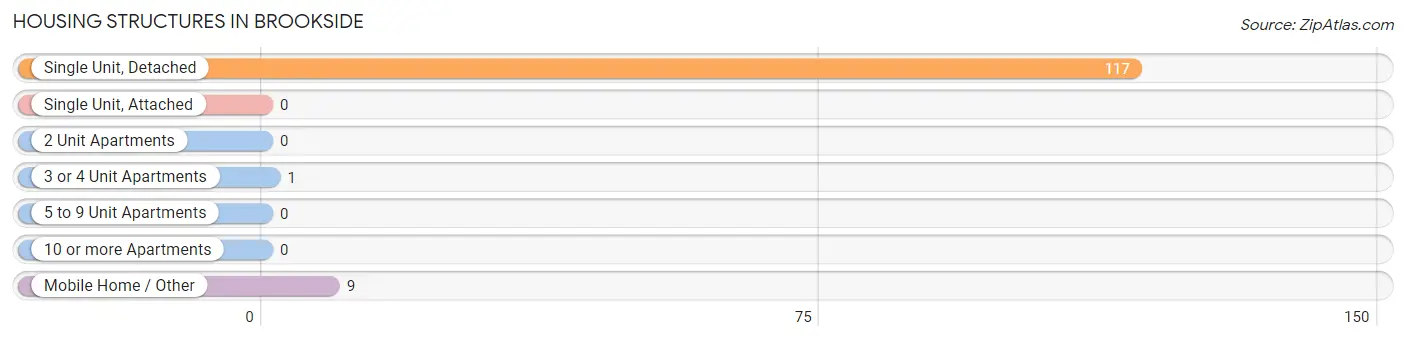
| Structure Type | # Housing Units | % Housing Units |
| Single Unit, Detached | 117 | 92.1% |
| Single Unit, Attached | 0 | 0.0% |
| 2 Unit Apartments | 0 | 0.0% |
| 3 or 4 Unit Apartments | 1 | 0.8% |
| 5 to 9 Unit Apartments | 0 | 0.0% |
| 10 or more Apartments | 0 | 0.0% |
| Mobile Home / Other | 9 | 7.1% |
| Total | 127 | 100.0% |
Housing Structures by Occupancy in Brookside
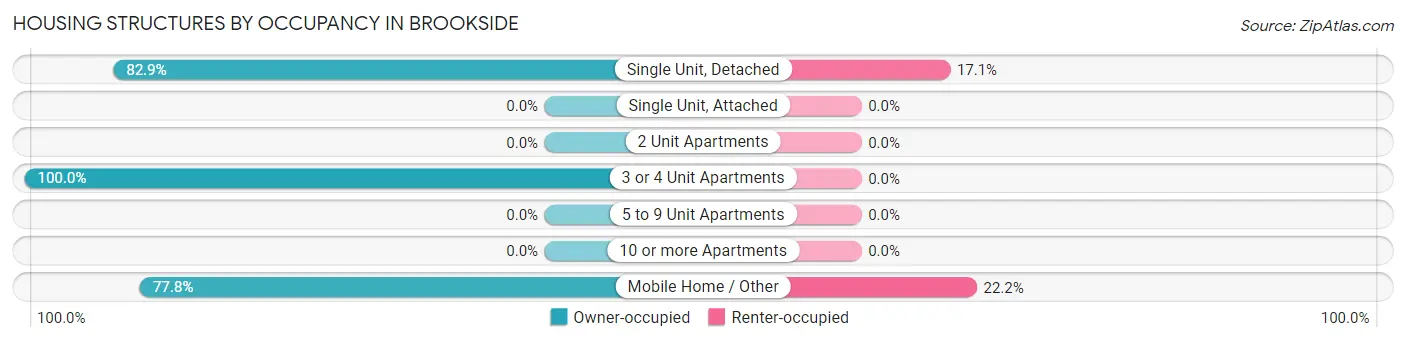
| Structure Type | Owner-occupied | Renter-occupied |
| Single Unit, Detached | 97 (82.9%) | 20 (17.1%) |
| Single Unit, Attached | 0 (0.0%) | 0 (0.0%) |
| 2 Unit Apartments | 0 (0.0%) | 0 (0.0%) |
| 3 or 4 Unit Apartments | 1 (100.0%) | 0 (0.0%) |
| 5 to 9 Unit Apartments | 0 (0.0%) | 0 (0.0%) |
| 10 or more Apartments | 0 (0.0%) | 0 (0.0%) |
| Mobile Home / Other | 7 (77.8%) | 2 (22.2%) |
| Total | 105 (82.7%) | 22 (17.3%) |
Housing Structures by Number of Rooms in Brookside
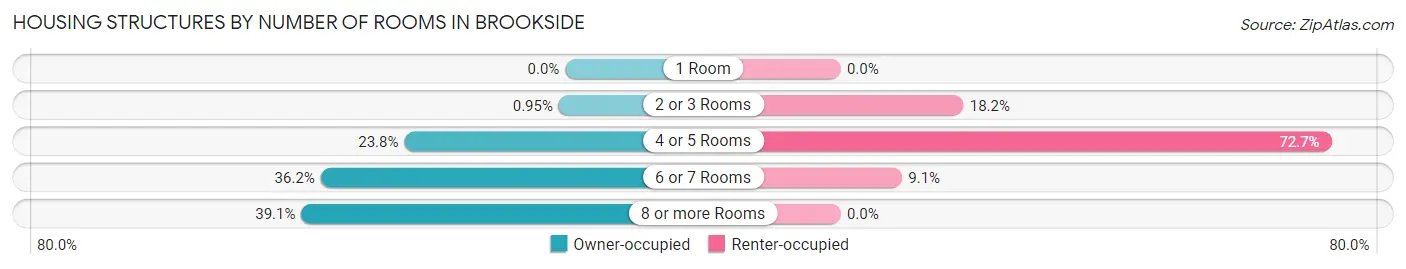
| Number of Rooms | Owner-occupied | Renter-occupied |
| 1 Room | 0 (0.0%) | 0 (0.0%) |
| 2 or 3 Rooms | 1 (0.9%) | 4 (18.2%) |
| 4 or 5 Rooms | 25 (23.8%) | 16 (72.7%) |
| 6 or 7 Rooms | 38 (36.2%) | 2 (9.1%) |
| 8 or more Rooms | 41 (39.1%) | 0 (0.0%) |
| Total | 105 (100.0%) | 22 (100.0%) |
Housing Structure by Heating Type in Brookside
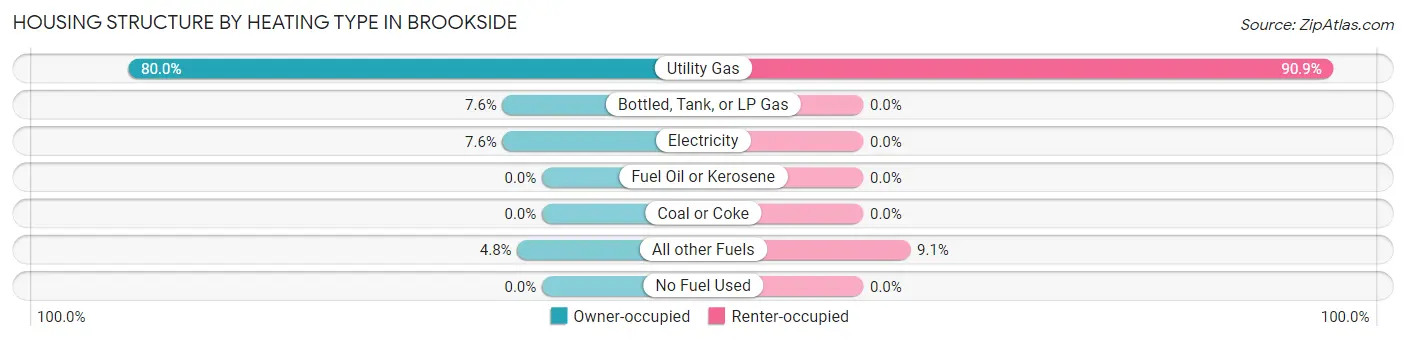
| Heating Type | Owner-occupied | Renter-occupied |
| Utility Gas | 84 (80.0%) | 20 (90.9%) |
| Bottled, Tank, or LP Gas | 8 (7.6%) | 0 (0.0%) |
| Electricity | 8 (7.6%) | 0 (0.0%) |
| Fuel Oil or Kerosene | 0 (0.0%) | 0 (0.0%) |
| Coal or Coke | 0 (0.0%) | 0 (0.0%) |
| All other Fuels | 5 (4.8%) | 2 (9.1%) |
| No Fuel Used | 0 (0.0%) | 0 (0.0%) |
| Total | 105 (100.0%) | 22 (100.0%) |
Household Vehicle Usage in Brookside
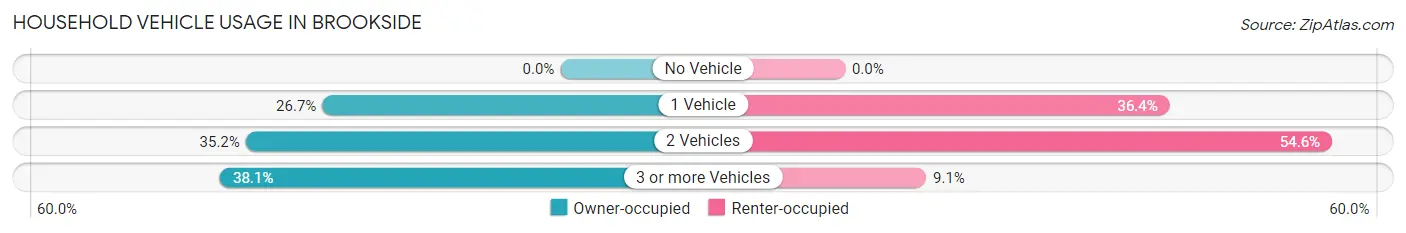
| Vehicles per Household | Owner-occupied | Renter-occupied |
| No Vehicle | 0 (0.0%) | 0 (0.0%) |
| 1 Vehicle | 28 (26.7%) | 8 (36.4%) |
| 2 Vehicles | 37 (35.2%) | 12 (54.5%) |
| 3 or more Vehicles | 40 (38.1%) | 2 (9.1%) |
| Total | 105 (100.0%) | 22 (100.0%) |
Real Estate & Mortgages in Brookside
Real Estate and Mortgage Overview in Brookside
| Characteristic | Without Mortgage | With Mortgage |
| Housing Units | 57 | 48 |
| Median Property Value | - | - |
| Median Household Income | $46,607 | $6 |
| Monthly Housing Costs | $483 | $2 |
| Real Estate Taxes | $1,159 | $0 |
Property Value by Mortgage Status in Brookside
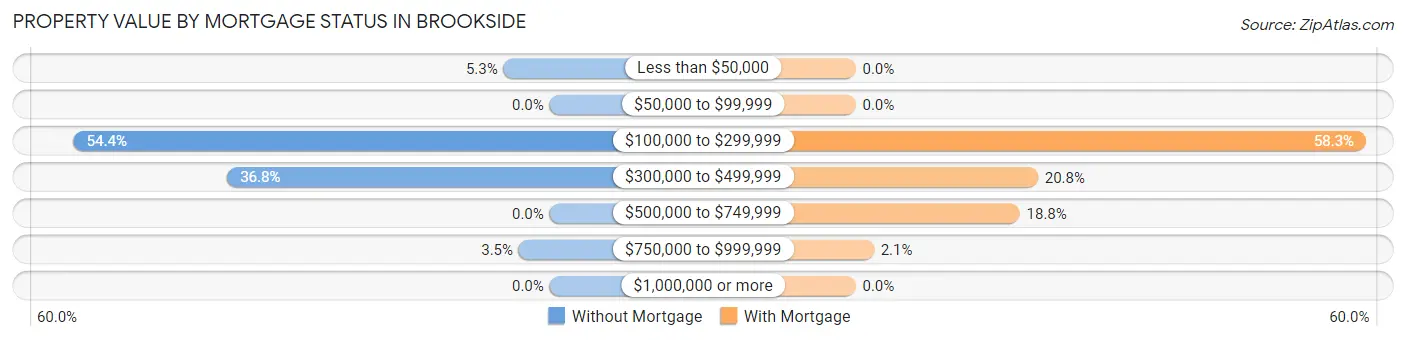
| Property Value | Without Mortgage | With Mortgage |
| Less than $50,000 | 3 (5.3%) | 0 (0.0%) |
| $50,000 to $99,999 | 0 (0.0%) | 0 (0.0%) |
| $100,000 to $299,999 | 31 (54.4%) | 28 (58.3%) |
| $300,000 to $499,999 | 21 (36.8%) | 10 (20.8%) |
| $500,000 to $749,999 | 0 (0.0%) | 9 (18.8%) |
| $750,000 to $999,999 | 2 (3.5%) | 1 (2.1%) |
| $1,000,000 or more | 0 (0.0%) | 0 (0.0%) |
| Total | 57 (100.0%) | 48 (100.0%) |
Household Income by Mortgage Status in Brookside
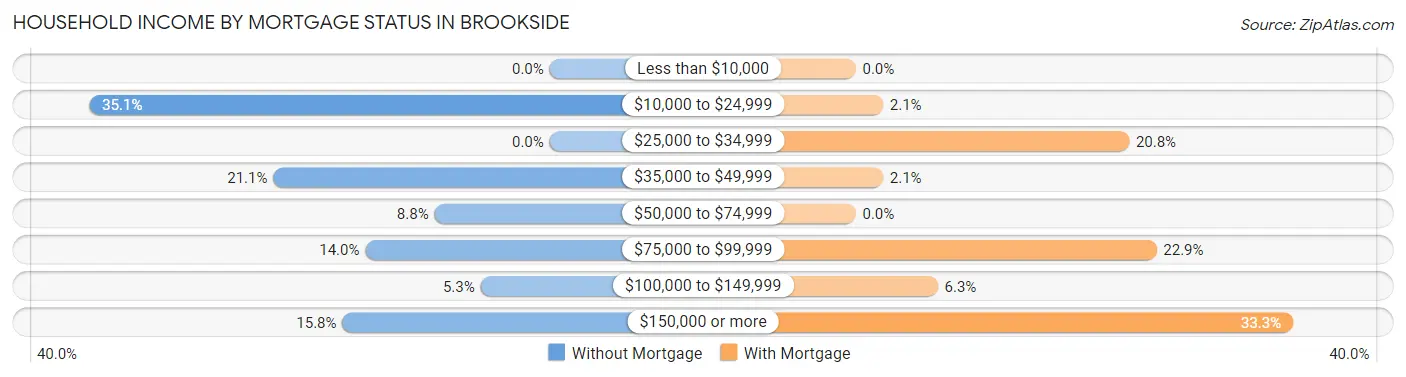
| Household Income | Without Mortgage | With Mortgage |
| Less than $10,000 | 0 (0.0%) | 0 (0.0%) |
| $10,000 to $24,999 | 20 (35.1%) | 1 (2.1%) |
| $25,000 to $34,999 | 0 (0.0%) | 10 (20.8%) |
| $35,000 to $49,999 | 12 (21.0%) | 1 (2.1%) |
| $50,000 to $74,999 | 5 (8.8%) | 0 (0.0%) |
| $75,000 to $99,999 | 8 (14.0%) | 11 (22.9%) |
| $100,000 to $149,999 | 3 (5.3%) | 3 (6.2%) |
| $150,000 or more | 9 (15.8%) | 16 (33.3%) |
| Total | 57 (100.0%) | 48 (100.0%) |
Property Value to Household Income Ratio in Brookside
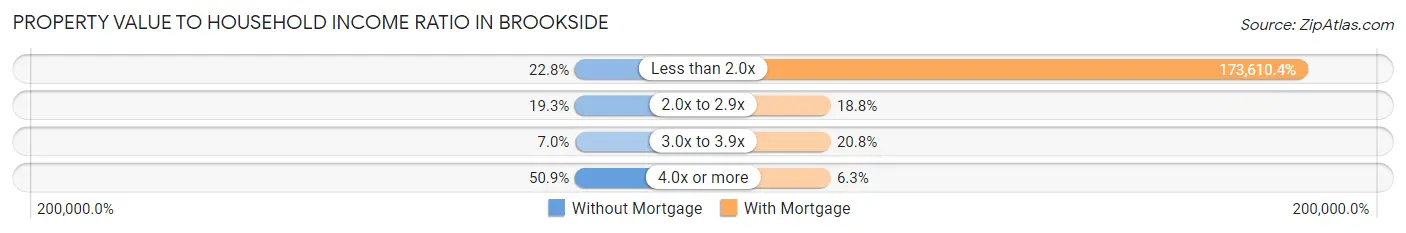
| Value-to-Income Ratio | Without Mortgage | With Mortgage |
| Less than 2.0x | 13 (22.8%) | 83,333 (173,610.4%) |
| 2.0x to 2.9x | 11 (19.3%) | 9 (18.8%) |
| 3.0x to 3.9x | 4 (7.0%) | 10 (20.8%) |
| 4.0x or more | 29 (50.9%) | 3 (6.2%) |
| Total | 57 (100.0%) | 48 (100.0%) |
Real Estate Taxes by Mortgage Status in Brookside
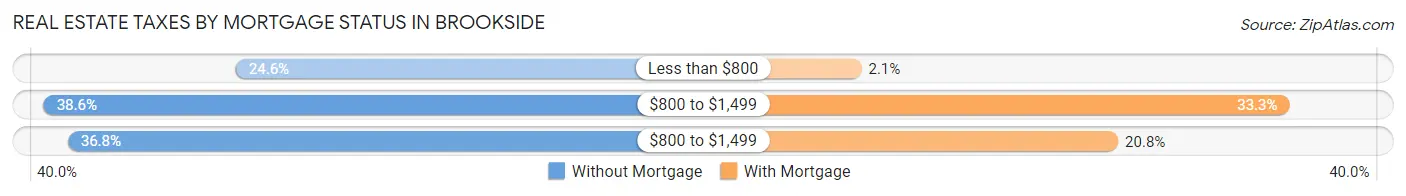
| Property Taxes | Without Mortgage | With Mortgage |
| Less than $800 | 14 (24.6%) | 1 (2.1%) |
| $800 to $1,499 | 22 (38.6%) | 16 (33.3%) |
| $800 to $1,499 | 21 (36.8%) | 10 (20.8%) |
| Total | 57 (100.0%) | 48 (100.0%) |
Health & Disability in Brookside
Health Insurance Coverage by Age in Brookside
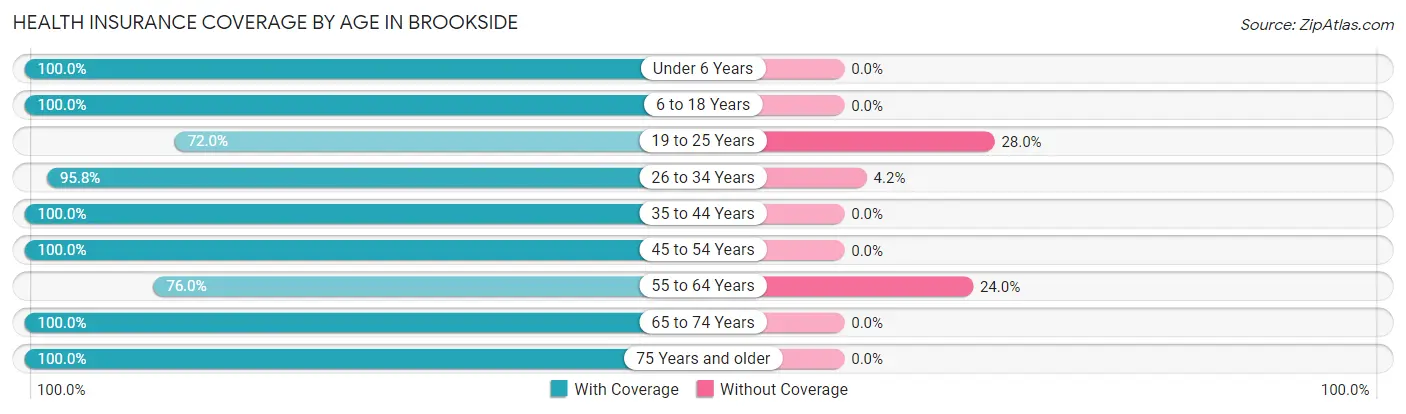
| Age Bracket | With Coverage | Without Coverage |
| Under 6 Years | 2 (100.0%) | 0 (0.0%) |
| 6 to 18 Years | 32 (100.0%) | 0 (0.0%) |
| 19 to 25 Years | 18 (72.0%) | 7 (28.0%) |
| 26 to 34 Years | 23 (95.8%) | 1 (4.2%) |
| 35 to 44 Years | 34 (100.0%) | 0 (0.0%) |
| 45 to 54 Years | 36 (100.0%) | 0 (0.0%) |
| 55 to 64 Years | 57 (76.0%) | 18 (24.0%) |
| 65 to 74 Years | 46 (100.0%) | 0 (0.0%) |
| 75 Years and older | 16 (100.0%) | 0 (0.0%) |
| Total | 264 (91.0%) | 26 (9.0%) |
Health Insurance Coverage by Citizenship Status in Brookside
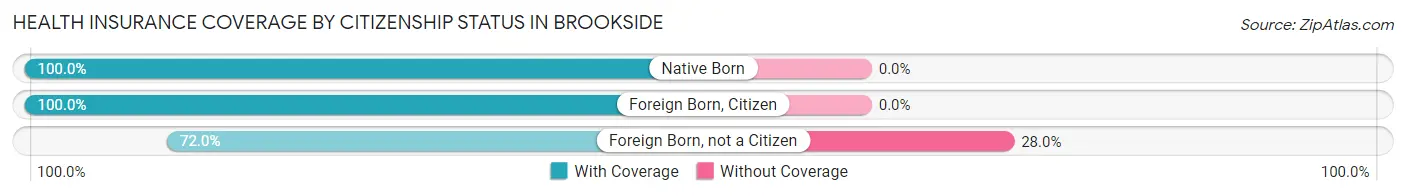
| Citizenship Status | With Coverage | Without Coverage |
| Native Born | 2 (100.0%) | 0 (0.0%) |
| Foreign Born, Citizen | 32 (100.0%) | 0 (0.0%) |
| Foreign Born, not a Citizen | 18 (72.0%) | 7 (28.0%) |
Health Insurance Coverage by Household Income in Brookside
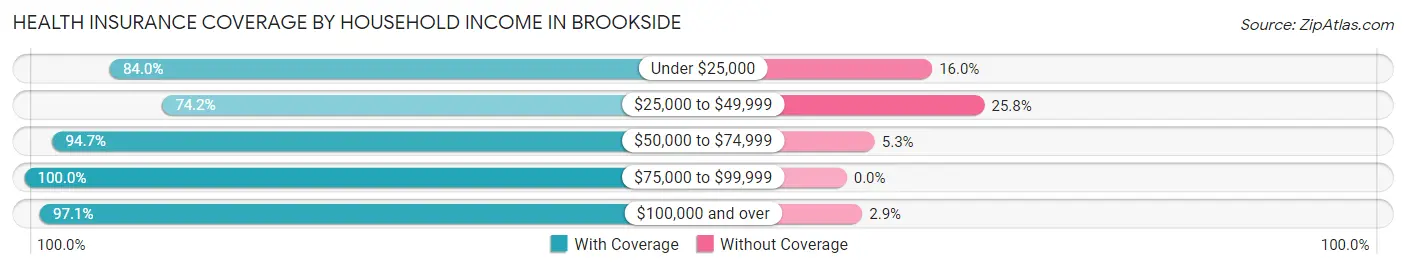
| Household Income | With Coverage | Without Coverage |
| Under $25,000 | 63 (84.0%) | 12 (16.0%) |
| $25,000 to $49,999 | 23 (74.2%) | 8 (25.8%) |
| $50,000 to $74,999 | 54 (94.7%) | 3 (5.3%) |
| $75,000 to $99,999 | 24 (100.0%) | 0 (0.0%) |
| $100,000 and over | 100 (97.1%) | 3 (2.9%) |
Public vs Private Health Insurance Coverage by Age in Brookside
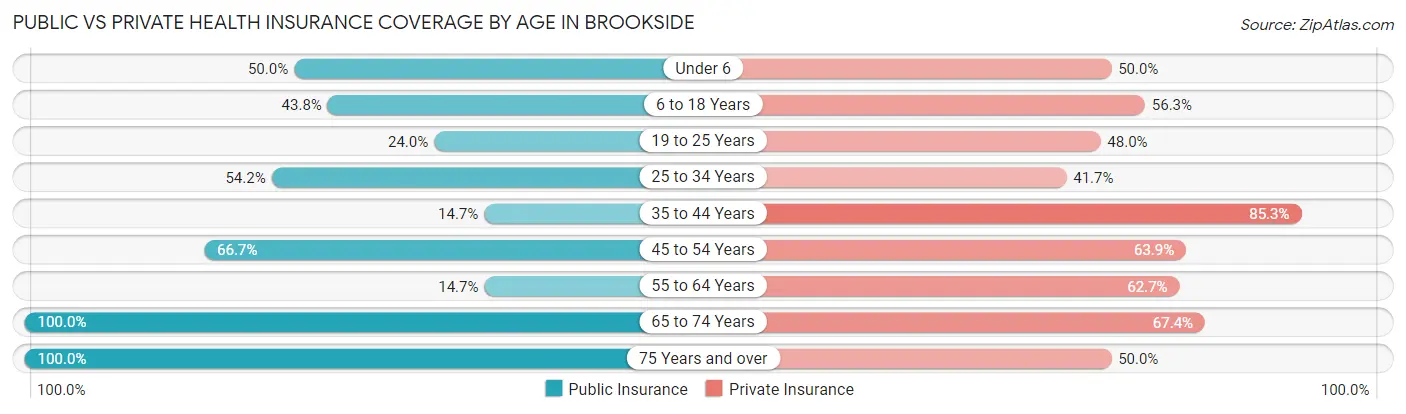
| Age Bracket | Public Insurance | Private Insurance |
| Under 6 | 1 (50.0%) | 1 (50.0%) |
| 6 to 18 Years | 14 (43.8%) | 18 (56.2%) |
| 19 to 25 Years | 6 (24.0%) | 12 (48.0%) |
| 25 to 34 Years | 13 (54.2%) | 10 (41.7%) |
| 35 to 44 Years | 5 (14.7%) | 29 (85.3%) |
| 45 to 54 Years | 24 (66.7%) | 23 (63.9%) |
| 55 to 64 Years | 11 (14.7%) | 47 (62.7%) |
| 65 to 74 Years | 46 (100.0%) | 31 (67.4%) |
| 75 Years and over | 16 (100.0%) | 8 (50.0%) |
| Total | 136 (46.9%) | 179 (61.7%) |
Disability Status by Sex by Age in Brookside
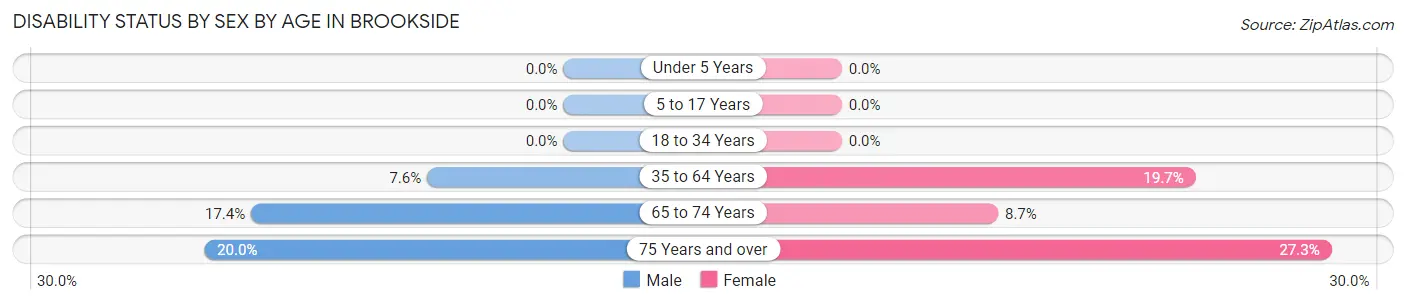
| Age Bracket | Male | Female |
| Under 5 Years | 0 (0.0%) | 0 (0.0%) |
| 5 to 17 Years | 0 (0.0%) | 0 (0.0%) |
| 18 to 34 Years | 0 (0.0%) | 0 (0.0%) |
| 35 to 64 Years | 6 (7.6%) | 13 (19.7%) |
| 65 to 74 Years | 4 (17.4%) | 2 (8.7%) |
| 75 Years and over | 1 (20.0%) | 3 (27.3%) |
Disability Class by Sex by Age in Brookside
Disability Class: Hearing Difficulty
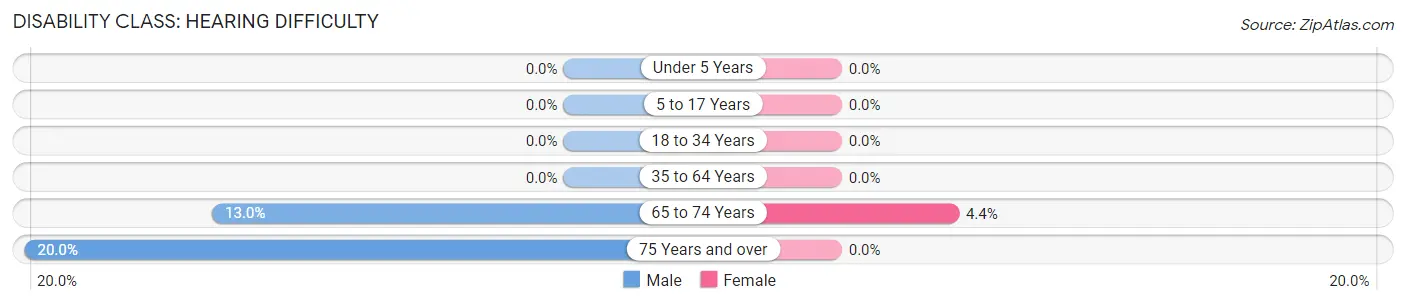
| Age Bracket | Male | Female |
| Under 5 Years | 0 (0.0%) | 0 (0.0%) |
| 5 to 17 Years | 0 (0.0%) | 0 (0.0%) |
| 18 to 34 Years | 0 (0.0%) | 0 (0.0%) |
| 35 to 64 Years | 0 (0.0%) | 0 (0.0%) |
| 65 to 74 Years | 3 (13.0%) | 1 (4.3%) |
| 75 Years and over | 1 (20.0%) | 0 (0.0%) |
Disability Class: Vision Difficulty
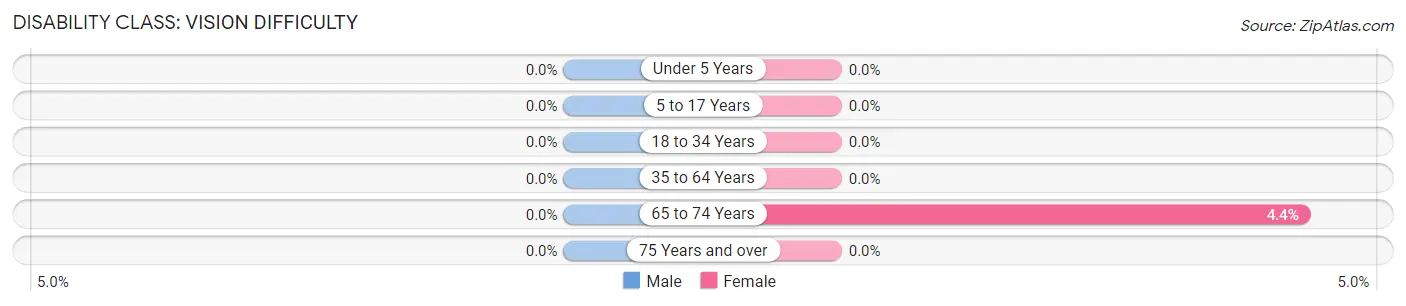
| Age Bracket | Male | Female |
| Under 5 Years | 0 (0.0%) | 0 (0.0%) |
| 5 to 17 Years | 0 (0.0%) | 0 (0.0%) |
| 18 to 34 Years | 0 (0.0%) | 0 (0.0%) |
| 35 to 64 Years | 0 (0.0%) | 0 (0.0%) |
| 65 to 74 Years | 0 (0.0%) | 1 (4.3%) |
| 75 Years and over | 0 (0.0%) | 0 (0.0%) |
Disability Class: Cognitive Difficulty
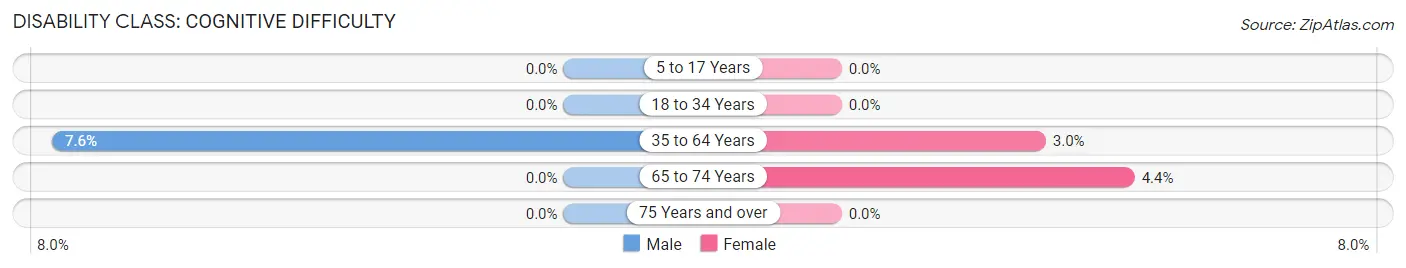
| Age Bracket | Male | Female |
| 5 to 17 Years | 0 (0.0%) | 0 (0.0%) |
| 18 to 34 Years | 0 (0.0%) | 0 (0.0%) |
| 35 to 64 Years | 6 (7.6%) | 2 (3.0%) |
| 65 to 74 Years | 0 (0.0%) | 1 (4.3%) |
| 75 Years and over | 0 (0.0%) | 0 (0.0%) |
Disability Class: Ambulatory Difficulty
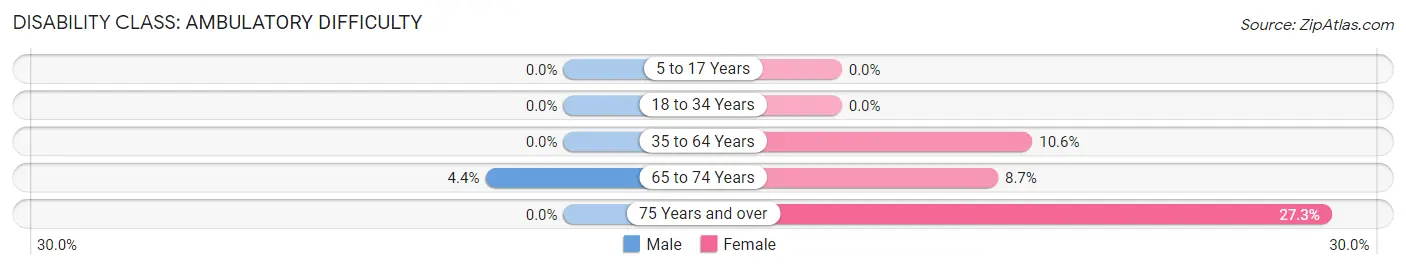
| Age Bracket | Male | Female |
| 5 to 17 Years | 0 (0.0%) | 0 (0.0%) |
| 18 to 34 Years | 0 (0.0%) | 0 (0.0%) |
| 35 to 64 Years | 0 (0.0%) | 7 (10.6%) |
| 65 to 74 Years | 1 (4.3%) | 2 (8.7%) |
| 75 Years and over | 0 (0.0%) | 3 (27.3%) |
Disability Class: Self-Care Difficulty
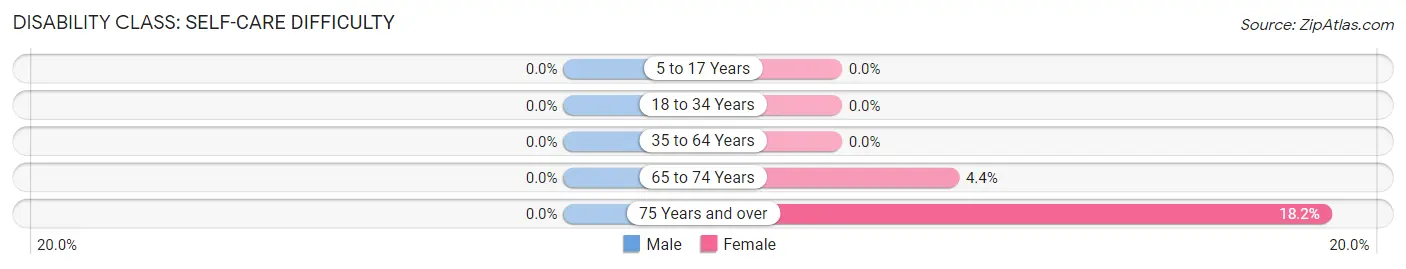
| Age Bracket | Male | Female |
| 5 to 17 Years | 0 (0.0%) | 0 (0.0%) |
| 18 to 34 Years | 0 (0.0%) | 0 (0.0%) |
| 35 to 64 Years | 0 (0.0%) | 0 (0.0%) |
| 65 to 74 Years | 0 (0.0%) | 1 (4.3%) |
| 75 Years and over | 0 (0.0%) | 2 (18.2%) |
Technology Access in Brookside
Computing Device Access in Brookside
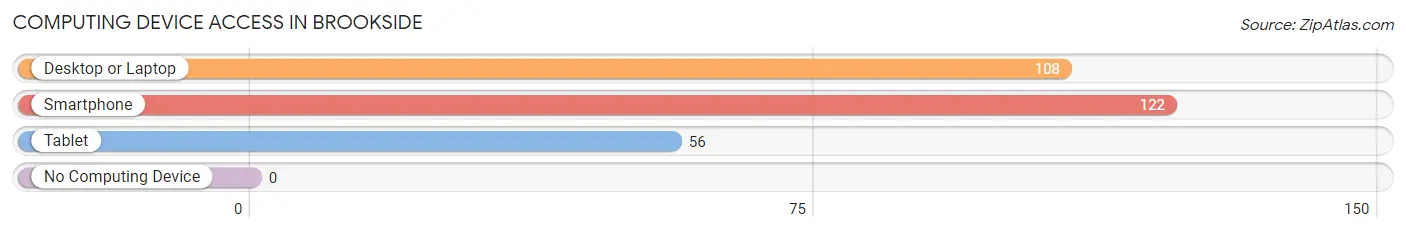
| Device Type | # Households | % Households |
| Desktop or Laptop | 108 | 85.0% |
| Smartphone | 122 | 96.1% |
| Tablet | 56 | 44.1% |
| No Computing Device | 0 | 0.0% |
| Total | 127 | 100.0% |
Internet Access in Brookside

| Internet Type | # Households | % Households |
| Dial-Up Internet | 0 | 0.0% |
| Broadband Home | 88 | 69.3% |
| Cellular Data Only | 25 | 19.7% |
| Satellite Internet | 1 | 0.8% |
| No Internet | 14 | 11.0% |
| Total | 127 | 100.0% |
Brookside Summary
Brookside is a small town located in the state of Colorado, United States. It is situated in the foothills of the Rocky Mountains, approximately 25 miles west of Denver. The town has a population of approximately 1,000 people and is part of the Denver-Aurora-Lakewood Metropolitan Statistical Area.
History
The area that is now Brookside was first settled in the late 1800s by homesteaders. The town was officially founded in 1887 and was named after the nearby Brookside Creek. The town was initially a farming community, but it soon developed into a small mining town. The town was home to several coal mines, which provided employment for many of the town’s residents.
In the early 1900s, the town began to experience a population boom as more people moved to the area. This was due to the discovery of oil in the area, which led to the development of several oil wells. The town also experienced a period of growth during the 1950s and 1960s, when the nearby Denver-Boulder Turnpike was constructed.
Geography
Brookside is located in the foothills of the Rocky Mountains, approximately 25 miles west of Denver. The town is situated at an elevation of 5,890 feet above sea level. The town is surrounded by rolling hills and is located in a valley. The nearby mountains provide a picturesque backdrop to the town.
The town is located in the South Platte River Valley, which is a major agricultural region in Colorado. The town is also located near several ski resorts, including Loveland Ski Area and Arapahoe Basin.
Economy
The economy of Brookside is largely based on agriculture and tourism. The town is home to several farms, which produce a variety of crops, including corn, wheat, and hay. The town is also home to several wineries, which produce a variety of wines.
The town is also a popular tourist destination, due to its proximity to several ski resorts. The town is also home to several restaurants, bars, and shops, which cater to tourists and locals alike.
Demographics
As of the 2010 census, the population of Brookside was 1,000 people. The town is predominantly white, with approximately 95% of the population being white. The town also has a small Hispanic population, with approximately 4% of the population being Hispanic. The median household income in the town is approximately $50,000. The town also has a low unemployment rate, with only 3% of the population being unemployed.
Conclusion
Brookside is a small town located in the foothills of the Rocky Mountains, approximately 25 miles west of Denver. The town has a population of approximately 1,000 people and is part of the Denver-Aurora-Lakewood Metropolitan Statistical Area. The town’s economy is largely based on agriculture and tourism, and the town is home to several farms, wineries, restaurants, bars, and shops. The town is predominantly white, with approximately 95% of the population being white. The median household income in the town is approximately $50,000, and the town has a low unemployment rate, with only 3% of the population being unemployed.
Common Questions
What is Per Capita Income in Brookside?
Per Capita income in Brookside is $41,948.
What is the Median Family Income in Brookside?
Median Family Income in Brookside is $65,000.
What is the Median Household income in Brookside?
Median Household Income in Brookside is $57,188.
What is Income or Wage Gap in Brookside?
Income or Wage Gap in Brookside is 63.6%.
Women in Brookside earn 36.4 cents for every dollar earned by a man.
What is Family Income Deficit in Brookside?
Family Income Deficit in Brookside is $4,638.
Families that are below poverty line in Brookside earn $4,638 less on average than the poverty threshold level.
What is Inequality or Gini Index in Brookside?
Inequality or Gini Index in Brookside is 0.50.
What is the Total Population of Brookside?
Total Population of Brookside is 290.
What is the Total Male Population of Brookside?
Total Male Population of Brookside is 152.
What is the Total Female Population of Brookside?
Total Female Population of Brookside is 138.
What is the Ratio of Males per 100 Females in Brookside?
There are 110.14 Males per 100 Females in Brookside.
What is the Ratio of Females per 100 Males in Brookside?
There are 90.79 Females per 100 Males in Brookside.
What is the Median Population Age in Brookside?
Median Population Age in Brookside is 53.8 Years.
What is the Average Family Size in Brookside
Average Family Size in Brookside is 2.7 People.
What is the Average Household Size in Brookside
Average Household Size in Brookside is 2.3 People.
How Large is the Labor Force in Brookside?
There are 137 People in the Labor Forcein in Brookside.
What is the Percentage of People in the Labor Force in Brookside?
52.9% of People are in the Labor Force in Brookside.
What is the Unemployment Rate in Brookside?
Unemployment Rate in Brookside is 20.4%.