Branson, CO Map & Demographics
Branson Map
Branson Overview
$16,022
PER CAPITA INCOME
$27,500
AVG HOUSEHOLD INCOME
0.45
INEQUALITY / GINI INDEX
60
TOTAL POPULATION
34
MALE POPULATION
26
FEMALE POPULATION
130.77
MALES / 100 FEMALES
76.47
FEMALES / 100 MALES
58.3
MEDIAN AGE
3.8
AVG FAMILY SIZE
1.7
AVG HOUSEHOLD SIZE
17
LABOR FORCE [ PEOPLE ]
34.0%
PERCENT IN LABOR FORCE
Branson Zip Codes
Branson Area Codes
Income in Branson
Income Overview in Branson
| Characteristic | Number | Measure |
| Per Capita Income | 60 | $16,022 |
| Median Family Income | 6 | $0 |
| Mean Family Income | 6 | $57,567 |
| Median Household Income | 36 | $27,500 |
| Mean Household Income | 36 | $26,703 |
| Income Deficit | 6 | $0 |
| Wage / Income Gap (%) | 60 | 0.00% |
| Wage / Income Gap ($) | 60 | 100.00¢ per $1 |
| Gini / Inequality Index | 60 | 0.45 |
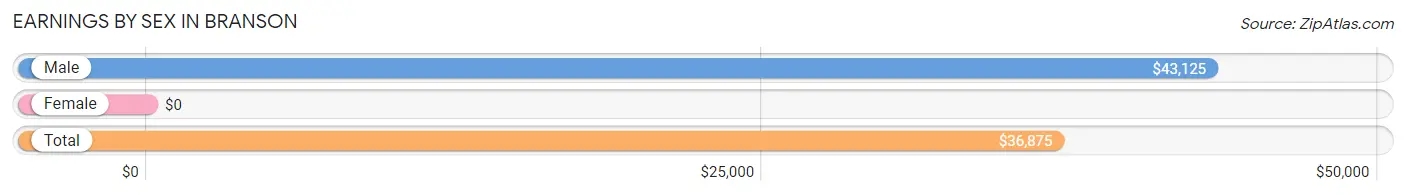
Earnings by Sex in Branson
| Sex | Number | Average Earnings |
| Male | 11 (61.1%) | $43,125 |
| Female | 7 (38.9%) | $0 |
| Total | 18 (100.0%) | $36,875 |
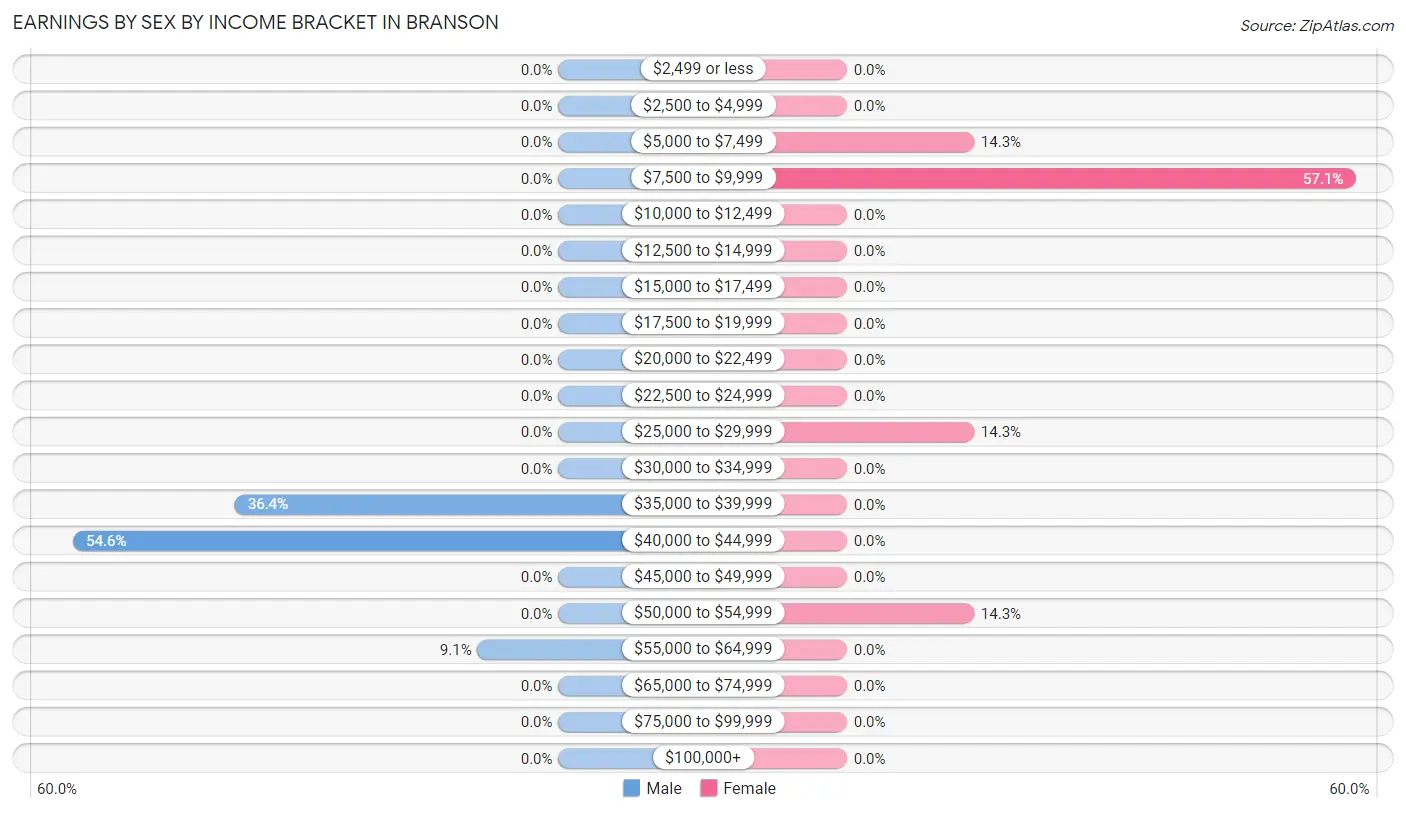
Earnings by Sex by Income Bracket in Branson
The most common earnings brackets in Branson are $40,000 to $44,999 for men (6 | 54.5%) and $7,500 to $9,999 for women (4 | 57.1%).
| Income | Male | Female |
| $2,499 or less | 0 (0.0%) | 0 (0.0%) |
| $2,500 to $4,999 | 0 (0.0%) | 0 (0.0%) |
| $5,000 to $7,499 | 0 (0.0%) | 1 (14.3%) |
| $7,500 to $9,999 | 0 (0.0%) | 4 (57.1%) |
| $10,000 to $12,499 | 0 (0.0%) | 0 (0.0%) |
| $12,500 to $14,999 | 0 (0.0%) | 0 (0.0%) |
| $15,000 to $17,499 | 0 (0.0%) | 0 (0.0%) |
| $17,500 to $19,999 | 0 (0.0%) | 0 (0.0%) |
| $20,000 to $22,499 | 0 (0.0%) | 0 (0.0%) |
| $22,500 to $24,999 | 0 (0.0%) | 0 (0.0%) |
| $25,000 to $29,999 | 0 (0.0%) | 1 (14.3%) |
| $30,000 to $34,999 | 0 (0.0%) | 0 (0.0%) |
| $35,000 to $39,999 | 4 (36.4%) | 0 (0.0%) |
| $40,000 to $44,999 | 6 (54.5%) | 0 (0.0%) |
| $45,000 to $49,999 | 0 (0.0%) | 0 (0.0%) |
| $50,000 to $54,999 | 0 (0.0%) | 1 (14.3%) |
| $55,000 to $64,999 | 1 (9.1%) | 0 (0.0%) |
| $65,000 to $74,999 | 0 (0.0%) | 0 (0.0%) |
| $75,000 to $99,999 | 0 (0.0%) | 0 (0.0%) |
| $100,000+ | 0 (0.0%) | 0 (0.0%) |
| Total | 11 (100.0%) | 7 (100.0%) |
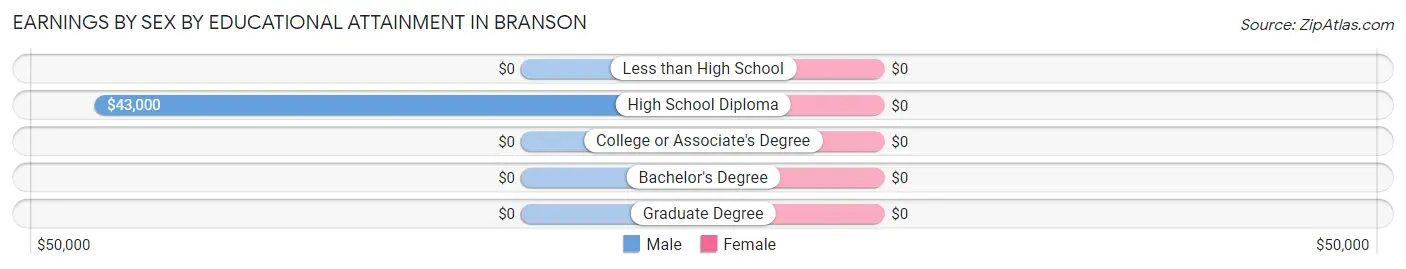
Earnings by Sex by Educational Attainment in Branson
| Educational Attainment | Male Income | Female Income |
| Less than High School | - | - |
| High School Diploma | $43,000 | $0 |
| College or Associate's Degree | - | - |
| Bachelor's Degree | - | - |
| Graduate Degree | - | - |
| Total | $43,125 | $0 |
Family Income in Branson
Family Income Brackets in Branson
According to the Branson family income data, there are 3 families falling into the $35,000 to $49,999 income range, which is the most common income bracket and makes up 50.0% of all families.
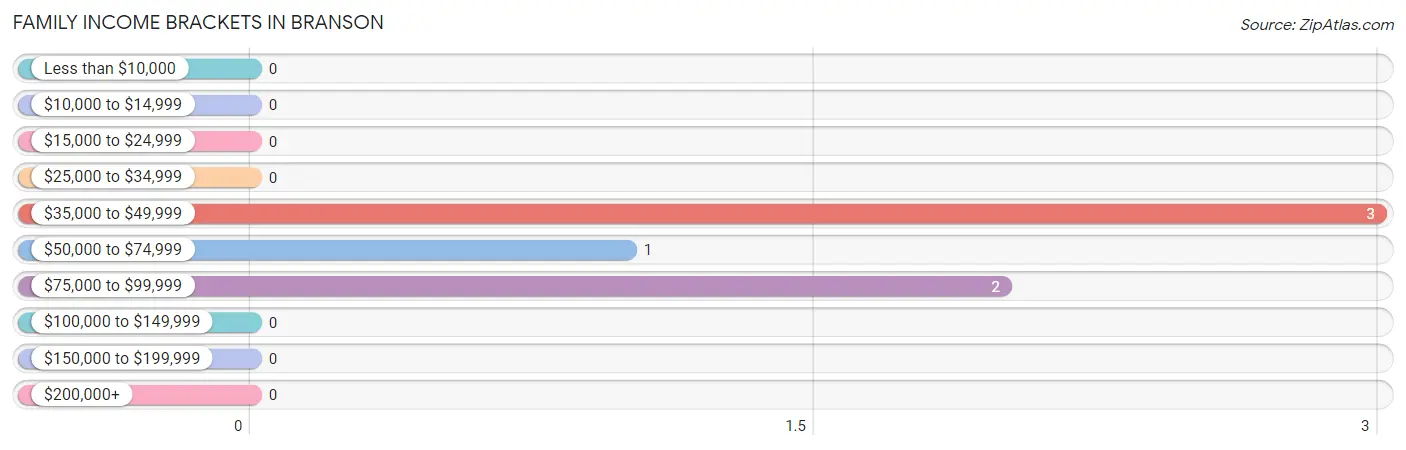
| Income Bracket | # Families | % Families |
| Less than $10,000 | 0 | 0.0% |
| $10,000 to $14,999 | 0 | 0.0% |
| $15,000 to $24,999 | 0 | 0.0% |
| $25,000 to $34,999 | 0 | 0.0% |
| $35,000 to $49,999 | 3 | 50.0% |
| $50,000 to $74,999 | 1 | 16.7% |
| $75,000 to $99,999 | 2 | 33.3% |
| $100,000 to $149,999 | 0 | 0.0% |
| $150,000 to $199,999 | 0 | 0.0% |
| $200,000+ | 0 | 0.0% |
Family Income by Famaliy Size in Branson
| Income Bracket | # Families | Median Income |
| 2-Person Families | 5 (83.3%) | $0 |
| 3-Person Families | 0 (0.0%) | $0 |
| 4-Person Families | 0 (0.0%) | $0 |
| 5-Person Families | 0 (0.0%) | $0 |
| 6-Person Families | 1 (16.7%) | $0 |
| 7+ Person Families | 0 (0.0%) | $0 |
| Total | 6 (100.0%) | $0 |
Family Income by Number of Earners in Branson
| Number of Earners | # Families | Median Income |
| No Earners | 0 (0.0%) | $0 |
| 1 Earner | 4 (66.7%) | $0 |
| 2 Earners | 2 (33.3%) | $0 |
| 3+ Earners | 0 (0.0%) | $0 |
| Total | 6 (100.0%) | $0 |
Household Income in Branson
Household Income Brackets in Branson
With 12 households falling in the category, the $35,000 to $49,999 income range is the most frequent in Branson, accounting for 33.3% of all households.
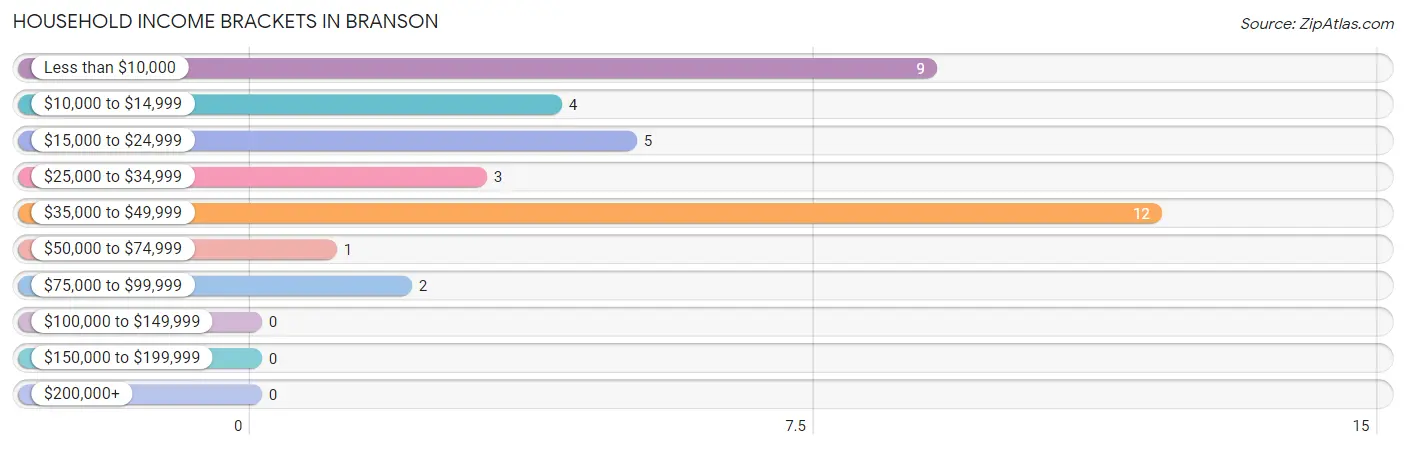
| Income Bracket | # Households | % Households |
| Less than $10,000 | 9 | 25.0% |
| $10,000 to $14,999 | 4 | 11.1% |
| $15,000 to $24,999 | 5 | 13.9% |
| $25,000 to $34,999 | 3 | 8.3% |
| $35,000 to $49,999 | 12 | 33.3% |
| $50,000 to $74,999 | 1 | 2.8% |
| $75,000 to $99,999 | 2 | 5.6% |
| $100,000 to $149,999 | 0 | 0.0% |
| $150,000 to $199,999 | 0 | 0.0% |
| $200,000+ | 0 | 0.0% |
Household Income by Householder Age in Branson
The median household income in Branson is $27,500, with the highest median household income of $27,500 found in the 65+ years age bracket for the primary householder. A total of 14 households (38.9%) fall into this category.
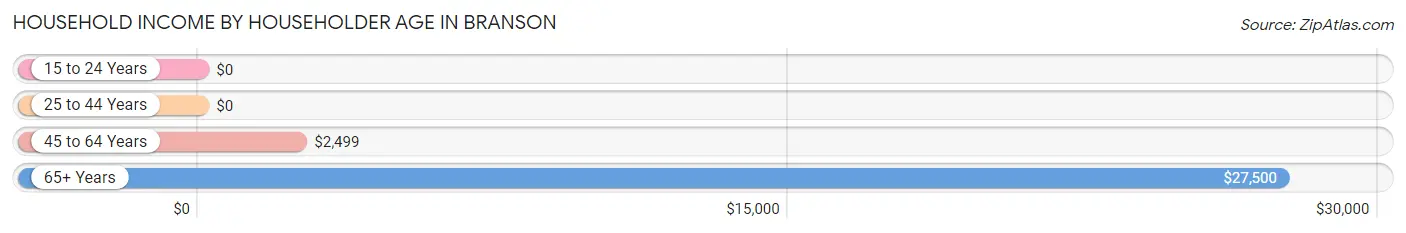
| Income Bracket | # Households | Median Income |
| 15 to 24 Years | 0 (0.0%) | $0 |
| 25 to 44 Years | 7 (19.4%) | $0 |
| 45 to 64 Years | 15 (41.7%) | $2,499 |
| 65+ Years | 14 (38.9%) | $27,500 |
| Total | 36 (100.0%) | $27,500 |
Poverty in Branson
Income Below Poverty by Sex and Age in Branson
With 26.5% poverty level for males and 26.9% for females among the residents of Branson, 55 to 64 year old males and 45 to 54 year old females are the most vulnerable to poverty, with 9 males (64.3%) and 7 females (100.0%) in their respective age groups living below the poverty level.
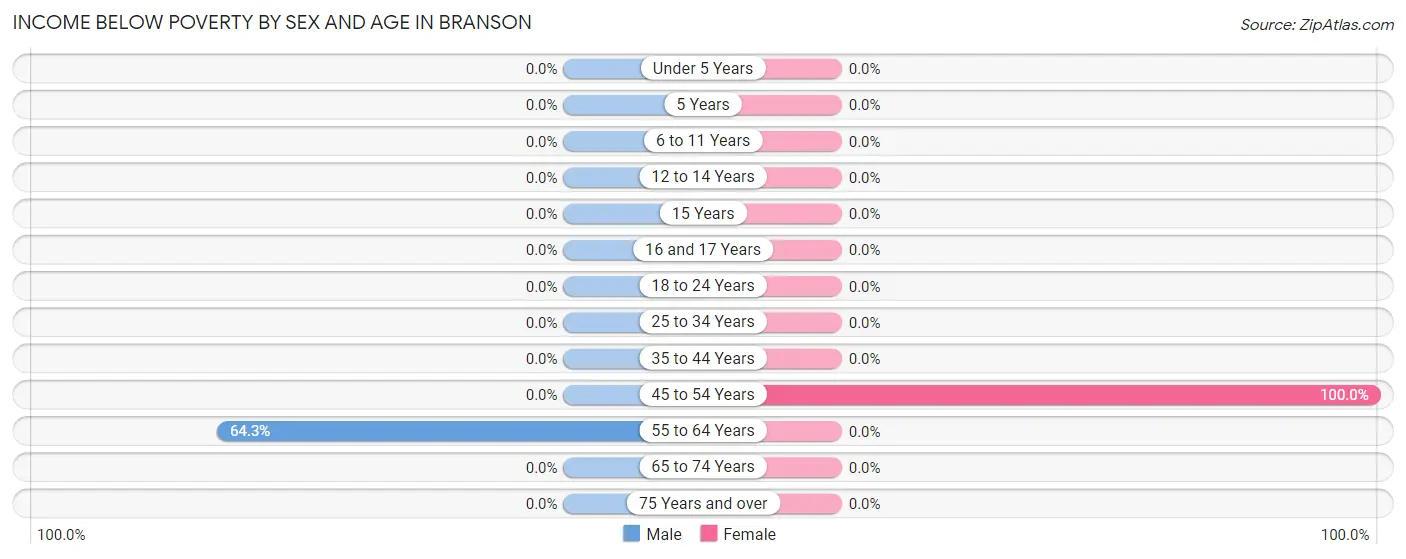
| Age Bracket | Male | Female |
| Under 5 Years | 0 (0.0%) | 0 (0.0%) |
| 5 Years | 0 (0.0%) | 0 (0.0%) |
| 6 to 11 Years | 0 (0.0%) | 0 (0.0%) |
| 12 to 14 Years | 0 (0.0%) | 0 (0.0%) |
| 15 Years | 0 (0.0%) | 0 (0.0%) |
| 16 and 17 Years | 0 (0.0%) | 0 (0.0%) |
| 18 to 24 Years | 0 (0.0%) | 0 (0.0%) |
| 25 to 34 Years | 0 (0.0%) | 0 (0.0%) |
| 35 to 44 Years | 0 (0.0%) | 0 (0.0%) |
| 45 to 54 Years | 0 (0.0%) | 7 (100.0%) |
| 55 to 64 Years | 9 (64.3%) | 0 (0.0%) |
| 65 to 74 Years | 0 (0.0%) | 0 (0.0%) |
| 75 Years and over | 0 (0.0%) | 0 (0.0%) |
| Total | 9 (26.5%) | 7 (26.9%) |
Income Above Poverty by Sex and Age in Branson
According to the poverty statistics in Branson, males aged 6 to 11 years and females aged under 5 years are the age groups that are most secure financially, with 100.0% of males and 100.0% of females in these age groups living above the poverty line.
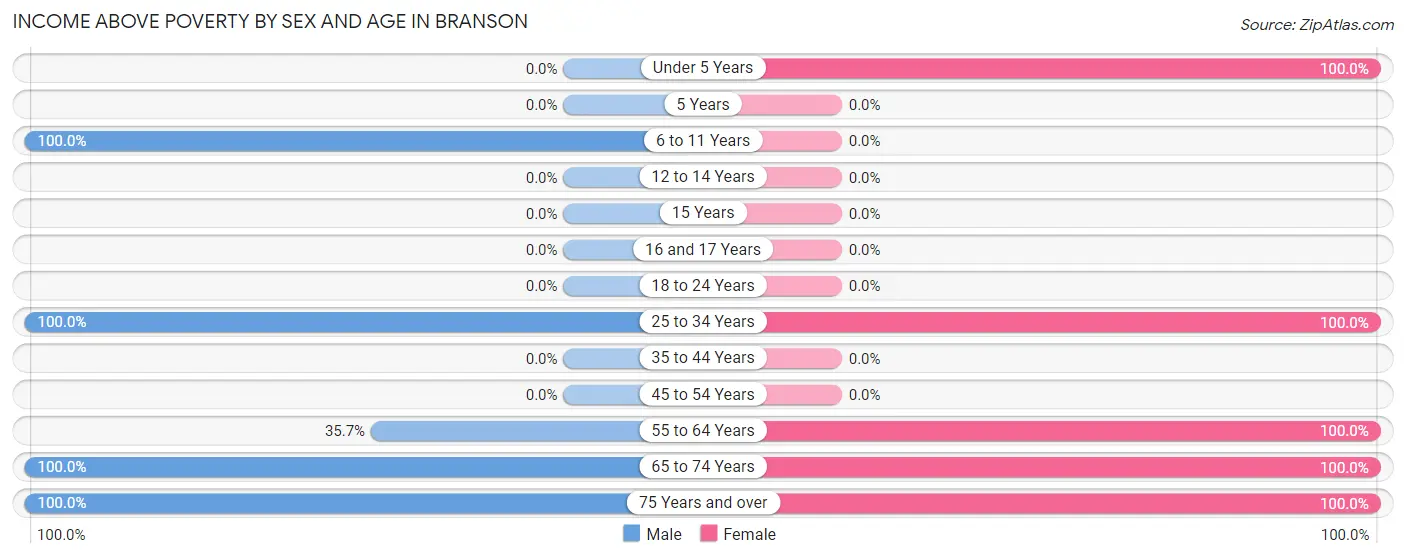
| Age Bracket | Male | Female |
| Under 5 Years | 0 (0.0%) | 5 (100.0%) |
| 5 Years | 0 (0.0%) | 0 (0.0%) |
| 6 to 11 Years | 5 (100.0%) | 0 (0.0%) |
| 12 to 14 Years | 0 (0.0%) | 0 (0.0%) |
| 15 Years | 0 (0.0%) | 0 (0.0%) |
| 16 and 17 Years | 0 (0.0%) | 0 (0.0%) |
| 18 to 24 Years | 0 (0.0%) | 0 (0.0%) |
| 25 to 34 Years | 8 (100.0%) | 1 (100.0%) |
| 35 to 44 Years | 0 (0.0%) | 0 (0.0%) |
| 45 to 54 Years | 0 (0.0%) | 0 (0.0%) |
| 55 to 64 Years | 5 (35.7%) | 2 (100.0%) |
| 65 to 74 Years | 4 (100.0%) | 2 (100.0%) |
| 75 Years and over | 3 (100.0%) | 9 (100.0%) |
| Total | 25 (73.5%) | 19 (73.1%) |
Income Below Poverty Among Married-Couple Families in Branson
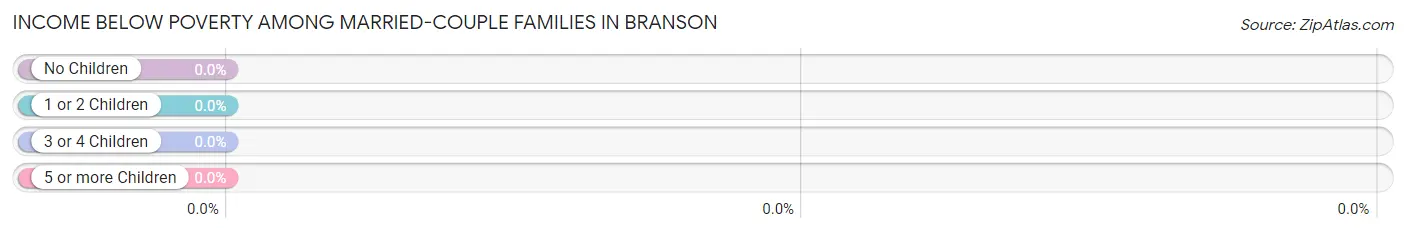
| Children | Above Poverty | Below Poverty |
| No Children | 5 (100.0%) | 0 (0.0%) |
| 1 or 2 Children | 0 (0.0%) | 0 (0.0%) |
| 3 or 4 Children | 1 (100.0%) | 0 (0.0%) |
| 5 or more Children | 0 (0.0%) | 0 (0.0%) |
| Total | 6 (100.0%) | 0 (0.0%) |
Income Below Poverty Among Single-Parent Households in Branson
| Children | Single Father | Single Mother |
| No Children | 0 (0.0%) | 0 (0.0%) |
| 1 or 2 Children | 0 (0.0%) | 0 (0.0%) |
| 3 or 4 Children | 0 (0.0%) | 0 (0.0%) |
| 5 or more Children | 0 (0.0%) | 0 (0.0%) |
| Total | 0 (0.0%) | 0 (0.0%) |
Income Below Poverty Among Married-Couple vs Single-Parent Households in Branson
| Children | Married-Couple Families | Single-Parent Households |
| No Children | 0 (0.0%) | 0 (0.0%) |
| 1 or 2 Children | 0 (0.0%) | 0 (0.0%) |
| 3 or 4 Children | 0 (0.0%) | 0 (0.0%) |
| 5 or more Children | 0 (0.0%) | 0 (0.0%) |
| Total | 0 (0.0%) | 0 (0.0%) |
Race in Branson
The most populous races in Branson are White / Caucasian (47 | 78.3%), Hispanic or Latino (18 | 30.0%), and Two or more Races (13 | 21.7%).
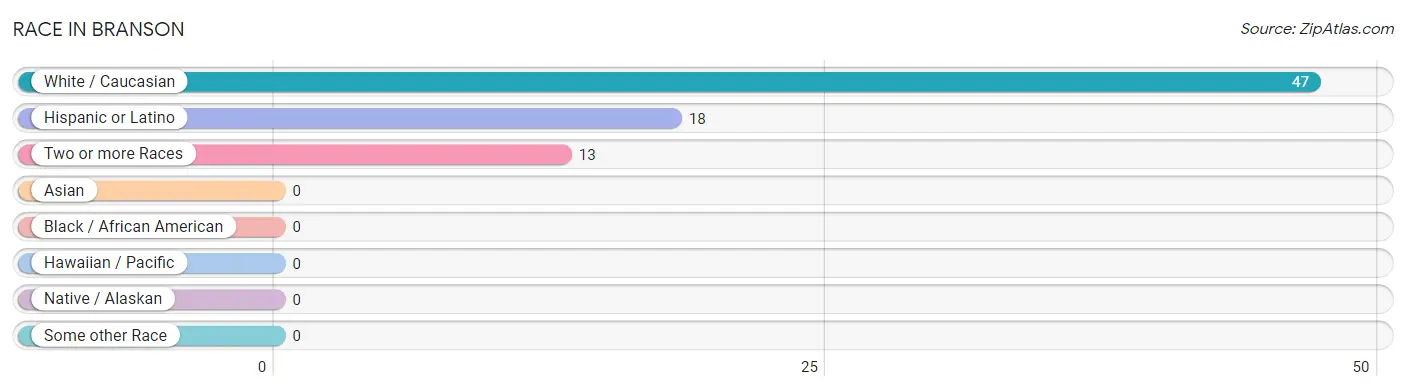
| Race | # Population | % Population |
| Asian | 0 | 0.0% |
| Black / African American | 0 | 0.0% |
| Hawaiian / Pacific | 0 | 0.0% |
| Hispanic or Latino | 18 | 30.0% |
| Native / Alaskan | 0 | 0.0% |
| White / Caucasian | 47 | 78.3% |
| Two or more Races | 13 | 21.7% |
| Some other Race | 0 | 0.0% |
| Total | 60 | 100.0% |
Ancestry in Branson
The most populous ancestries reported in Branson are Spanish (18 | 30.0%), Irish (17 | 28.3%), German (8 | 13.3%), English (6 | 10.0%), and Scottish (3 | 5.0%), together accounting for 86.7% of all Branson residents.
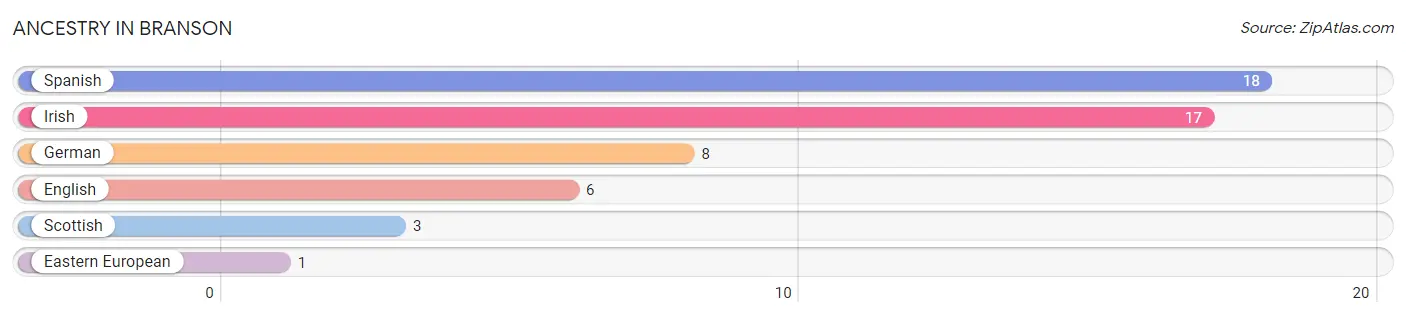
| Ancestry | # Population | % Population |
| Eastern European | 1 | 1.7% |
| English | 6 | 10.0% |
| German | 8 | 13.3% |
| Irish | 17 | 28.3% |
| Scottish | 3 | 5.0% |
| Spanish | 18 | 30.0% | View All 6 Rows |
Immigrants in Branson
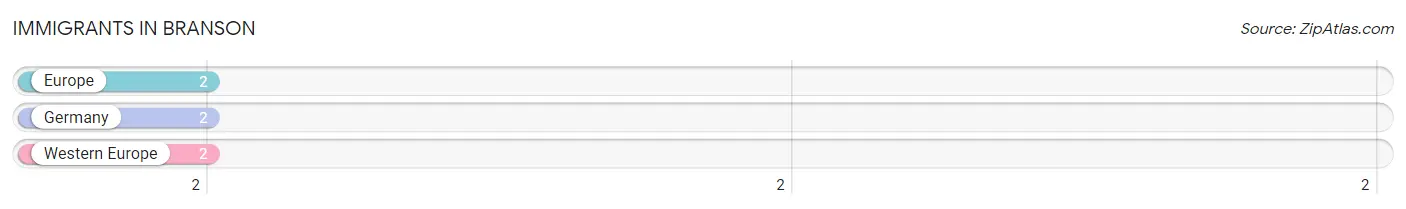
The most numerous immigrant groups reported in Branson came from Europe (2 | 3.3%), Germany (2 | 3.3%), and Western Europe (2 | 3.3%), together accounting for 10.0% of all Branson residents.
| Immigration Origin | # Population | % Population |
| Europe | 2 | 3.3% |
| Germany | 2 | 3.3% |
| Western Europe | 2 | 3.3% | View All 3 Rows |
Sex and Age in Branson
Sex and Age in Branson
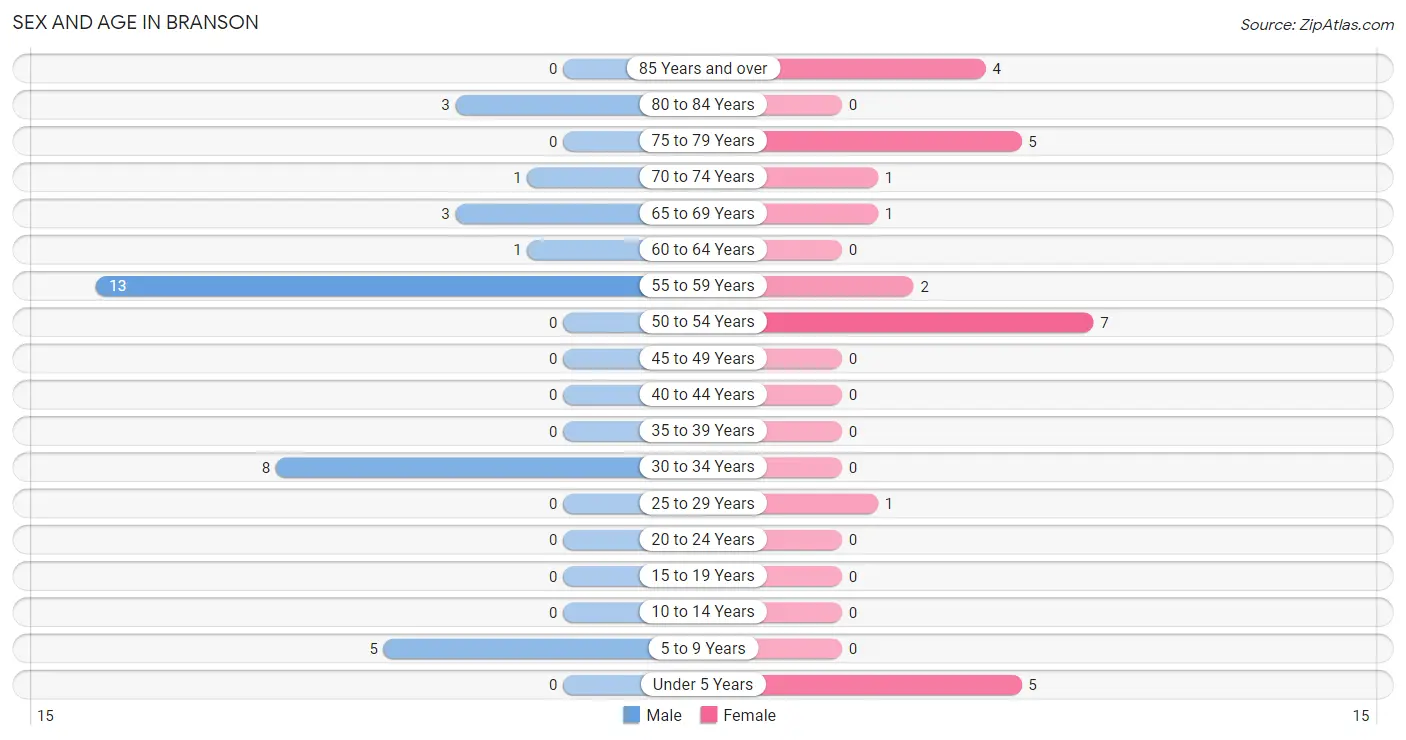
The most populous age groups in Branson are 55 to 59 Years (13 | 38.2%) for men and 50 to 54 Years (7 | 26.9%) for women.
| Age Bracket | Male | Female |
| Under 5 Years | 0 (0.0%) | 5 (19.2%) |
| 5 to 9 Years | 5 (14.7%) | 0 (0.0%) |
| 10 to 14 Years | 0 (0.0%) | 0 (0.0%) |
| 15 to 19 Years | 0 (0.0%) | 0 (0.0%) |
| 20 to 24 Years | 0 (0.0%) | 0 (0.0%) |
| 25 to 29 Years | 0 (0.0%) | 1 (3.8%) |
| 30 to 34 Years | 8 (23.5%) | 0 (0.0%) |
| 35 to 39 Years | 0 (0.0%) | 0 (0.0%) |
| 40 to 44 Years | 0 (0.0%) | 0 (0.0%) |
| 45 to 49 Years | 0 (0.0%) | 0 (0.0%) |
| 50 to 54 Years | 0 (0.0%) | 7 (26.9%) |
| 55 to 59 Years | 13 (38.2%) | 2 (7.7%) |
| 60 to 64 Years | 1 (2.9%) | 0 (0.0%) |
| 65 to 69 Years | 3 (8.8%) | 1 (3.8%) |
| 70 to 74 Years | 1 (2.9%) | 1 (3.8%) |
| 75 to 79 Years | 0 (0.0%) | 5 (19.2%) |
| 80 to 84 Years | 3 (8.8%) | 0 (0.0%) |
| 85 Years and over | 0 (0.0%) | 4 (15.4%) |
| Total | 34 (100.0%) | 26 (100.0%) |
Families and Households in Branson
Median Family Size in Branson
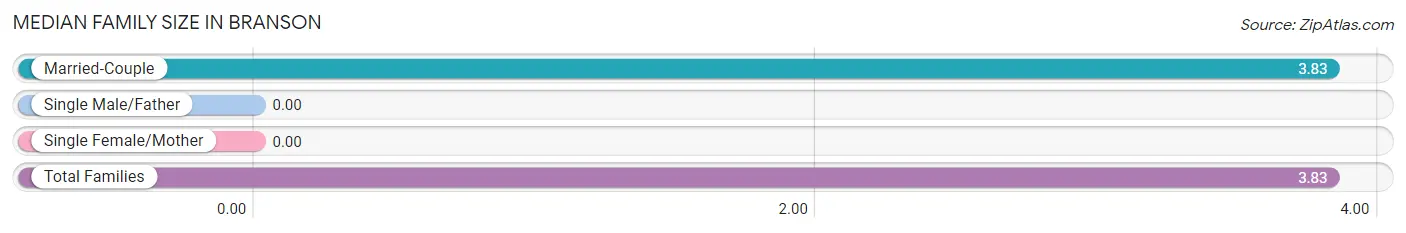
| Family Type | # Families | Family Size |
| Married-Couple | 6 (100.0%) | 3.83 |
| Single Male/Father | 0 (0.0%) | - |
| Single Female/Mother | 0 (0.0%) | - |
| Total Families | 6 (100.0%) | 3.83 |
Median Household Size in Branson
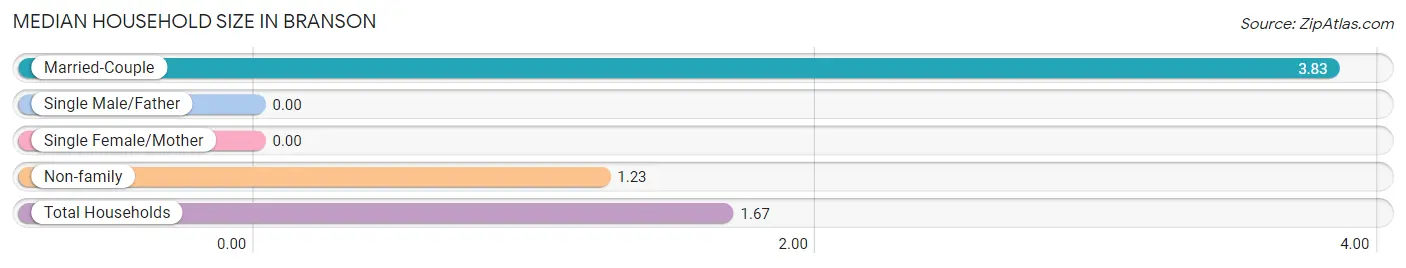
| Household Type | # Households | Household Size |
| Married-Couple | 6 (16.7%) | 3.83 |
| Single Male/Father | 0 (0.0%) | - |
| Single Female/Mother | 0 (0.0%) | - |
| Non-family | 30 (83.3%) | 1.23 |
| Total Households | 36 (100.0%) | 1.67 |
Household Size by Marriage Status in Branson
Out of a total of 36 households in Branson, 6 (16.7%) are family households, while 30 (83.3%) are nonfamily households. The most numerous type of family households are 2-person households, comprising 5, and the most common type of nonfamily households are 1-person households, comprising 26.
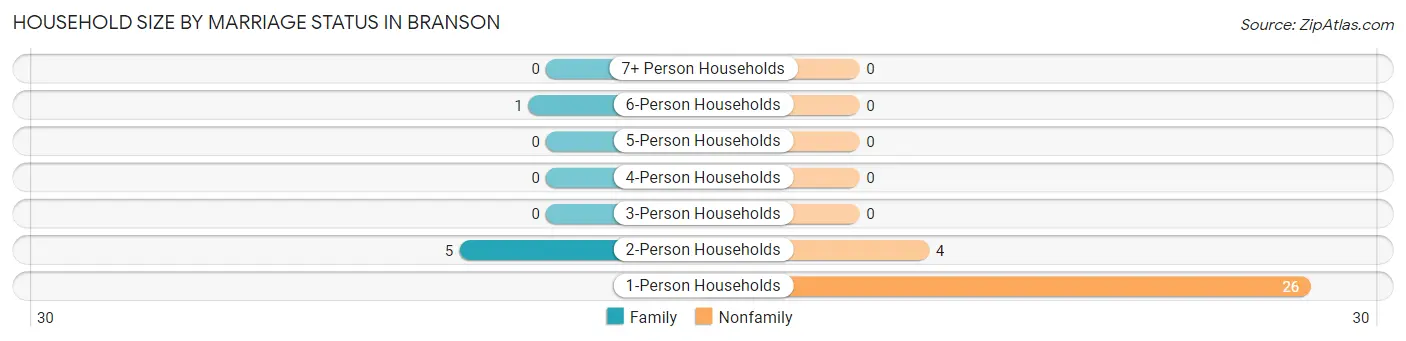
| Household Size | Family Households | Nonfamily Households |
| 1-Person Households | - | 26 (72.2%) |
| 2-Person Households | 5 (13.9%) | 4 (11.1%) |
| 3-Person Households | 0 (0.0%) | 0 (0.0%) |
| 4-Person Households | 0 (0.0%) | 0 (0.0%) |
| 5-Person Households | 0 (0.0%) | 0 (0.0%) |
| 6-Person Households | 1 (2.8%) | 0 (0.0%) |
| 7+ Person Households | 0 (0.0%) | 0 (0.0%) |
| Total | 6 (16.7%) | 30 (83.3%) |
Female Fertility in Branson
Fertility by Age in Branson
| Age Bracket | Women with Births | Births / 1,000 Women |
| 15 to 19 years | 0 (0.0%) | 0.0 |
| 20 to 34 years | 0 (0.0%) | 0.0 |
| 35 to 50 years | 0 (0.0%) | 0.0 |
| Total | 0 (0.0%) | 0.0 |
Fertility by Age by Marriage Status in Branson
| Age Bracket | Married | Unmarried |
| 15 to 19 years | 0 (0.0%) | 0 (0.0%) |
| 20 to 34 years | 0 (0.0%) | 0 (0.0%) |
| 35 to 50 years | 0 (0.0%) | 0 (0.0%) |
| Total | 0 (0.0%) | 0 (0.0%) |
Fertility by Education in Branson
| Educational Attainment | Women with Births | Births / 1,000 Women |
| Less than High School | 0 (0.0%) | 0.0 |
| High School Diploma | 0 (0.0%) | 0.0 |
| College or Associate's Degree | 0 (0.0%) | 0.0 |
| Bachelor's Degree | 0 (0.0%) | 0.0 |
| Graduate Degree | 0 (0.0%) | 0.0 |
| Total | 0 (0.0%) | 0.0 |
Fertility by Education by Marriage Status in Branson
| Educational Attainment | Married | Unmarried |
| Less than High School | 0 (0.0%) | 0 (0.0%) |
| High School Diploma | 0 (0.0%) | 0 (0.0%) |
| College or Associate's Degree | 0 (0.0%) | 0 (0.0%) |
| Bachelor's Degree | 0 (0.0%) | 0 (0.0%) |
| Graduate Degree | 0 (0.0%) | 0 (0.0%) |
| Total | 0 (0.0%) | 0 (0.0%) |
Employment Characteristics in Branson
Employment by Class of Employer in Branson
Among the 12 employed individuals in Branson, private company employees (8 | 66.7%), and local government employees (4 | 33.3%) make up the most common classes of employment.
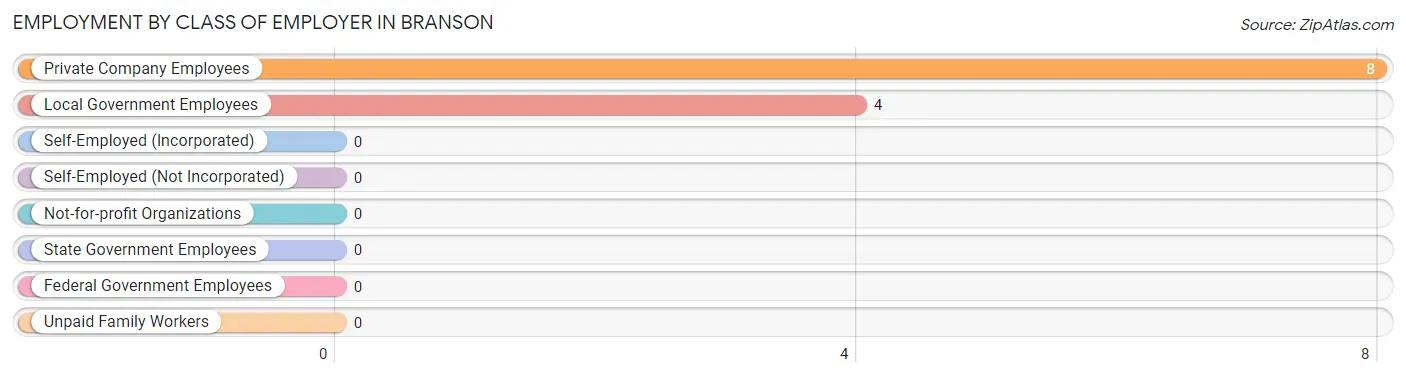
| Employer Class | # Employees | % Employees |
| Private Company Employees | 8 | 66.7% |
| Self-Employed (Incorporated) | 0 | 0.0% |
| Self-Employed (Not Incorporated) | 0 | 0.0% |
| Not-for-profit Organizations | 0 | 0.0% |
| Local Government Employees | 4 | 33.3% |
| State Government Employees | 0 | 0.0% |
| Federal Government Employees | 0 | 0.0% |
| Unpaid Family Workers | 0 | 0.0% |
| Total | 12 | 100.0% |
Employment Status by Age in Branson
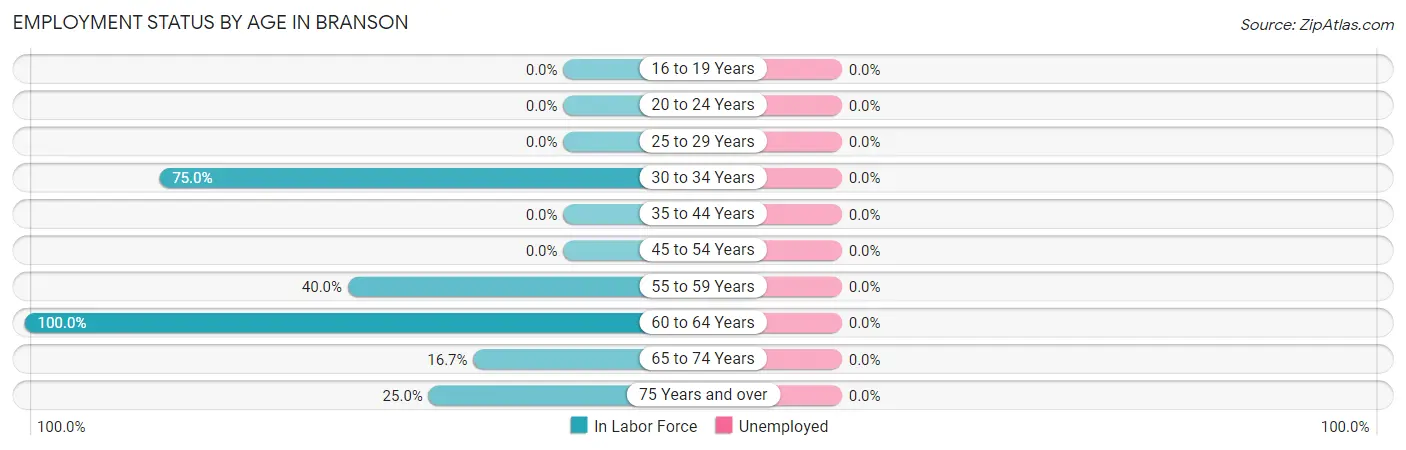
| Age Bracket | In Labor Force | Unemployed |
| 16 to 19 Years | 0 (0.0%) | 0 (0.0%) |
| 20 to 24 Years | 0 (0.0%) | 0 (0.0%) |
| 25 to 29 Years | 0 (0.0%) | 0 (0.0%) |
| 30 to 34 Years | 6 (75.0%) | 0 (0.0%) |
| 35 to 44 Years | 0 (0.0%) | 0 (0.0%) |
| 45 to 54 Years | 0 (0.0%) | 0 (0.0%) |
| 55 to 59 Years | 6 (40.0%) | 0 (0.0%) |
| 60 to 64 Years | 1 (100.0%) | 0 (0.0%) |
| 65 to 74 Years | 1 (16.7%) | 0 (0.0%) |
| 75 Years and over | 3 (25.0%) | 0 (0.0%) |
| Total | 17 (34.0%) | 0 (0.0%) |
Employment Status by Educational Attainment in Branson
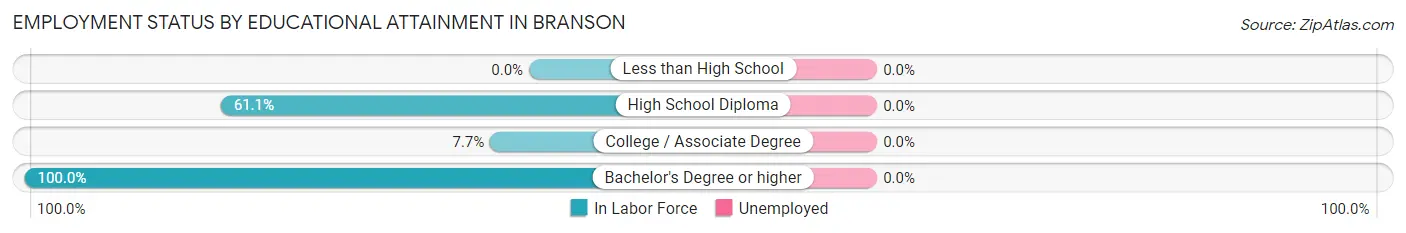
| Educational Attainment | In Labor Force | Unemployed |
| Less than High School | 0 (0.0%) | 0 (0.0%) |
| High School Diploma | 11 (61.1%) | 0 (0.0%) |
| College / Associate Degree | 1 (7.7%) | 0 (0.0%) |
| Bachelor's Degree or higher | 1 (100.0%) | 0 (0.0%) |
| Total | 13 (40.6%) | 0 (0.0%) |
Employment Occupations by Sex in Branson
Management, Business, Science and Arts Occupations
The most common Management, Business, Science and Arts occupations in Branson are Health Diagnosing & Treating (1 | 5.9%), and Health Technologists (1 | 5.9%).
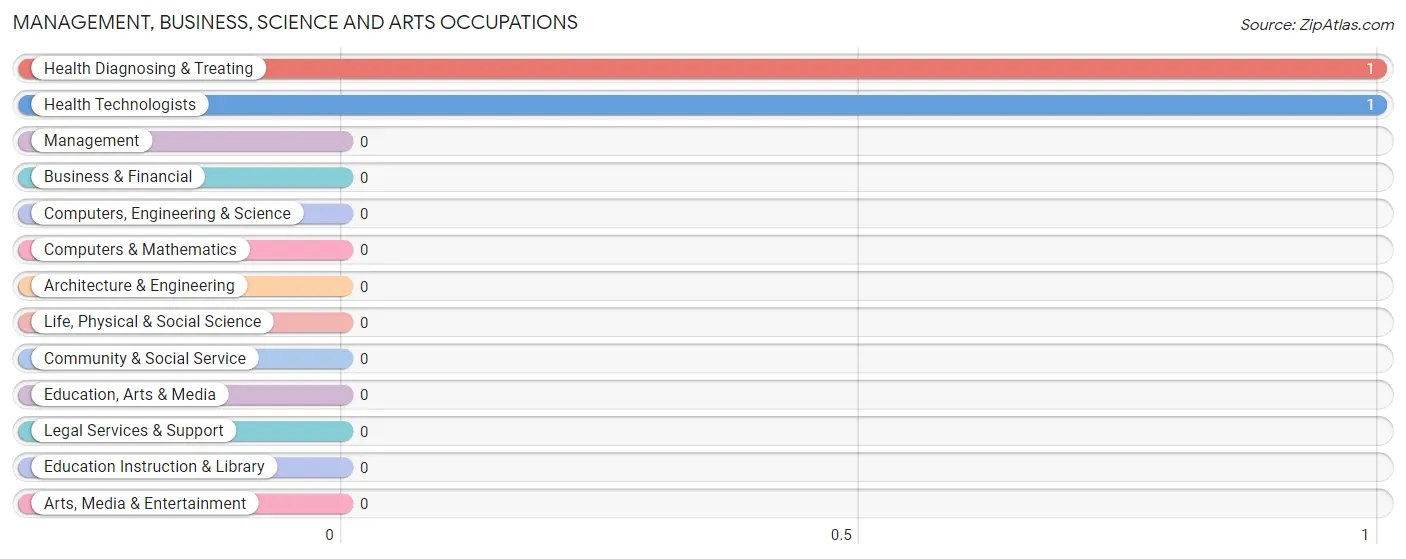
Management, Business, Science and Arts Occupations by Sex
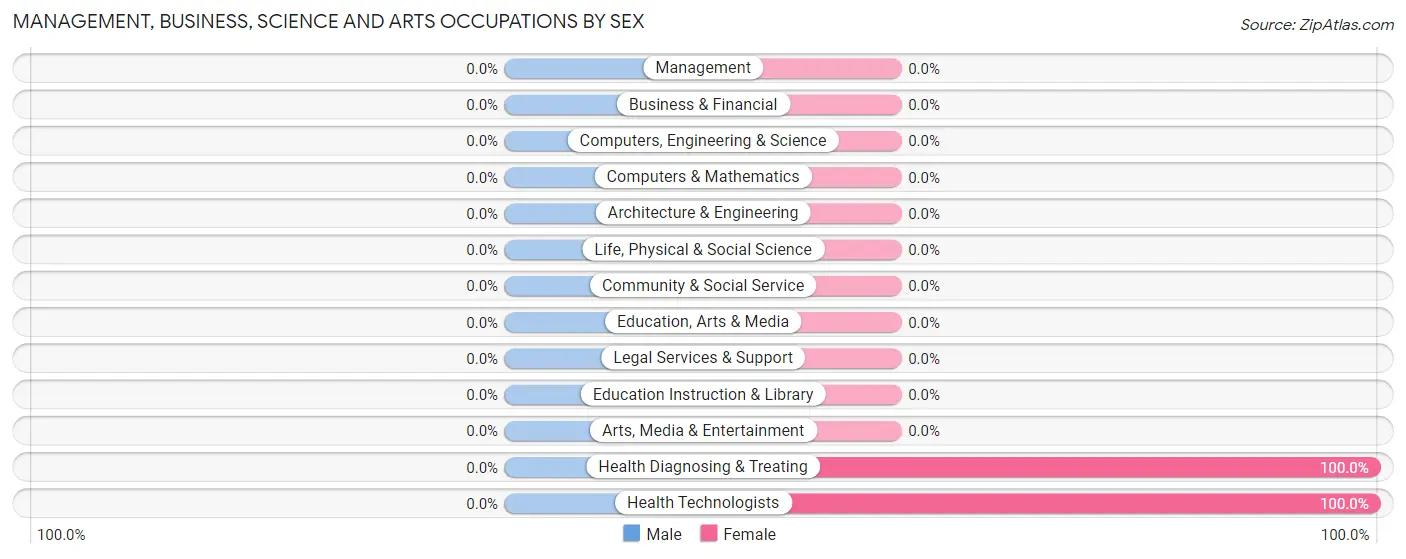
| Occupation | Male | Female |
| Management | 0 (0.0%) | 0 (0.0%) |
| Business & Financial | 0 (0.0%) | 0 (0.0%) |
| Computers, Engineering & Science | 0 (0.0%) | 0 (0.0%) |
| Computers & Mathematics | 0 (0.0%) | 0 (0.0%) |
| Architecture & Engineering | 0 (0.0%) | 0 (0.0%) |
| Life, Physical & Social Science | 0 (0.0%) | 0 (0.0%) |
| Community & Social Service | 0 (0.0%) | 0 (0.0%) |
| Education, Arts & Media | 0 (0.0%) | 0 (0.0%) |
| Legal Services & Support | 0 (0.0%) | 0 (0.0%) |
| Education Instruction & Library | 0 (0.0%) | 0 (0.0%) |
| Arts, Media & Entertainment | 0 (0.0%) | 0 (0.0%) |
| Health Diagnosing & Treating | 0 (0.0%) | 1 (100.0%) |
| Health Technologists | 0 (0.0%) | 1 (100.0%) |
| Total (Category) | 0 (0.0%) | 1 (100.0%) |
| Total (Overall) | 11 (64.7%) | 6 (35.3%) |
Services Occupations
The most common Services occupations in Branson are , and Personal Care & Service (5 | 29.4%).
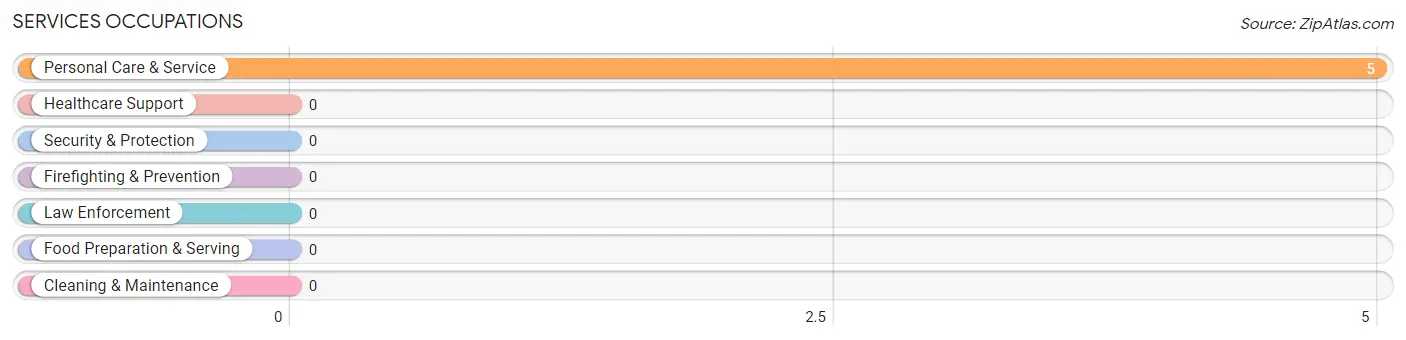
Services Occupations by Sex
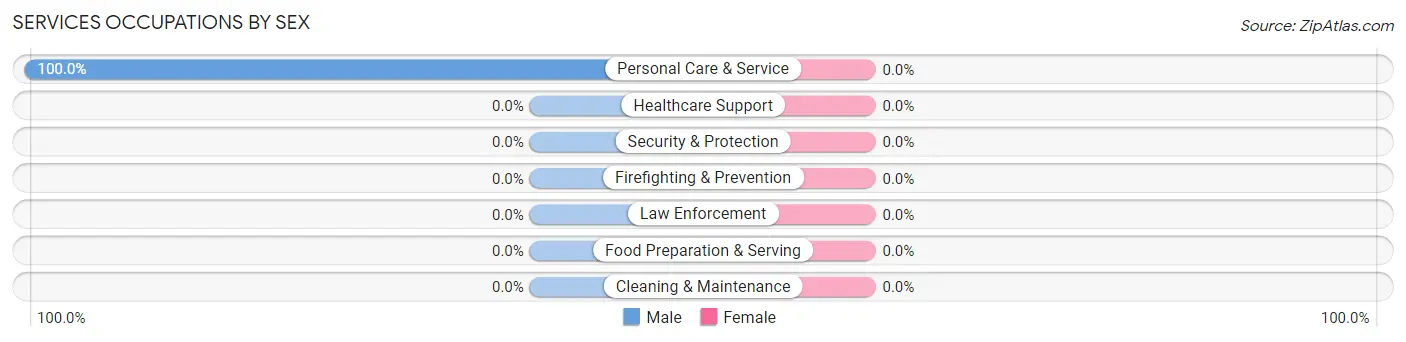
| Occupation | Male | Female |
| Healthcare Support | 0 (0.0%) | 0 (0.0%) |
| Security & Protection | 0 (0.0%) | 0 (0.0%) |
| Firefighting & Prevention | 0 (0.0%) | 0 (0.0%) |
| Law Enforcement | 0 (0.0%) | 0 (0.0%) |
| Food Preparation & Serving | 0 (0.0%) | 0 (0.0%) |
| Cleaning & Maintenance | 0 (0.0%) | 0 (0.0%) |
| Personal Care & Service | 5 (100.0%) | 0 (0.0%) |
| Total (Category) | 5 (100.0%) | 0 (0.0%) |
| Total (Overall) | 11 (64.7%) | 6 (35.3%) |
Sales and Office Occupations
The most common Sales and Office occupations in Branson are , and Office & Administration (3 | 17.6%).
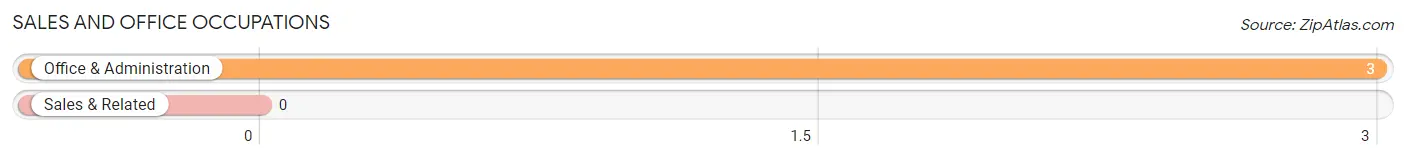
Sales and Office Occupations by Sex
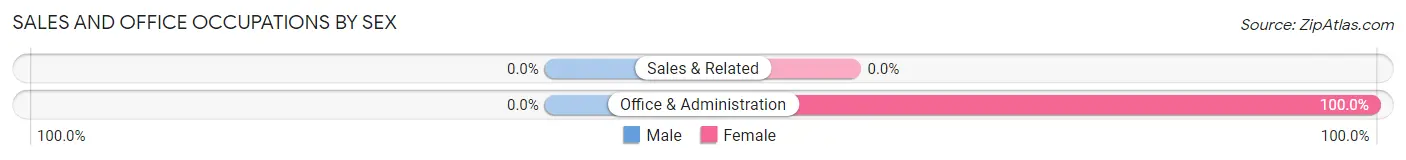
| Occupation | Male | Female |
| Sales & Related | 0 (0.0%) | 0 (0.0%) |
| Office & Administration | 0 (0.0%) | 3 (100.0%) |
| Total (Category) | 0 (0.0%) | 3 (100.0%) |
| Total (Overall) | 11 (64.7%) | 6 (35.3%) |
Natural Resources, Construction and Maintenance Occupations
The most common Natural Resources, Construction and Maintenance occupations in Branson are , and Construction & Extraction (6 | 35.3%).
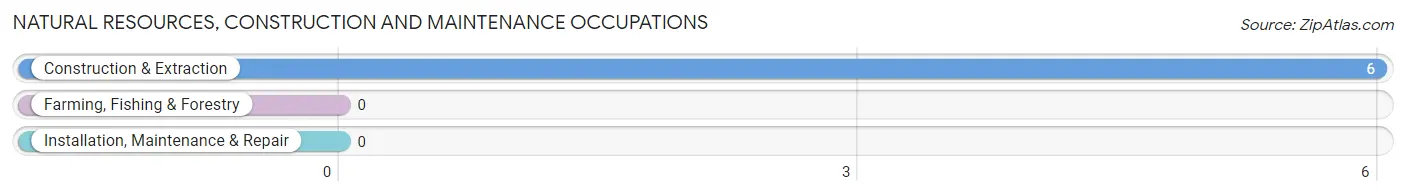
Natural Resources, Construction and Maintenance Occupations by Sex
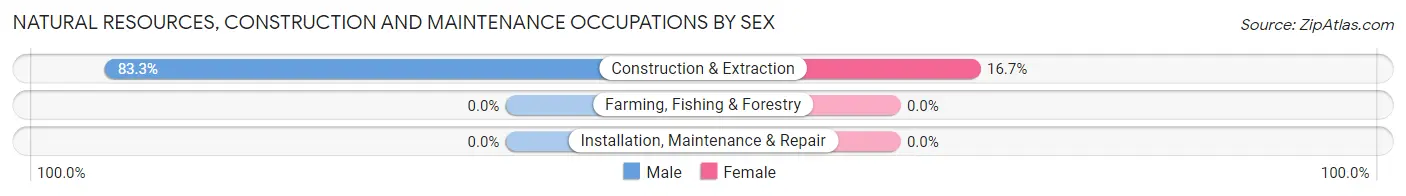
| Occupation | Male | Female |
| Farming, Fishing & Forestry | 0 (0.0%) | 0 (0.0%) |
| Construction & Extraction | 5 (83.3%) | 1 (16.7%) |
| Installation, Maintenance & Repair | 0 (0.0%) | 0 (0.0%) |
| Total (Category) | 5 (83.3%) | 1 (16.7%) |
| Total (Overall) | 11 (64.7%) | 6 (35.3%) |
Production, Transportation and Moving Occupations
The most common Production, Transportation and Moving occupations in Branson are Production (1 | 5.9%), and Transportation (1 | 5.9%).
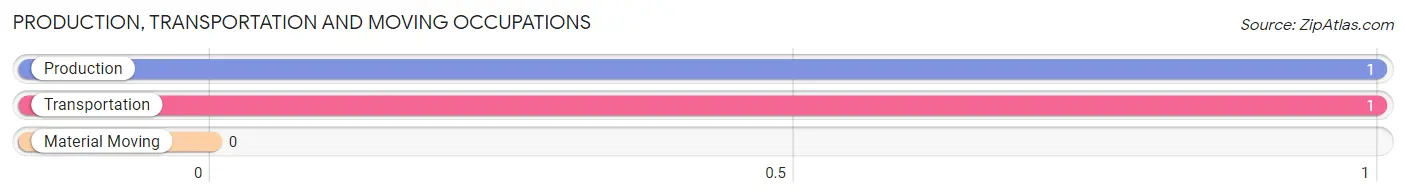
Production, Transportation and Moving Occupations by Sex
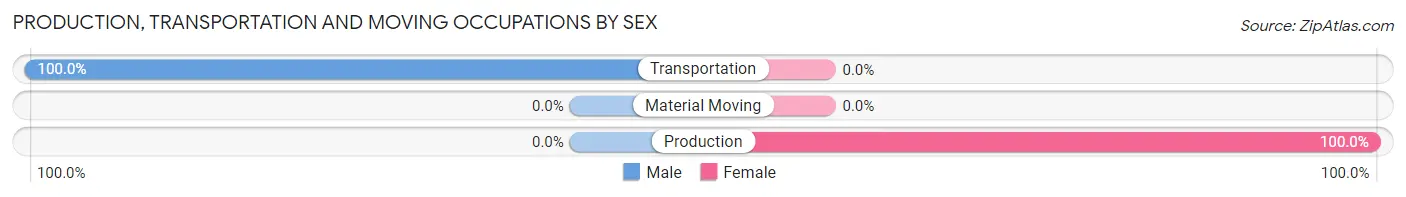
| Occupation | Male | Female |
| Production | 0 (0.0%) | 1 (100.0%) |
| Transportation | 1 (100.0%) | 0 (0.0%) |
| Material Moving | 0 (0.0%) | 0 (0.0%) |
| Total (Category) | 1 (50.0%) | 1 (50.0%) |
| Total (Overall) | 11 (64.7%) | 6 (35.3%) |
Employment Industries by Sex in Branson
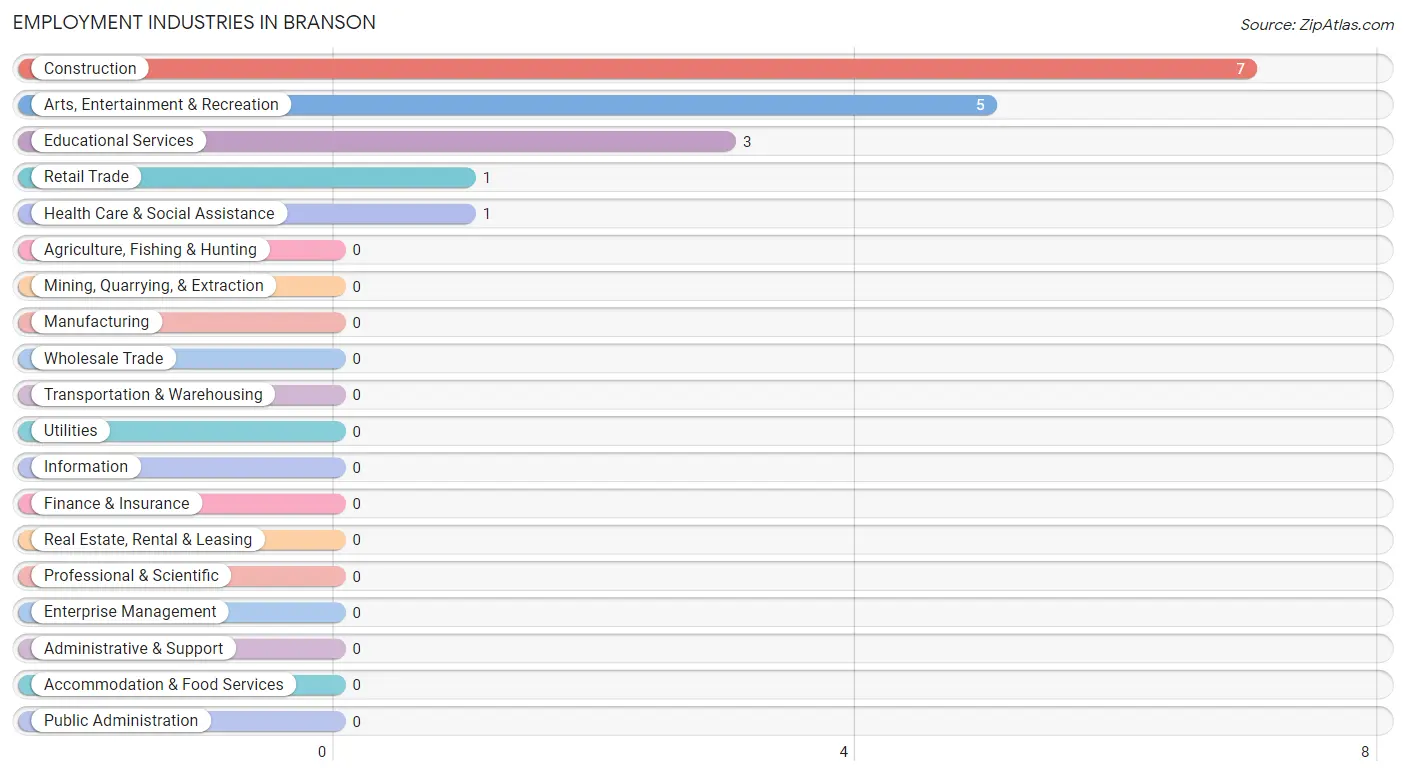
Employment Industries in Branson
The major employment industries in Branson include Construction (7 | 41.2%), Arts, Entertainment & Recreation (5 | 29.4%), Educational Services (3 | 17.6%), Retail Trade (1 | 5.9%), and Health Care & Social Assistance (1 | 5.9%).
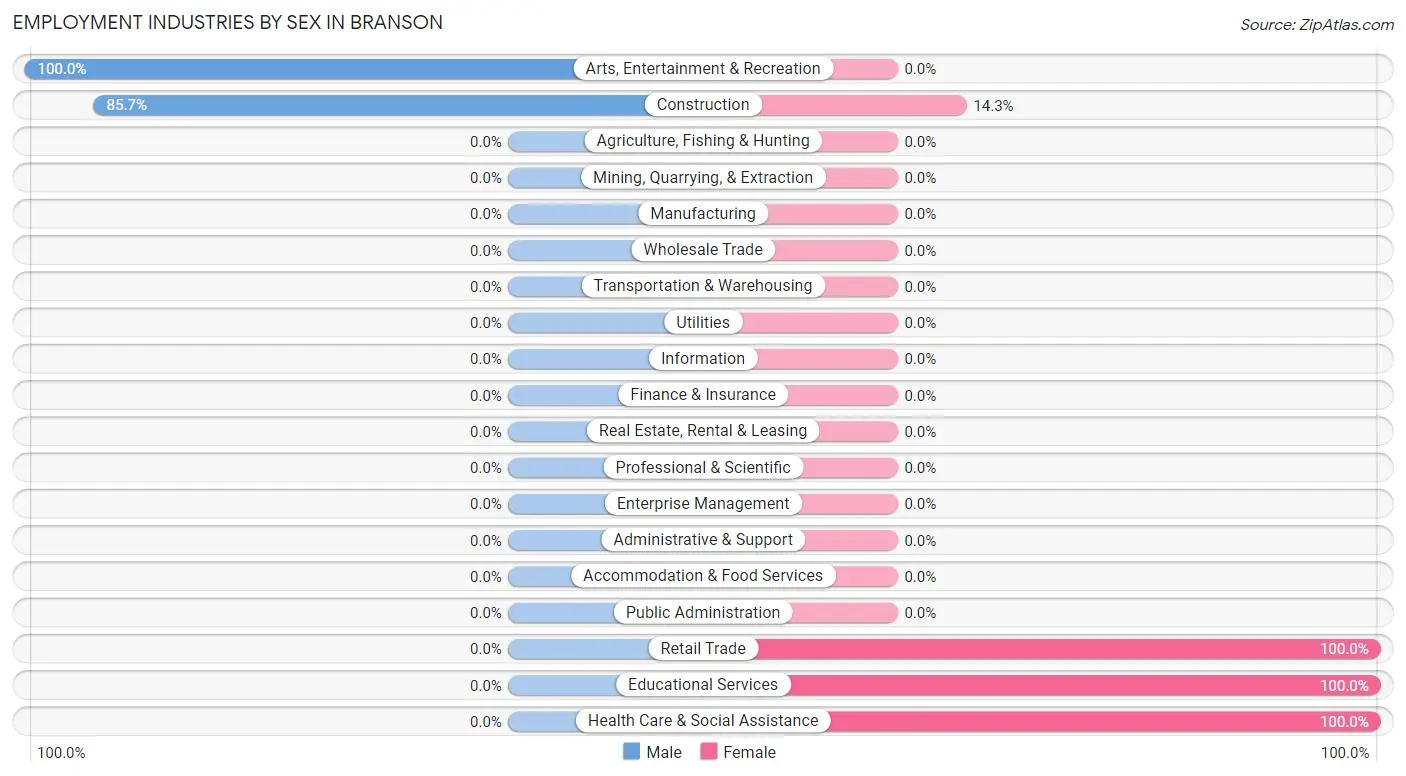
Employment Industries by Sex in Branson
The Branson industries that see more men than women are Arts, Entertainment & Recreation (100.0%), and Construction (85.7%), whereas the industries that tend to have a higher number of women are Retail Trade (100.0%), Educational Services (100.0%), and Health Care & Social Assistance (100.0%).
| Industry | Male | Female |
| Agriculture, Fishing & Hunting | 0 (0.0%) | 0 (0.0%) |
| Mining, Quarrying, & Extraction | 0 (0.0%) | 0 (0.0%) |
| Construction | 6 (85.7%) | 1 (14.3%) |
| Manufacturing | 0 (0.0%) | 0 (0.0%) |
| Wholesale Trade | 0 (0.0%) | 0 (0.0%) |
| Retail Trade | 0 (0.0%) | 1 (100.0%) |
| Transportation & Warehousing | 0 (0.0%) | 0 (0.0%) |
| Utilities | 0 (0.0%) | 0 (0.0%) |
| Information | 0 (0.0%) | 0 (0.0%) |
| Finance & Insurance | 0 (0.0%) | 0 (0.0%) |
| Real Estate, Rental & Leasing | 0 (0.0%) | 0 (0.0%) |
| Professional & Scientific | 0 (0.0%) | 0 (0.0%) |
| Enterprise Management | 0 (0.0%) | 0 (0.0%) |
| Administrative & Support | 0 (0.0%) | 0 (0.0%) |
| Educational Services | 0 (0.0%) | 3 (100.0%) |
| Health Care & Social Assistance | 0 (0.0%) | 1 (100.0%) |
| Arts, Entertainment & Recreation | 5 (100.0%) | 0 (0.0%) |
| Accommodation & Food Services | 0 (0.0%) | 0 (0.0%) |
| Public Administration | 0 (0.0%) | 0 (0.0%) |
| Total | 11 (64.7%) | 6 (35.3%) |
Education in Branson
School Enrollment in Branson
The most common levels of schooling among the 6 students in Branson are elementary school (5 | 83.3%), and college / undergraduate (1 | 16.7%).
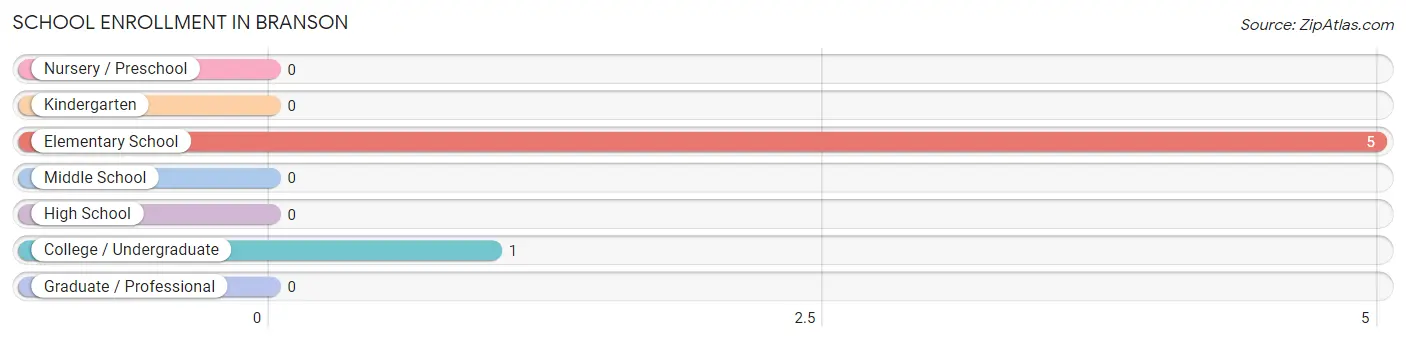
| School Level | # Students | % Students |
| Nursery / Preschool | 0 | 0.0% |
| Kindergarten | 0 | 0.0% |
| Elementary School | 5 | 83.3% |
| Middle School | 0 | 0.0% |
| High School | 0 | 0.0% |
| College / Undergraduate | 1 | 16.7% |
| Graduate / Professional | 0 | 0.0% |
| Total | 6 | 100.0% |
School Enrollment by Age by Funding Source in Branson
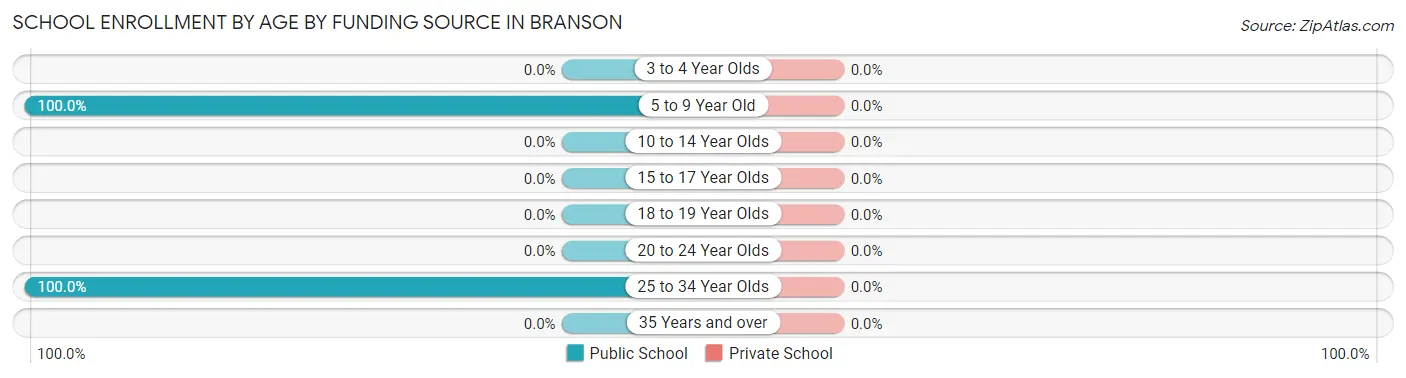
| Age Bracket | Public School | Private School |
| 3 to 4 Year Olds | 0 (0.0%) | 0 (0.0%) |
| 5 to 9 Year Old | 5 (100.0%) | 0 (0.0%) |
| 10 to 14 Year Olds | 0 (0.0%) | 0 (0.0%) |
| 15 to 17 Year Olds | 0 (0.0%) | 0 (0.0%) |
| 18 to 19 Year Olds | 0 (0.0%) | 0 (0.0%) |
| 20 to 24 Year Olds | 0 (0.0%) | 0 (0.0%) |
| 25 to 34 Year Olds | 1 (100.0%) | 0 (0.0%) |
| 35 Years and over | 0 (0.0%) | 0 (0.0%) |
| Total | 6 (100.0%) | 0 (0.0%) |
Educational Attainment by Field of Study in Branson
Education (3 | 30.0%), literature & languages (3 | 30.0%), liberal arts & history (3 | 30.0%), and communications (1 | 10.0%) are the most common fields of study among 10 individuals in Branson who have obtained a bachelor's degree or higher.
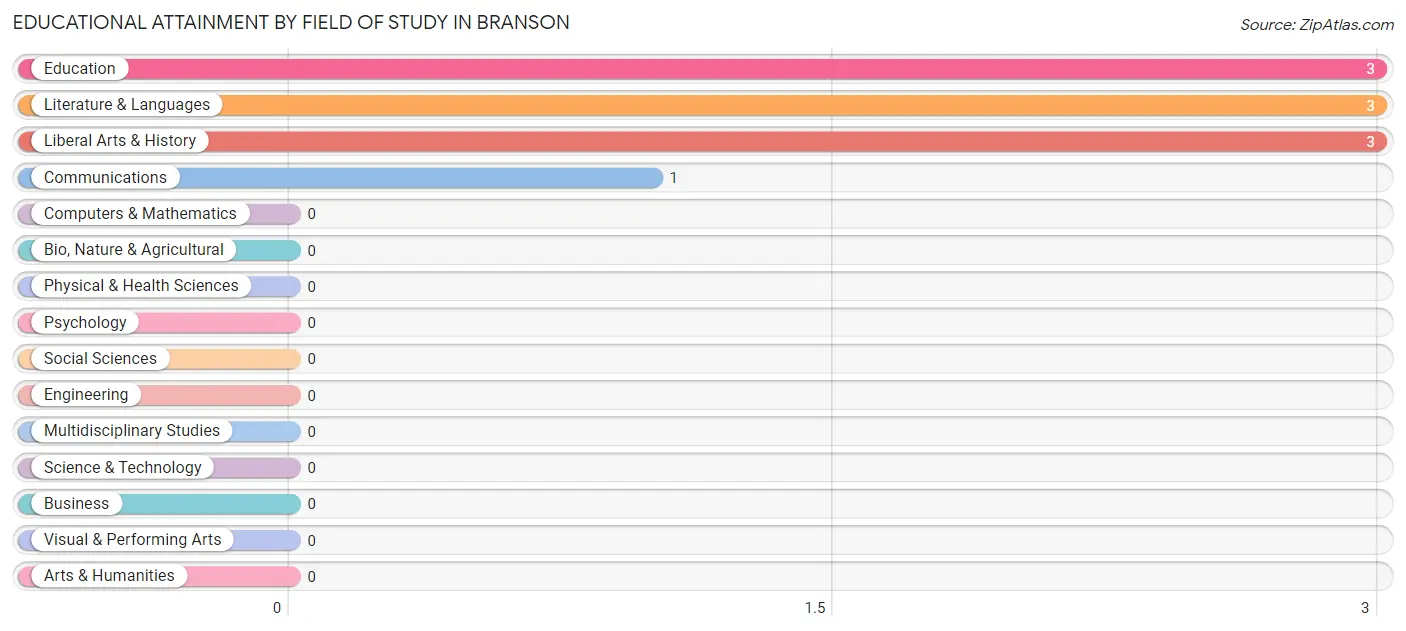
| Field of Study | # Graduates | % Graduates |
| Computers & Mathematics | 0 | 0.0% |
| Bio, Nature & Agricultural | 0 | 0.0% |
| Physical & Health Sciences | 0 | 0.0% |
| Psychology | 0 | 0.0% |
| Social Sciences | 0 | 0.0% |
| Engineering | 0 | 0.0% |
| Multidisciplinary Studies | 0 | 0.0% |
| Science & Technology | 0 | 0.0% |
| Business | 0 | 0.0% |
| Education | 3 | 30.0% |
| Literature & Languages | 3 | 30.0% |
| Liberal Arts & History | 3 | 30.0% |
| Visual & Performing Arts | 0 | 0.0% |
| Communications | 1 | 10.0% |
| Arts & Humanities | 0 | 0.0% |
| Total | 10 | 100.0% |
Transportation & Commute in Branson
Vehicle Availability by Sex in Branson
The most prevalent vehicle ownership categories in Branson are males with 1 vehicle (4, accounting for 66.7%) and females with 1 vehicle (3, making up 66.7%).
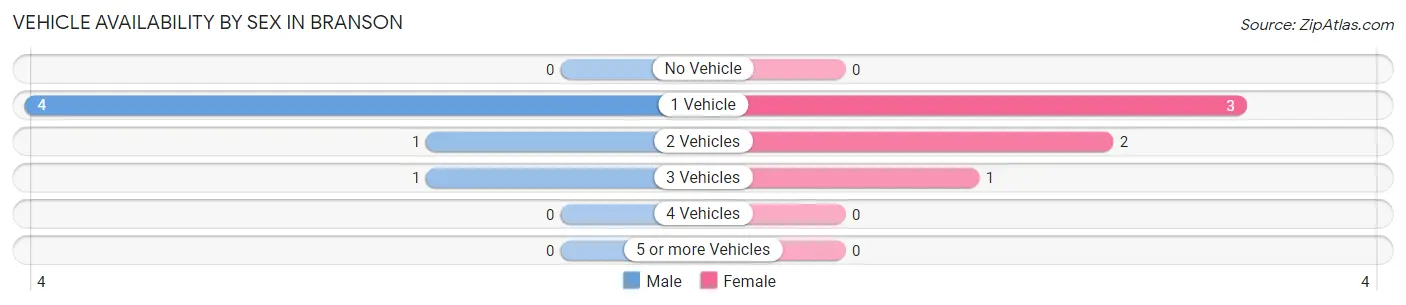
| Vehicles Available | Male | Female |
| No Vehicle | 0 (0.0%) | 0 (0.0%) |
| 1 Vehicle | 4 (66.7%) | 3 (50.0%) |
| 2 Vehicles | 1 (16.7%) | 2 (33.3%) |
| 3 Vehicles | 1 (16.7%) | 1 (16.7%) |
| 4 Vehicles | 0 (0.0%) | 0 (0.0%) |
| 5 or more Vehicles | 0 (0.0%) | 0 (0.0%) |
| Total | 6 (100.0%) | 6 (100.0%) |
Commute Time in Branson
The most frequently occuring commute durations in Branson are 10 to 14 minutes (4 commuters, 36.4%), 5 to 9 minutes (3 commuters, 27.3%), and less than 5 minutes (1 commuters, 9.1%).
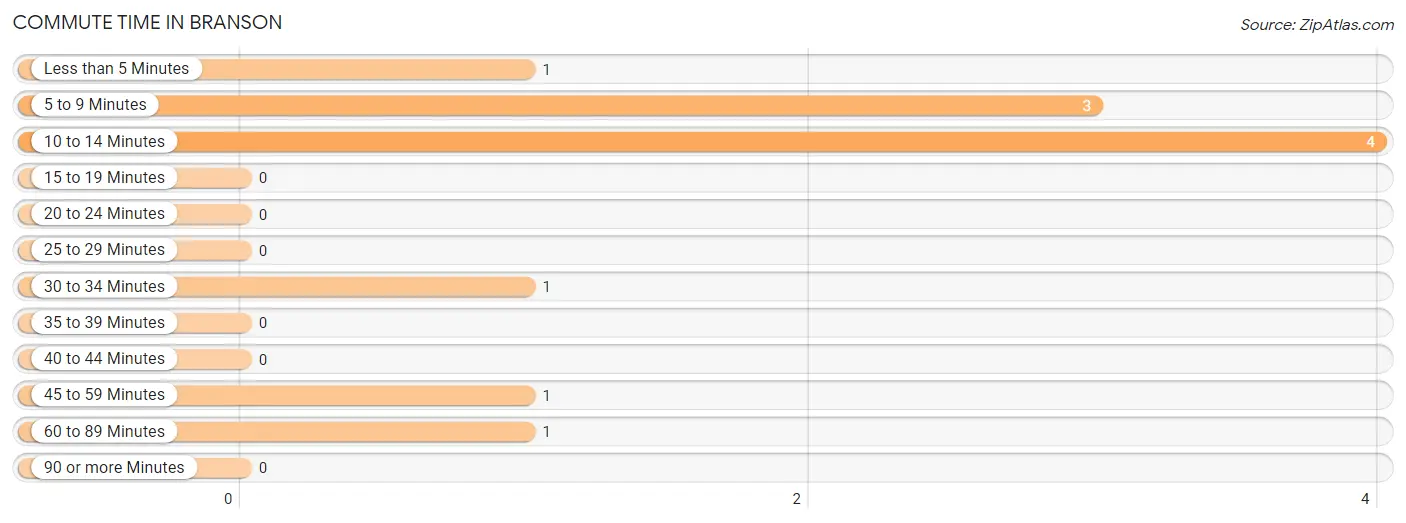
| Commute Time | # Commuters | % Commuters |
| Less than 5 Minutes | 1 | 9.1% |
| 5 to 9 Minutes | 3 | 27.3% |
| 10 to 14 Minutes | 4 | 36.4% |
| 15 to 19 Minutes | 0 | 0.0% |
| 20 to 24 Minutes | 0 | 0.0% |
| 25 to 29 Minutes | 0 | 0.0% |
| 30 to 34 Minutes | 1 | 9.1% |
| 35 to 39 Minutes | 0 | 0.0% |
| 40 to 44 Minutes | 0 | 0.0% |
| 45 to 59 Minutes | 1 | 9.1% |
| 60 to 89 Minutes | 1 | 9.1% |
| 90 or more Minutes | 0 | 0.0% |
Commute Time by Sex in Branson
The most common commute times in Branson are 10 to 14 minutes (4 commuters, 66.7%) for males and 5 to 9 minutes (3 commuters, 60.0%) for females.
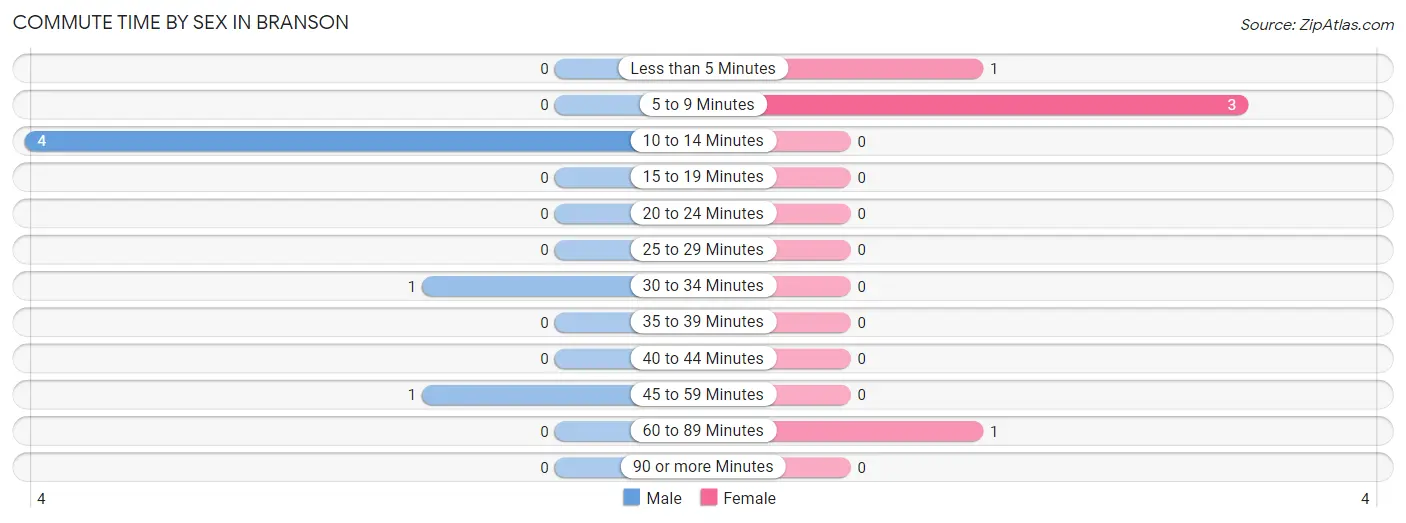
| Commute Time | Male | Female |
| Less than 5 Minutes | 0 (0.0%) | 1 (20.0%) |
| 5 to 9 Minutes | 0 (0.0%) | 3 (60.0%) |
| 10 to 14 Minutes | 4 (66.7%) | 0 (0.0%) |
| 15 to 19 Minutes | 0 (0.0%) | 0 (0.0%) |
| 20 to 24 Minutes | 0 (0.0%) | 0 (0.0%) |
| 25 to 29 Minutes | 0 (0.0%) | 0 (0.0%) |
| 30 to 34 Minutes | 1 (16.7%) | 0 (0.0%) |
| 35 to 39 Minutes | 0 (0.0%) | 0 (0.0%) |
| 40 to 44 Minutes | 0 (0.0%) | 0 (0.0%) |
| 45 to 59 Minutes | 1 (16.7%) | 0 (0.0%) |
| 60 to 89 Minutes | 0 (0.0%) | 1 (20.0%) |
| 90 or more Minutes | 0 (0.0%) | 0 (0.0%) |
Time of Departure to Work by Sex in Branson
The most frequent times of departure to work in Branson are 8:00 AM to 8:29 AM (4, 66.7%) for males and 10:00 AM to 10:59 AM (3, 60.0%) for females.
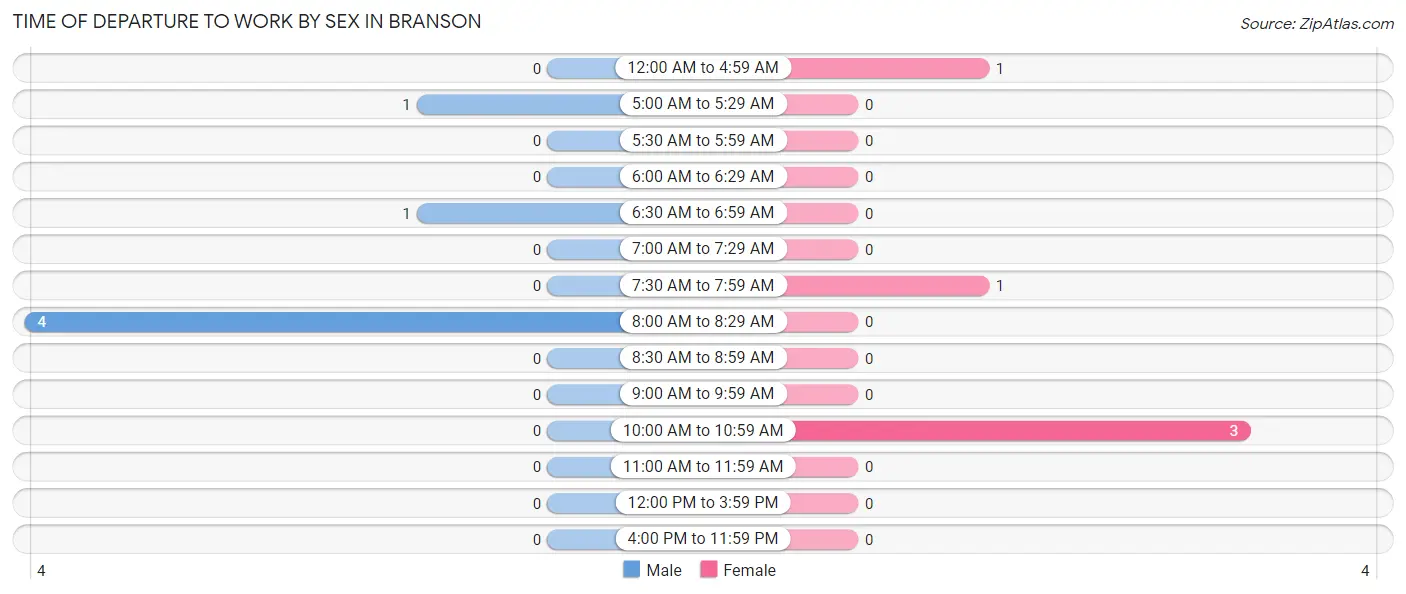
| Time of Departure | Male | Female |
| 12:00 AM to 4:59 AM | 0 (0.0%) | 1 (20.0%) |
| 5:00 AM to 5:29 AM | 1 (16.7%) | 0 (0.0%) |
| 5:30 AM to 5:59 AM | 0 (0.0%) | 0 (0.0%) |
| 6:00 AM to 6:29 AM | 0 (0.0%) | 0 (0.0%) |
| 6:30 AM to 6:59 AM | 1 (16.7%) | 0 (0.0%) |
| 7:00 AM to 7:29 AM | 0 (0.0%) | 0 (0.0%) |
| 7:30 AM to 7:59 AM | 0 (0.0%) | 1 (20.0%) |
| 8:00 AM to 8:29 AM | 4 (66.7%) | 0 (0.0%) |
| 8:30 AM to 8:59 AM | 0 (0.0%) | 0 (0.0%) |
| 9:00 AM to 9:59 AM | 0 (0.0%) | 0 (0.0%) |
| 10:00 AM to 10:59 AM | 0 (0.0%) | 3 (60.0%) |
| 11:00 AM to 11:59 AM | 0 (0.0%) | 0 (0.0%) |
| 12:00 PM to 3:59 PM | 0 (0.0%) | 0 (0.0%) |
| 4:00 PM to 11:59 PM | 0 (0.0%) | 0 (0.0%) |
| Total | 6 (100.0%) | 5 (100.0%) |
Housing Occupancy in Branson
Occupancy by Ownership in Branson
Of the total 36 dwellings in Branson, owner-occupied units account for 28 (77.8%), while renter-occupied units make up 8 (22.2%).
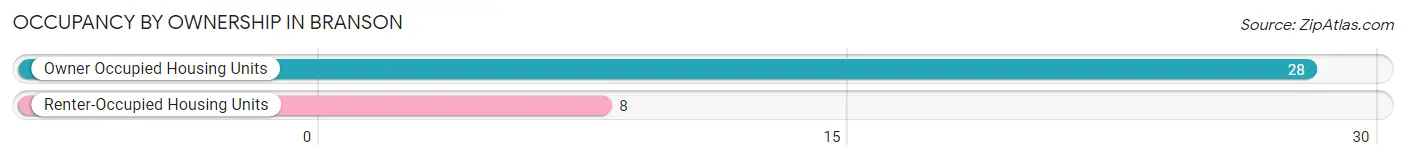
| Occupancy | # Housing Units | % Housing Units |
| Owner Occupied Housing Units | 28 | 77.8% |
| Renter-Occupied Housing Units | 8 | 22.2% |
| Total Occupied Housing Units | 36 | 100.0% |
Occupancy by Household Size in Branson
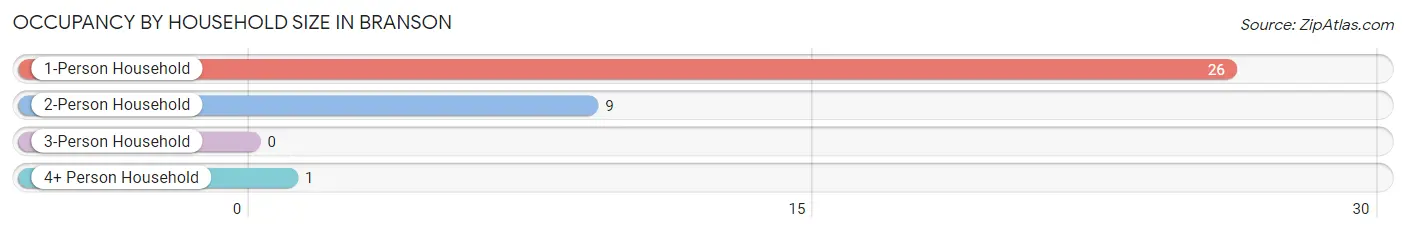
| Household Size | # Housing Units | % Housing Units |
| 1-Person Household | 26 | 72.2% |
| 2-Person Household | 9 | 25.0% |
| 3-Person Household | 0 | 0.0% |
| 4+ Person Household | 1 | 2.8% |
| Total Housing Units | 36 | 100.0% |
Occupancy by Ownership by Household Size in Branson
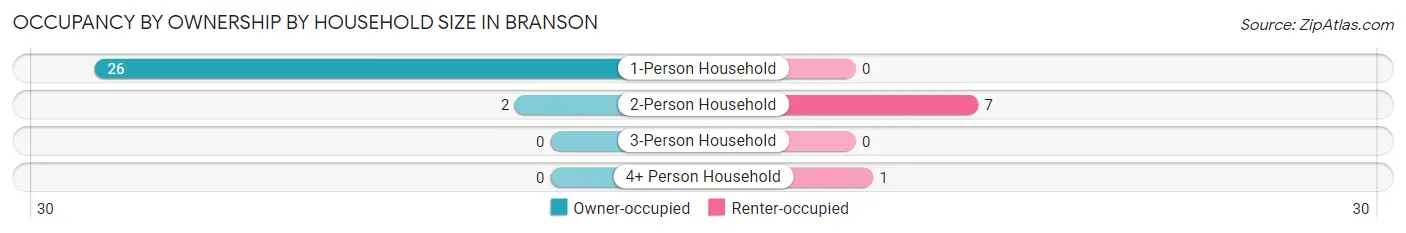
| Household Size | Owner-occupied | Renter-occupied |
| 1-Person Household | 26 (100.0%) | 0 (0.0%) |
| 2-Person Household | 2 (22.2%) | 7 (77.8%) |
| 3-Person Household | 0 (0.0%) | 0 (0.0%) |
| 4+ Person Household | 0 (0.0%) | 1 (100.0%) |
| Total Housing Units | 28 (77.8%) | 8 (22.2%) |
Occupancy by Educational Attainment in Branson
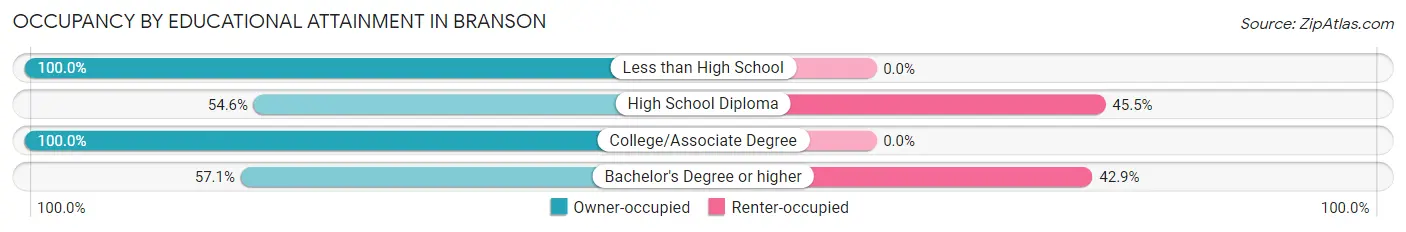
| Household Size | Owner-occupied | Renter-occupied |
| Less than High School | 4 (100.0%) | 0 (0.0%) |
| High School Diploma | 6 (54.5%) | 5 (45.5%) |
| College/Associate Degree | 14 (100.0%) | 0 (0.0%) |
| Bachelor's Degree or higher | 4 (57.1%) | 3 (42.9%) |
Occupancy by Age of Householder in Branson
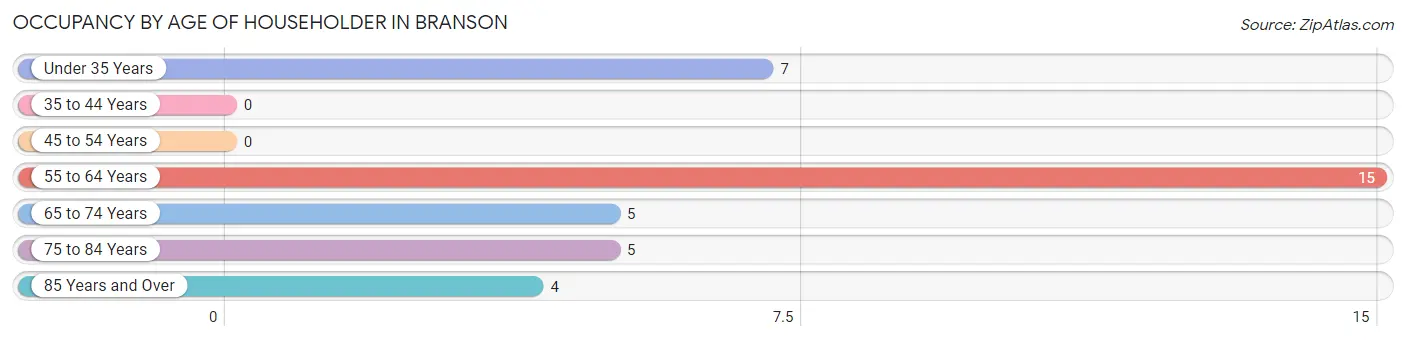
| Age Bracket | # Households | % Households |
| Under 35 Years | 7 | 19.4% |
| 35 to 44 Years | 0 | 0.0% |
| 45 to 54 Years | 0 | 0.0% |
| 55 to 64 Years | 15 | 41.7% |
| 65 to 74 Years | 5 | 13.9% |
| 75 to 84 Years | 5 | 13.9% |
| 85 Years and Over | 4 | 11.1% |
| Total | 36 | 100.0% |
Housing Finances in Branson
Median Income by Occupancy in Branson
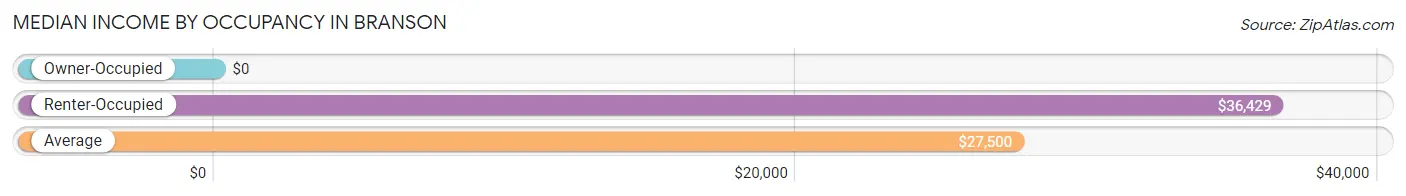
| Occupancy Type | # Households | Median Income |
| Owner-Occupied | 28 (77.8%) | $0 |
| Renter-Occupied | 8 (22.2%) | $36,429 |
| Average | 36 (100.0%) | $27,500 |
Occupancy by Householder Income Bracket in Branson
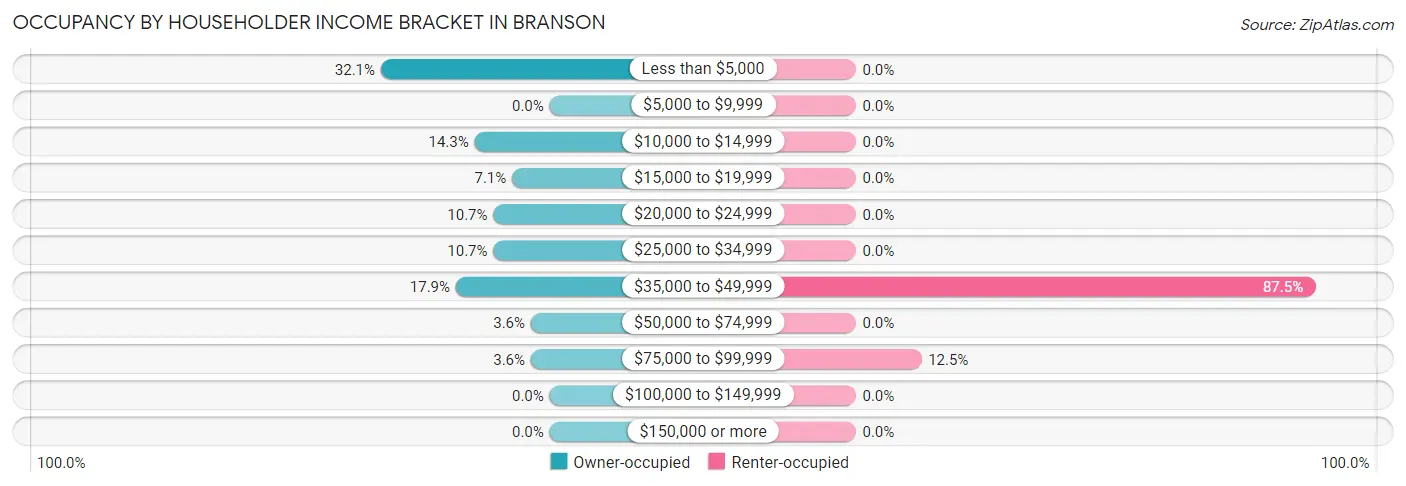
| Income Bracket | Owner-occupied | Renter-occupied |
| Less than $5,000 | 9 (32.1%) | 0 (0.0%) |
| $5,000 to $9,999 | 0 (0.0%) | 0 (0.0%) |
| $10,000 to $14,999 | 4 (14.3%) | 0 (0.0%) |
| $15,000 to $19,999 | 2 (7.1%) | 0 (0.0%) |
| $20,000 to $24,999 | 3 (10.7%) | 0 (0.0%) |
| $25,000 to $34,999 | 3 (10.7%) | 0 (0.0%) |
| $35,000 to $49,999 | 5 (17.9%) | 7 (87.5%) |
| $50,000 to $74,999 | 1 (3.6%) | 0 (0.0%) |
| $75,000 to $99,999 | 1 (3.6%) | 1 (12.5%) |
| $100,000 to $149,999 | 0 (0.0%) | 0 (0.0%) |
| $150,000 or more | 0 (0.0%) | 0 (0.0%) |
| Total | 28 (100.0%) | 8 (100.0%) |
Monthly Housing Cost Tiers in Branson
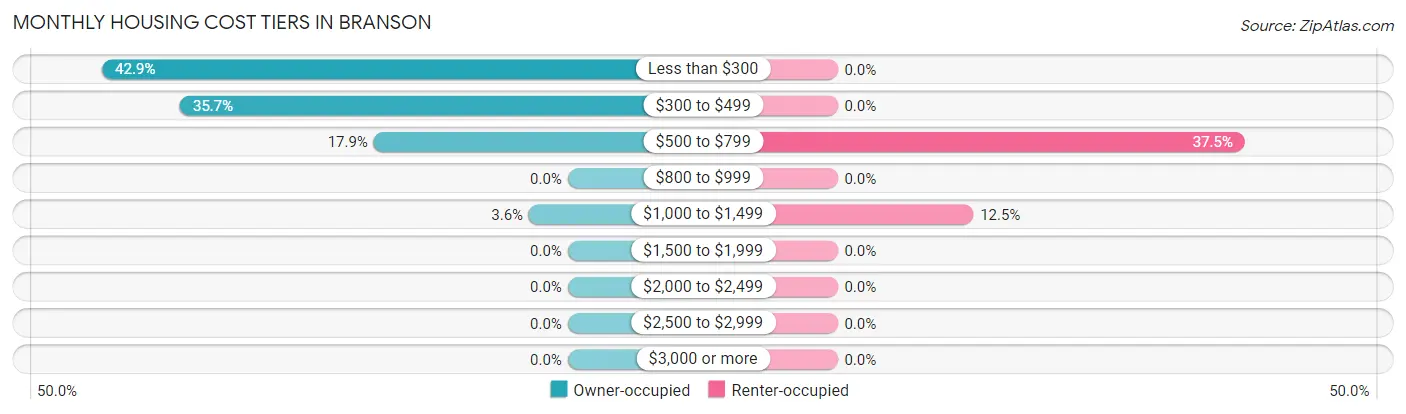
| Monthly Cost | Owner-occupied | Renter-occupied |
| Less than $300 | 12 (42.9%) | 0 (0.0%) |
| $300 to $499 | 10 (35.7%) | 0 (0.0%) |
| $500 to $799 | 5 (17.9%) | 3 (37.5%) |
| $800 to $999 | 0 (0.0%) | 0 (0.0%) |
| $1,000 to $1,499 | 1 (3.6%) | 1 (12.5%) |
| $1,500 to $1,999 | 0 (0.0%) | 0 (0.0%) |
| $2,000 to $2,499 | 0 (0.0%) | 0 (0.0%) |
| $2,500 to $2,999 | 0 (0.0%) | 0 (0.0%) |
| $3,000 or more | 0 (0.0%) | 0 (0.0%) |
| Total | 28 (100.0%) | 8 (100.0%) |
Physical Housing Characteristics in Branson
Housing Structures in Branson
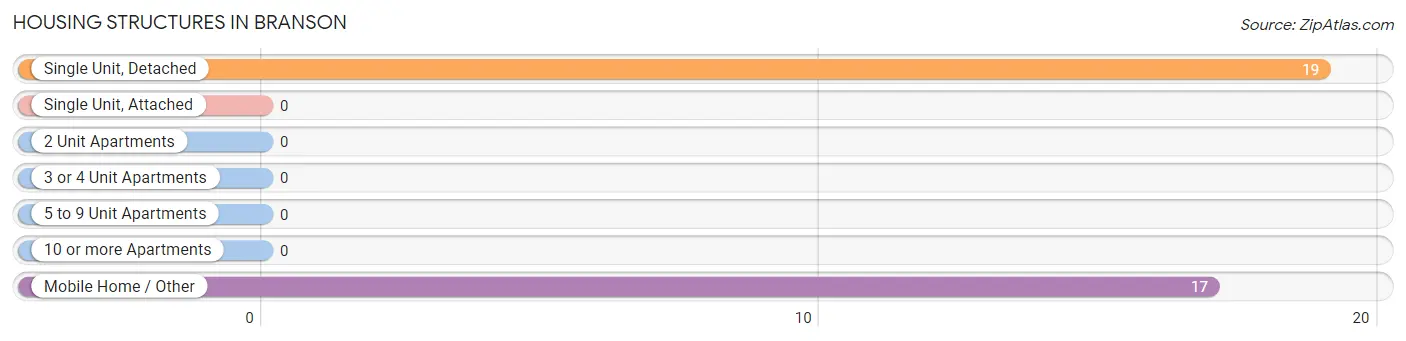
| Structure Type | # Housing Units | % Housing Units |
| Single Unit, Detached | 19 | 52.8% |
| Single Unit, Attached | 0 | 0.0% |
| 2 Unit Apartments | 0 | 0.0% |
| 3 or 4 Unit Apartments | 0 | 0.0% |
| 5 to 9 Unit Apartments | 0 | 0.0% |
| 10 or more Apartments | 0 | 0.0% |
| Mobile Home / Other | 17 | 47.2% |
| Total | 36 | 100.0% |
Housing Structures by Occupancy in Branson
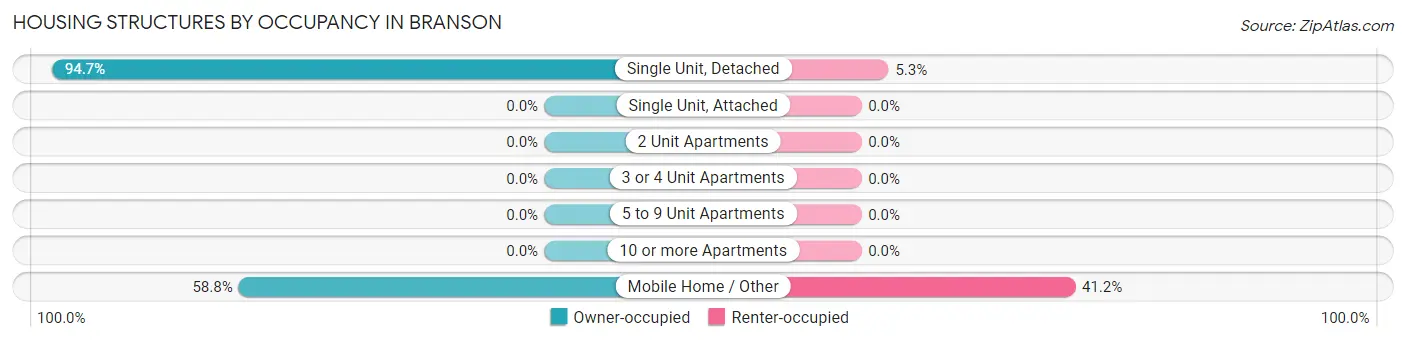
| Structure Type | Owner-occupied | Renter-occupied |
| Single Unit, Detached | 18 (94.7%) | 1 (5.3%) |
| Single Unit, Attached | 0 (0.0%) | 0 (0.0%) |
| 2 Unit Apartments | 0 (0.0%) | 0 (0.0%) |
| 3 or 4 Unit Apartments | 0 (0.0%) | 0 (0.0%) |
| 5 to 9 Unit Apartments | 0 (0.0%) | 0 (0.0%) |
| 10 or more Apartments | 0 (0.0%) | 0 (0.0%) |
| Mobile Home / Other | 10 (58.8%) | 7 (41.2%) |
| Total | 28 (77.8%) | 8 (22.2%) |
Housing Structures by Number of Rooms in Branson
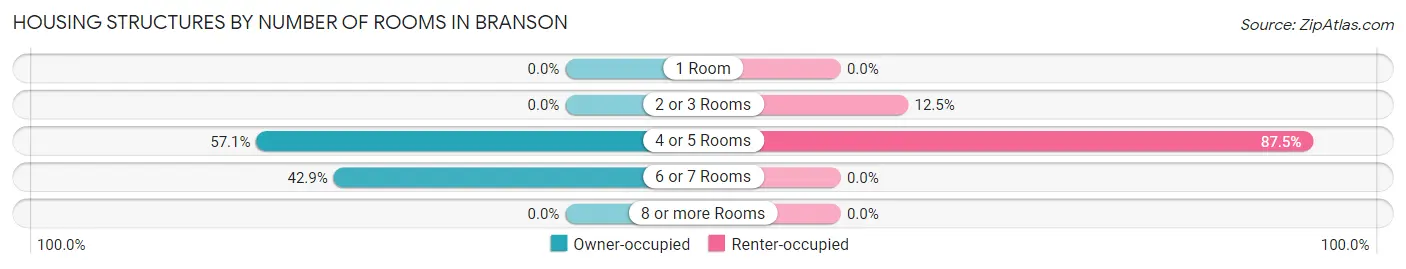
| Number of Rooms | Owner-occupied | Renter-occupied |
| 1 Room | 0 (0.0%) | 0 (0.0%) |
| 2 or 3 Rooms | 0 (0.0%) | 1 (12.5%) |
| 4 or 5 Rooms | 16 (57.1%) | 7 (87.5%) |
| 6 or 7 Rooms | 12 (42.9%) | 0 (0.0%) |
| 8 or more Rooms | 0 (0.0%) | 0 (0.0%) |
| Total | 28 (100.0%) | 8 (100.0%) |
Housing Structure by Heating Type in Branson
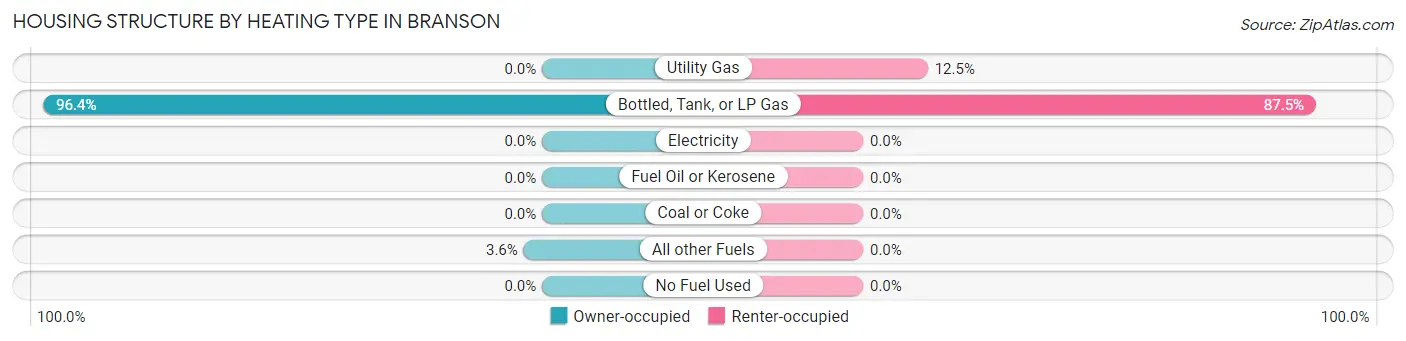
| Heating Type | Owner-occupied | Renter-occupied |
| Utility Gas | 0 (0.0%) | 1 (12.5%) |
| Bottled, Tank, or LP Gas | 27 (96.4%) | 7 (87.5%) |
| Electricity | 0 (0.0%) | 0 (0.0%) |
| Fuel Oil or Kerosene | 0 (0.0%) | 0 (0.0%) |
| Coal or Coke | 0 (0.0%) | 0 (0.0%) |
| All other Fuels | 1 (3.6%) | 0 (0.0%) |
| No Fuel Used | 0 (0.0%) | 0 (0.0%) |
| Total | 28 (100.0%) | 8 (100.0%) |
Household Vehicle Usage in Branson
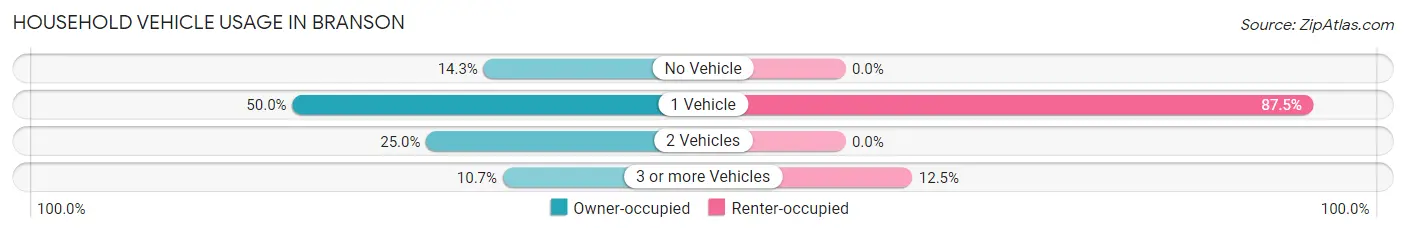
| Vehicles per Household | Owner-occupied | Renter-occupied |
| No Vehicle | 4 (14.3%) | 0 (0.0%) |
| 1 Vehicle | 14 (50.0%) | 7 (87.5%) |
| 2 Vehicles | 7 (25.0%) | 0 (0.0%) |
| 3 or more Vehicles | 3 (10.7%) | 1 (12.5%) |
| Total | 28 (100.0%) | 8 (100.0%) |
Real Estate & Mortgages in Branson
Real Estate and Mortgage Overview in Branson
| Characteristic | Without Mortgage | With Mortgage |
| Housing Units | 24 | 4 |
| Median Property Value | $50,000 | $0 |
| Median Household Income | - | - |
| Monthly Housing Costs | - | - |
| Real Estate Taxes | - | - |
Property Value by Mortgage Status in Branson
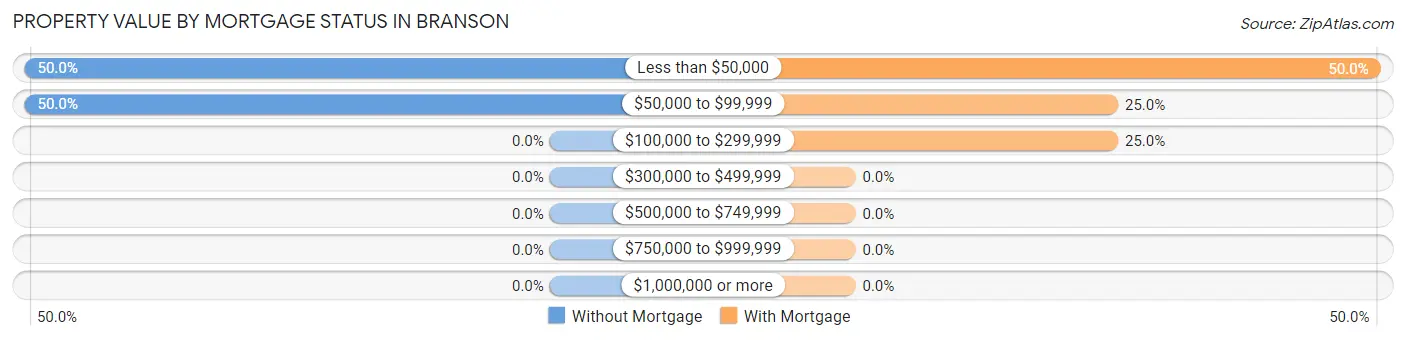
| Property Value | Without Mortgage | With Mortgage |
| Less than $50,000 | 12 (50.0%) | 2 (50.0%) |
| $50,000 to $99,999 | 12 (50.0%) | 1 (25.0%) |
| $100,000 to $299,999 | 0 (0.0%) | 1 (25.0%) |
| $300,000 to $499,999 | 0 (0.0%) | 0 (0.0%) |
| $500,000 to $749,999 | 0 (0.0%) | 0 (0.0%) |
| $750,000 to $999,999 | 0 (0.0%) | 0 (0.0%) |
| $1,000,000 or more | 0 (0.0%) | 0 (0.0%) |
| Total | 24 (100.0%) | 4 (100.0%) |
Household Income by Mortgage Status in Branson
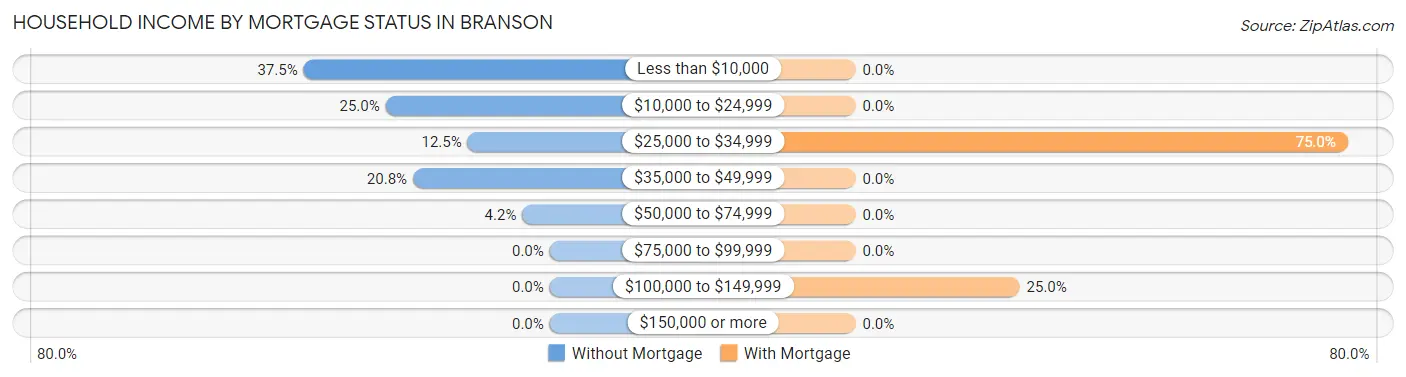
| Household Income | Without Mortgage | With Mortgage |
| Less than $10,000 | 9 (37.5%) | 0 (0.0%) |
| $10,000 to $24,999 | 6 (25.0%) | 0 (0.0%) |
| $25,000 to $34,999 | 3 (12.5%) | 3 (75.0%) |
| $35,000 to $49,999 | 5 (20.8%) | 0 (0.0%) |
| $50,000 to $74,999 | 1 (4.2%) | 0 (0.0%) |
| $75,000 to $99,999 | 0 (0.0%) | 0 (0.0%) |
| $100,000 to $149,999 | 0 (0.0%) | 1 (25.0%) |
| $150,000 or more | 0 (0.0%) | 0 (0.0%) |
| Total | 24 (100.0%) | 4 (100.0%) |
Property Value to Household Income Ratio in Branson
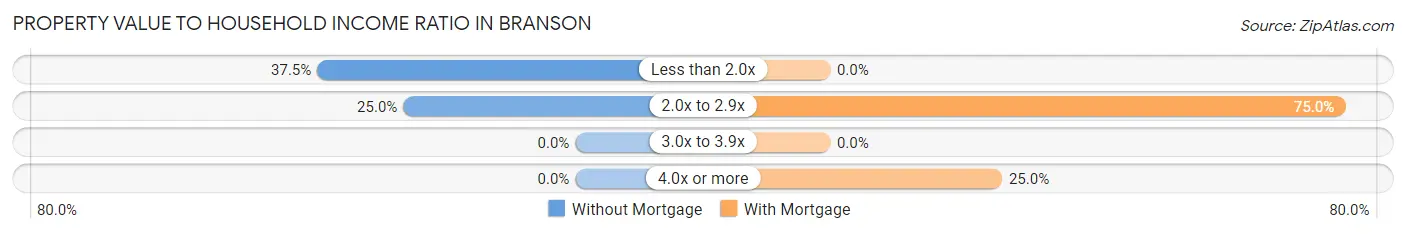
| Value-to-Income Ratio | Without Mortgage | With Mortgage |
| Less than 2.0x | 9 (37.5%) | 0 (0.0%) |
| 2.0x to 2.9x | 6 (25.0%) | 3 (75.0%) |
| 3.0x to 3.9x | 0 (0.0%) | 0 (0.0%) |
| 4.0x or more | 0 (0.0%) | 1 (25.0%) |
| Total | 24 (100.0%) | 4 (100.0%) |
Real Estate Taxes by Mortgage Status in Branson
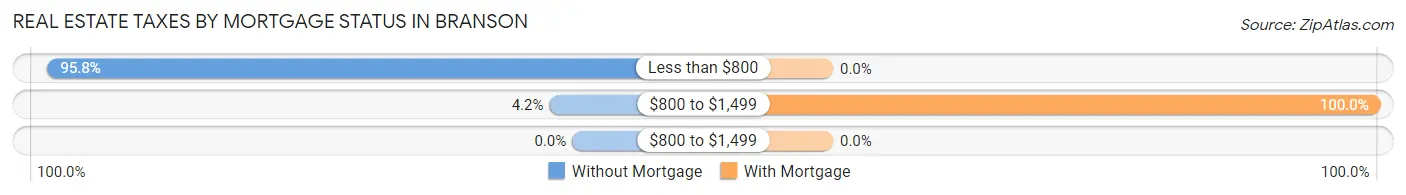
| Property Taxes | Without Mortgage | With Mortgage |
| Less than $800 | 23 (95.8%) | 0 (0.0%) |
| $800 to $1,499 | 1 (4.2%) | 4 (100.0%) |
| $800 to $1,499 | 0 (0.0%) | 0 (0.0%) |
| Total | 24 (100.0%) | 4 (100.0%) |
Health & Disability in Branson
Health Insurance Coverage by Age in Branson
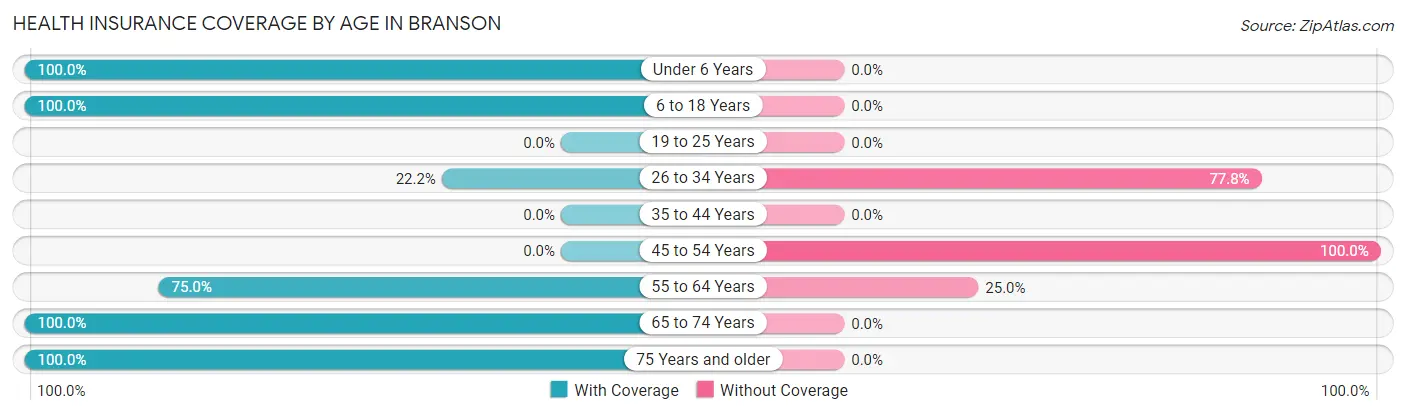
| Age Bracket | With Coverage | Without Coverage |
| Under 6 Years | 5 (100.0%) | 0 (0.0%) |
| 6 to 18 Years | 5 (100.0%) | 0 (0.0%) |
| 19 to 25 Years | 0 (0.0%) | 0 (0.0%) |
| 26 to 34 Years | 2 (22.2%) | 7 (77.8%) |
| 35 to 44 Years | 0 (0.0%) | 0 (0.0%) |
| 45 to 54 Years | 0 (0.0%) | 7 (100.0%) |
| 55 to 64 Years | 12 (75.0%) | 4 (25.0%) |
| 65 to 74 Years | 6 (100.0%) | 0 (0.0%) |
| 75 Years and older | 12 (100.0%) | 0 (0.0%) |
| Total | 42 (70.0%) | 18 (30.0%) |
Health Insurance Coverage by Citizenship Status in Branson
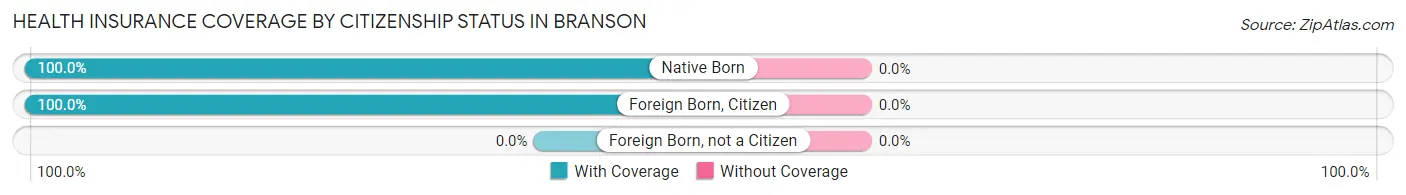
| Citizenship Status | With Coverage | Without Coverage |
| Native Born | 5 (100.0%) | 0 (0.0%) |
| Foreign Born, Citizen | 5 (100.0%) | 0 (0.0%) |
| Foreign Born, not a Citizen | 0 (0.0%) | 0 (0.0%) |
Health Insurance Coverage by Household Income in Branson
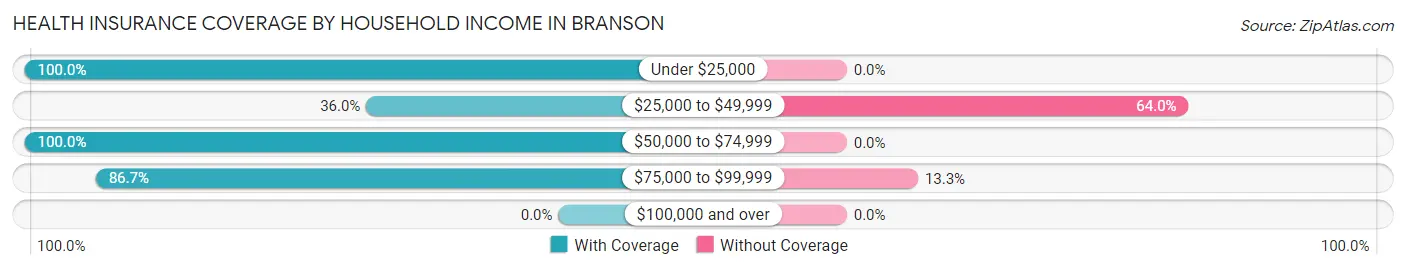
| Household Income | With Coverage | Without Coverage |
| Under $25,000 | 18 (100.0%) | 0 (0.0%) |
| $25,000 to $49,999 | 9 (36.0%) | 16 (64.0%) |
| $50,000 to $74,999 | 2 (100.0%) | 0 (0.0%) |
| $75,000 to $99,999 | 13 (86.7%) | 2 (13.3%) |
| $100,000 and over | 0 (0.0%) | 0 (0.0%) |
Public vs Private Health Insurance Coverage by Age in Branson
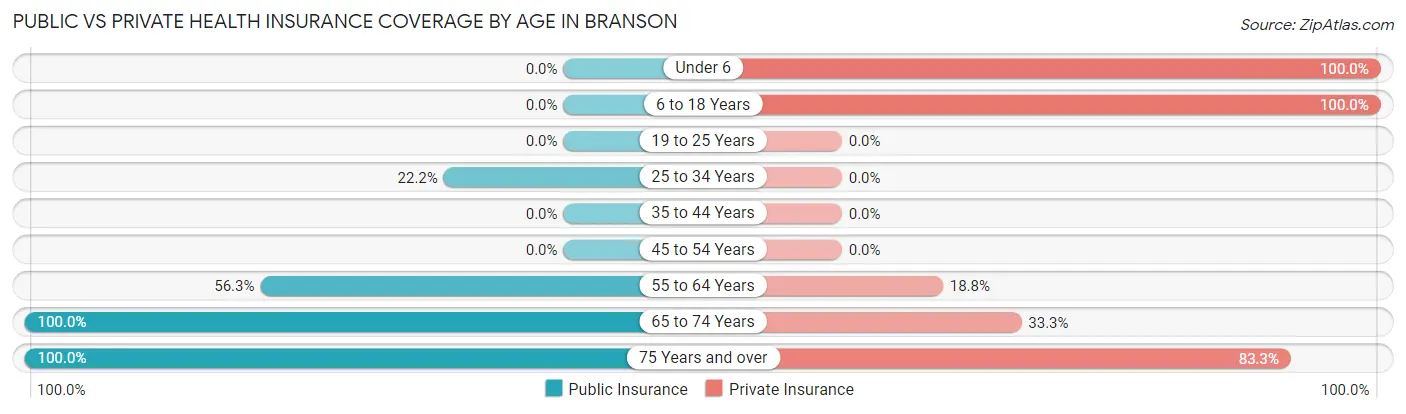
| Age Bracket | Public Insurance | Private Insurance |
| Under 6 | 0 (0.0%) | 5 (100.0%) |
| 6 to 18 Years | 0 (0.0%) | 5 (100.0%) |
| 19 to 25 Years | 0 (0.0%) | 0 (0.0%) |
| 25 to 34 Years | 2 (22.2%) | 0 (0.0%) |
| 35 to 44 Years | 0 (0.0%) | 0 (0.0%) |
| 45 to 54 Years | 0 (0.0%) | 0 (0.0%) |
| 55 to 64 Years | 9 (56.2%) | 3 (18.8%) |
| 65 to 74 Years | 6 (100.0%) | 2 (33.3%) |
| 75 Years and over | 12 (100.0%) | 10 (83.3%) |
| Total | 29 (48.3%) | 25 (41.7%) |
Disability Status by Sex by Age in Branson
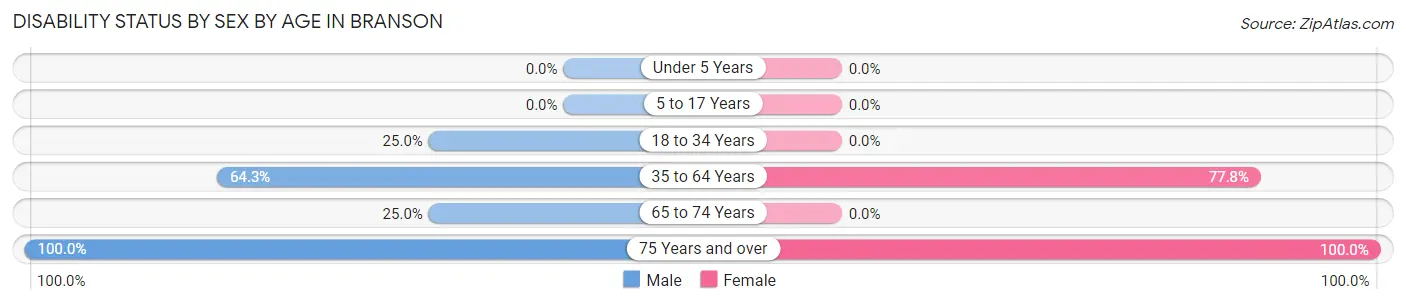
| Age Bracket | Male | Female |
| Under 5 Years | 0 (0.0%) | 0 (0.0%) |
| 5 to 17 Years | 0 (0.0%) | 0 (0.0%) |
| 18 to 34 Years | 2 (25.0%) | 0 (0.0%) |
| 35 to 64 Years | 9 (64.3%) | 7 (77.8%) |
| 65 to 74 Years | 1 (25.0%) | 0 (0.0%) |
| 75 Years and over | 3 (100.0%) | 9 (100.0%) |
Disability Class by Sex by Age in Branson
Disability Class: Hearing Difficulty
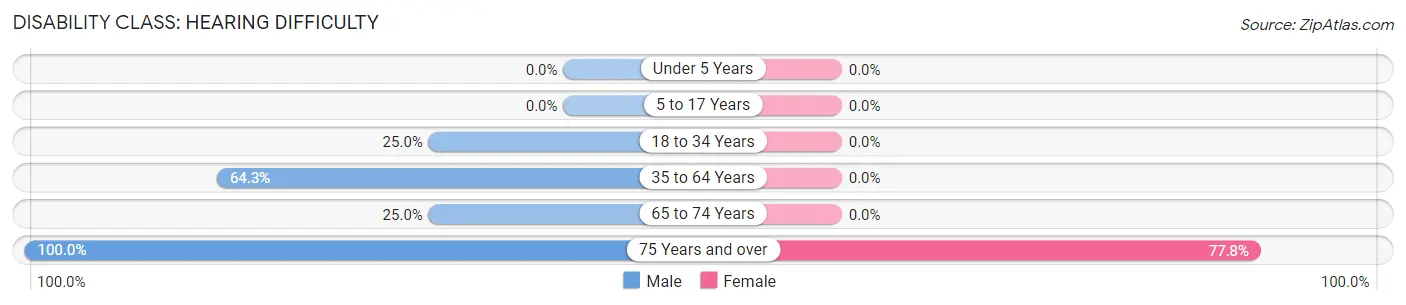
| Age Bracket | Male | Female |
| Under 5 Years | 0 (0.0%) | 0 (0.0%) |
| 5 to 17 Years | 0 (0.0%) | 0 (0.0%) |
| 18 to 34 Years | 2 (25.0%) | 0 (0.0%) |
| 35 to 64 Years | 9 (64.3%) | 0 (0.0%) |
| 65 to 74 Years | 1 (25.0%) | 0 (0.0%) |
| 75 Years and over | 3 (100.0%) | 7 (77.8%) |
Disability Class: Vision Difficulty
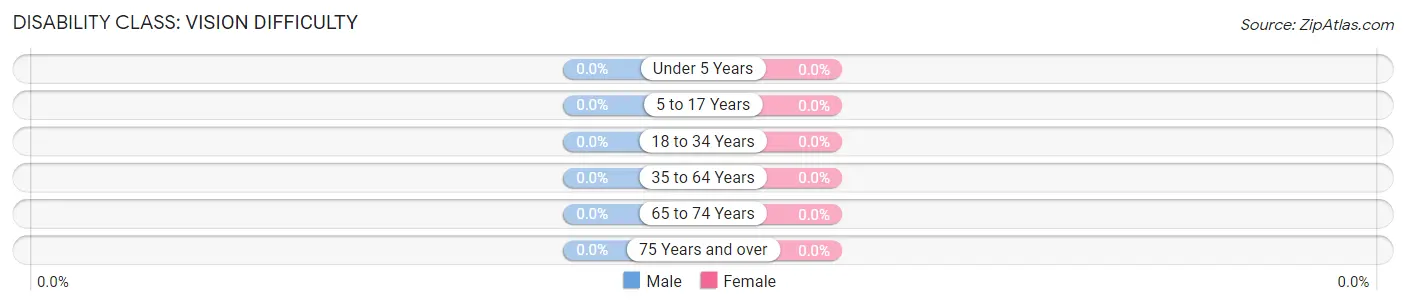
| Age Bracket | Male | Female |
| Under 5 Years | 0 (0.0%) | 0 (0.0%) |
| 5 to 17 Years | 0 (0.0%) | 0 (0.0%) |
| 18 to 34 Years | 0 (0.0%) | 0 (0.0%) |
| 35 to 64 Years | 0 (0.0%) | 0 (0.0%) |
| 65 to 74 Years | 0 (0.0%) | 0 (0.0%) |
| 75 Years and over | 0 (0.0%) | 0 (0.0%) |
Disability Class: Cognitive Difficulty
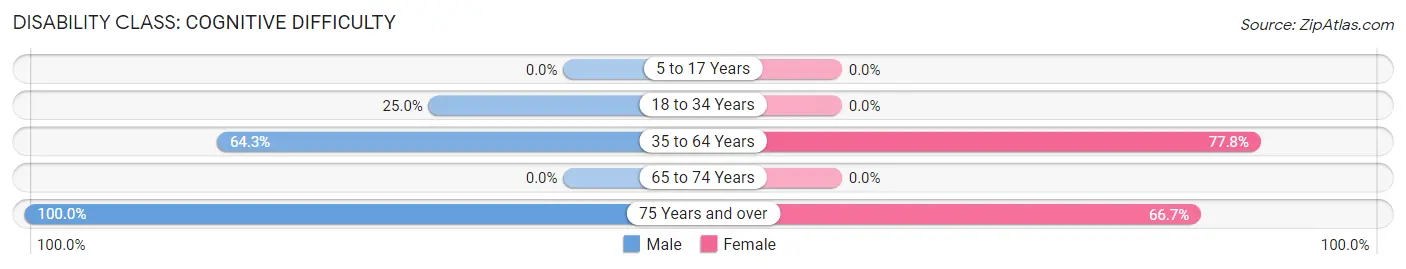
| Age Bracket | Male | Female |
| 5 to 17 Years | 0 (0.0%) | 0 (0.0%) |
| 18 to 34 Years | 2 (25.0%) | 0 (0.0%) |
| 35 to 64 Years | 9 (64.3%) | 7 (77.8%) |
| 65 to 74 Years | 0 (0.0%) | 0 (0.0%) |
| 75 Years and over | 3 (100.0%) | 6 (66.7%) |
Disability Class: Ambulatory Difficulty
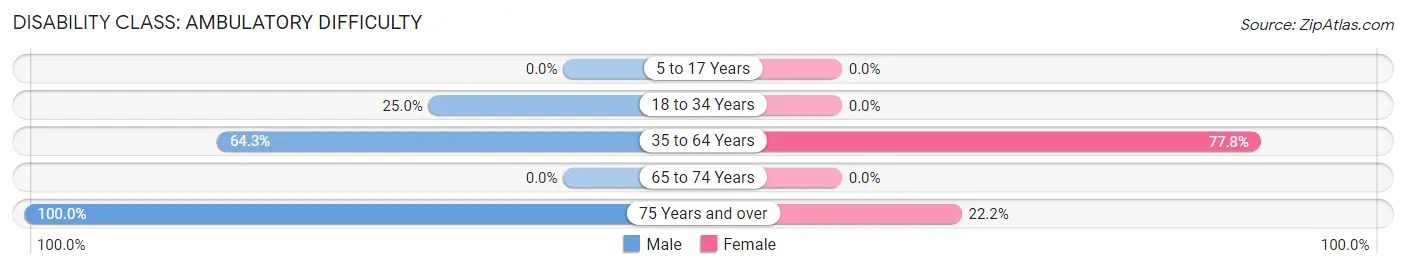
| Age Bracket | Male | Female |
| 5 to 17 Years | 0 (0.0%) | 0 (0.0%) |
| 18 to 34 Years | 2 (25.0%) | 0 (0.0%) |
| 35 to 64 Years | 9 (64.3%) | 7 (77.8%) |
| 65 to 74 Years | 0 (0.0%) | 0 (0.0%) |
| 75 Years and over | 3 (100.0%) | 2 (22.2%) |
Disability Class: Self-Care Difficulty

| Age Bracket | Male | Female |
| 5 to 17 Years | 0 (0.0%) | 0 (0.0%) |
| 18 to 34 Years | 0 (0.0%) | 0 (0.0%) |
| 35 to 64 Years | 0 (0.0%) | 0 (0.0%) |
| 65 to 74 Years | 0 (0.0%) | 0 (0.0%) |
| 75 Years and over | 0 (0.0%) | 2 (22.2%) |
Technology Access in Branson
Computing Device Access in Branson
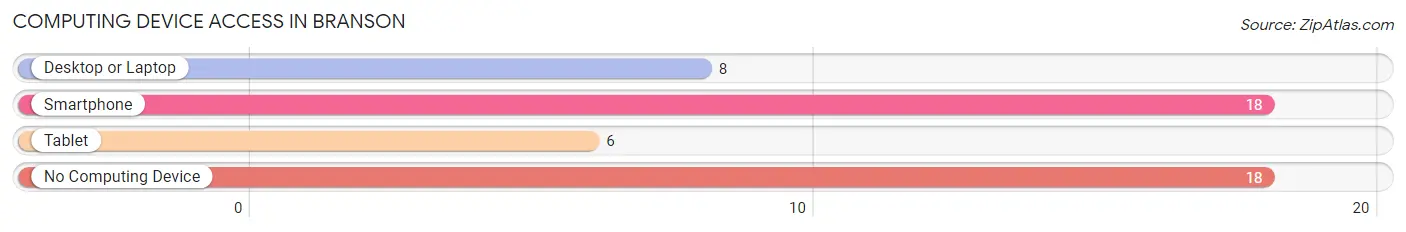
| Device Type | # Households | % Households |
| Desktop or Laptop | 8 | 22.2% |
| Smartphone | 18 | 50.0% |
| Tablet | 6 | 16.7% |
| No Computing Device | 18 | 50.0% |
| Total | 36 | 100.0% |
Internet Access in Branson
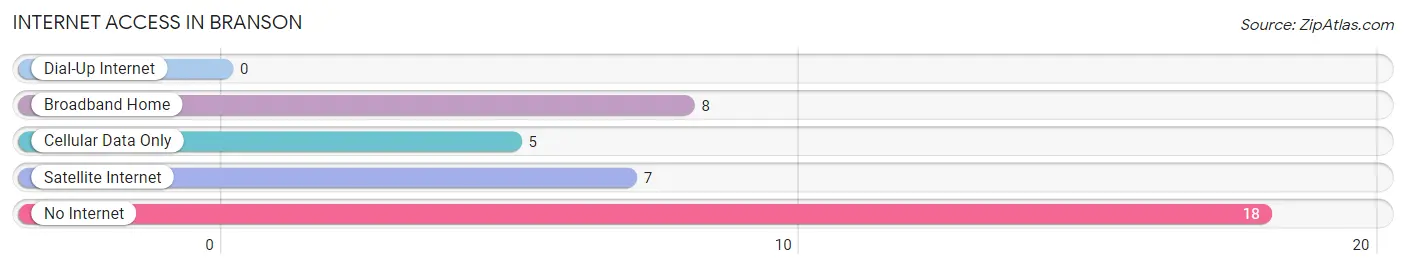
| Internet Type | # Households | % Households |
| Dial-Up Internet | 0 | 0.0% |
| Broadband Home | 8 | 22.2% |
| Cellular Data Only | 5 | 13.9% |
| Satellite Internet | 7 | 19.4% |
| No Internet | 18 | 50.0% |
| Total | 36 | 100.0% |
Branson Summary
Branson, Colorado is a small town located in the San Juan Mountains of southwestern Colorado. It is situated in the San Juan National Forest, and is surrounded by the Rio Grande National Forest and the Weminuche Wilderness. The town is located at an elevation of 8,400 feet, and is home to approximately 200 people.
History
Branson was founded in 1881 by prospectors looking for gold and silver. The town was named after a prospector named William Branson, who was one of the first to settle in the area. The town quickly grew, and by the early 1900s, it had become a bustling mining town. The town was home to several mines, including the Branson Mine, which was the largest in the area. The town also had a post office, a school, a hotel, and several stores.
In the early 1900s, the town began to decline as the mines began to close. By the 1950s, the town had become a ghost town, with only a few residents remaining. In the 1970s, the town was revitalized when the San Juan National Forest was established, and the town became a popular destination for outdoor recreation.
Geography
Branson is located in the San Juan Mountains of southwestern Colorado. The town is situated in the San Juan National Forest, and is surrounded by the Rio Grande National Forest and the Weminuche Wilderness. The town is located at an elevation of 8,400 feet, and is home to approximately 200 people.
The town is located in a mountainous region, and is surrounded by forests and wilderness areas. The town is located near several popular outdoor recreation areas, including the Weminuche Wilderness, the Rio Grande National Forest, and the San Juan National Forest.
Economy
The economy of Branson is largely based on tourism and outdoor recreation. The town is a popular destination for hikers, campers, and other outdoor enthusiasts. The town is also home to several businesses, including restaurants, lodging, and retail stores.
The town is also home to several small businesses, including a sawmill, a woodworking shop, and a general store. The town is also home to several artists and craftspeople, who sell their wares at local markets and festivals.
Demographics
As of the 2010 census, the population of Branson was 200 people. The town is predominantly white, with 95.5% of the population identifying as white. The town is also home to a small Hispanic population, with 4.5% of the population identifying as Hispanic or Latino.
The median household income in Branson is $37,500, and the median home value is $150,000. The town has a poverty rate of 11.3%, and the unemployment rate is 4.3%.
Conclusion
Branson, Colorado is a small town located in the San Juan Mountains of southwestern Colorado. It is situated in the San Juan National Forest, and is surrounded by the Rio Grande National Forest and the Weminuche Wilderness. The town is home to approximately 200 people, and is a popular destination for outdoor recreation. The economy of Branson is largely based on tourism and outdoor recreation, and the town is home to several businesses, including restaurants, lodging, and retail stores. The town is predominantly white, with 95.5% of the population identifying as white, and a small Hispanic population of 4.5%. The median household income in Branson is $37,500, and the median home value is $150,000.
Common Questions
What is Per Capita Income in Branson?
Per Capita income in Branson is $16,022.
What is the Median Household income in Branson?
Median Household Income in Branson is $27,500.
What is Inequality or Gini Index in Branson?
Inequality or Gini Index in Branson is 0.45.
What is the Total Population of Branson?
Total Population of Branson is 60.
What is the Total Male Population of Branson?
Total Male Population of Branson is 34.
What is the Total Female Population of Branson?
Total Female Population of Branson is 26.
What is the Ratio of Males per 100 Females in Branson?
There are 130.77 Males per 100 Females in Branson.
What is the Ratio of Females per 100 Males in Branson?
There are 76.47 Females per 100 Males in Branson.
What is the Median Population Age in Branson?
Median Population Age in Branson is 58.3 Years.
What is the Average Family Size in Branson
Average Family Size in Branson is 3.8 People.
What is the Average Household Size in Branson
Average Household Size in Branson is 1.7 People.
How Large is the Labor Force in Branson?
There are 17 People in the Labor Forcein in Branson.
What is the Percentage of People in the Labor Force in Branson?
34.0% of People are in the Labor Force in Branson.