Arriba, CO Map & Demographics
Arriba Map
Arriba Overview
$25,315
PER CAPITA INCOME
$50,625
AVG FAMILY INCOME
$27,500
AVG HOUSEHOLD INCOME
30.2%
WAGE / INCOME GAP [ % ]
69.8¢/ $1
WAGE / INCOME GAP [ $ ]
0.49
INEQUALITY / GINI INDEX
235
TOTAL POPULATION
116
MALE POPULATION
119
FEMALE POPULATION
97.48
MALES / 100 FEMALES
102.59
FEMALES / 100 MALES
49.5
MEDIAN AGE
2.7
AVG FAMILY SIZE
1.9
AVG HOUSEHOLD SIZE
100
LABOR FORCE [ PEOPLE ]
57.8%
PERCENT IN LABOR FORCE
Arriba Zip Codes
Income in Arriba
Income Overview in Arriba
Per Capita Income in Arriba is $25,315, while median incomes of families and households are $50,625 and $27,500 respectively.
| Characteristic | Number | Measure |
| Per Capita Income | 235 | $25,315 |
| Median Family Income | 61 | $50,625 |
| Mean Family Income | 61 | $76,449 |
| Median Household Income | 124 | $27,500 |
| Mean Household Income | 124 | $49,093 |
| Income Deficit | 61 | $0 |
| Wage / Income Gap (%) | 235 | 30.22% |
| Wage / Income Gap ($) | 235 | 69.78¢ per $1 |
| Gini / Inequality Index | 235 | 0.49 |
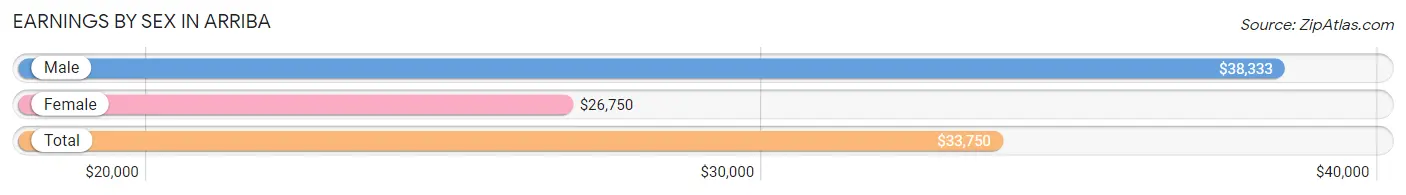
Earnings by Sex in Arriba
Average Earnings in Arriba are $33,750, $38,333 for men and $26,750 for women, a difference of 30.2%.
| Sex | Number | Average Earnings |
| Male | 54 (53.5%) | $38,333 |
| Female | 47 (46.5%) | $26,750 |
| Total | 101 (100.0%) | $33,750 |
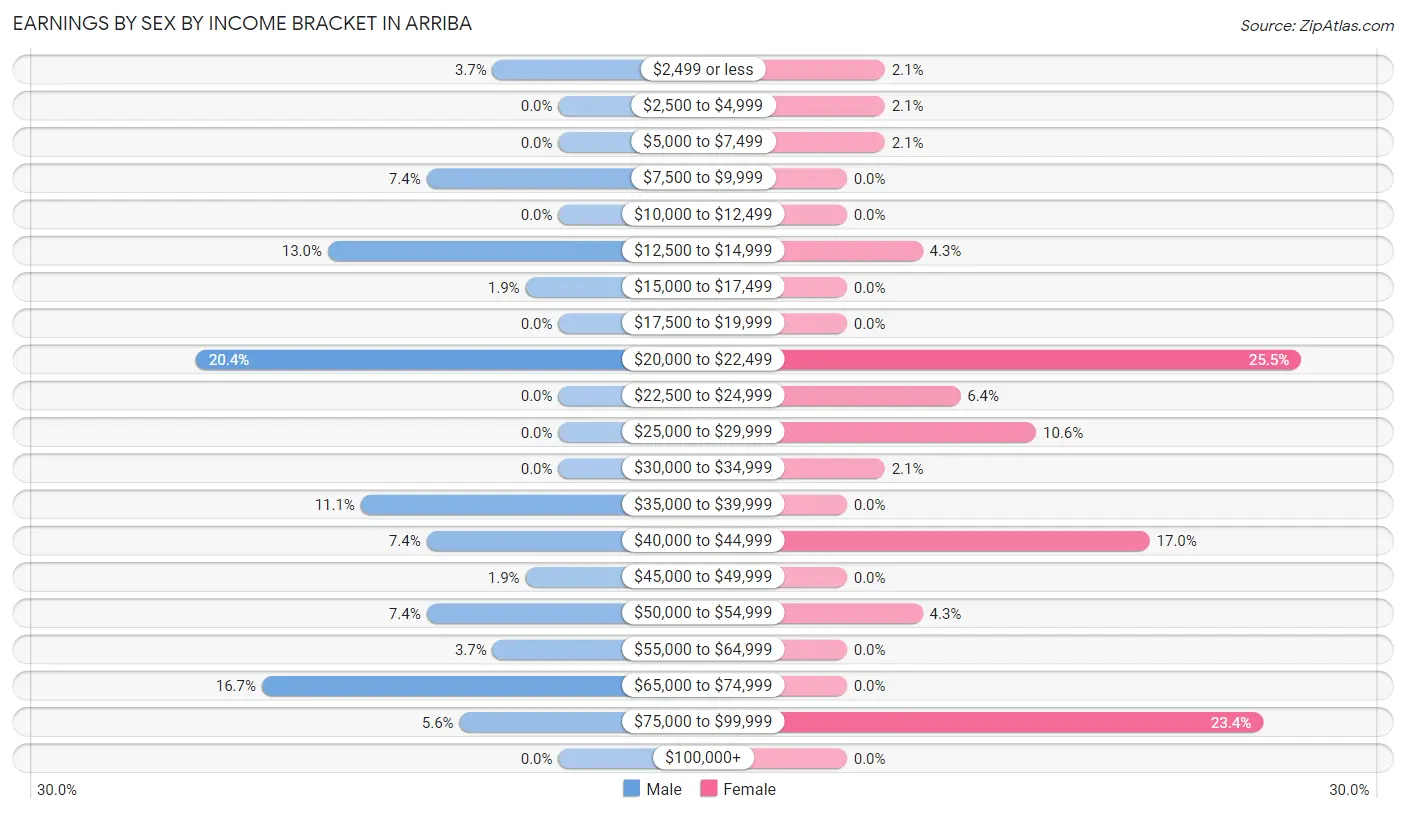
Earnings by Sex by Income Bracket in Arriba
The most common earnings brackets in Arriba are $20,000 to $22,499 for men (11 | 20.4%) and $20,000 to $22,499 for women (12 | 25.5%).
| Income | Male | Female |
| $2,499 or less | 2 (3.7%) | 1 (2.1%) |
| $2,500 to $4,999 | 0 (0.0%) | 1 (2.1%) |
| $5,000 to $7,499 | 0 (0.0%) | 1 (2.1%) |
| $7,500 to $9,999 | 4 (7.4%) | 0 (0.0%) |
| $10,000 to $12,499 | 0 (0.0%) | 0 (0.0%) |
| $12,500 to $14,999 | 7 (13.0%) | 2 (4.3%) |
| $15,000 to $17,499 | 1 (1.8%) | 0 (0.0%) |
| $17,500 to $19,999 | 0 (0.0%) | 0 (0.0%) |
| $20,000 to $22,499 | 11 (20.4%) | 12 (25.5%) |
| $22,500 to $24,999 | 0 (0.0%) | 3 (6.4%) |
| $25,000 to $29,999 | 0 (0.0%) | 5 (10.6%) |
| $30,000 to $34,999 | 0 (0.0%) | 1 (2.1%) |
| $35,000 to $39,999 | 6 (11.1%) | 0 (0.0%) |
| $40,000 to $44,999 | 4 (7.4%) | 8 (17.0%) |
| $45,000 to $49,999 | 1 (1.8%) | 0 (0.0%) |
| $50,000 to $54,999 | 4 (7.4%) | 2 (4.3%) |
| $55,000 to $64,999 | 2 (3.7%) | 0 (0.0%) |
| $65,000 to $74,999 | 9 (16.7%) | 0 (0.0%) |
| $75,000 to $99,999 | 3 (5.6%) | 11 (23.4%) |
| $100,000+ | 0 (0.0%) | 0 (0.0%) |
| Total | 54 (100.0%) | 47 (100.0%) |
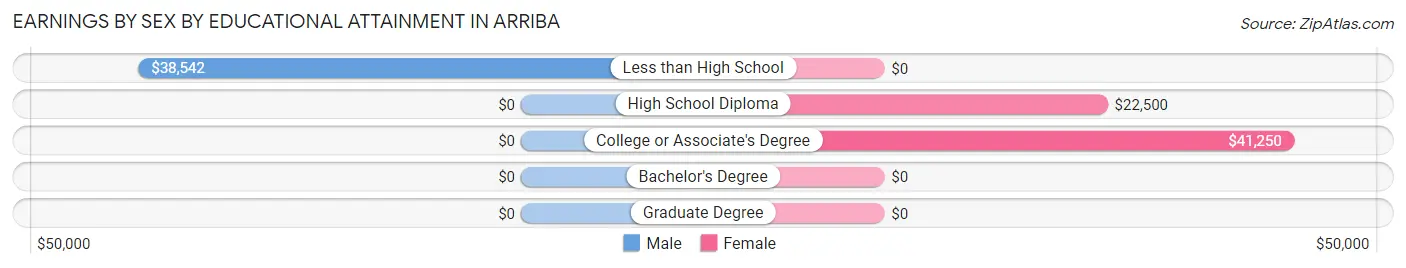
Earnings by Sex by Educational Attainment in Arriba
Average earnings in Arriba are $39,792 for men and $25,000 for women, a difference of 37.2%. Men with an educational attainment of less than high school enjoy the highest average annual earnings of $38,542, while those with less than high school education earn the least with $38,542. Women with an educational attainment of college or associate's degree earn the most with the average annual earnings of $41,250, while those with high school diploma education have the smallest earnings of $22,500.
| Educational Attainment | Male Income | Female Income |
| Less than High School | $38,542 | $0 |
| High School Diploma | - | - |
| College or Associate's Degree | - | - |
| Bachelor's Degree | - | - |
| Graduate Degree | - | - |
| Total | $39,792 | $25,000 |
Family Income in Arriba
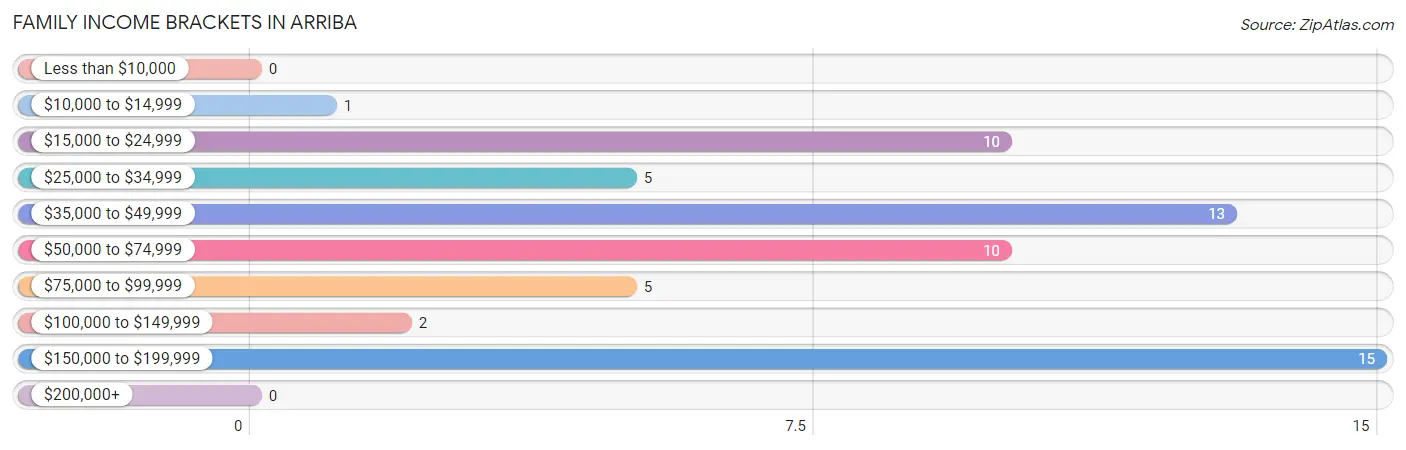
Family Income Brackets in Arriba
According to the Arriba family income data, there are 15 families falling into the $150,000 to $199,999 income range, which is the most common income bracket and makes up 24.6% of all families.
| Income Bracket | # Families | % Families |
| Less than $10,000 | 0 | 0.0% |
| $10,000 to $14,999 | 1 | 1.6% |
| $15,000 to $24,999 | 10 | 16.4% |
| $25,000 to $34,999 | 5 | 8.2% |
| $35,000 to $49,999 | 13 | 21.3% |
| $50,000 to $74,999 | 10 | 16.4% |
| $75,000 to $99,999 | 5 | 8.2% |
| $100,000 to $149,999 | 2 | 3.3% |
| $150,000 to $199,999 | 15 | 24.6% |
| $200,000+ | 0 | 0.0% |
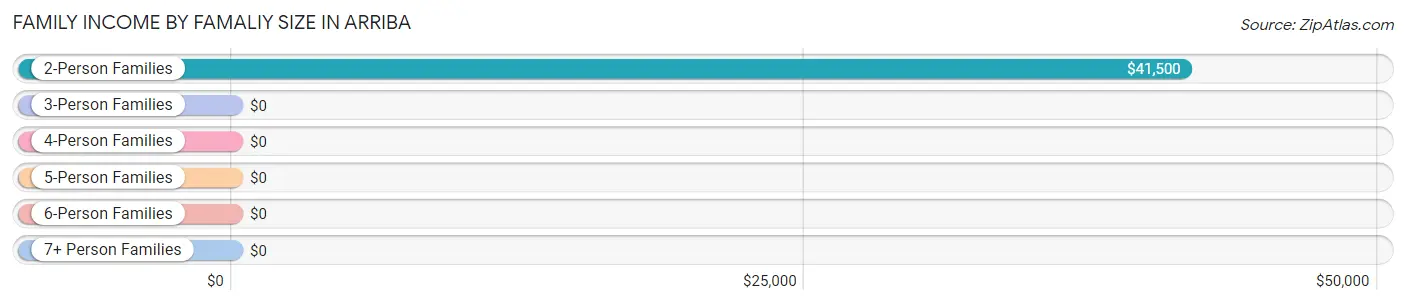
Family Income by Famaliy Size in Arriba
2-person families (34 | 55.7%) account for the highest median family income in Arriba with $41,500 per family, while 2-person families (34 | 55.7%) have the highest median income of $20,750 per family member.
| Income Bracket | # Families | Median Income |
| 2-Person Families | 34 (55.7%) | $41,500 |
| 3-Person Families | 21 (34.4%) | $0 |
| 4-Person Families | 2 (3.3%) | $0 |
| 5-Person Families | 0 (0.0%) | $0 |
| 6-Person Families | 0 (0.0%) | $0 |
| 7+ Person Families | 4 (6.6%) | $0 |
| Total | 61 (100.0%) | $50,625 |
Family Income by Number of Earners in Arriba
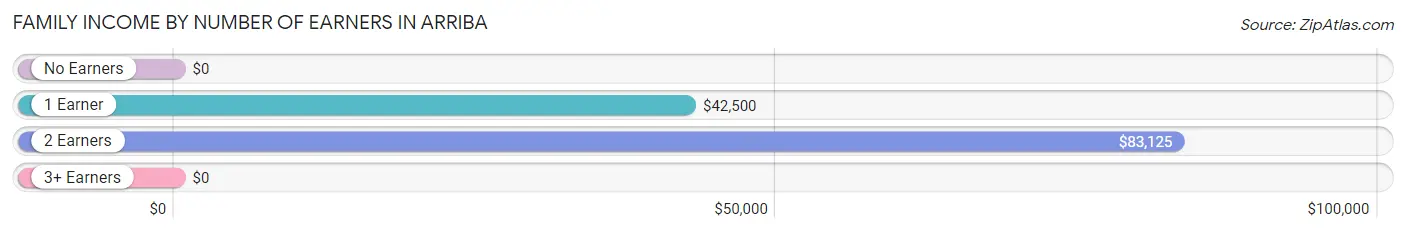
| Number of Earners | # Families | Median Income |
| No Earners | 5 (8.2%) | $0 |
| 1 Earner | 26 (42.6%) | $42,500 |
| 2 Earners | 30 (49.2%) | $83,125 |
| 3+ Earners | 0 (0.0%) | $0 |
| Total | 61 (100.0%) | $50,625 |
Household Income in Arriba
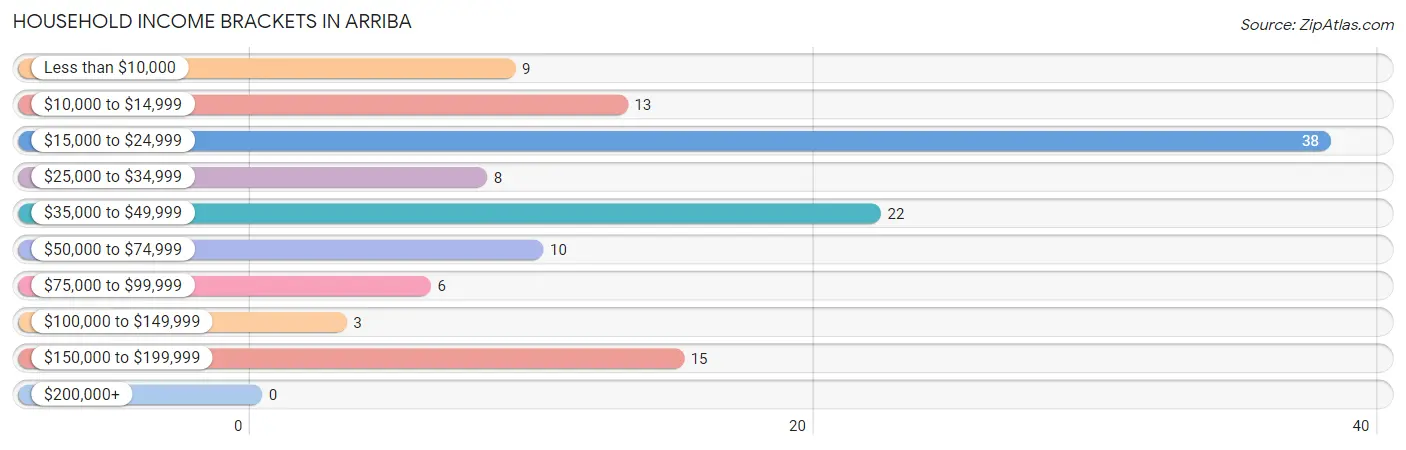
Household Income Brackets in Arriba
With 38 households falling in the category, the $15,000 to $24,999 income range is the most frequent in Arriba, accounting for 30.6% of all households.
| Income Bracket | # Households | % Households |
| Less than $10,000 | 9 | 7.3% |
| $10,000 to $14,999 | 13 | 10.5% |
| $15,000 to $24,999 | 38 | 30.6% |
| $25,000 to $34,999 | 8 | 6.5% |
| $35,000 to $49,999 | 22 | 17.7% |
| $50,000 to $74,999 | 10 | 8.1% |
| $75,000 to $99,999 | 6 | 4.8% |
| $100,000 to $149,999 | 3 | 2.4% |
| $150,000 to $199,999 | 15 | 12.1% |
| $200,000+ | 0 | 0.0% |
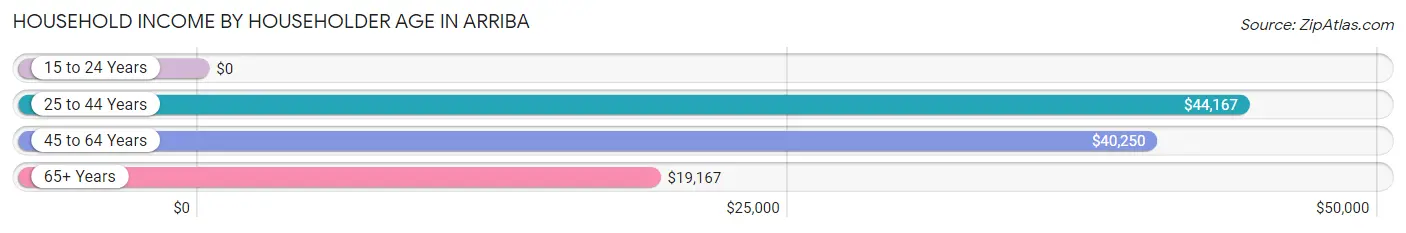
Household Income by Householder Age in Arriba
The median household income in Arriba is $27,500, with the highest median household income of $44,167 found in the 25 to 44 years age bracket for the primary householder. A total of 18 households (14.5%) fall into this category. Meanwhile, the 15 to 24 years age bracket for the primary householder has the lowest median household income of $0, with 16 households (12.9%) in this group.
| Income Bracket | # Households | Median Income |
| 15 to 24 Years | 16 (12.9%) | $0 |
| 25 to 44 Years | 18 (14.5%) | $44,167 |
| 45 to 64 Years | 54 (43.5%) | $40,250 |
| 65+ Years | 36 (29.0%) | $19,167 |
| Total | 124 (100.0%) | $27,500 |
Poverty in Arriba
Income Below Poverty by Sex and Age in Arriba
With 17.2% poverty level for males and 31.9% for females among the residents of Arriba, 6 to 11 year old males and 55 to 64 year old females are the most vulnerable to poverty, with 14 males (66.7%) and 17 females (77.3%) in their respective age groups living below the poverty level.
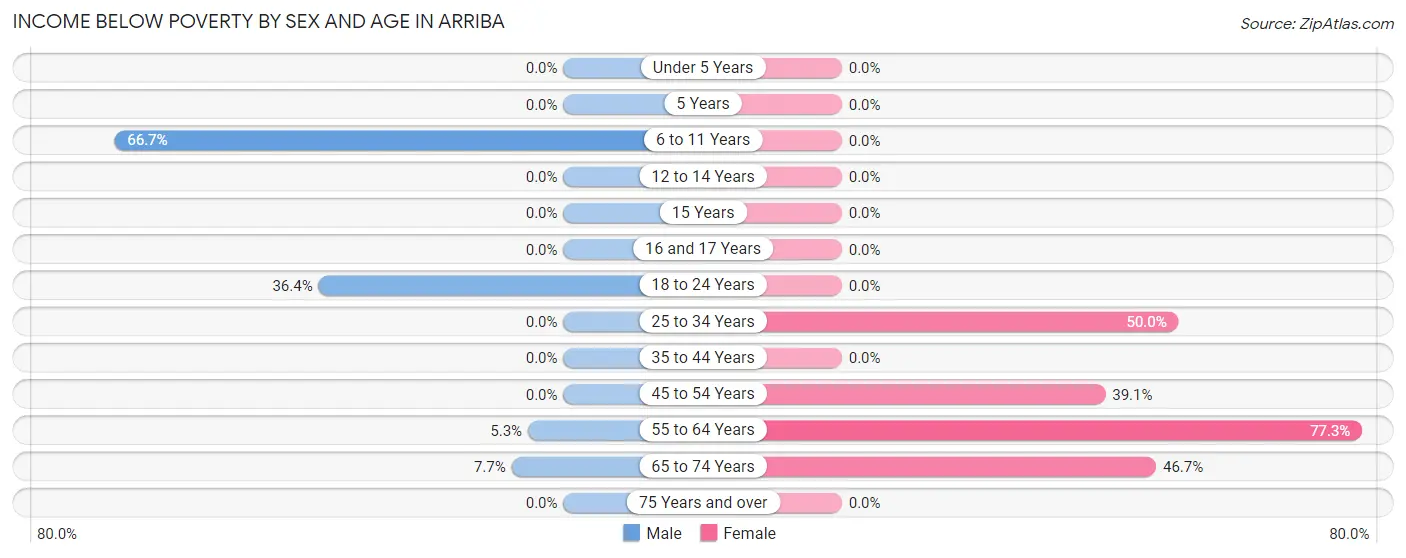
| Age Bracket | Male | Female |
| Under 5 Years | 0 (0.0%) | 0 (0.0%) |
| 5 Years | 0 (0.0%) | 0 (0.0%) |
| 6 to 11 Years | 14 (66.7%) | 0 (0.0%) |
| 12 to 14 Years | 0 (0.0%) | 0 (0.0%) |
| 15 Years | 0 (0.0%) | 0 (0.0%) |
| 16 and 17 Years | 0 (0.0%) | 0 (0.0%) |
| 18 to 24 Years | 4 (36.4%) | 0 (0.0%) |
| 25 to 34 Years | 0 (0.0%) | 5 (50.0%) |
| 35 to 44 Years | 0 (0.0%) | 0 (0.0%) |
| 45 to 54 Years | 0 (0.0%) | 9 (39.1%) |
| 55 to 64 Years | 1 (5.3%) | 17 (77.3%) |
| 65 to 74 Years | 1 (7.7%) | 7 (46.7%) |
| 75 Years and over | 0 (0.0%) | 0 (0.0%) |
| Total | 20 (17.2%) | 38 (31.9%) |
Income Above Poverty by Sex and Age in Arriba
According to the poverty statistics in Arriba, males aged under 5 years and females aged under 5 years are the age groups that are most secure financially, with 100.0% of males and 100.0% of females in these age groups living above the poverty line.
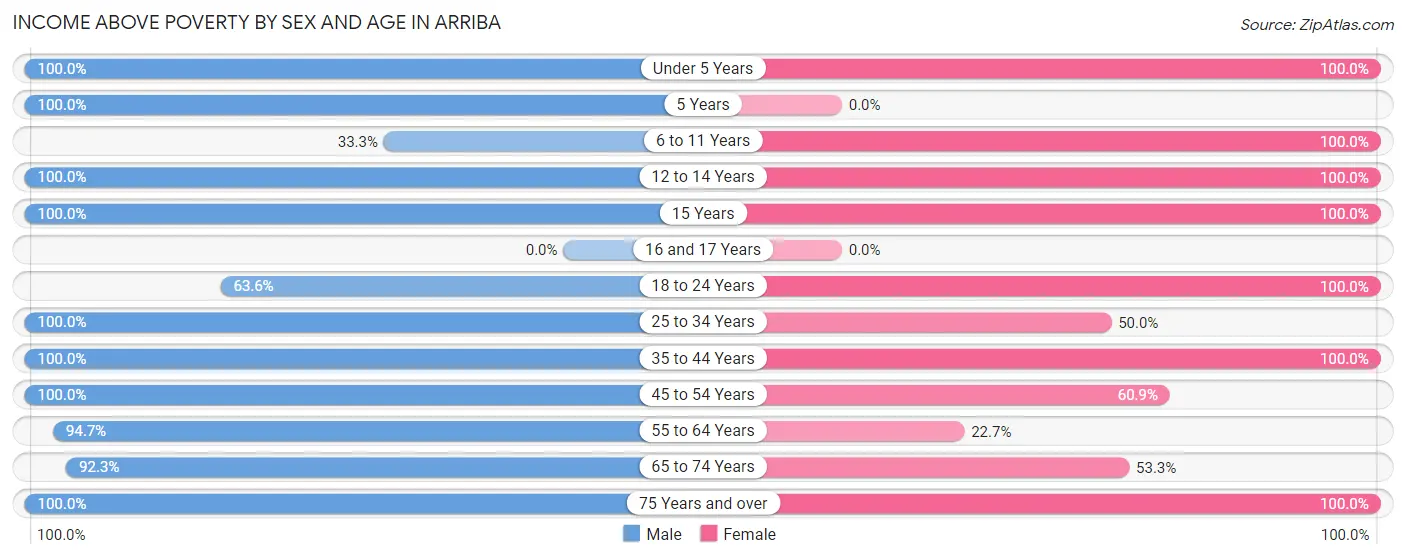
| Age Bracket | Male | Female |
| Under 5 Years | 2 (100.0%) | 6 (100.0%) |
| 5 Years | 1 (100.0%) | 0 (0.0%) |
| 6 to 11 Years | 7 (33.3%) | 6 (100.0%) |
| 12 to 14 Years | 4 (100.0%) | 5 (100.0%) |
| 15 Years | 10 (100.0%) | 7 (100.0%) |
| 16 and 17 Years | 0 (0.0%) | 0 (0.0%) |
| 18 to 24 Years | 7 (63.6%) | 7 (100.0%) |
| 25 to 34 Years | 2 (100.0%) | 5 (50.0%) |
| 35 to 44 Years | 2 (100.0%) | 14 (100.0%) |
| 45 to 54 Years | 22 (100.0%) | 14 (60.9%) |
| 55 to 64 Years | 18 (94.7%) | 5 (22.7%) |
| 65 to 74 Years | 12 (92.3%) | 8 (53.3%) |
| 75 Years and over | 9 (100.0%) | 4 (100.0%) |
| Total | 96 (82.8%) | 81 (68.1%) |
Income Below Poverty Among Married-Couple Families in Arriba
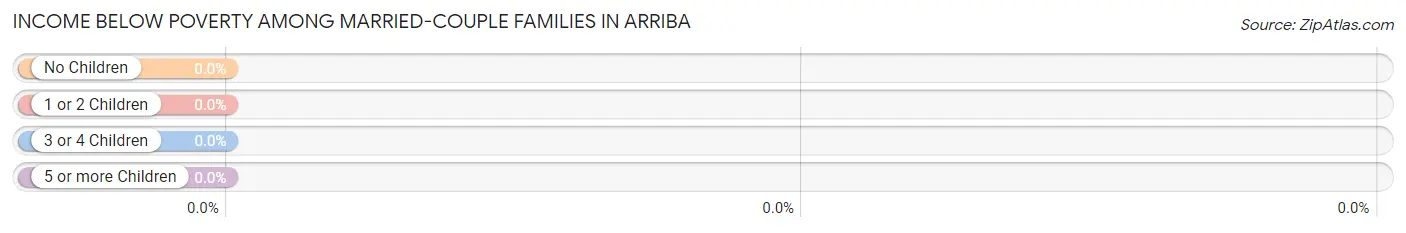
| Children | Above Poverty | Below Poverty |
| No Children | 25 (100.0%) | 0 (0.0%) |
| 1 or 2 Children | 15 (100.0%) | 0 (0.0%) |
| 3 or 4 Children | 0 (0.0%) | 0 (0.0%) |
| 5 or more Children | 4 (100.0%) | 0 (0.0%) |
| Total | 44 (100.0%) | 0 (0.0%) |
Income Below Poverty Among Single-Parent Households in Arriba
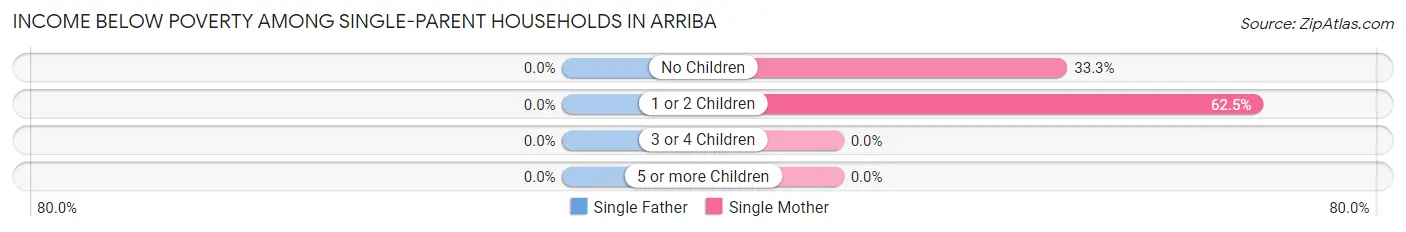
| Children | Single Father | Single Mother |
| No Children | 0 (0.0%) | 1 (33.3%) |
| 1 or 2 Children | 0 (0.0%) | 5 (62.5%) |
| 3 or 4 Children | 0 (0.0%) | 0 (0.0%) |
| 5 or more Children | 0 (0.0%) | 0 (0.0%) |
| Total | 0 (0.0%) | 6 (54.5%) |
Income Below Poverty Among Married-Couple vs Single-Parent Households in Arriba
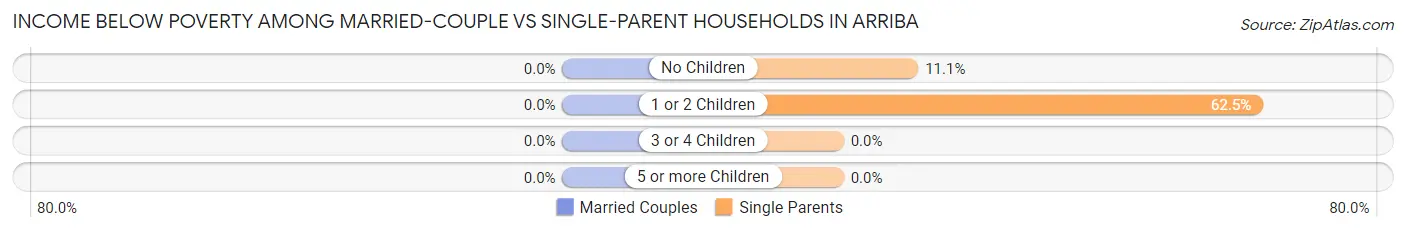
| Children | Married-Couple Families | Single-Parent Households |
| No Children | 0 (0.0%) | 1 (11.1%) |
| 1 or 2 Children | 0 (0.0%) | 5 (62.5%) |
| 3 or 4 Children | 0 (0.0%) | 0 (0.0%) |
| 5 or more Children | 0 (0.0%) | 0 (0.0%) |
| Total | 0 (0.0%) | 6 (35.3%) |
Race in Arriba
The most populous races in Arriba are White / Caucasian (205 | 87.2%), Native / Alaskan (15 | 6.4%), and Two or more Races (14 | 6.0%).
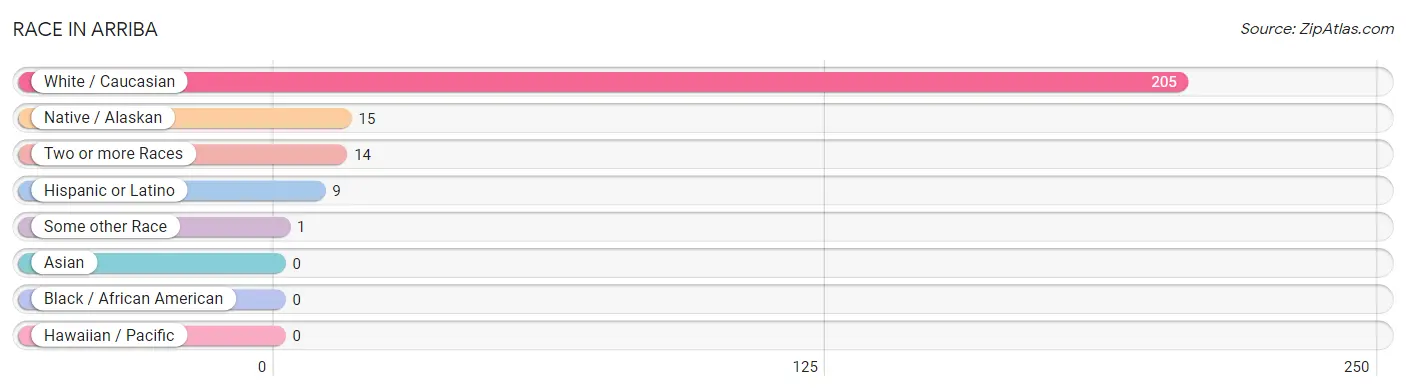
| Race | # Population | % Population |
| Asian | 0 | 0.0% |
| Black / African American | 0 | 0.0% |
| Hawaiian / Pacific | 0 | 0.0% |
| Hispanic or Latino | 9 | 3.8% |
| Native / Alaskan | 15 | 6.4% |
| White / Caucasian | 205 | 87.2% |
| Two or more Races | 14 | 6.0% |
| Some other Race | 1 | 0.4% |
| Total | 235 | 100.0% |
Ancestry in Arriba
The most populous ancestries reported in Arriba are German (90 | 38.3%), Irish (39 | 16.6%), Scottish (22 | 9.4%), Norwegian (15 | 6.4%), and French (11 | 4.7%), together accounting for 75.3% of all Arriba residents.
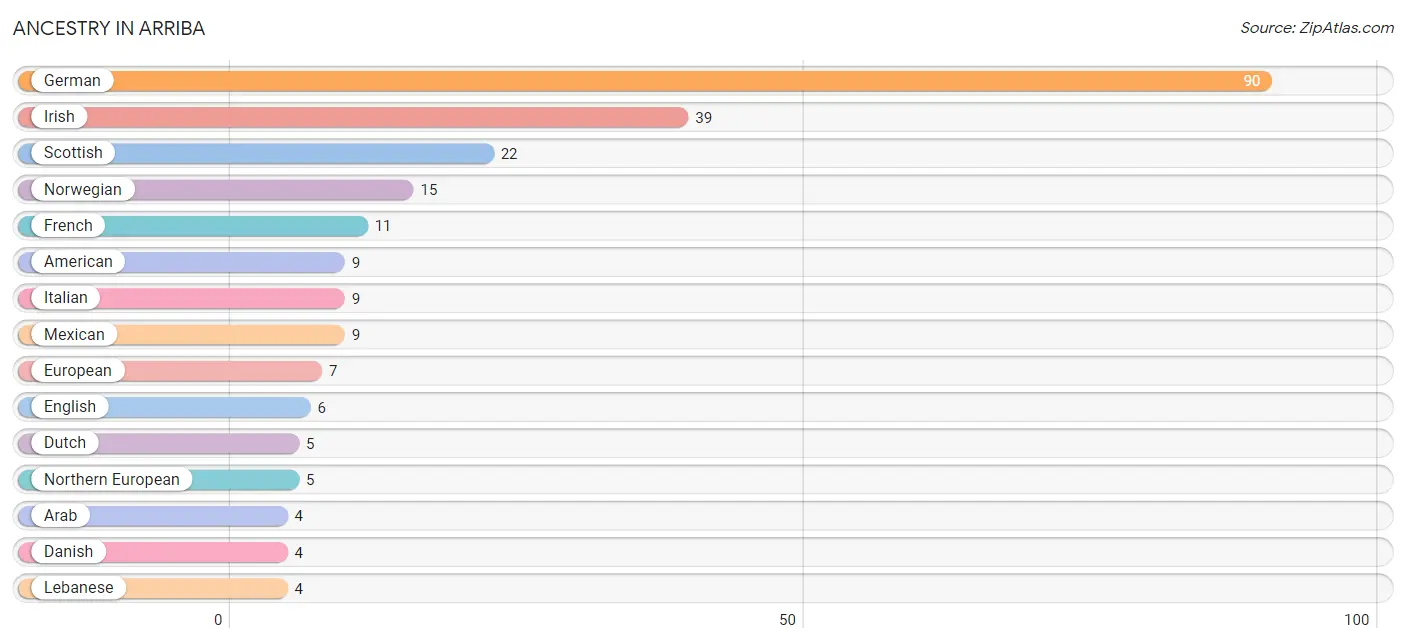
| Ancestry | # Population | % Population |
| American | 9 | 3.8% |
| Arab | 4 | 1.7% |
| Blackfeet | 2 | 0.9% |
| Danish | 4 | 1.7% |
| Dutch | 5 | 2.1% |
| English | 6 | 2.5% |
| European | 7 | 3.0% |
| French | 11 | 4.7% |
| German | 90 | 38.3% |
| Irish | 39 | 16.6% |
| Italian | 9 | 3.8% |
| Lebanese | 4 | 1.7% |
| Mexican | 9 | 3.8% |
| Northern European | 5 | 2.1% |
| Norwegian | 15 | 6.4% |
| Pennsylvania German | 1 | 0.4% |
| Scotch-Irish | 1 | 0.4% |
| Scottish | 22 | 9.4% | View All 18 Rows |
Immigrants in Arriba
The most numerous immigrant groups reported in Arriba came from Asia (1 | 0.4%), China (1 | 0.4%), and Eastern Asia (1 | 0.4%), together accounting for 1.3% of all Arriba residents.
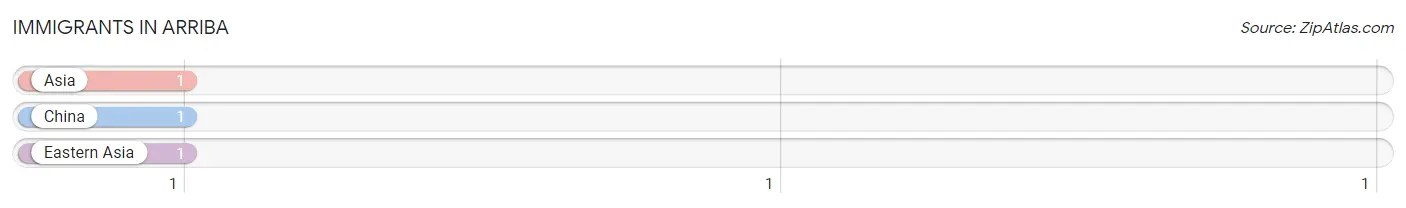
| Immigration Origin | # Population | % Population |
| Asia | 1 | 0.4% |
| China | 1 | 0.4% |
| Eastern Asia | 1 | 0.4% | View All 3 Rows |
Sex and Age in Arriba
Sex and Age in Arriba
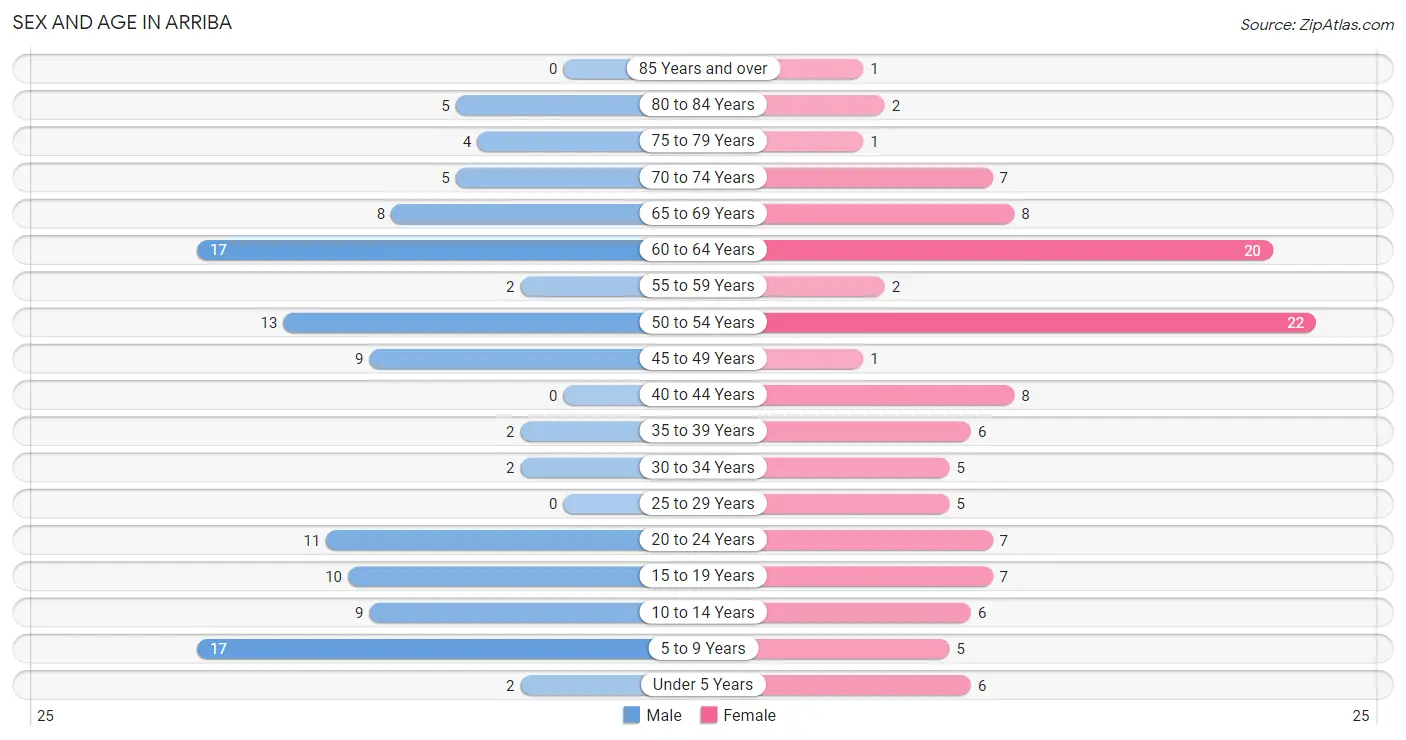
The most populous age groups in Arriba are 5 to 9 Years (17 | 14.7%) for men and 50 to 54 Years (22 | 18.5%) for women.
| Age Bracket | Male | Female |
| Under 5 Years | 2 (1.7%) | 6 (5.0%) |
| 5 to 9 Years | 17 (14.7%) | 5 (4.2%) |
| 10 to 14 Years | 9 (7.8%) | 6 (5.0%) |
| 15 to 19 Years | 10 (8.6%) | 7 (5.9%) |
| 20 to 24 Years | 11 (9.5%) | 7 (5.9%) |
| 25 to 29 Years | 0 (0.0%) | 5 (4.2%) |
| 30 to 34 Years | 2 (1.7%) | 5 (4.2%) |
| 35 to 39 Years | 2 (1.7%) | 6 (5.0%) |
| 40 to 44 Years | 0 (0.0%) | 8 (6.7%) |
| 45 to 49 Years | 9 (7.8%) | 1 (0.8%) |
| 50 to 54 Years | 13 (11.2%) | 22 (18.5%) |
| 55 to 59 Years | 2 (1.7%) | 2 (1.7%) |
| 60 to 64 Years | 17 (14.7%) | 20 (16.8%) |
| 65 to 69 Years | 8 (6.9%) | 8 (6.7%) |
| 70 to 74 Years | 5 (4.3%) | 7 (5.9%) |
| 75 to 79 Years | 4 (3.5%) | 1 (0.8%) |
| 80 to 84 Years | 5 (4.3%) | 2 (1.7%) |
| 85 Years and over | 0 (0.0%) | 1 (0.8%) |
| Total | 116 (100.0%) | 119 (100.0%) |
Families and Households in Arriba
Median Family Size in Arriba
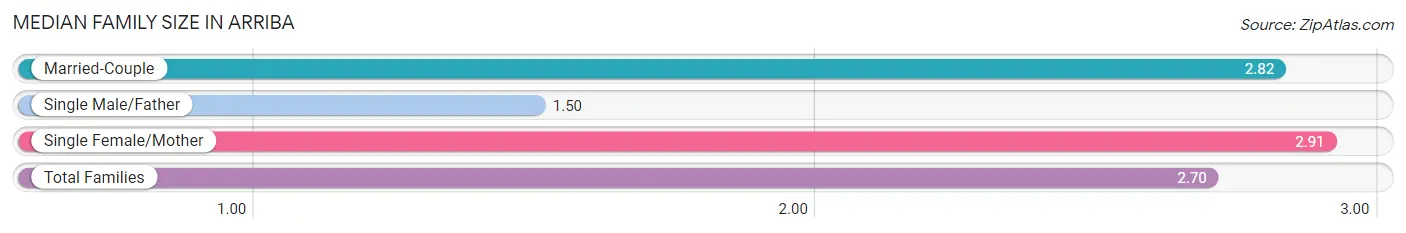
The median family size in Arriba is 2.70 persons per family, with single female/mother families (11 | 18.0%) accounting for the largest median family size of 2.91 persons per family. On the other hand, single male/father families (6 | 9.8%) represent the smallest median family size with 1.50 persons per family.
| Family Type | # Families | Family Size |
| Married-Couple | 44 (72.1%) | 2.82 |
| Single Male/Father | 6 (9.8%) | 1.50 |
| Single Female/Mother | 11 (18.0%) | 2.91 |
| Total Families | 61 (100.0%) | 2.70 |
Median Household Size in Arriba
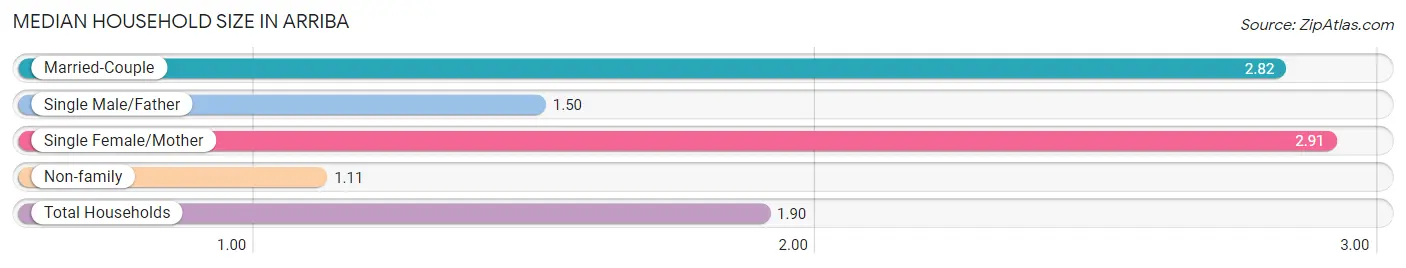
The median household size in Arriba is 1.90 persons per household, with single female/mother households (11 | 8.9%) accounting for the largest median household size of 2.91 persons per household. non-family households (63 | 50.8%) represent the smallest median household size with 1.11 persons per household.
| Household Type | # Households | Household Size |
| Married-Couple | 44 (35.5%) | 2.82 |
| Single Male/Father | 6 (4.8%) | 1.50 |
| Single Female/Mother | 11 (8.9%) | 2.91 |
| Non-family | 63 (50.8%) | 1.11 |
| Total Households | 124 (100.0%) | 1.90 |
Household Size by Marriage Status in Arriba
Out of a total of 124 households in Arriba, 61 (49.2%) are family households, while 63 (50.8%) are nonfamily households. The most numerous type of family households are 2-person households, comprising 34, and the most common type of nonfamily households are 1-person households, comprising 52.
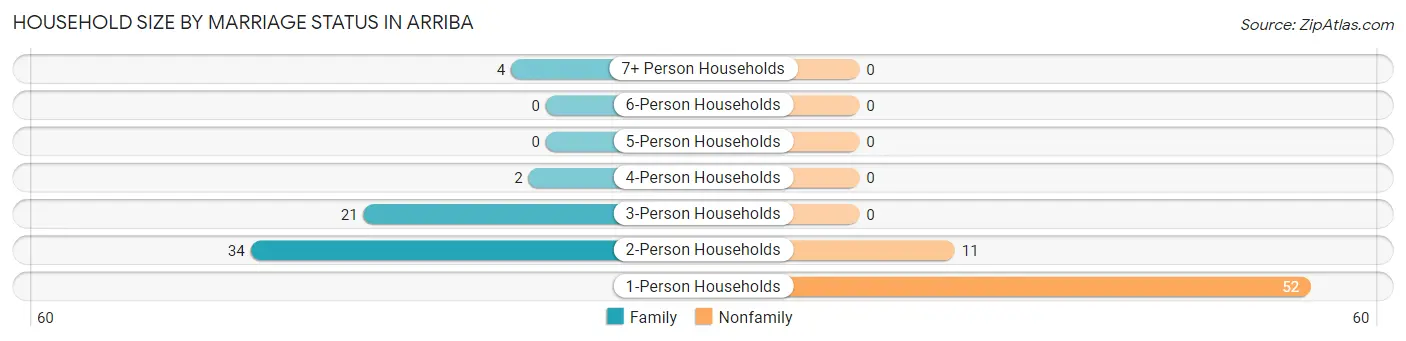
| Household Size | Family Households | Nonfamily Households |
| 1-Person Households | - | 52 (41.9%) |
| 2-Person Households | 34 (27.4%) | 11 (8.9%) |
| 3-Person Households | 21 (16.9%) | 0 (0.0%) |
| 4-Person Households | 2 (1.6%) | 0 (0.0%) |
| 5-Person Households | 0 (0.0%) | 0 (0.0%) |
| 6-Person Households | 0 (0.0%) | 0 (0.0%) |
| 7+ Person Households | 4 (3.2%) | 0 (0.0%) |
| Total | 61 (49.2%) | 63 (50.8%) |
Female Fertility in Arriba
Fertility by Age in Arriba
| Age Bracket | Women with Births | Births / 1,000 Women |
| 15 to 19 years | 0 (0.0%) | 0.0 |
| 20 to 34 years | 0 (0.0%) | 0.0 |
| 35 to 50 years | 0 (0.0%) | 0.0 |
| Total | 0 (0.0%) | 0.0 |
Fertility by Age by Marriage Status in Arriba
| Age Bracket | Married | Unmarried |
| 15 to 19 years | 0 (0.0%) | 0 (0.0%) |
| 20 to 34 years | 0 (0.0%) | 0 (0.0%) |
| 35 to 50 years | 0 (0.0%) | 0 (0.0%) |
| Total | 0 (0.0%) | 0 (0.0%) |
Fertility by Education in Arriba
| Educational Attainment | Women with Births | Births / 1,000 Women |
| Less than High School | 0 (0.0%) | 0.0 |
| High School Diploma | 0 (0.0%) | 0.0 |
| College or Associate's Degree | 0 (0.0%) | 0.0 |
| Bachelor's Degree | 0 (0.0%) | 0.0 |
| Graduate Degree | 0 (0.0%) | 0.0 |
| Total | 0 (0.0%) | 0.0 |
Fertility by Education by Marriage Status in Arriba
| Educational Attainment | Married | Unmarried |
| Less than High School | 0 (0.0%) | 0 (0.0%) |
| High School Diploma | 0 (0.0%) | 0 (0.0%) |
| College or Associate's Degree | 0 (0.0%) | 0 (0.0%) |
| Bachelor's Degree | 0 (0.0%) | 0 (0.0%) |
| Graduate Degree | 0 (0.0%) | 0 (0.0%) |
| Total | 0 (0.0%) | 0 (0.0%) |
Employment Characteristics in Arriba
Employment by Class of Employer in Arriba
Among the 100 employed individuals in Arriba, private company employees (57 | 57.0%), self-employed (incorporated) (13 | 13.0%), and local government employees (12 | 12.0%) make up the most common classes of employment.
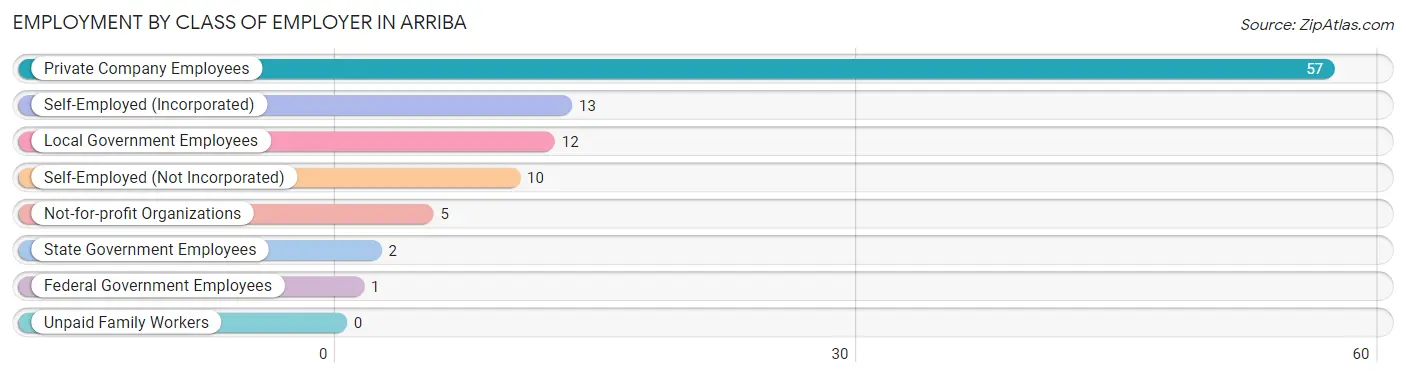
| Employer Class | # Employees | % Employees |
| Private Company Employees | 57 | 57.0% |
| Self-Employed (Incorporated) | 13 | 13.0% |
| Self-Employed (Not Incorporated) | 10 | 10.0% |
| Not-for-profit Organizations | 5 | 5.0% |
| Local Government Employees | 12 | 12.0% |
| State Government Employees | 2 | 2.0% |
| Federal Government Employees | 1 | 1.0% |
| Unpaid Family Workers | 0 | 0.0% |
| Total | 100 | 100.0% |
Employment Status by Age in Arriba
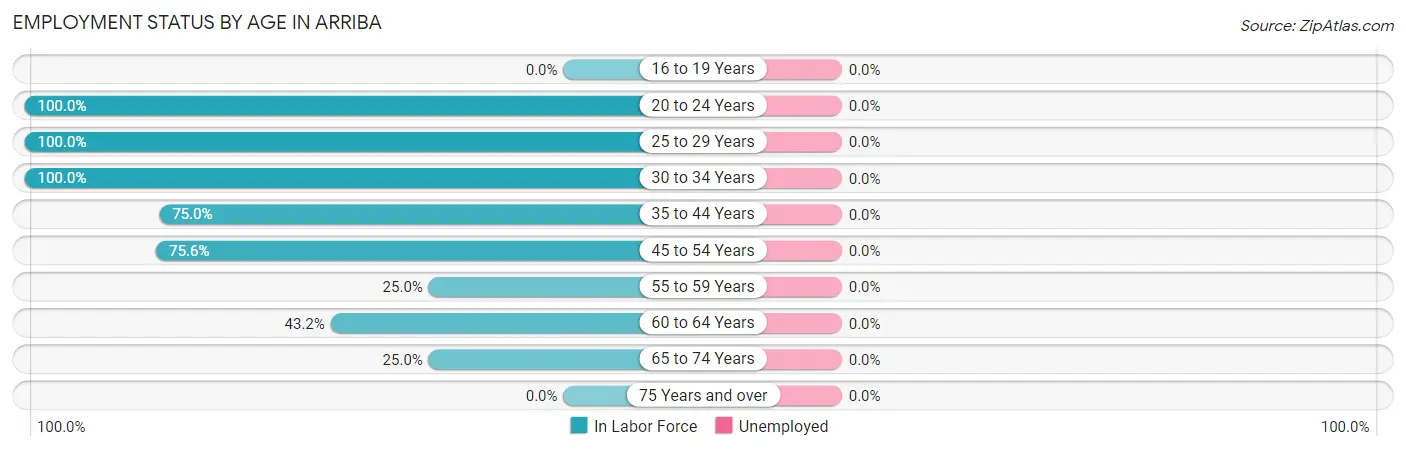
| Age Bracket | In Labor Force | Unemployed |
| 16 to 19 Years | 0 (0.0%) | 0 (0.0%) |
| 20 to 24 Years | 18 (100.0%) | 0 (0.0%) |
| 25 to 29 Years | 5 (100.0%) | 0 (0.0%) |
| 30 to 34 Years | 7 (100.0%) | 0 (0.0%) |
| 35 to 44 Years | 12 (75.0%) | 0 (0.0%) |
| 45 to 54 Years | 34 (75.6%) | 0 (0.0%) |
| 55 to 59 Years | 1 (25.0%) | 0 (0.0%) |
| 60 to 64 Years | 16 (43.2%) | 0 (0.0%) |
| 65 to 74 Years | 7 (25.0%) | 0 (0.0%) |
| 75 Years and over | 0 (0.0%) | 0 (0.0%) |
| Total | 100 (57.8%) | 0 (0.0%) |
Employment Status by Educational Attainment in Arriba
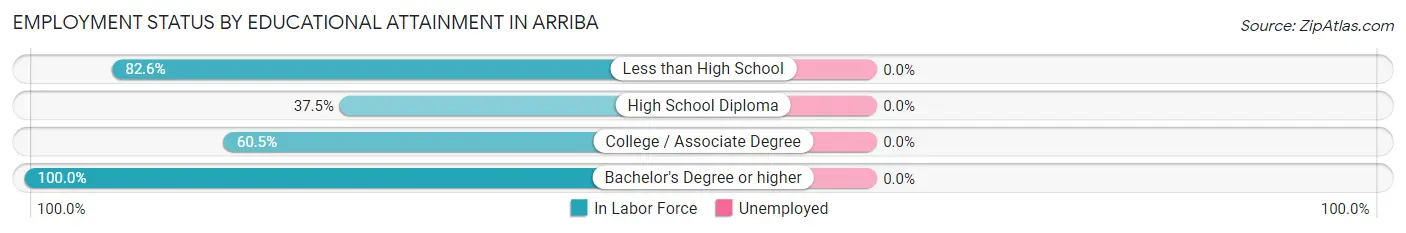
| Educational Attainment | In Labor Force | Unemployed |
| Less than High School | 19 (82.6%) | 0 (0.0%) |
| High School Diploma | 12 (37.5%) | 0 (0.0%) |
| College / Associate Degree | 23 (60.5%) | 0 (0.0%) |
| Bachelor's Degree or higher | 21 (100.0%) | 0 (0.0%) |
| Total | 75 (65.8%) | 0 (0.0%) |
Employment Occupations by Sex in Arriba
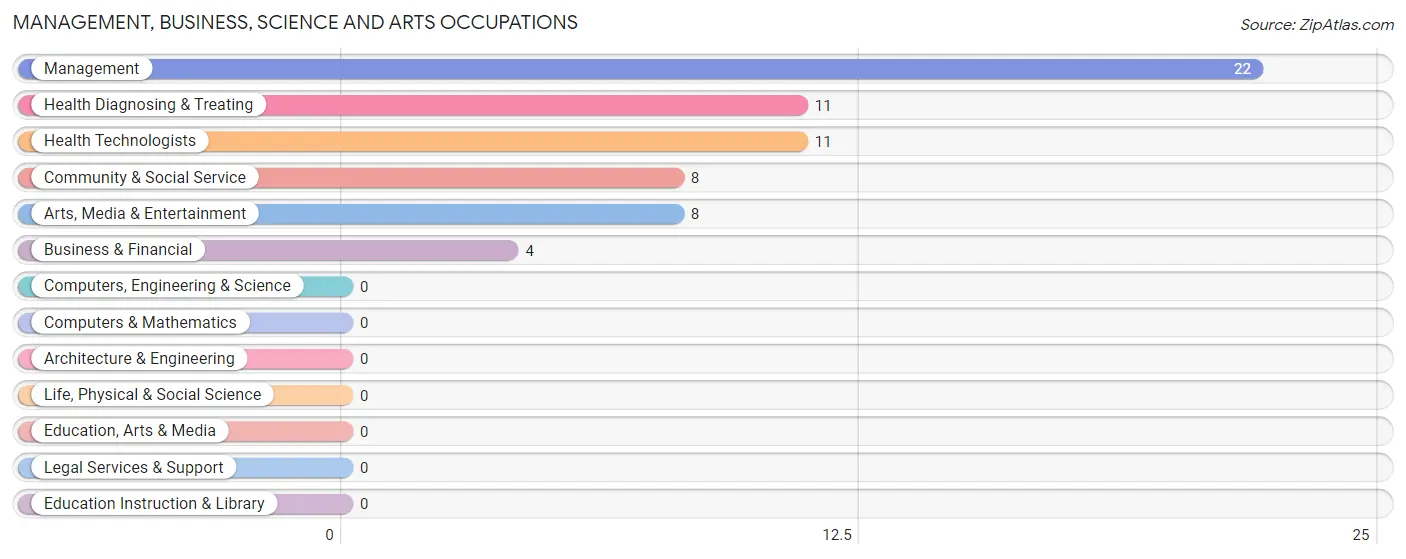
Management, Business, Science and Arts Occupations
The most common Management, Business, Science and Arts occupations in Arriba are Management (22 | 22.0%), Health Diagnosing & Treating (11 | 11.0%), Health Technologists (11 | 11.0%), Community & Social Service (8 | 8.0%), and Arts, Media & Entertainment (8 | 8.0%).
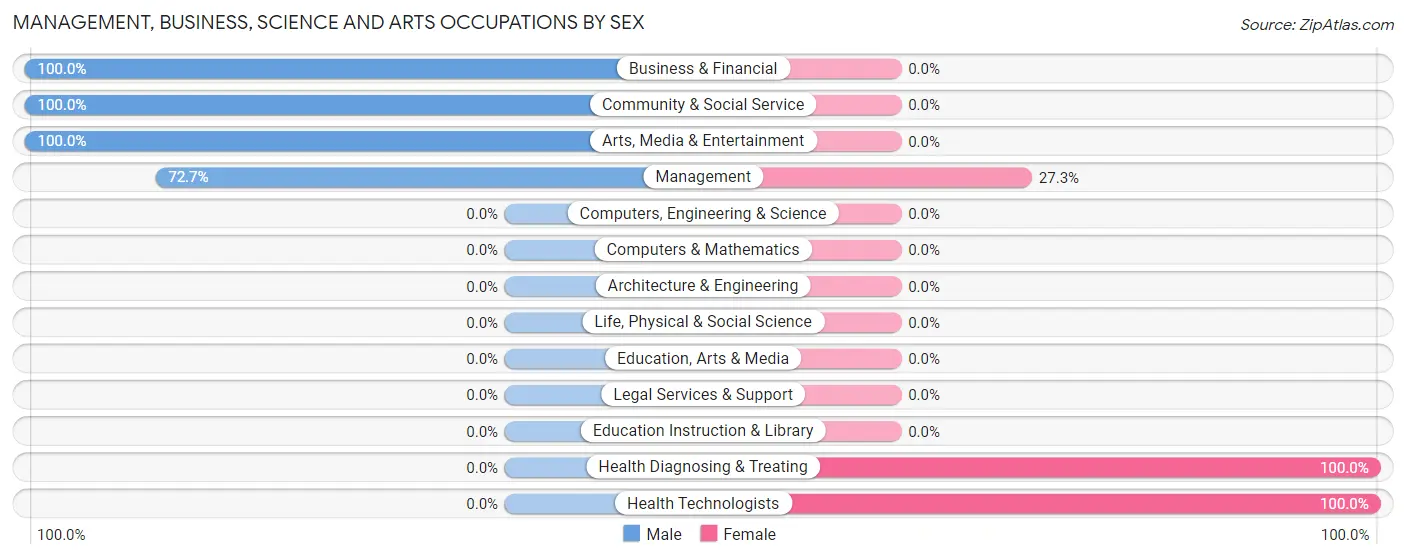
Management, Business, Science and Arts Occupations by Sex
Within the Management, Business, Science and Arts occupations in Arriba, the most male-oriented occupations are Business & Financial (100.0%), Community & Social Service (100.0%), and Arts, Media & Entertainment (100.0%), while the most female-oriented occupations are Health Diagnosing & Treating (100.0%), Health Technologists (100.0%), and Management (27.3%).
| Occupation | Male | Female |
| Management | 16 (72.7%) | 6 (27.3%) |
| Business & Financial | 4 (100.0%) | 0 (0.0%) |
| Computers, Engineering & Science | 0 (0.0%) | 0 (0.0%) |
| Computers & Mathematics | 0 (0.0%) | 0 (0.0%) |
| Architecture & Engineering | 0 (0.0%) | 0 (0.0%) |
| Life, Physical & Social Science | 0 (0.0%) | 0 (0.0%) |
| Community & Social Service | 8 (100.0%) | 0 (0.0%) |
| Education, Arts & Media | 0 (0.0%) | 0 (0.0%) |
| Legal Services & Support | 0 (0.0%) | 0 (0.0%) |
| Education Instruction & Library | 0 (0.0%) | 0 (0.0%) |
| Arts, Media & Entertainment | 8 (100.0%) | 0 (0.0%) |
| Health Diagnosing & Treating | 0 (0.0%) | 11 (100.0%) |
| Health Technologists | 0 (0.0%) | 11 (100.0%) |
| Total (Category) | 28 (62.2%) | 17 (37.8%) |
| Total (Overall) | 53 (53.0%) | 47 (47.0%) |
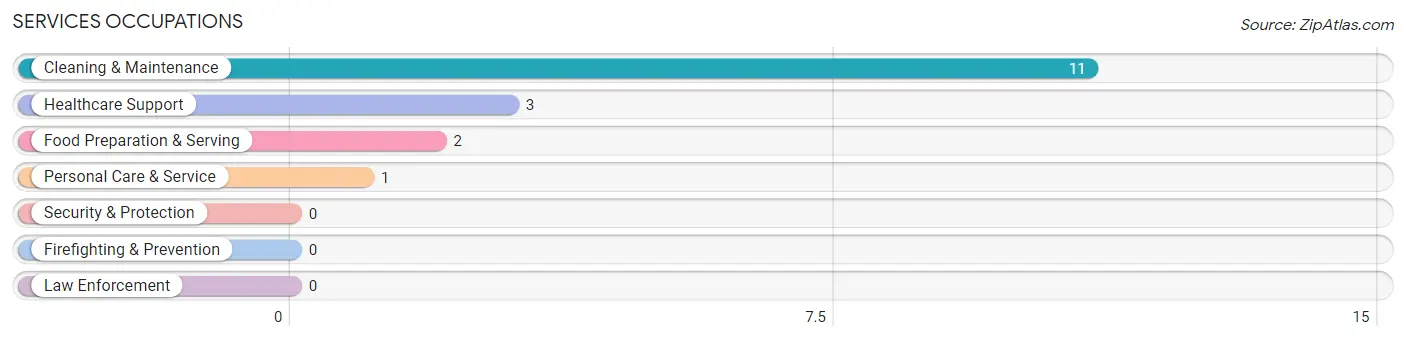
Services Occupations
The most common Services occupations in Arriba are Cleaning & Maintenance (11 | 11.0%), Healthcare Support (3 | 3.0%), Food Preparation & Serving (2 | 2.0%), and Personal Care & Service (1 | 1.0%).
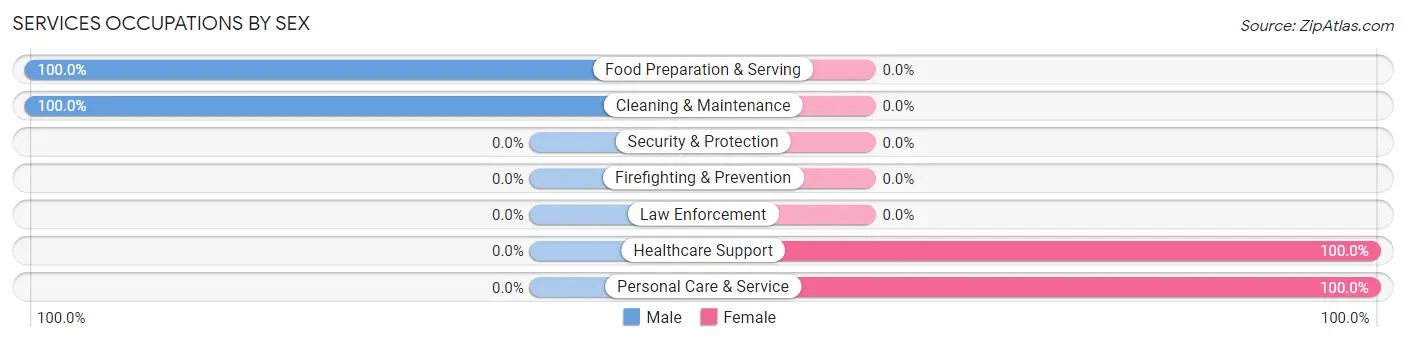
Services Occupations by Sex
Within the Services occupations in Arriba, the most male-oriented occupations are Food Preparation & Serving (100.0%), and Cleaning & Maintenance (100.0%), while the most female-oriented occupations are Healthcare Support (100.0%), and Personal Care & Service (100.0%).
| Occupation | Male | Female |
| Healthcare Support | 0 (0.0%) | 3 (100.0%) |
| Security & Protection | 0 (0.0%) | 0 (0.0%) |
| Firefighting & Prevention | 0 (0.0%) | 0 (0.0%) |
| Law Enforcement | 0 (0.0%) | 0 (0.0%) |
| Food Preparation & Serving | 2 (100.0%) | 0 (0.0%) |
| Cleaning & Maintenance | 11 (100.0%) | 0 (0.0%) |
| Personal Care & Service | 0 (0.0%) | 1 (100.0%) |
| Total (Category) | 13 (76.5%) | 4 (23.5%) |
| Total (Overall) | 53 (53.0%) | 47 (47.0%) |
Sales and Office Occupations
The most common Sales and Office occupations in Arriba are Sales & Related (13 | 13.0%), and Office & Administration (11 | 11.0%).
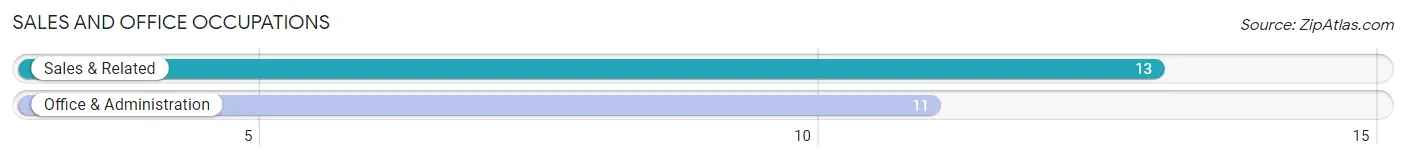
Sales and Office Occupations by Sex
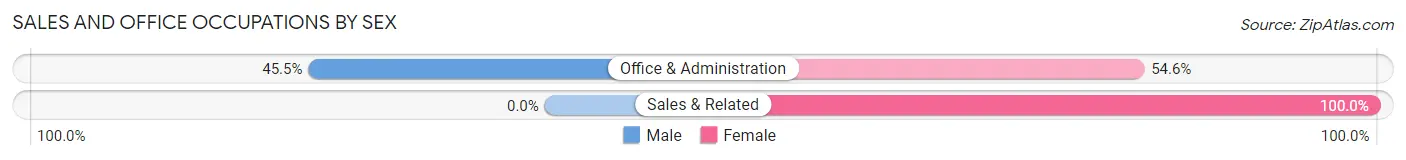
| Occupation | Male | Female |
| Sales & Related | 0 (0.0%) | 13 (100.0%) |
| Office & Administration | 5 (45.5%) | 6 (54.5%) |
| Total (Category) | 5 (20.8%) | 19 (79.2%) |
| Total (Overall) | 53 (53.0%) | 47 (47.0%) |
Natural Resources, Construction and Maintenance Occupations
The most common Natural Resources, Construction and Maintenance occupations in Arriba are Construction & Extraction (7 | 7.0%), and Farming, Fishing & Forestry (4 | 4.0%).
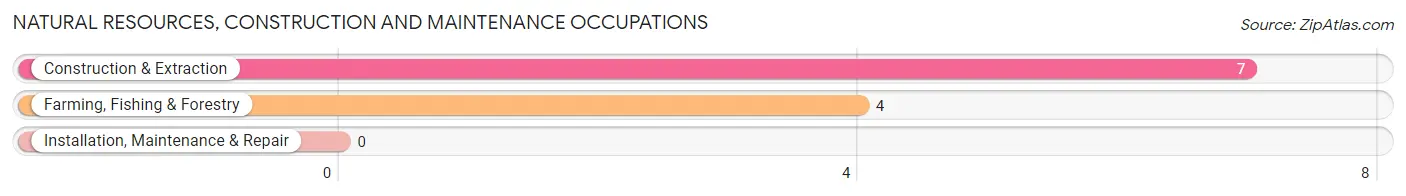
Natural Resources, Construction and Maintenance Occupations by Sex
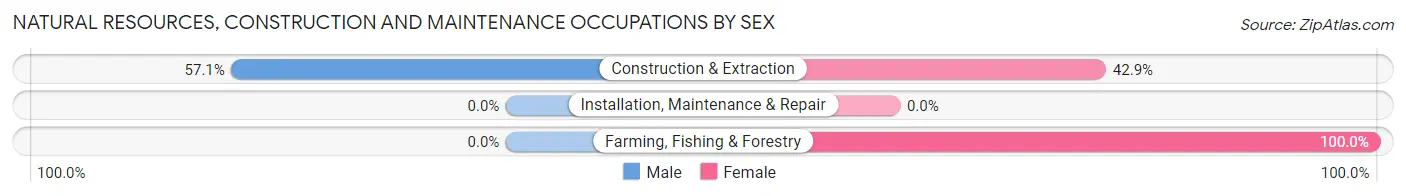
| Occupation | Male | Female |
| Farming, Fishing & Forestry | 0 (0.0%) | 4 (100.0%) |
| Construction & Extraction | 4 (57.1%) | 3 (42.9%) |
| Installation, Maintenance & Repair | 0 (0.0%) | 0 (0.0%) |
| Total (Category) | 4 (36.4%) | 7 (63.6%) |
| Total (Overall) | 53 (53.0%) | 47 (47.0%) |
Production, Transportation and Moving Occupations
The most common Production, Transportation and Moving occupations in Arriba are Transportation (2 | 2.0%), and Material Moving (1 | 1.0%).
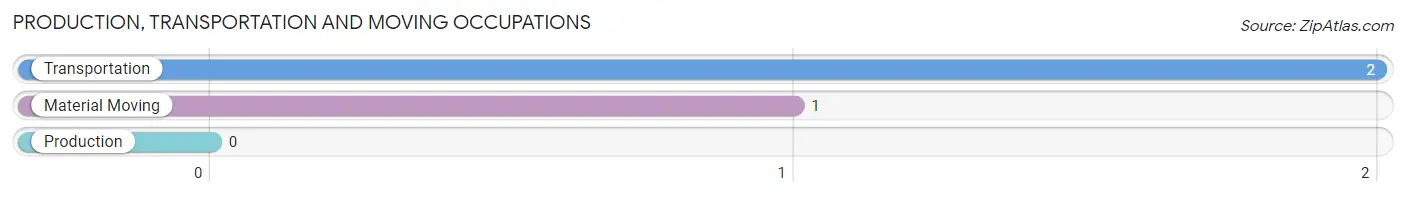
Production, Transportation and Moving Occupations by Sex
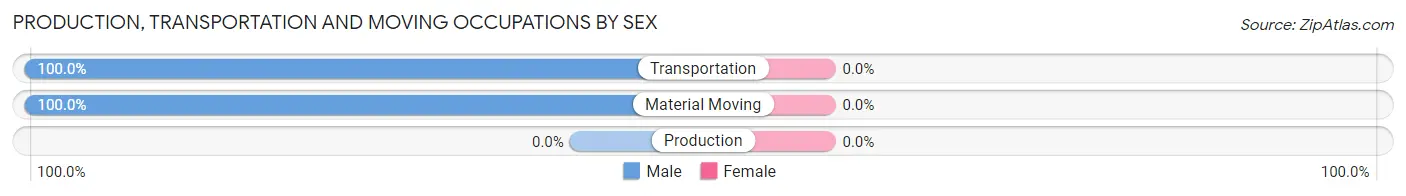
| Occupation | Male | Female |
| Production | 0 (0.0%) | 0 (0.0%) |
| Transportation | 2 (100.0%) | 0 (0.0%) |
| Material Moving | 1 (100.0%) | 0 (0.0%) |
| Total (Category) | 3 (100.0%) | 0 (0.0%) |
| Total (Overall) | 53 (53.0%) | 47 (47.0%) |
Employment Industries by Sex in Arriba
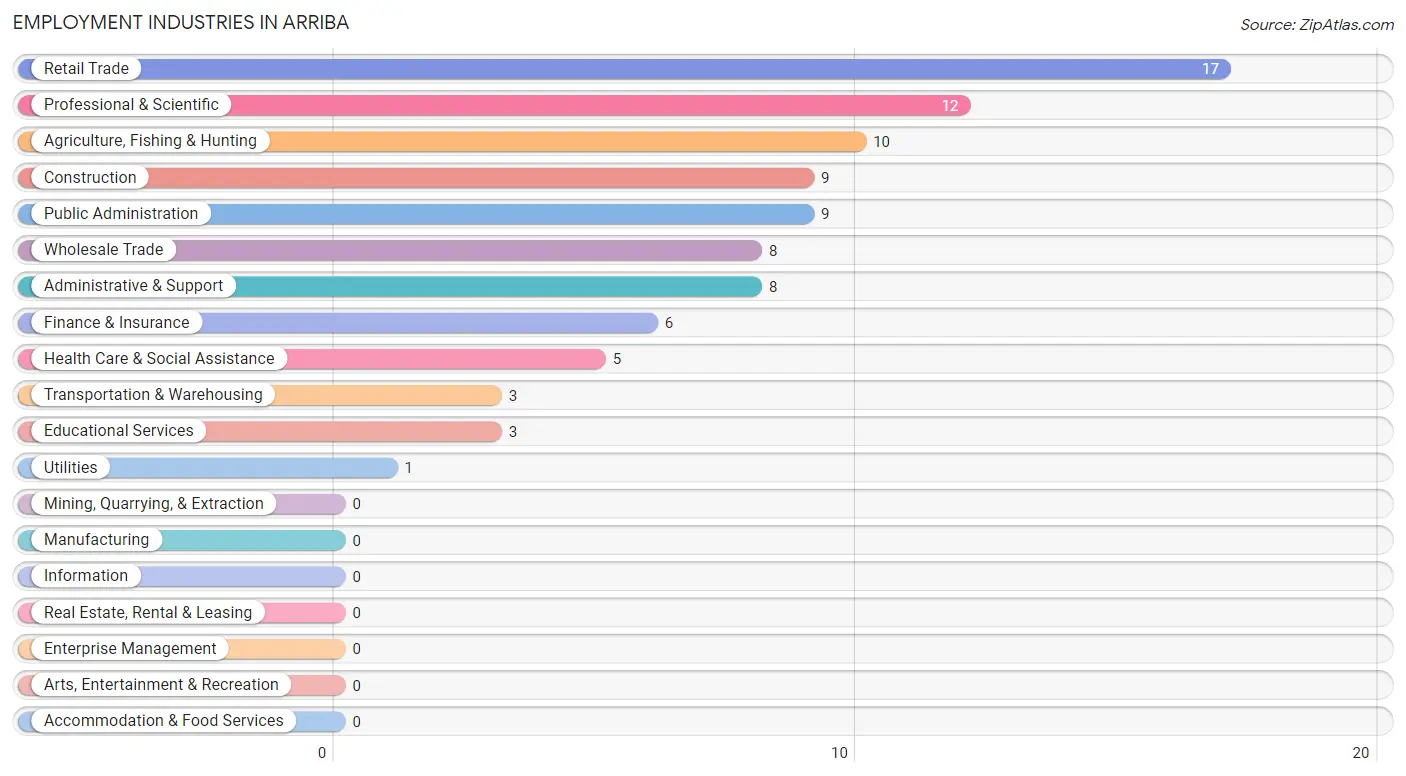
Employment Industries in Arriba
The major employment industries in Arriba include Retail Trade (17 | 17.0%), Professional & Scientific (12 | 12.0%), Agriculture, Fishing & Hunting (10 | 10.0%), Construction (9 | 9.0%), and Public Administration (9 | 9.0%).
Employment Industries by Sex in Arriba
The Arriba industries that see more men than women are Administrative & Support (100.0%), Educational Services (100.0%), and Public Administration (100.0%), whereas the industries that tend to have a higher number of women are Utilities (100.0%), Professional & Scientific (100.0%), and Retail Trade (82.4%).
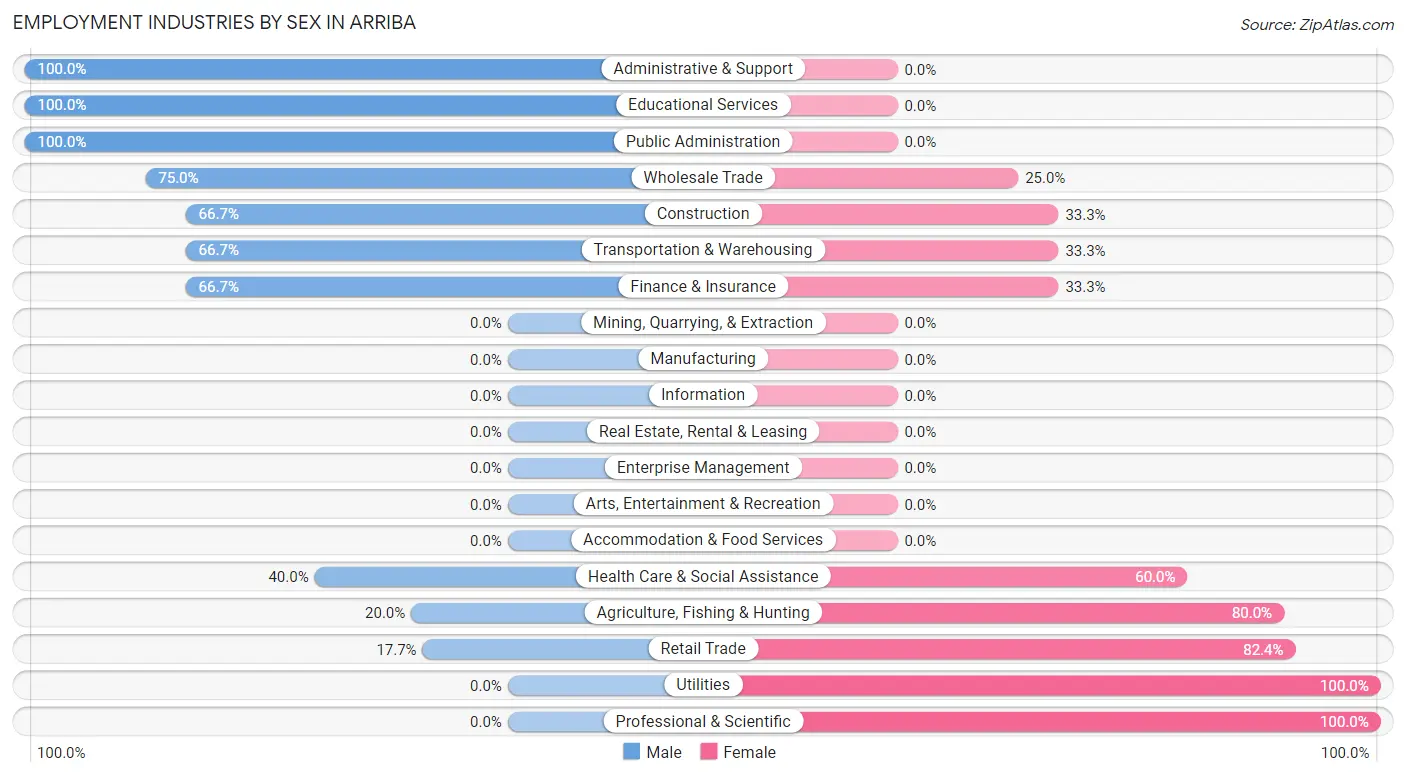
| Industry | Male | Female |
| Agriculture, Fishing & Hunting | 2 (20.0%) | 8 (80.0%) |
| Mining, Quarrying, & Extraction | 0 (0.0%) | 0 (0.0%) |
| Construction | 6 (66.7%) | 3 (33.3%) |
| Manufacturing | 0 (0.0%) | 0 (0.0%) |
| Wholesale Trade | 6 (75.0%) | 2 (25.0%) |
| Retail Trade | 3 (17.6%) | 14 (82.4%) |
| Transportation & Warehousing | 2 (66.7%) | 1 (33.3%) |
| Utilities | 0 (0.0%) | 1 (100.0%) |
| Information | 0 (0.0%) | 0 (0.0%) |
| Finance & Insurance | 4 (66.7%) | 2 (33.3%) |
| Real Estate, Rental & Leasing | 0 (0.0%) | 0 (0.0%) |
| Professional & Scientific | 0 (0.0%) | 12 (100.0%) |
| Enterprise Management | 0 (0.0%) | 0 (0.0%) |
| Administrative & Support | 8 (100.0%) | 0 (0.0%) |
| Educational Services | 3 (100.0%) | 0 (0.0%) |
| Health Care & Social Assistance | 2 (40.0%) | 3 (60.0%) |
| Arts, Entertainment & Recreation | 0 (0.0%) | 0 (0.0%) |
| Accommodation & Food Services | 0 (0.0%) | 0 (0.0%) |
| Public Administration | 9 (100.0%) | 0 (0.0%) |
| Total | 53 (53.0%) | 47 (47.0%) |
Education in Arriba
School Enrollment in Arriba
The most common levels of schooling among the 66 students in Arriba are elementary school (26 | 39.4%), high school (17 | 25.8%), and middle school (9 | 13.6%).
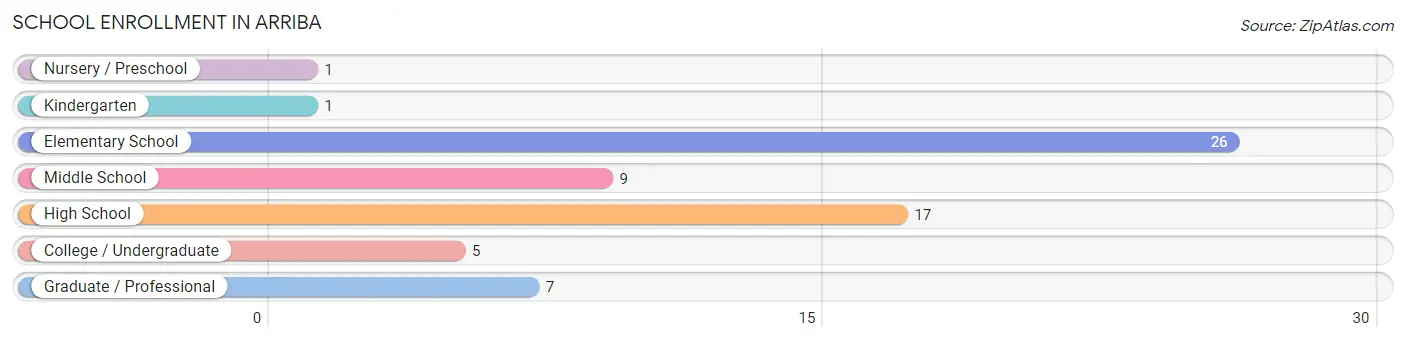
| School Level | # Students | % Students |
| Nursery / Preschool | 1 | 1.5% |
| Kindergarten | 1 | 1.5% |
| Elementary School | 26 | 39.4% |
| Middle School | 9 | 13.6% |
| High School | 17 | 25.8% |
| College / Undergraduate | 5 | 7.6% |
| Graduate / Professional | 7 | 10.6% |
| Total | 66 | 100.0% |
School Enrollment by Age by Funding Source in Arriba
Out of a total of 66 students who are enrolled in schools in Arriba, 3 (4.5%) attend a private institution, while the remaining 63 (95.5%) are enrolled in public schools. The age group of 20 to 24 year olds has the highest likelihood of being enrolled in private schools, with 3 (25.0% in the age bracket) enrolled. Conversely, the age group of 5 to 9 year old has the lowest likelihood of being enrolled in a private school, with 22 (100.0% in the age bracket) attending a public institution.
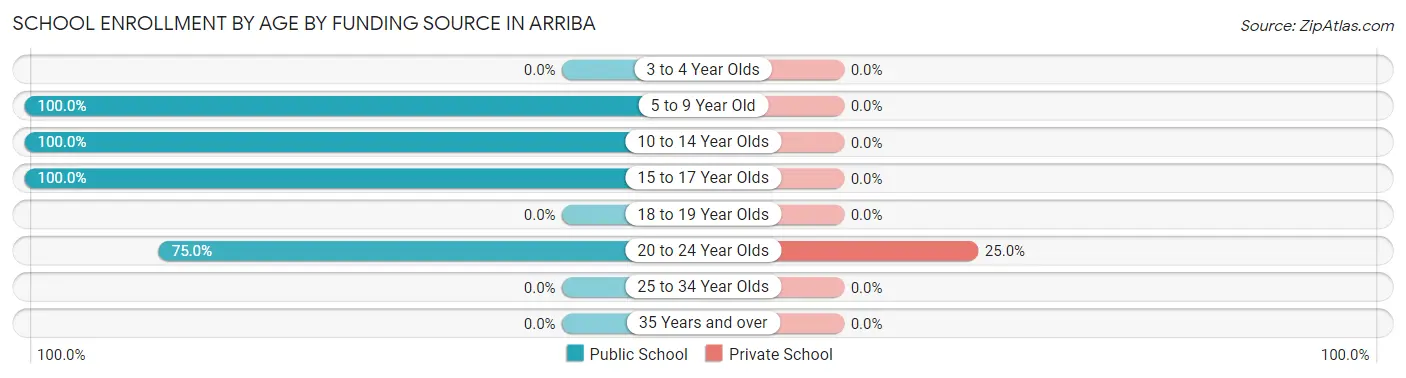
| Age Bracket | Public School | Private School |
| 3 to 4 Year Olds | 0 (0.0%) | 0 (0.0%) |
| 5 to 9 Year Old | 22 (100.0%) | 0 (0.0%) |
| 10 to 14 Year Olds | 15 (100.0%) | 0 (0.0%) |
| 15 to 17 Year Olds | 17 (100.0%) | 0 (0.0%) |
| 18 to 19 Year Olds | 0 (0.0%) | 0 (0.0%) |
| 20 to 24 Year Olds | 9 (75.0%) | 3 (25.0%) |
| 25 to 34 Year Olds | 0 (0.0%) | 0 (0.0%) |
| 35 Years and over | 0 (0.0%) | 0 (0.0%) |
| Total | 63 (95.5%) | 3 (4.5%) |
Educational Attainment by Field of Study in Arriba
Bio, nature & agricultural (20 | 64.5%), engineering (3 | 9.7%), visual & performing arts (3 | 9.7%), education (2 | 6.5%), and computers & mathematics (1 | 3.2%) are the most common fields of study among 31 individuals in Arriba who have obtained a bachelor's degree or higher.
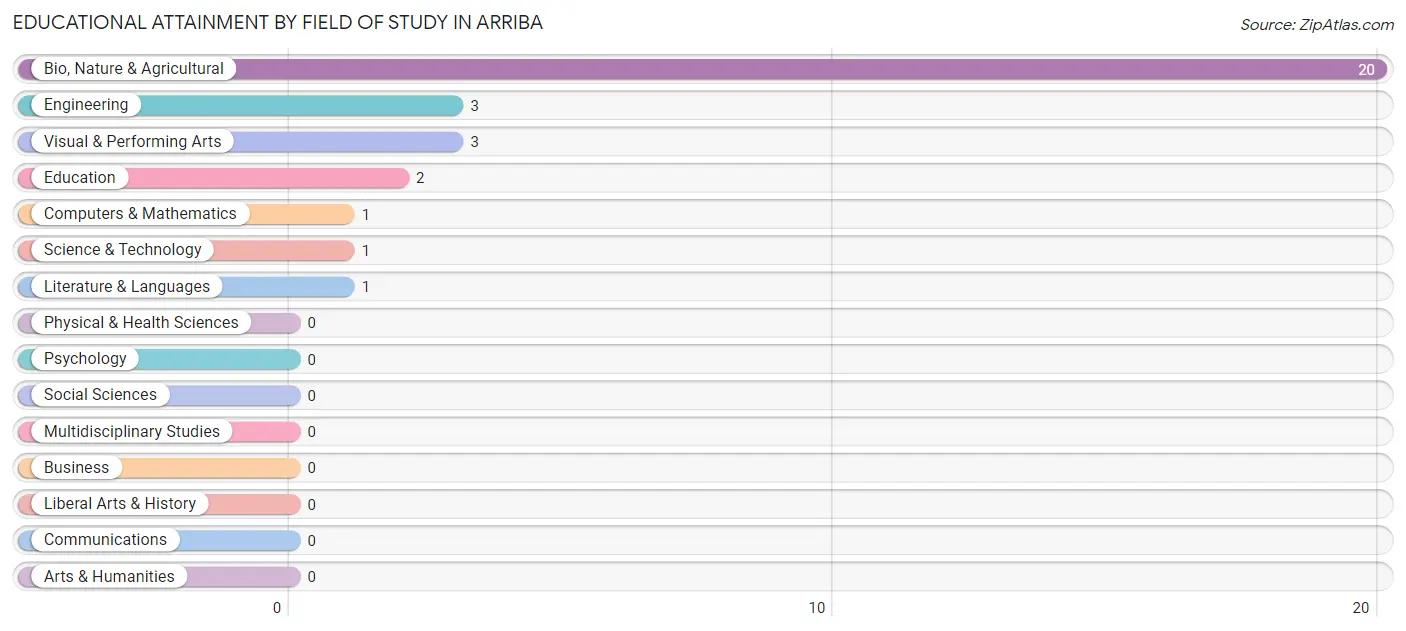
| Field of Study | # Graduates | % Graduates |
| Computers & Mathematics | 1 | 3.2% |
| Bio, Nature & Agricultural | 20 | 64.5% |
| Physical & Health Sciences | 0 | 0.0% |
| Psychology | 0 | 0.0% |
| Social Sciences | 0 | 0.0% |
| Engineering | 3 | 9.7% |
| Multidisciplinary Studies | 0 | 0.0% |
| Science & Technology | 1 | 3.2% |
| Business | 0 | 0.0% |
| Education | 2 | 6.5% |
| Literature & Languages | 1 | 3.2% |
| Liberal Arts & History | 0 | 0.0% |
| Visual & Performing Arts | 3 | 9.7% |
| Communications | 0 | 0.0% |
| Arts & Humanities | 0 | 0.0% |
| Total | 31 | 100.0% |
Transportation & Commute in Arriba
Vehicle Availability by Sex in Arriba
The most prevalent vehicle ownership categories in Arriba are males with 1 vehicle (18, accounting for 34.0%) and females with 1 vehicle (11, making up 38.3%).
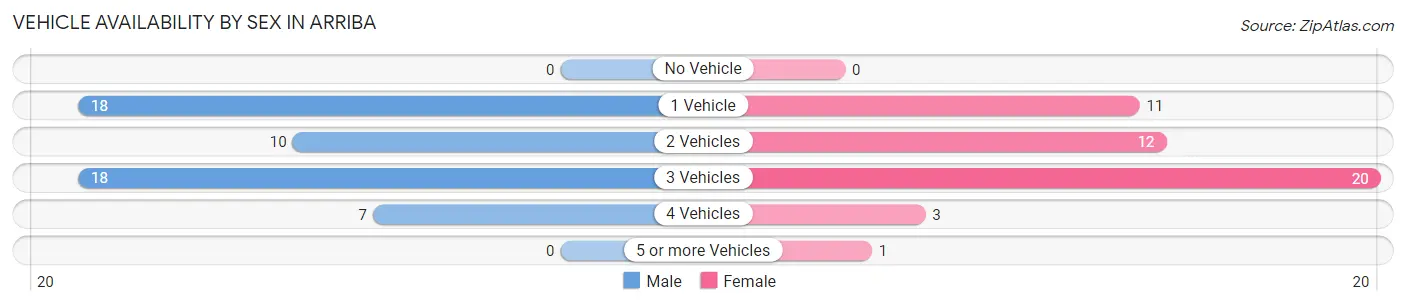
| Vehicles Available | Male | Female |
| No Vehicle | 0 (0.0%) | 0 (0.0%) |
| 1 Vehicle | 18 (34.0%) | 11 (23.4%) |
| 2 Vehicles | 10 (18.9%) | 12 (25.5%) |
| 3 Vehicles | 18 (34.0%) | 20 (42.5%) |
| 4 Vehicles | 7 (13.2%) | 3 (6.4%) |
| 5 or more Vehicles | 0 (0.0%) | 1 (2.1%) |
| Total | 53 (100.0%) | 47 (100.0%) |
Commute Time in Arriba
The most frequently occuring commute durations in Arriba are 25 to 29 minutes (23 commuters, 26.7%), less than 5 minutes (13 commuters, 15.1%), and 15 to 19 minutes (11 commuters, 12.8%).
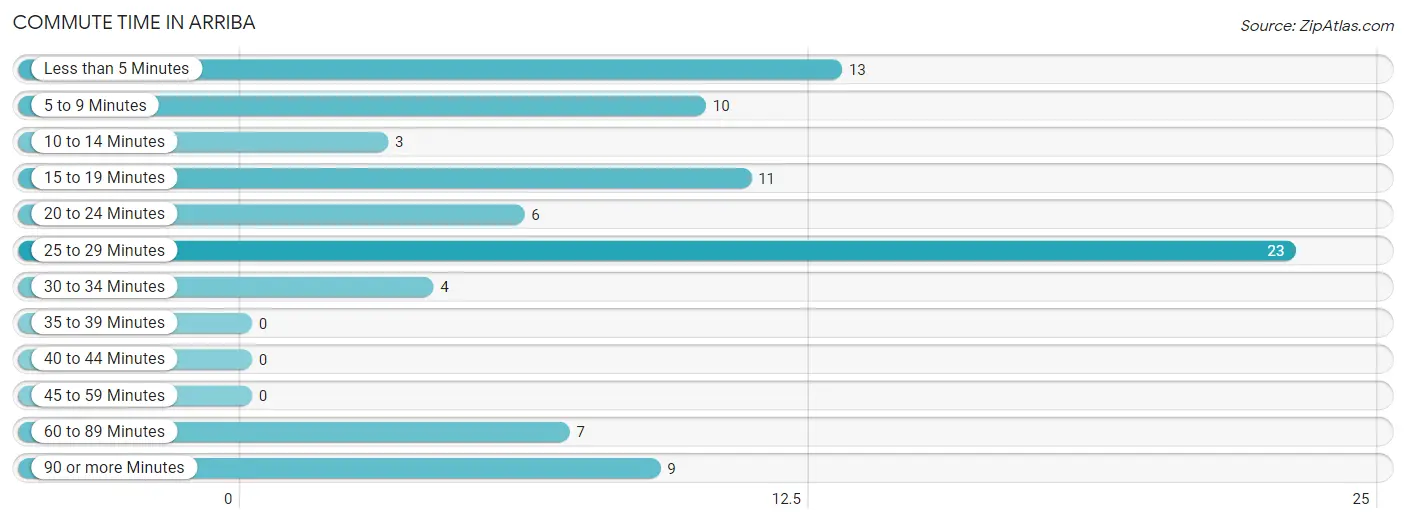
| Commute Time | # Commuters | % Commuters |
| Less than 5 Minutes | 13 | 15.1% |
| 5 to 9 Minutes | 10 | 11.6% |
| 10 to 14 Minutes | 3 | 3.5% |
| 15 to 19 Minutes | 11 | 12.8% |
| 20 to 24 Minutes | 6 | 7.0% |
| 25 to 29 Minutes | 23 | 26.7% |
| 30 to 34 Minutes | 4 | 4.6% |
| 35 to 39 Minutes | 0 | 0.0% |
| 40 to 44 Minutes | 0 | 0.0% |
| 45 to 59 Minutes | 0 | 0.0% |
| 60 to 89 Minutes | 7 | 8.1% |
| 90 or more Minutes | 9 | 10.5% |
Commute Time by Sex in Arriba
The most common commute times in Arriba are 25 to 29 minutes (9 commuters, 20.0%) for males and 25 to 29 minutes (14 commuters, 34.2%) for females.
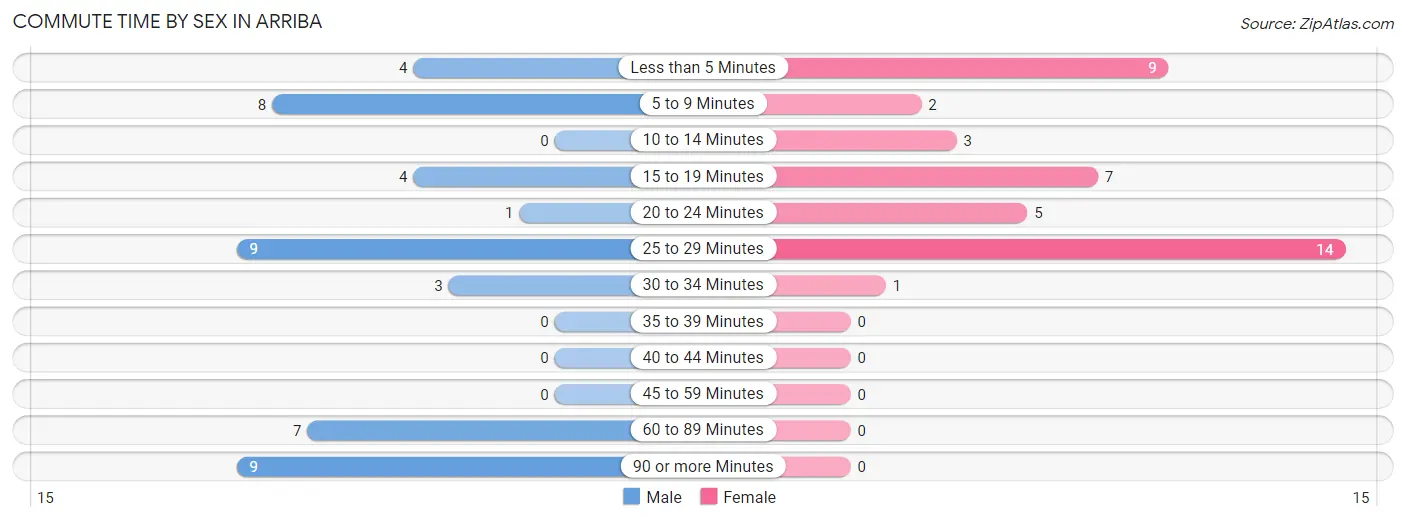
| Commute Time | Male | Female |
| Less than 5 Minutes | 4 (8.9%) | 9 (22.0%) |
| 5 to 9 Minutes | 8 (17.8%) | 2 (4.9%) |
| 10 to 14 Minutes | 0 (0.0%) | 3 (7.3%) |
| 15 to 19 Minutes | 4 (8.9%) | 7 (17.1%) |
| 20 to 24 Minutes | 1 (2.2%) | 5 (12.2%) |
| 25 to 29 Minutes | 9 (20.0%) | 14 (34.2%) |
| 30 to 34 Minutes | 3 (6.7%) | 1 (2.4%) |
| 35 to 39 Minutes | 0 (0.0%) | 0 (0.0%) |
| 40 to 44 Minutes | 0 (0.0%) | 0 (0.0%) |
| 45 to 59 Minutes | 0 (0.0%) | 0 (0.0%) |
| 60 to 89 Minutes | 7 (15.6%) | 0 (0.0%) |
| 90 or more Minutes | 9 (20.0%) | 0 (0.0%) |
Time of Departure to Work by Sex in Arriba
The most frequent times of departure to work in Arriba are 7:00 AM to 7:29 AM (23, 51.1%) for males and 7:00 AM to 7:29 AM (24, 58.5%) for females.
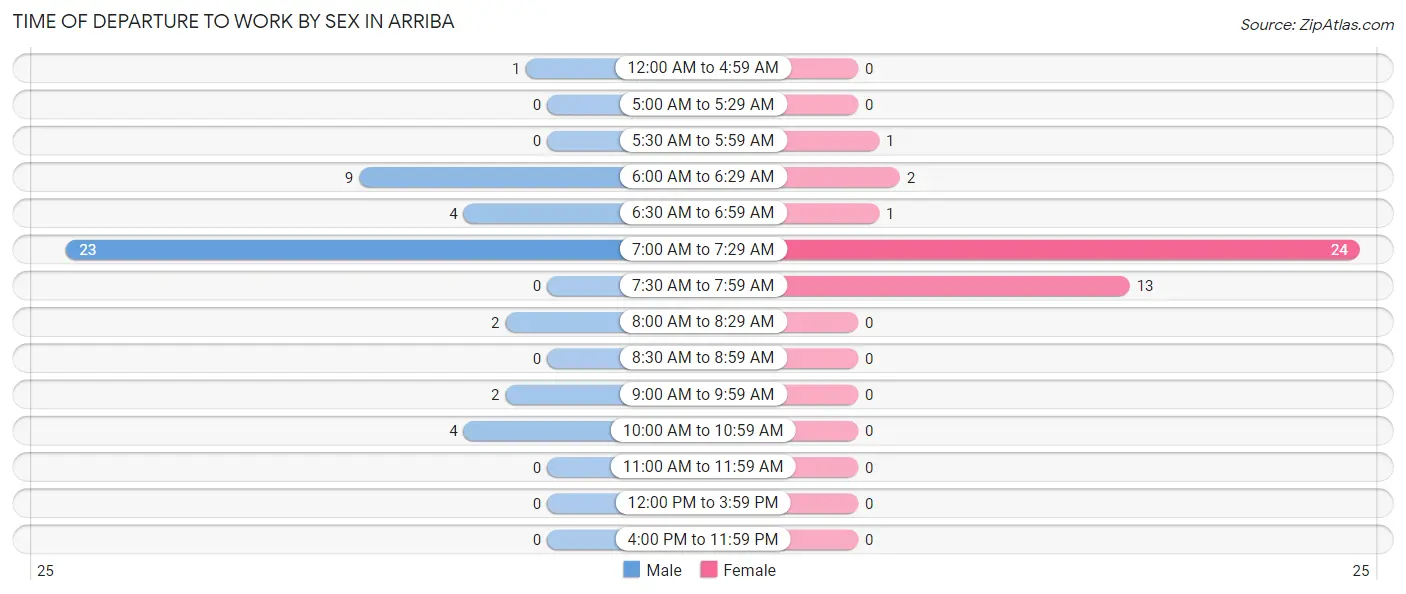
| Time of Departure | Male | Female |
| 12:00 AM to 4:59 AM | 1 (2.2%) | 0 (0.0%) |
| 5:00 AM to 5:29 AM | 0 (0.0%) | 0 (0.0%) |
| 5:30 AM to 5:59 AM | 0 (0.0%) | 1 (2.4%) |
| 6:00 AM to 6:29 AM | 9 (20.0%) | 2 (4.9%) |
| 6:30 AM to 6:59 AM | 4 (8.9%) | 1 (2.4%) |
| 7:00 AM to 7:29 AM | 23 (51.1%) | 24 (58.5%) |
| 7:30 AM to 7:59 AM | 0 (0.0%) | 13 (31.7%) |
| 8:00 AM to 8:29 AM | 2 (4.4%) | 0 (0.0%) |
| 8:30 AM to 8:59 AM | 0 (0.0%) | 0 (0.0%) |
| 9:00 AM to 9:59 AM | 2 (4.4%) | 0 (0.0%) |
| 10:00 AM to 10:59 AM | 4 (8.9%) | 0 (0.0%) |
| 11:00 AM to 11:59 AM | 0 (0.0%) | 0 (0.0%) |
| 12:00 PM to 3:59 PM | 0 (0.0%) | 0 (0.0%) |
| 4:00 PM to 11:59 PM | 0 (0.0%) | 0 (0.0%) |
| Total | 45 (100.0%) | 41 (100.0%) |
Housing Occupancy in Arriba
Occupancy by Ownership in Arriba
Of the total 124 dwellings in Arriba, owner-occupied units account for 72 (58.1%), while renter-occupied units make up 52 (41.9%).
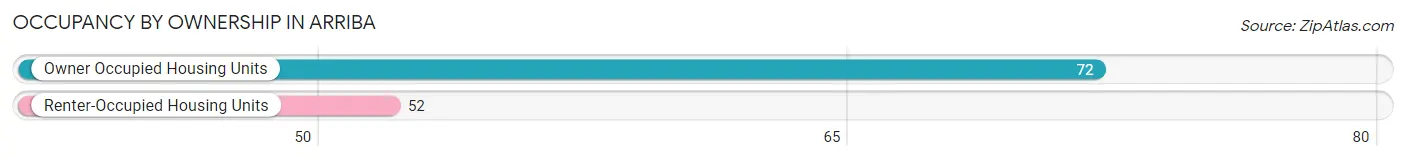
| Occupancy | # Housing Units | % Housing Units |
| Owner Occupied Housing Units | 72 | 58.1% |
| Renter-Occupied Housing Units | 52 | 41.9% |
| Total Occupied Housing Units | 124 | 100.0% |
Occupancy by Household Size in Arriba
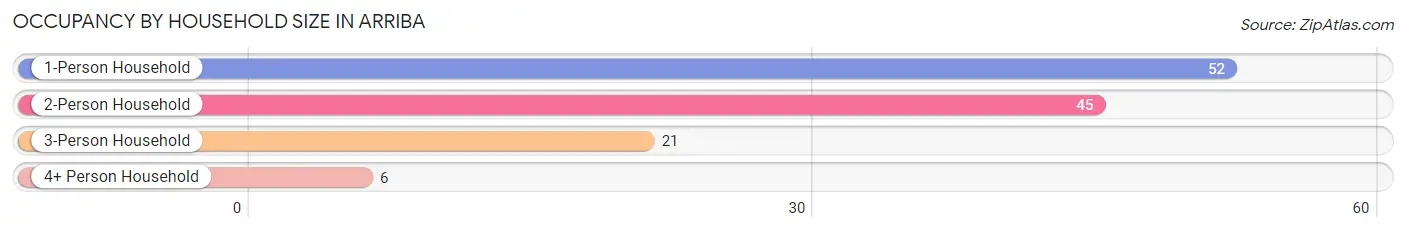
| Household Size | # Housing Units | % Housing Units |
| 1-Person Household | 52 | 41.9% |
| 2-Person Household | 45 | 36.3% |
| 3-Person Household | 21 | 16.9% |
| 4+ Person Household | 6 | 4.8% |
| Total Housing Units | 124 | 100.0% |
Occupancy by Ownership by Household Size in Arriba
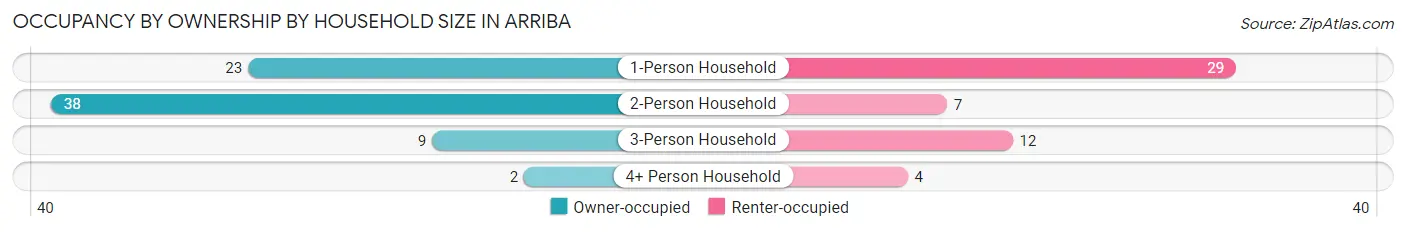
| Household Size | Owner-occupied | Renter-occupied |
| 1-Person Household | 23 (44.2%) | 29 (55.8%) |
| 2-Person Household | 38 (84.4%) | 7 (15.6%) |
| 3-Person Household | 9 (42.9%) | 12 (57.1%) |
| 4+ Person Household | 2 (33.3%) | 4 (66.7%) |
| Total Housing Units | 72 (58.1%) | 52 (41.9%) |
Occupancy by Educational Attainment in Arriba
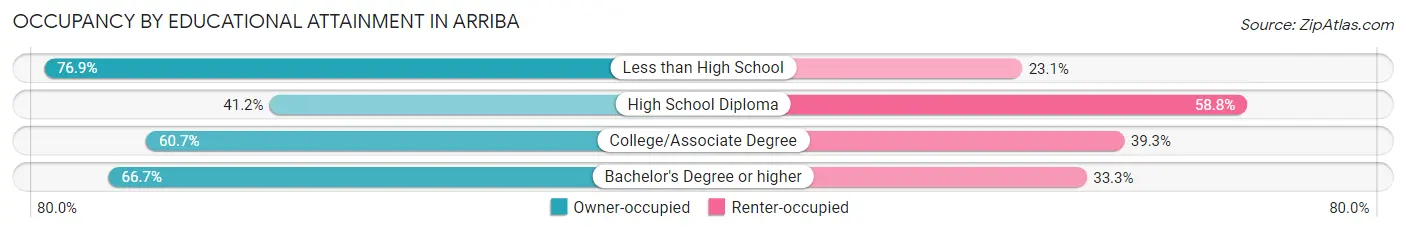
| Household Size | Owner-occupied | Renter-occupied |
| Less than High School | 10 (76.9%) | 3 (23.1%) |
| High School Diploma | 14 (41.2%) | 20 (58.8%) |
| College/Associate Degree | 34 (60.7%) | 22 (39.3%) |
| Bachelor's Degree or higher | 14 (66.7%) | 7 (33.3%) |
Occupancy by Age of Householder in Arriba
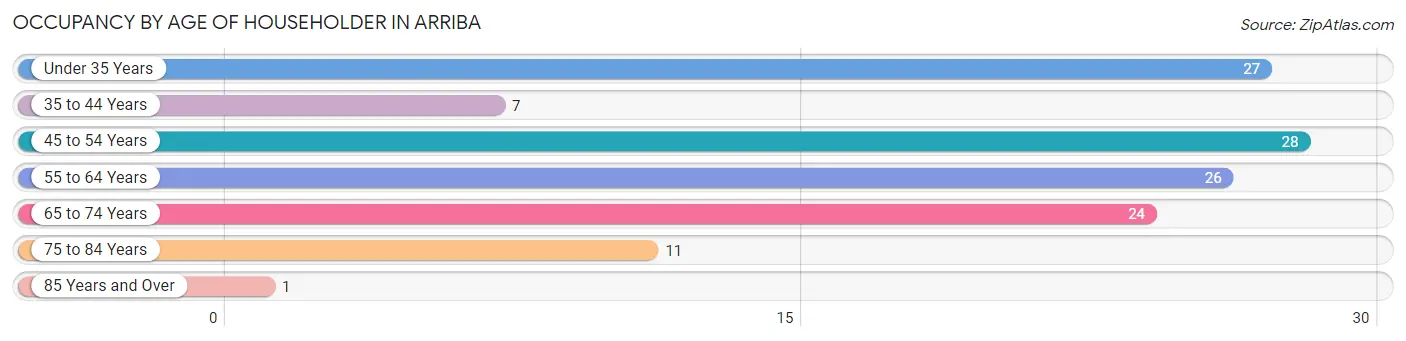
| Age Bracket | # Households | % Households |
| Under 35 Years | 27 | 21.8% |
| 35 to 44 Years | 7 | 5.7% |
| 45 to 54 Years | 28 | 22.6% |
| 55 to 64 Years | 26 | 21.0% |
| 65 to 74 Years | 24 | 19.4% |
| 75 to 84 Years | 11 | 8.9% |
| 85 Years and Over | 1 | 0.8% |
| Total | 124 | 100.0% |
Housing Finances in Arriba
Median Income by Occupancy in Arriba
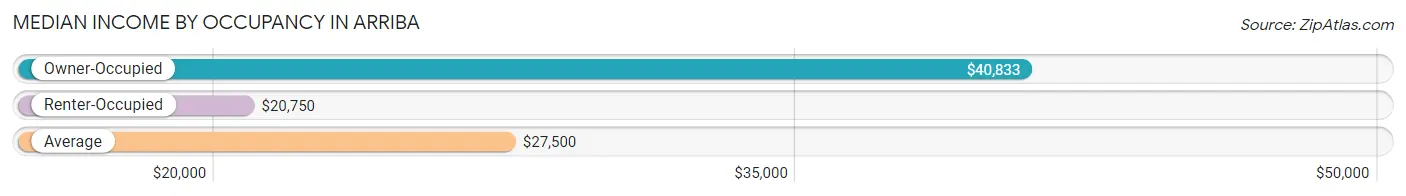
| Occupancy Type | # Households | Median Income |
| Owner-Occupied | 72 (58.1%) | $40,833 |
| Renter-Occupied | 52 (41.9%) | $20,750 |
| Average | 124 (100.0%) | $27,500 |
Occupancy by Householder Income Bracket in Arriba
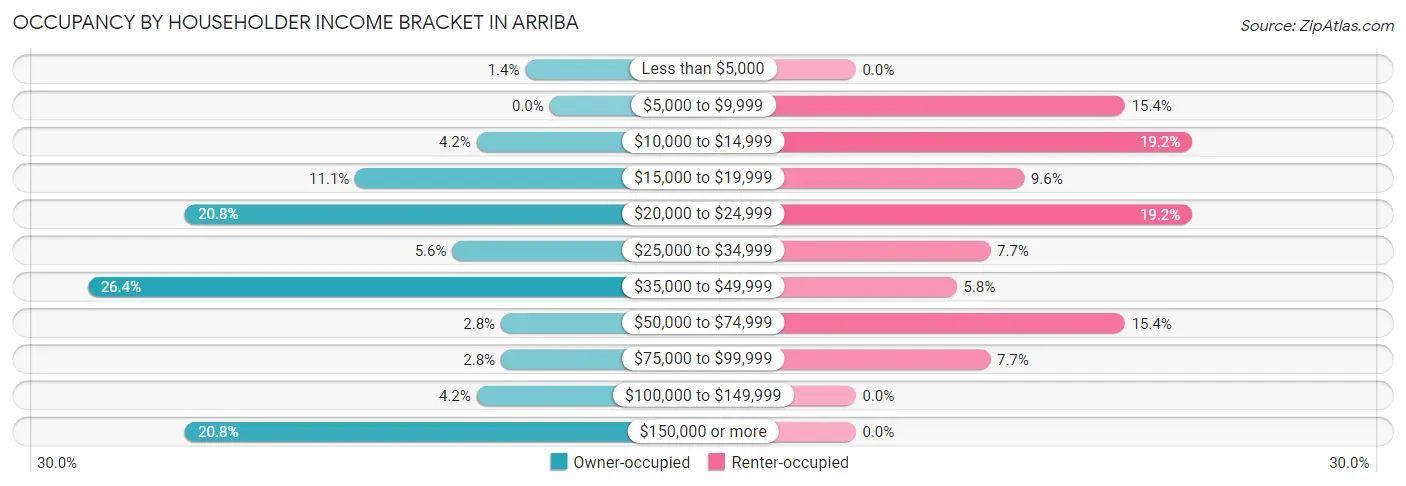
| Income Bracket | Owner-occupied | Renter-occupied |
| Less than $5,000 | 1 (1.4%) | 0 (0.0%) |
| $5,000 to $9,999 | 0 (0.0%) | 8 (15.4%) |
| $10,000 to $14,999 | 3 (4.2%) | 10 (19.2%) |
| $15,000 to $19,999 | 8 (11.1%) | 5 (9.6%) |
| $20,000 to $24,999 | 15 (20.8%) | 10 (19.2%) |
| $25,000 to $34,999 | 4 (5.6%) | 4 (7.7%) |
| $35,000 to $49,999 | 19 (26.4%) | 3 (5.8%) |
| $50,000 to $74,999 | 2 (2.8%) | 8 (15.4%) |
| $75,000 to $99,999 | 2 (2.8%) | 4 (7.7%) |
| $100,000 to $149,999 | 3 (4.2%) | 0 (0.0%) |
| $150,000 or more | 15 (20.8%) | 0 (0.0%) |
| Total | 72 (100.0%) | 52 (100.0%) |
Monthly Housing Cost Tiers in Arriba
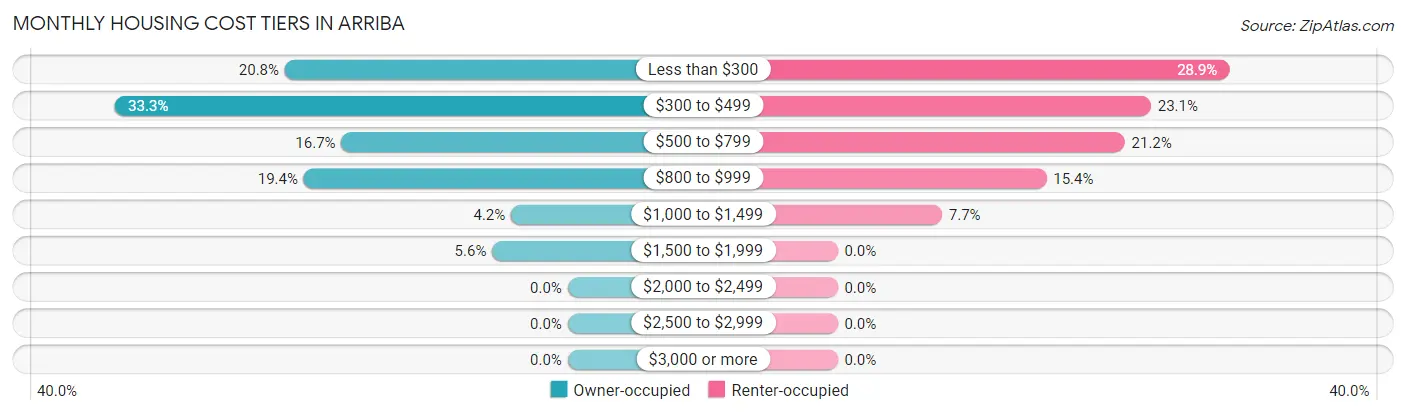
| Monthly Cost | Owner-occupied | Renter-occupied |
| Less than $300 | 15 (20.8%) | 15 (28.8%) |
| $300 to $499 | 24 (33.3%) | 12 (23.1%) |
| $500 to $799 | 12 (16.7%) | 11 (21.1%) |
| $800 to $999 | 14 (19.4%) | 8 (15.4%) |
| $1,000 to $1,499 | 3 (4.2%) | 4 (7.7%) |
| $1,500 to $1,999 | 4 (5.6%) | 0 (0.0%) |
| $2,000 to $2,499 | 0 (0.0%) | 0 (0.0%) |
| $2,500 to $2,999 | 0 (0.0%) | 0 (0.0%) |
| $3,000 or more | 0 (0.0%) | 0 (0.0%) |
| Total | 72 (100.0%) | 52 (100.0%) |
Physical Housing Characteristics in Arriba
Housing Structures in Arriba
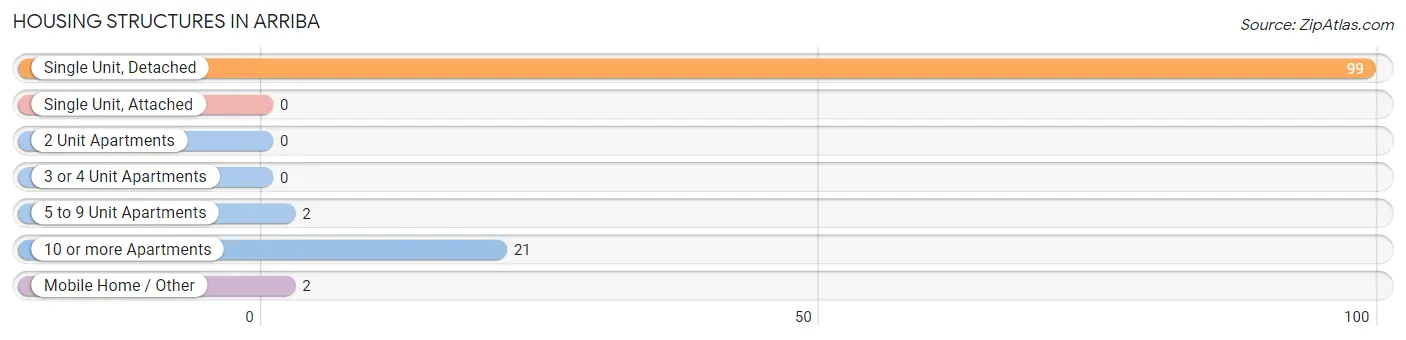
| Structure Type | # Housing Units | % Housing Units |
| Single Unit, Detached | 99 | 79.8% |
| Single Unit, Attached | 0 | 0.0% |
| 2 Unit Apartments | 0 | 0.0% |
| 3 or 4 Unit Apartments | 0 | 0.0% |
| 5 to 9 Unit Apartments | 2 | 1.6% |
| 10 or more Apartments | 21 | 16.9% |
| Mobile Home / Other | 2 | 1.6% |
| Total | 124 | 100.0% |
Housing Structures by Occupancy in Arriba
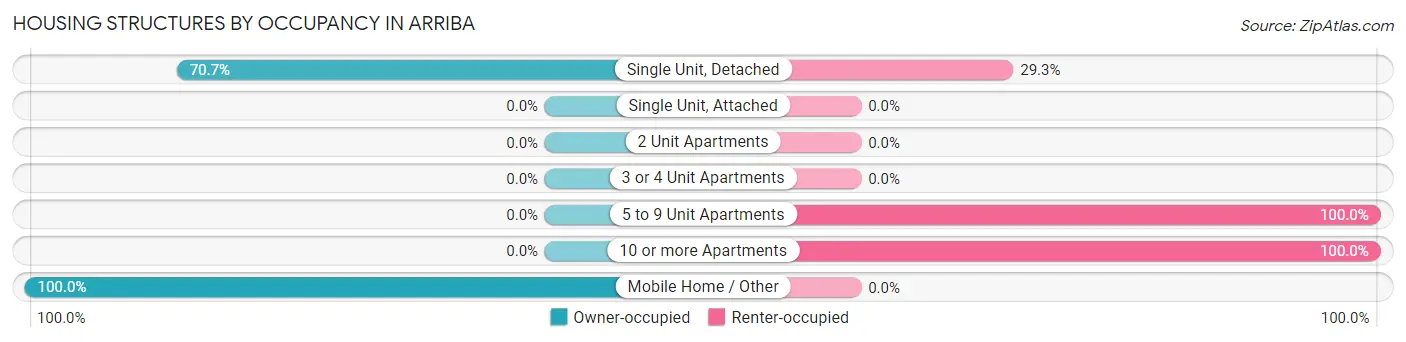
| Structure Type | Owner-occupied | Renter-occupied |
| Single Unit, Detached | 70 (70.7%) | 29 (29.3%) |
| Single Unit, Attached | 0 (0.0%) | 0 (0.0%) |
| 2 Unit Apartments | 0 (0.0%) | 0 (0.0%) |
| 3 or 4 Unit Apartments | 0 (0.0%) | 0 (0.0%) |
| 5 to 9 Unit Apartments | 0 (0.0%) | 2 (100.0%) |
| 10 or more Apartments | 0 (0.0%) | 21 (100.0%) |
| Mobile Home / Other | 2 (100.0%) | 0 (0.0%) |
| Total | 72 (58.1%) | 52 (41.9%) |
Housing Structures by Number of Rooms in Arriba
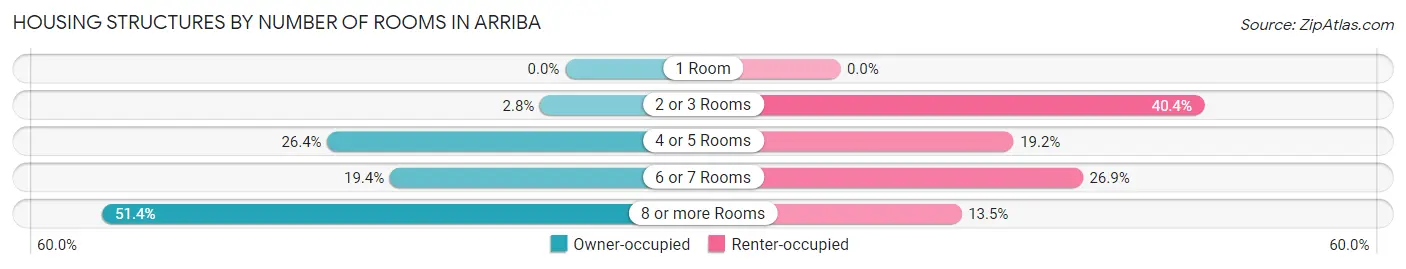
| Number of Rooms | Owner-occupied | Renter-occupied |
| 1 Room | 0 (0.0%) | 0 (0.0%) |
| 2 or 3 Rooms | 2 (2.8%) | 21 (40.4%) |
| 4 or 5 Rooms | 19 (26.4%) | 10 (19.2%) |
| 6 or 7 Rooms | 14 (19.4%) | 14 (26.9%) |
| 8 or more Rooms | 37 (51.4%) | 7 (13.5%) |
| Total | 72 (100.0%) | 52 (100.0%) |
Housing Structure by Heating Type in Arriba
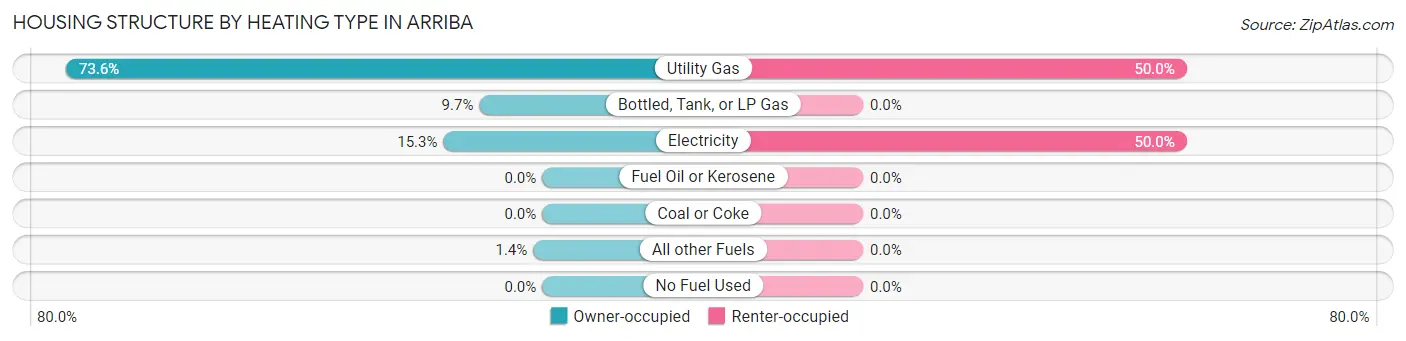
| Heating Type | Owner-occupied | Renter-occupied |
| Utility Gas | 53 (73.6%) | 26 (50.0%) |
| Bottled, Tank, or LP Gas | 7 (9.7%) | 0 (0.0%) |
| Electricity | 11 (15.3%) | 26 (50.0%) |
| Fuel Oil or Kerosene | 0 (0.0%) | 0 (0.0%) |
| Coal or Coke | 0 (0.0%) | 0 (0.0%) |
| All other Fuels | 1 (1.4%) | 0 (0.0%) |
| No Fuel Used | 0 (0.0%) | 0 (0.0%) |
| Total | 72 (100.0%) | 52 (100.0%) |
Household Vehicle Usage in Arriba
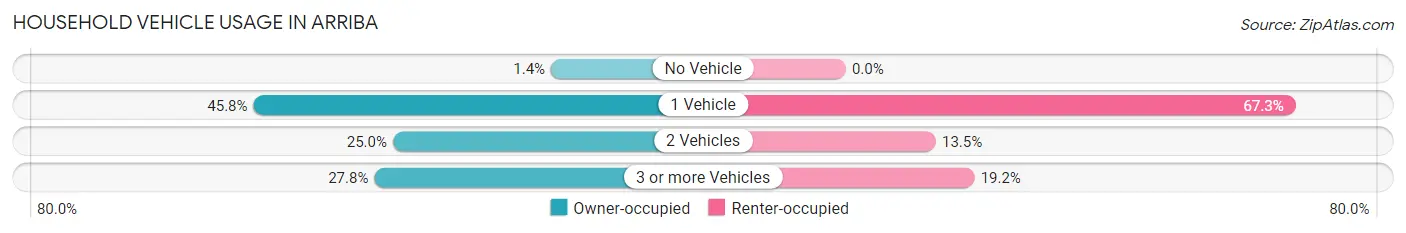
| Vehicles per Household | Owner-occupied | Renter-occupied |
| No Vehicle | 1 (1.4%) | 0 (0.0%) |
| 1 Vehicle | 33 (45.8%) | 35 (67.3%) |
| 2 Vehicles | 18 (25.0%) | 7 (13.5%) |
| 3 or more Vehicles | 20 (27.8%) | 10 (19.2%) |
| Total | 72 (100.0%) | 52 (100.0%) |
Real Estate & Mortgages in Arriba
Real Estate and Mortgage Overview in Arriba
| Characteristic | Without Mortgage | With Mortgage |
| Housing Units | 40 | 32 |
| Median Property Value | $143,800 | $110,000 |
| Median Household Income | - | - |
| Monthly Housing Costs | $367 | $0 |
| Real Estate Taxes | $389 | $0 |
Property Value by Mortgage Status in Arriba
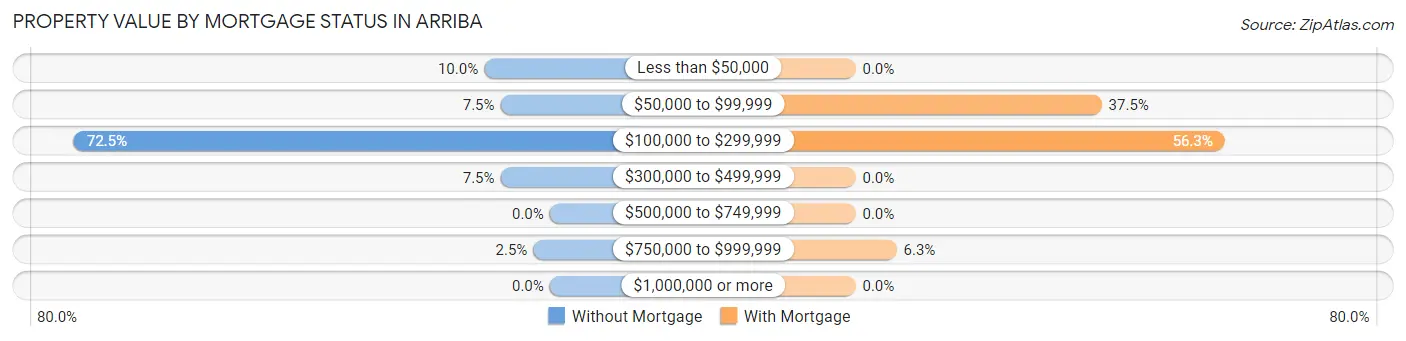
| Property Value | Without Mortgage | With Mortgage |
| Less than $50,000 | 4 (10.0%) | 0 (0.0%) |
| $50,000 to $99,999 | 3 (7.5%) | 12 (37.5%) |
| $100,000 to $299,999 | 29 (72.5%) | 18 (56.2%) |
| $300,000 to $499,999 | 3 (7.5%) | 0 (0.0%) |
| $500,000 to $749,999 | 0 (0.0%) | 0 (0.0%) |
| $750,000 to $999,999 | 1 (2.5%) | 2 (6.2%) |
| $1,000,000 or more | 0 (0.0%) | 0 (0.0%) |
| Total | 40 (100.0%) | 32 (100.0%) |
Household Income by Mortgage Status in Arriba
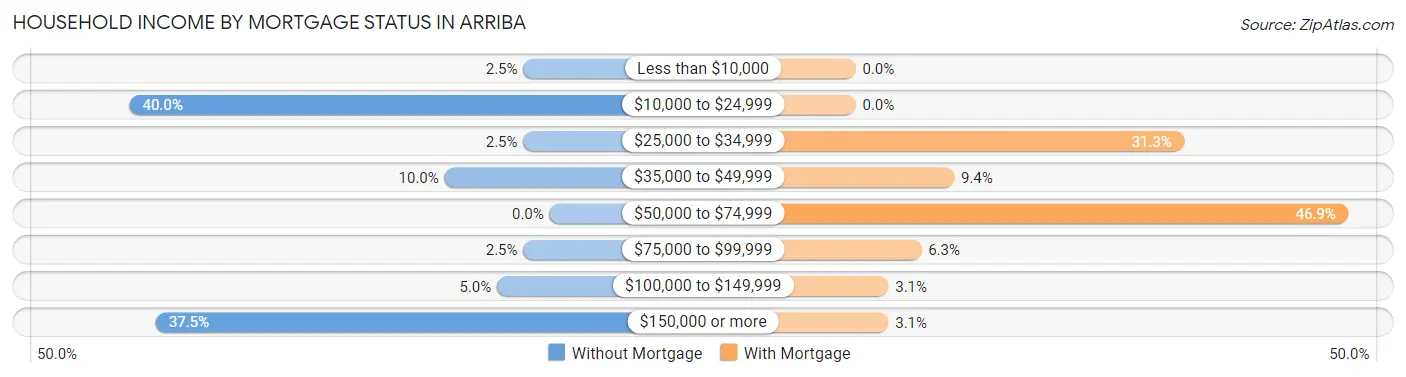
| Household Income | Without Mortgage | With Mortgage |
| Less than $10,000 | 1 (2.5%) | 0 (0.0%) |
| $10,000 to $24,999 | 16 (40.0%) | 0 (0.0%) |
| $25,000 to $34,999 | 1 (2.5%) | 10 (31.2%) |
| $35,000 to $49,999 | 4 (10.0%) | 3 (9.4%) |
| $50,000 to $74,999 | 0 (0.0%) | 15 (46.9%) |
| $75,000 to $99,999 | 1 (2.5%) | 2 (6.2%) |
| $100,000 to $149,999 | 2 (5.0%) | 1 (3.1%) |
| $150,000 or more | 15 (37.5%) | 1 (3.1%) |
| Total | 40 (100.0%) | 32 (100.0%) |
Property Value to Household Income Ratio in Arriba
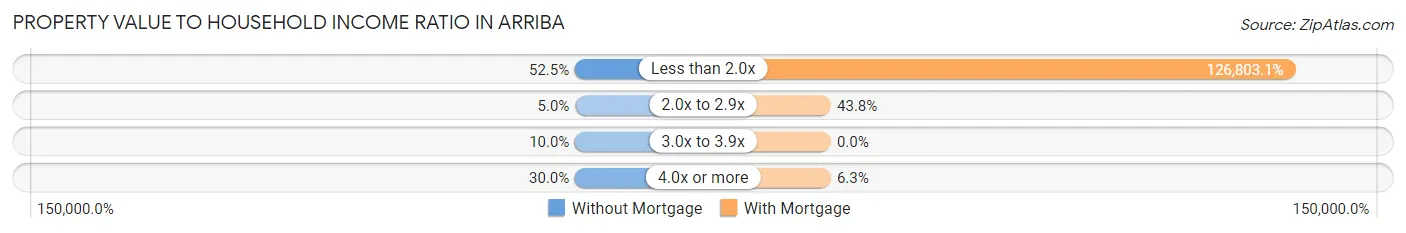
| Value-to-Income Ratio | Without Mortgage | With Mortgage |
| Less than 2.0x | 21 (52.5%) | 40,577 (126,803.1%) |
| 2.0x to 2.9x | 2 (5.0%) | 14 (43.8%) |
| 3.0x to 3.9x | 4 (10.0%) | 0 (0.0%) |
| 4.0x or more | 12 (30.0%) | 2 (6.2%) |
| Total | 40 (100.0%) | 32 (100.0%) |
Real Estate Taxes by Mortgage Status in Arriba
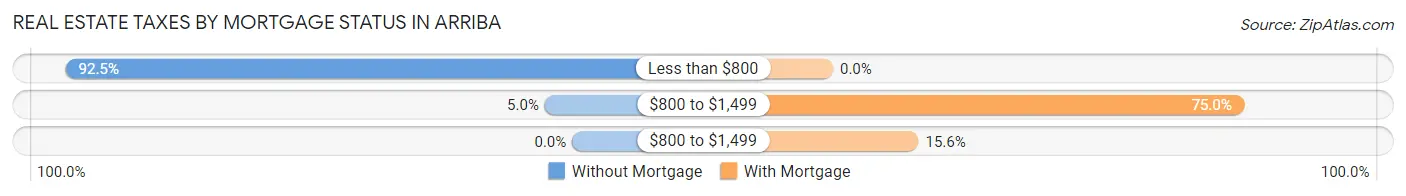
| Property Taxes | Without Mortgage | With Mortgage |
| Less than $800 | 37 (92.5%) | 0 (0.0%) |
| $800 to $1,499 | 2 (5.0%) | 24 (75.0%) |
| $800 to $1,499 | 0 (0.0%) | 5 (15.6%) |
| Total | 40 (100.0%) | 32 (100.0%) |
Health & Disability in Arriba
Health Insurance Coverage by Age in Arriba
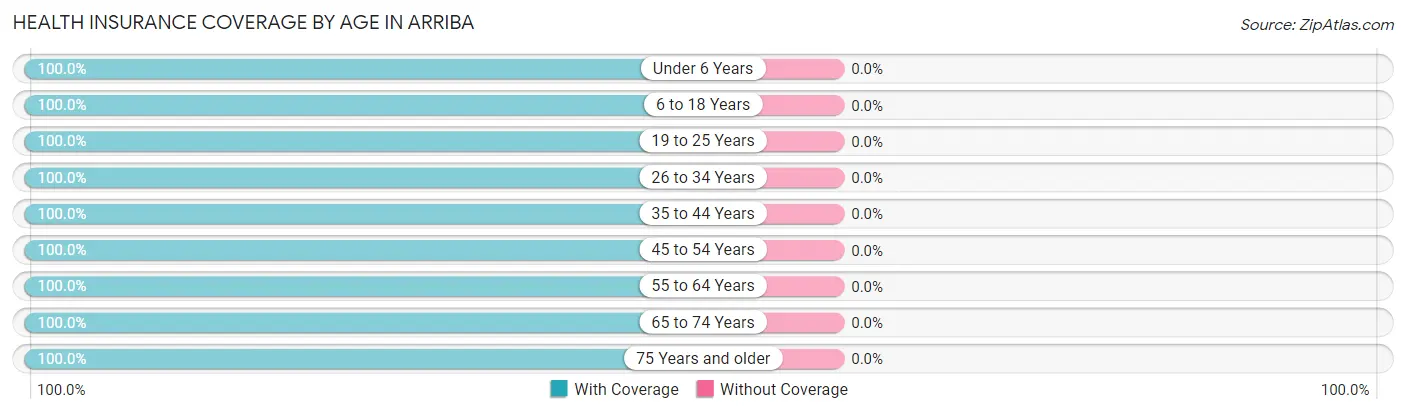
| Age Bracket | With Coverage | Without Coverage |
| Under 6 Years | 9 (100.0%) | 0 (0.0%) |
| 6 to 18 Years | 53 (100.0%) | 0 (0.0%) |
| 19 to 25 Years | 18 (100.0%) | 0 (0.0%) |
| 26 to 34 Years | 12 (100.0%) | 0 (0.0%) |
| 35 to 44 Years | 16 (100.0%) | 0 (0.0%) |
| 45 to 54 Years | 45 (100.0%) | 0 (0.0%) |
| 55 to 64 Years | 41 (100.0%) | 0 (0.0%) |
| 65 to 74 Years | 28 (100.0%) | 0 (0.0%) |
| 75 Years and older | 13 (100.0%) | 0 (0.0%) |
| Total | 235 (100.0%) | 0 (0.0%) |
Health Insurance Coverage by Citizenship Status in Arriba
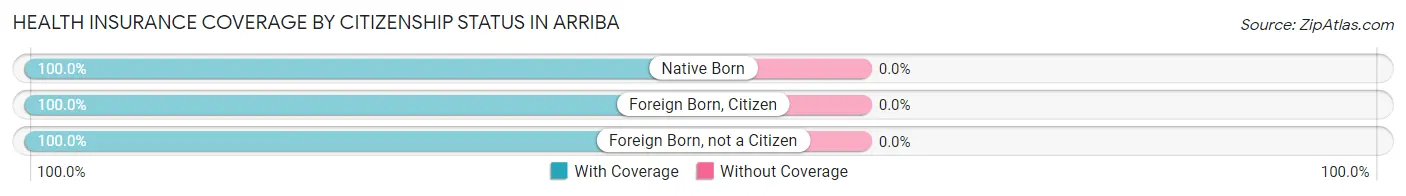
| Citizenship Status | With Coverage | Without Coverage |
| Native Born | 9 (100.0%) | 0 (0.0%) |
| Foreign Born, Citizen | 53 (100.0%) | 0 (0.0%) |
| Foreign Born, not a Citizen | 18 (100.0%) | 0 (0.0%) |
Health Insurance Coverage by Household Income in Arriba
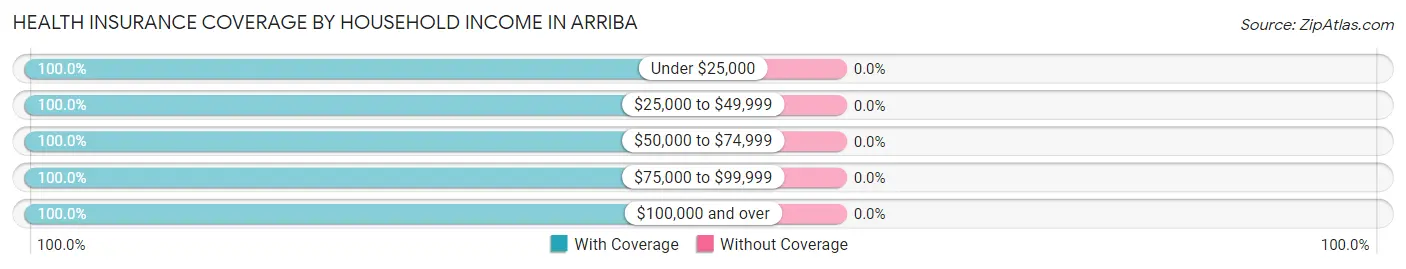
| Household Income | With Coverage | Without Coverage |
| Under $25,000 | 83 (100.0%) | 0 (0.0%) |
| $25,000 to $49,999 | 47 (100.0%) | 0 (0.0%) |
| $50,000 to $74,999 | 49 (100.0%) | 0 (0.0%) |
| $75,000 to $99,999 | 11 (100.0%) | 0 (0.0%) |
| $100,000 and over | 45 (100.0%) | 0 (0.0%) |
Public vs Private Health Insurance Coverage by Age in Arriba
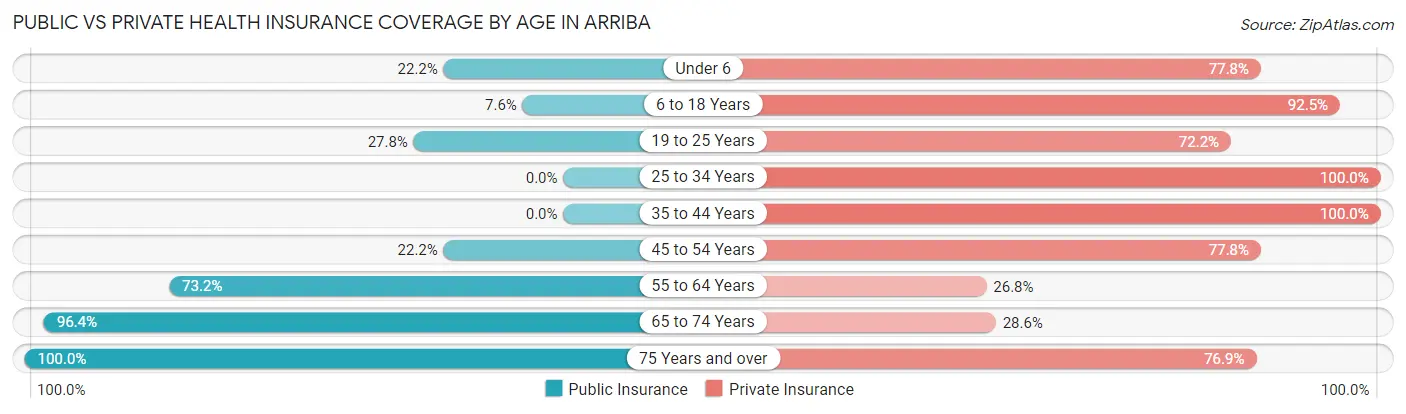
| Age Bracket | Public Insurance | Private Insurance |
| Under 6 | 2 (22.2%) | 7 (77.8%) |
| 6 to 18 Years | 4 (7.5%) | 49 (92.4%) |
| 19 to 25 Years | 5 (27.8%) | 13 (72.2%) |
| 25 to 34 Years | 0 (0.0%) | 12 (100.0%) |
| 35 to 44 Years | 0 (0.0%) | 16 (100.0%) |
| 45 to 54 Years | 10 (22.2%) | 35 (77.8%) |
| 55 to 64 Years | 30 (73.2%) | 11 (26.8%) |
| 65 to 74 Years | 27 (96.4%) | 8 (28.6%) |
| 75 Years and over | 13 (100.0%) | 10 (76.9%) |
| Total | 91 (38.7%) | 161 (68.5%) |
Disability Status by Sex by Age in Arriba
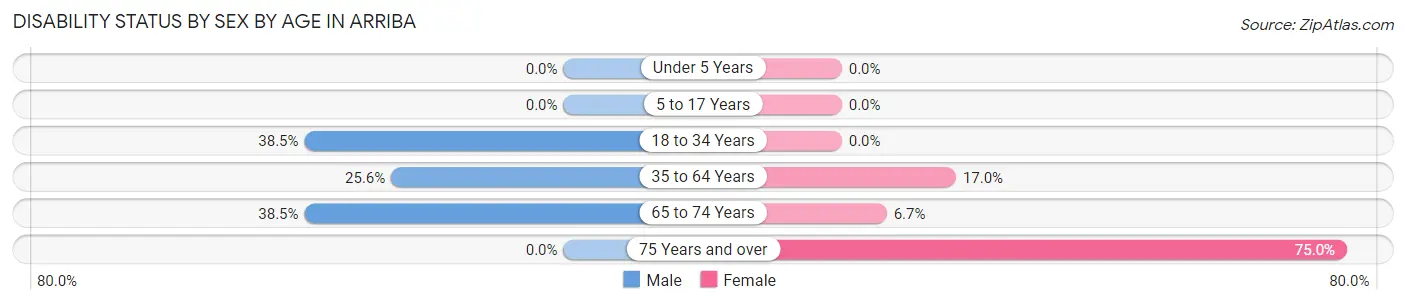
| Age Bracket | Male | Female |
| Under 5 Years | 0 (0.0%) | 0 (0.0%) |
| 5 to 17 Years | 0 (0.0%) | 0 (0.0%) |
| 18 to 34 Years | 5 (38.5%) | 0 (0.0%) |
| 35 to 64 Years | 11 (25.6%) | 10 (17.0%) |
| 65 to 74 Years | 5 (38.5%) | 1 (6.7%) |
| 75 Years and over | 0 (0.0%) | 3 (75.0%) |
Disability Class by Sex by Age in Arriba
Disability Class: Hearing Difficulty
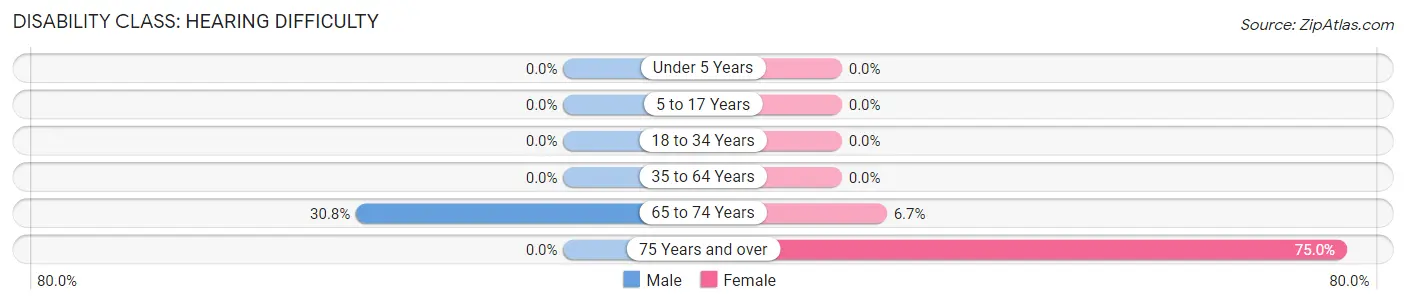
| Age Bracket | Male | Female |
| Under 5 Years | 0 (0.0%) | 0 (0.0%) |
| 5 to 17 Years | 0 (0.0%) | 0 (0.0%) |
| 18 to 34 Years | 0 (0.0%) | 0 (0.0%) |
| 35 to 64 Years | 0 (0.0%) | 0 (0.0%) |
| 65 to 74 Years | 4 (30.8%) | 1 (6.7%) |
| 75 Years and over | 0 (0.0%) | 3 (75.0%) |
Disability Class: Vision Difficulty
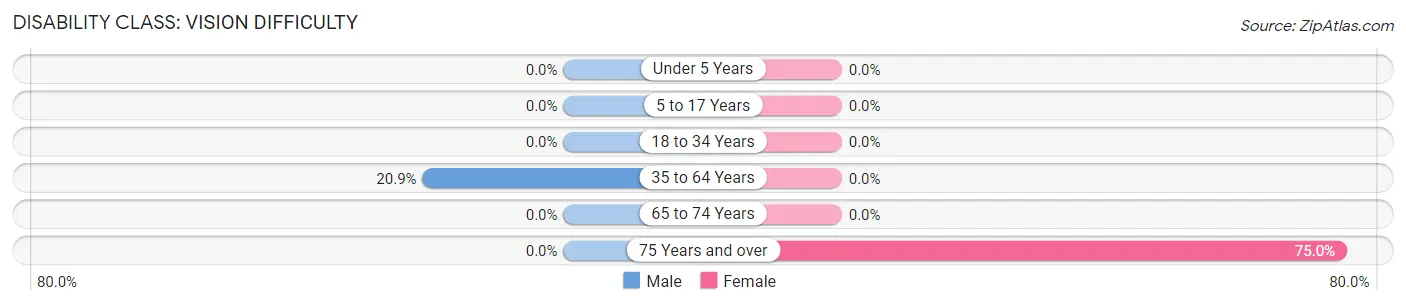
| Age Bracket | Male | Female |
| Under 5 Years | 0 (0.0%) | 0 (0.0%) |
| 5 to 17 Years | 0 (0.0%) | 0 (0.0%) |
| 18 to 34 Years | 0 (0.0%) | 0 (0.0%) |
| 35 to 64 Years | 9 (20.9%) | 0 (0.0%) |
| 65 to 74 Years | 0 (0.0%) | 0 (0.0%) |
| 75 Years and over | 0 (0.0%) | 3 (75.0%) |
Disability Class: Cognitive Difficulty
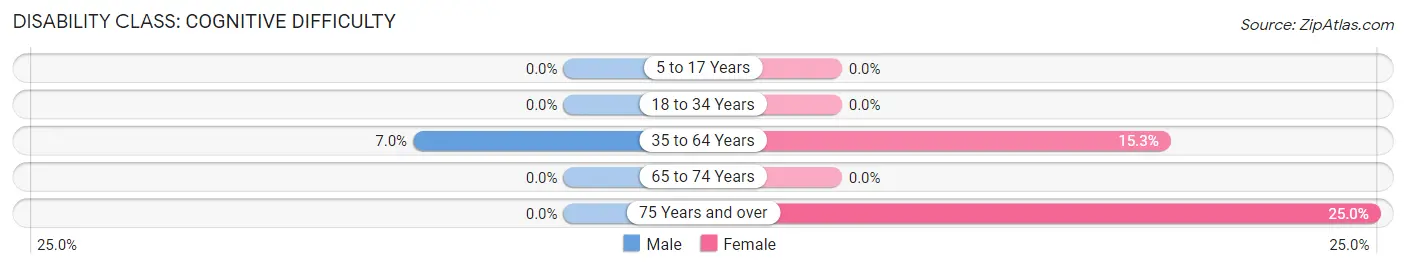
| Age Bracket | Male | Female |
| 5 to 17 Years | 0 (0.0%) | 0 (0.0%) |
| 18 to 34 Years | 0 (0.0%) | 0 (0.0%) |
| 35 to 64 Years | 3 (7.0%) | 9 (15.2%) |
| 65 to 74 Years | 0 (0.0%) | 0 (0.0%) |
| 75 Years and over | 0 (0.0%) | 1 (25.0%) |
Disability Class: Ambulatory Difficulty
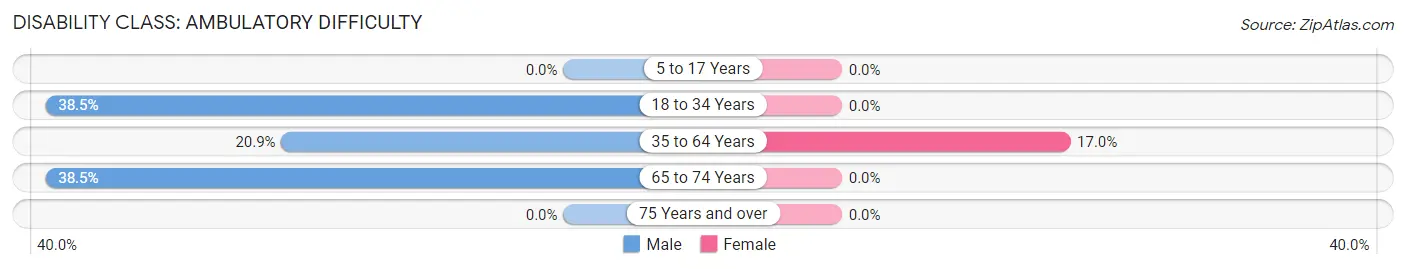
| Age Bracket | Male | Female |
| 5 to 17 Years | 0 (0.0%) | 0 (0.0%) |
| 18 to 34 Years | 5 (38.5%) | 0 (0.0%) |
| 35 to 64 Years | 9 (20.9%) | 10 (17.0%) |
| 65 to 74 Years | 5 (38.5%) | 0 (0.0%) |
| 75 Years and over | 0 (0.0%) | 0 (0.0%) |
Disability Class: Self-Care Difficulty
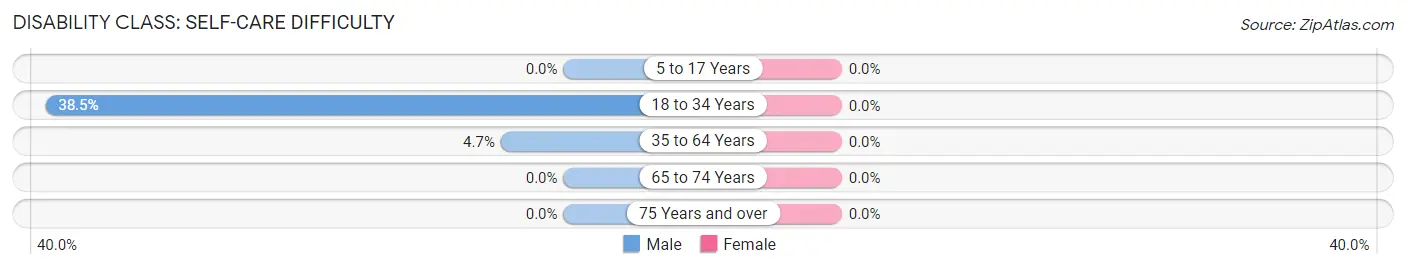
| Age Bracket | Male | Female |
| 5 to 17 Years | 0 (0.0%) | 0 (0.0%) |
| 18 to 34 Years | 5 (38.5%) | 0 (0.0%) |
| 35 to 64 Years | 2 (4.6%) | 0 (0.0%) |
| 65 to 74 Years | 0 (0.0%) | 0 (0.0%) |
| 75 Years and over | 0 (0.0%) | 0 (0.0%) |
Technology Access in Arriba
Computing Device Access in Arriba
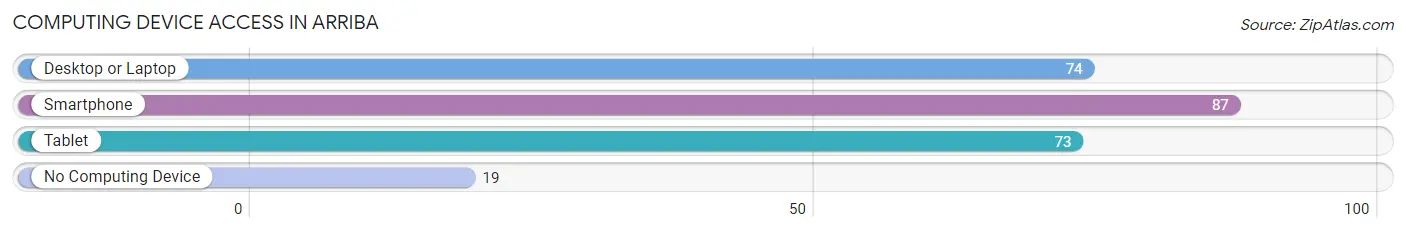
| Device Type | # Households | % Households |
| Desktop or Laptop | 74 | 59.7% |
| Smartphone | 87 | 70.2% |
| Tablet | 73 | 58.9% |
| No Computing Device | 19 | 15.3% |
| Total | 124 | 100.0% |
Internet Access in Arriba
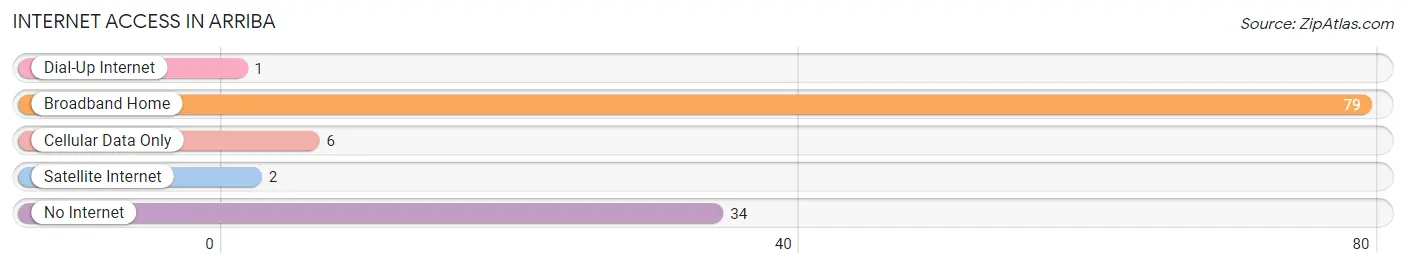
| Internet Type | # Households | % Households |
| Dial-Up Internet | 1 | 0.8% |
| Broadband Home | 79 | 63.7% |
| Cellular Data Only | 6 | 4.8% |
| Satellite Internet | 2 | 1.6% |
| No Internet | 34 | 27.4% |
| Total | 124 | 100.0% |
Arriba Summary
Arriba is a small town located in Lincoln County, Colorado, United States. The town is situated in the eastern part of the county, approximately 20 miles east of Limon. The population of Arriba was estimated to be around 200 people in 2020.
Geography
Arriba is located in the High Plains region of Colorado, at an elevation of 4,845 feet. The town is situated on the western edge of the Great Plains, and is surrounded by rolling hills and prairies. The town is located in the South Platte River Valley, and is bordered by the towns of Flagler and Genoa to the north, and Hugo to the south.
The climate in Arriba is semi-arid, with hot summers and cold winters. The average annual temperature is around 54°F, with an average high of around 85°F in the summer and an average low of around 20°F in the winter. The average annual precipitation is around 16 inches, with most of the precipitation occurring in the spring and summer months.
History
Arriba was founded in 1887 by a group of settlers from Kansas. The town was named after the Spanish word for “up”, as the settlers believed that the town was located on the highest point in the area. The town quickly grew, and by the early 1900s, it had become a thriving agricultural community.
The town was incorporated in 1909, and the first mayor was elected in 1910. The town continued to grow throughout the 20th century, and by the 1950s, it had become a popular tourist destination.
Economy
The economy of Arriba is largely based on agriculture and tourism. The town is home to several farms, which produce a variety of crops, including wheat, corn, and hay. The town is also home to several tourist attractions, including the Arriba Historical Museum, the Arriba Golf Course, and the Arriba Raceway.
Demographics
As of the 2010 census, the population of Arriba was estimated to be around 200 people. The racial makeup of the town was 95.0% White, 0.5% African American, 0.5% Native American, 0.5% Asian, and 3.5% from other races. The median household income was estimated to be around $37,000, and the median home value was estimated to be around $90,000.
Conclusion
Arriba is a small town located in Lincoln County, Colorado, United States. The town is situated in the eastern part of the county, approximately 20 miles east of Limon. The town is surrounded by rolling hills and prairies, and has a semi-arid climate. The economy of Arriba is largely based on agriculture and tourism, and the population of the town was estimated to be around 200 people in 2020.
Common Questions
What is Per Capita Income in Arriba?
Per Capita income in Arriba is $25,315.
What is the Median Family Income in Arriba?
Median Family Income in Arriba is $50,625.
What is the Median Household income in Arriba?
Median Household Income in Arriba is $27,500.
What is Income or Wage Gap in Arriba?
Income or Wage Gap in Arriba is 30.2%.
Women in Arriba earn 69.8 cents for every dollar earned by a man.
What is Inequality or Gini Index in Arriba?
Inequality or Gini Index in Arriba is 0.49.
What is the Total Population of Arriba?
Total Population of Arriba is 235.
What is the Total Male Population of Arriba?
Total Male Population of Arriba is 116.
What is the Total Female Population of Arriba?
Total Female Population of Arriba is 119.
What is the Ratio of Males per 100 Females in Arriba?
There are 97.48 Males per 100 Females in Arriba.
What is the Ratio of Females per 100 Males in Arriba?
There are 102.59 Females per 100 Males in Arriba.
What is the Median Population Age in Arriba?
Median Population Age in Arriba is 49.5 Years.
What is the Average Family Size in Arriba
Average Family Size in Arriba is 2.7 People.
What is the Average Household Size in Arriba
Average Household Size in Arriba is 1.9 People.
How Large is the Labor Force in Arriba?
There are 100 People in the Labor Forcein in Arriba.
What is the Percentage of People in the Labor Force in Arriba?
57.8% of People are in the Labor Force in Arriba.