Alamosa, CO Map & Demographics
Alamosa Map
Alamosa Overview
$26,750
PER CAPITA INCOME
$61,786
AVG FAMILY INCOME
$50,239
AVG HOUSEHOLD INCOME
17.5%
WAGE / INCOME GAP [ % ]
82.5¢/ $1
WAGE / INCOME GAP [ $ ]
$8,715
FAMILY INCOME DEFICIT
0.49
INEQUALITY / GINI INDEX
9,792
TOTAL POPULATION
4,832
MALE POPULATION
4,960
FEMALE POPULATION
97.42
MALES / 100 FEMALES
102.65
FEMALES / 100 MALES
29.7
MEDIAN AGE
3.2
AVG FAMILY SIZE
2.3
AVG HOUSEHOLD SIZE
4,646
LABOR FORCE [ PEOPLE ]
62.2%
PERCENT IN LABOR FORCE
3.9%
UNEMPLOYMENT RATE
Alamosa Zip Codes
Alamosa Area Codes
Income in Alamosa
Income Overview in Alamosa
Per Capita Income in Alamosa is $26,750, while median incomes of families and households are $61,786 and $50,239 respectively.
| Characteristic | Number | Measure |
| Per Capita Income | 9,792 | $26,750 |
| Median Family Income | 2,090 | $61,786 |
| Mean Family Income | 2,090 | $93,734 |
| Median Household Income | 3,890 | $50,239 |
| Mean Household Income | 3,890 | $70,097 |
| Income Deficit | 2,090 | $8,715 |
| Wage / Income Gap (%) | 9,792 | 17.46% |
| Wage / Income Gap ($) | 9,792 | 82.54¢ per $1 |
| Gini / Inequality Index | 9,792 | 0.49 |
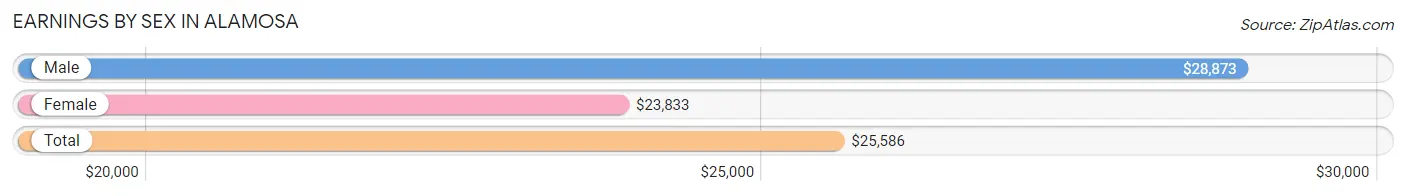
Earnings by Sex in Alamosa
Average Earnings in Alamosa are $25,586, $28,873 for men and $23,833 for women, a difference of 17.5%.
| Sex | Number | Average Earnings |
| Male | 2,714 (49.8%) | $28,873 |
| Female | 2,736 (50.2%) | $23,833 |
| Total | 5,450 (100.0%) | $25,586 |
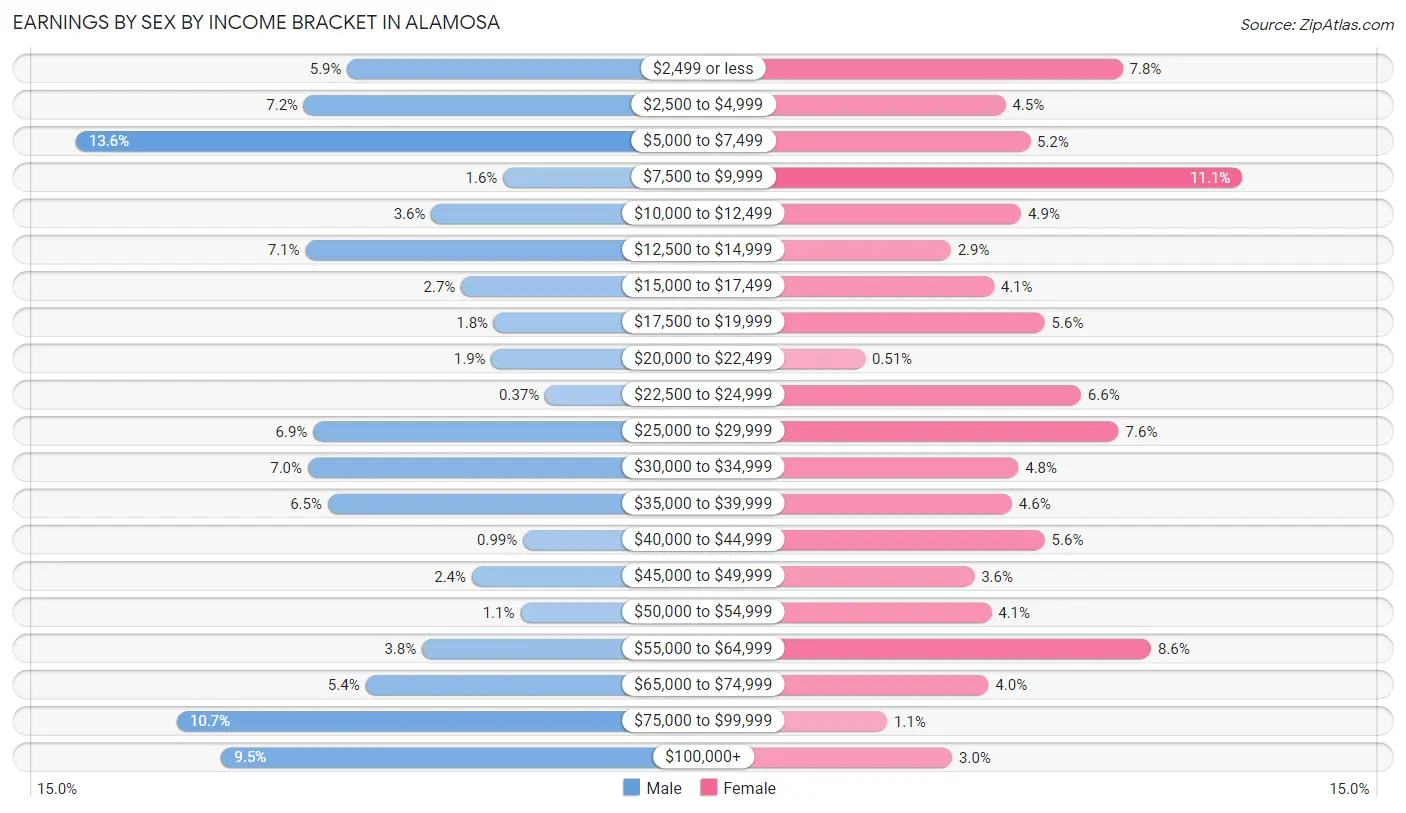
Earnings by Sex by Income Bracket in Alamosa
The most common earnings brackets in Alamosa are $5,000 to $7,499 for men (368 | 13.6%) and $7,500 to $9,999 for women (304 | 11.1%).
| Income | Male | Female |
| $2,499 or less | 161 (5.9%) | 212 (7.7%) |
| $2,500 to $4,999 | 194 (7.1%) | 122 (4.5%) |
| $5,000 to $7,499 | 368 (13.6%) | 141 (5.1%) |
| $7,500 to $9,999 | 42 (1.5%) | 304 (11.1%) |
| $10,000 to $12,499 | 97 (3.6%) | 134 (4.9%) |
| $12,500 to $14,999 | 193 (7.1%) | 80 (2.9%) |
| $15,000 to $17,499 | 74 (2.7%) | 113 (4.1%) |
| $17,500 to $19,999 | 49 (1.8%) | 152 (5.6%) |
| $20,000 to $22,499 | 51 (1.9%) | 14 (0.5%) |
| $22,500 to $24,999 | 10 (0.4%) | 180 (6.6%) |
| $25,000 to $29,999 | 187 (6.9%) | 209 (7.6%) |
| $30,000 to $34,999 | 191 (7.0%) | 132 (4.8%) |
| $35,000 to $39,999 | 176 (6.5%) | 127 (4.6%) |
| $40,000 to $44,999 | 27 (1.0%) | 152 (5.6%) |
| $45,000 to $49,999 | 66 (2.4%) | 98 (3.6%) |
| $50,000 to $54,999 | 29 (1.1%) | 111 (4.1%) |
| $55,000 to $64,999 | 104 (3.8%) | 234 (8.6%) |
| $65,000 to $74,999 | 147 (5.4%) | 109 (4.0%) |
| $75,000 to $99,999 | 291 (10.7%) | 31 (1.1%) |
| $100,000+ | 257 (9.5%) | 81 (3.0%) |
| Total | 2,714 (100.0%) | 2,736 (100.0%) |
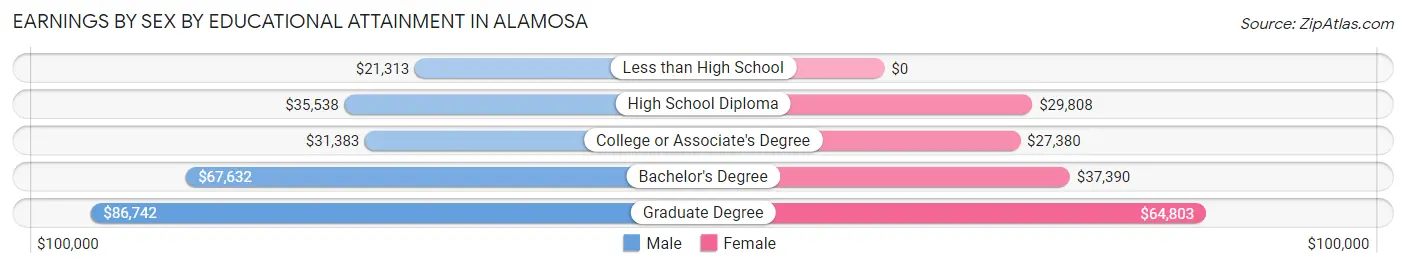
Earnings by Sex by Educational Attainment in Alamosa
Average earnings in Alamosa are $39,167 for men and $35,313 for women, a difference of 9.8%. Men with an educational attainment of graduate degree enjoy the highest average annual earnings of $86,742, while those with less than high school education earn the least with $21,313. Women with an educational attainment of graduate degree earn the most with the average annual earnings of $64,803, while those with college or associate's degree education have the smallest earnings of $27,380.
| Educational Attainment | Male Income | Female Income |
| Less than High School | $21,313 | $0 |
| High School Diploma | $35,538 | $29,808 |
| College or Associate's Degree | $31,383 | $27,380 |
| Bachelor's Degree | $67,632 | $37,390 |
| Graduate Degree | $86,742 | $64,803 |
| Total | $39,167 | $35,313 |
Family Income in Alamosa
Family Income Brackets in Alamosa
According to the Alamosa family income data, there are 583 families falling into the $50,000 to $74,999 income range, which is the most common income bracket and makes up 27.9% of all families. Conversely, the $10,000 to $14,999 income bracket is the least frequent group with only 61 families (2.9%) belonging to this category.
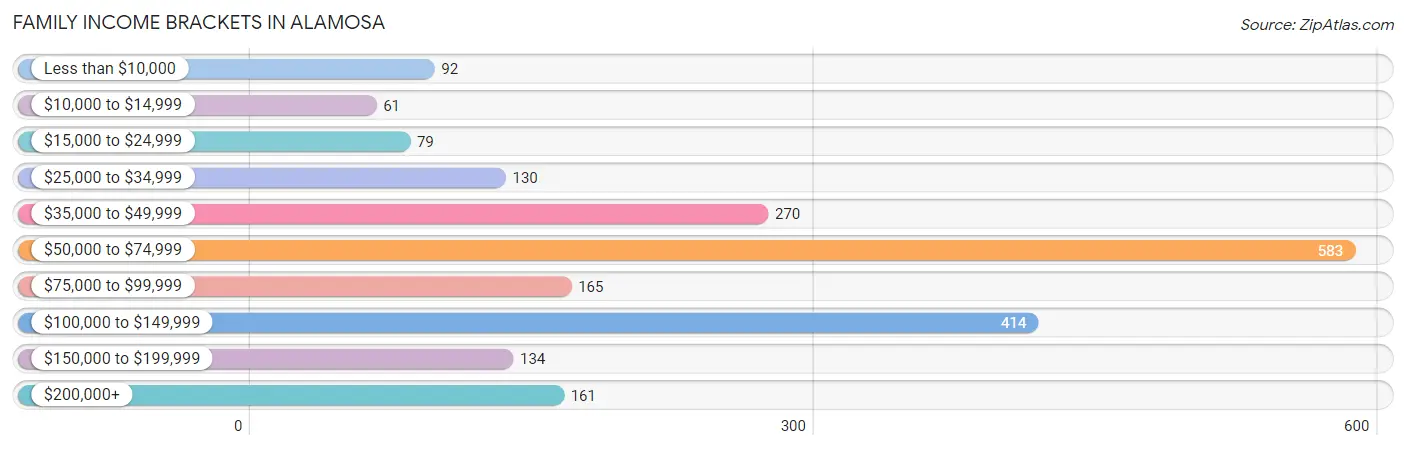
| Income Bracket | # Families | % Families |
| Less than $10,000 | 92 | 4.4% |
| $10,000 to $14,999 | 61 | 2.9% |
| $15,000 to $24,999 | 79 | 3.8% |
| $25,000 to $34,999 | 130 | 6.2% |
| $35,000 to $49,999 | 270 | 12.9% |
| $50,000 to $74,999 | 583 | 27.9% |
| $75,000 to $99,999 | 165 | 7.9% |
| $100,000 to $149,999 | 414 | 19.8% |
| $150,000 to $199,999 | 134 | 6.4% |
| $200,000+ | 161 | 7.7% |
Family Income by Famaliy Size in Alamosa
4-person families (524 | 25.1%) account for the highest median family income in Alamosa with $119,857 per family, while 4-person families (524 | 25.1%) have the highest median income of $29,964 per family member.
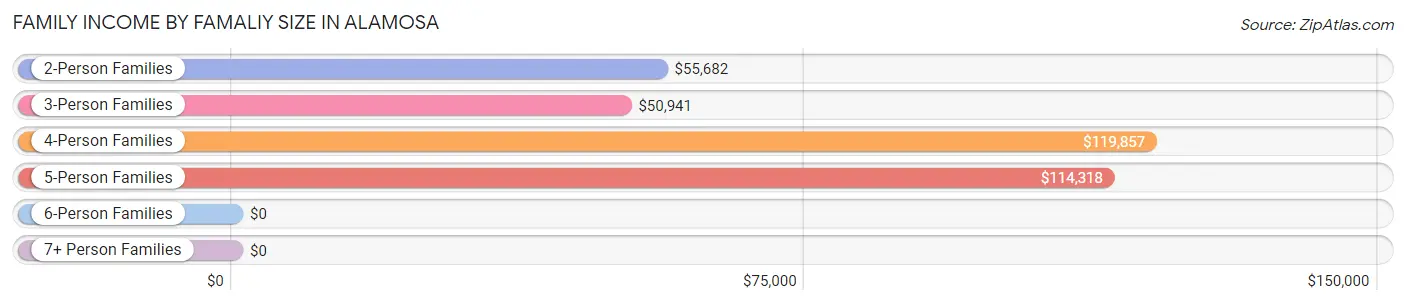
| Income Bracket | # Families | Median Income |
| 2-Person Families | 792 (37.9%) | $55,682 |
| 3-Person Families | 614 (29.4%) | $50,941 |
| 4-Person Families | 524 (25.1%) | $119,857 |
| 5-Person Families | 56 (2.7%) | $114,318 |
| 6-Person Families | 10 (0.5%) | $0 |
| 7+ Person Families | 94 (4.5%) | $0 |
| Total | 2,090 (100.0%) | $61,786 |
Family Income by Number of Earners in Alamosa
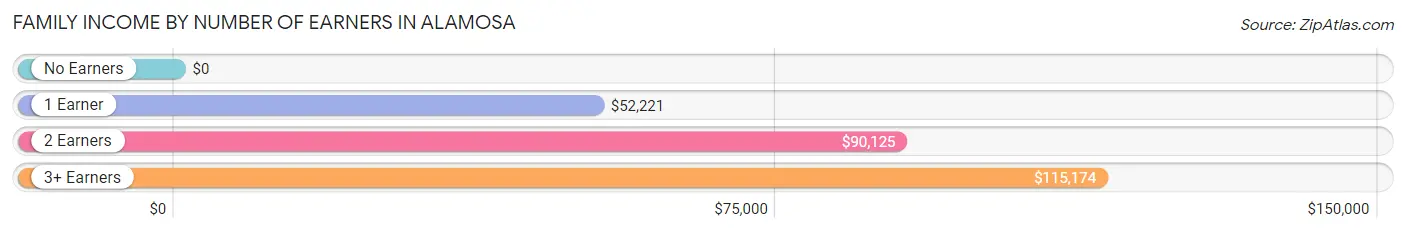
| Number of Earners | # Families | Median Income |
| No Earners | 176 (8.4%) | $0 |
| 1 Earner | 759 (36.3%) | $52,221 |
| 2 Earners | 829 (39.7%) | $90,125 |
| 3+ Earners | 326 (15.6%) | $115,174 |
| Total | 2,090 (100.0%) | $61,786 |
Household Income in Alamosa
Household Income Brackets in Alamosa
With 871 households falling in the category, the $50,000 to $74,999 income range is the most frequent in Alamosa, accounting for 22.4% of all households. In contrast, only 132 households (3.4%) fall into the $150,000 to $199,999 income bracket, making it the least populous group.
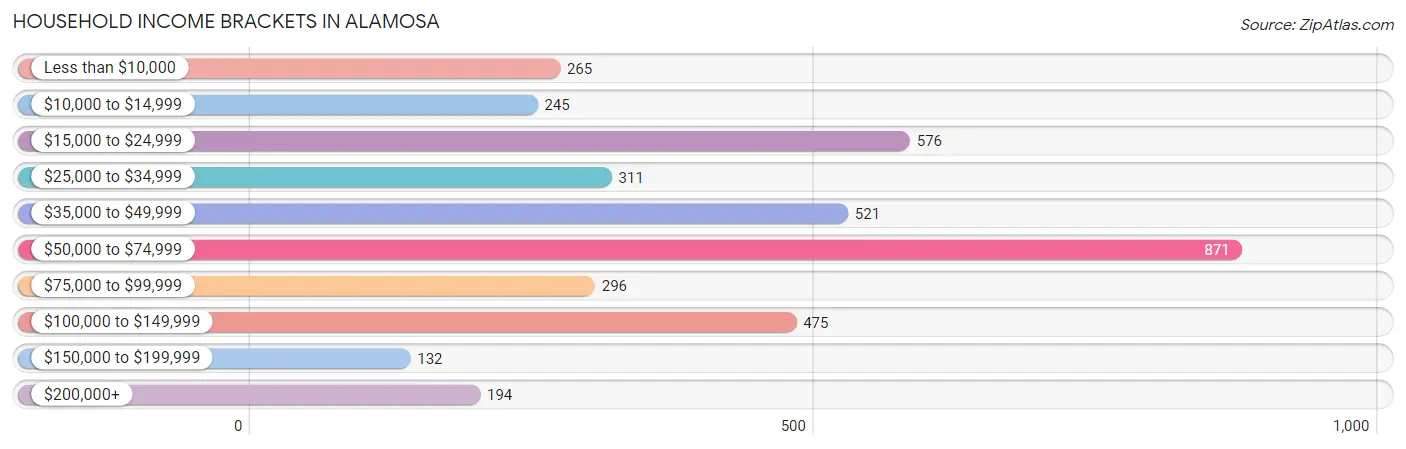
| Income Bracket | # Households | % Households |
| Less than $10,000 | 265 | 6.8% |
| $10,000 to $14,999 | 245 | 6.3% |
| $15,000 to $24,999 | 576 | 14.8% |
| $25,000 to $34,999 | 311 | 8.0% |
| $35,000 to $49,999 | 521 | 13.4% |
| $50,000 to $74,999 | 871 | 22.4% |
| $75,000 to $99,999 | 296 | 7.6% |
| $100,000 to $149,999 | 475 | 12.2% |
| $150,000 to $199,999 | 132 | 3.4% |
| $200,000+ | 194 | 5.0% |
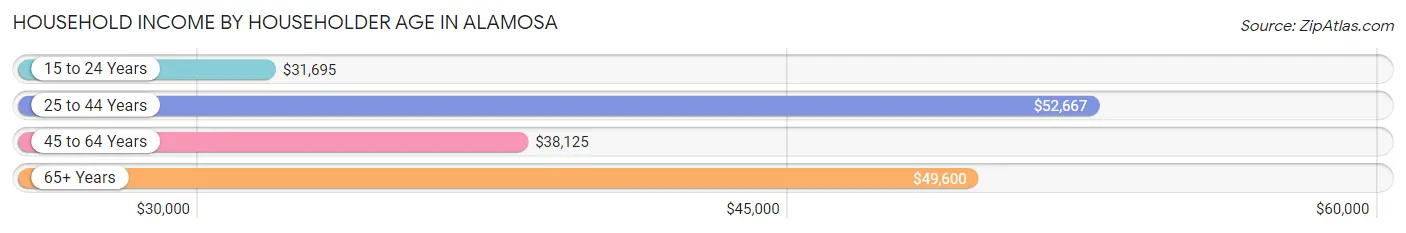
Household Income by Householder Age in Alamosa
The median household income in Alamosa is $50,239, with the highest median household income of $52,667 found in the 25 to 44 years age bracket for the primary householder. A total of 1,678 households (43.1%) fall into this category. Meanwhile, the 15 to 24 years age bracket for the primary householder has the lowest median household income of $31,695, with 587 households (15.1%) in this group.
| Income Bracket | # Households | Median Income |
| 15 to 24 Years | 587 (15.1%) | $31,695 |
| 25 to 44 Years | 1,678 (43.1%) | $52,667 |
| 45 to 64 Years | 885 (22.8%) | $38,125 |
| 65+ Years | 740 (19.0%) | $49,600 |
| Total | 3,890 (100.0%) | $50,239 |
Poverty in Alamosa
Income Below Poverty by Sex and Age in Alamosa
With 15.7% poverty level for males and 20.7% for females among the residents of Alamosa, 15 year old males and 12 to 14 year old females are the most vulnerable to poverty, with 28 males (50.0%) and 103 females (55.4%) in their respective age groups living below the poverty level.
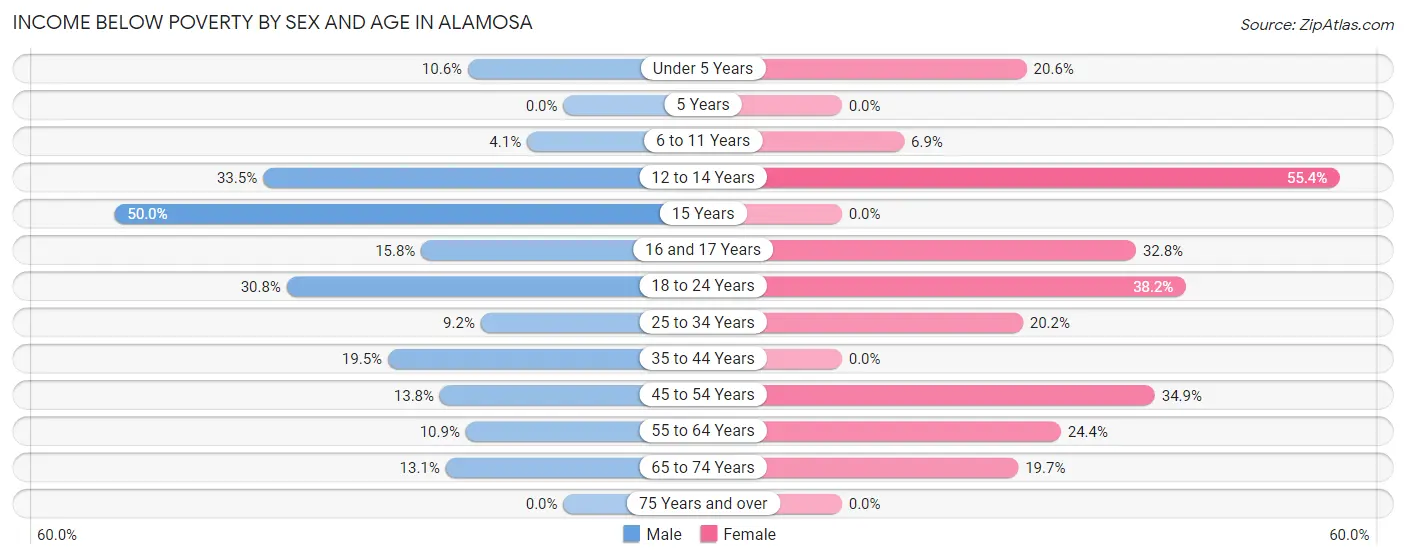
| Age Bracket | Male | Female |
| Under 5 Years | 32 (10.6%) | 49 (20.6%) |
| 5 Years | 0 (0.0%) | 0 (0.0%) |
| 6 to 11 Years | 24 (4.1%) | 27 (6.9%) |
| 12 to 14 Years | 92 (33.5%) | 103 (55.4%) |
| 15 Years | 28 (50.0%) | 0 (0.0%) |
| 16 and 17 Years | 22 (15.8%) | 38 (32.8%) |
| 18 to 24 Years | 179 (30.8%) | 273 (38.2%) |
| 25 to 34 Years | 55 (9.2%) | 150 (20.2%) |
| 35 to 44 Years | 144 (19.5%) | 0 (0.0%) |
| 45 to 54 Years | 37 (13.8%) | 129 (34.9%) |
| 55 to 64 Years | 40 (10.9%) | 120 (24.4%) |
| 65 to 74 Years | 40 (13.1%) | 68 (19.7%) |
| 75 Years and over | 0 (0.0%) | 0 (0.0%) |
| Total | 693 (15.7%) | 957 (20.7%) |
Income Above Poverty by Sex and Age in Alamosa
According to the poverty statistics in Alamosa, males aged 5 years and females aged 5 years are the age groups that are most secure financially, with 100.0% of males and 100.0% of females in these age groups living above the poverty line.
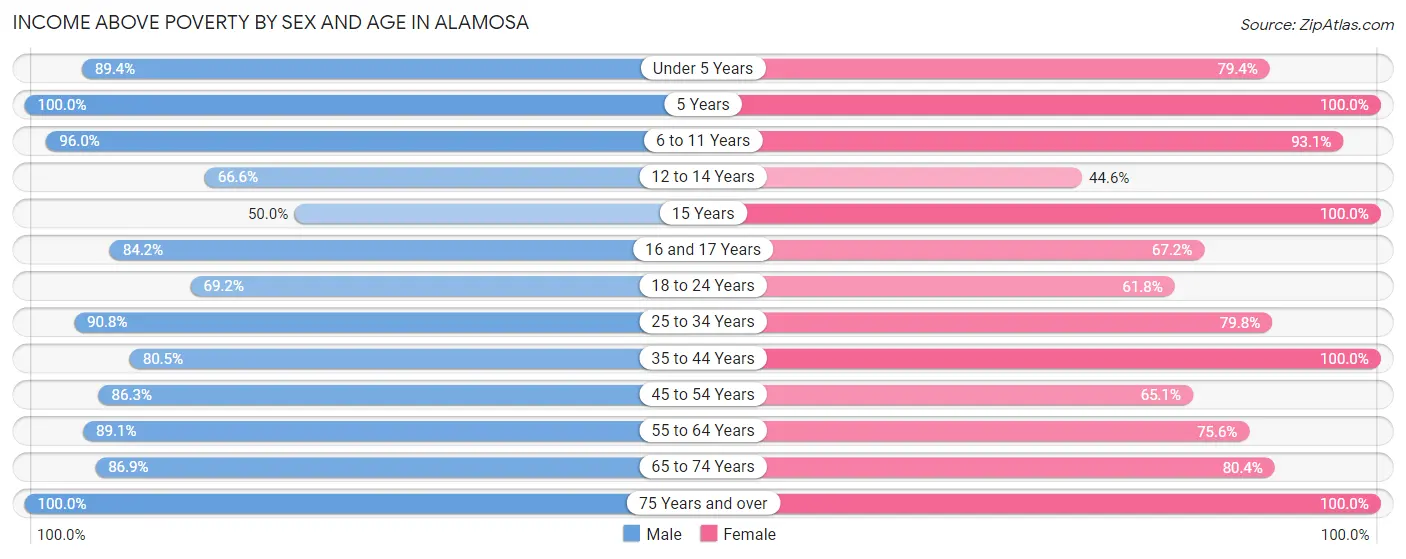
| Age Bracket | Male | Female |
| Under 5 Years | 269 (89.4%) | 189 (79.4%) |
| 5 Years | 56 (100.0%) | 162 (100.0%) |
| 6 to 11 Years | 568 (96.0%) | 362 (93.1%) |
| 12 to 14 Years | 183 (66.5%) | 83 (44.6%) |
| 15 Years | 28 (50.0%) | 68 (100.0%) |
| 16 and 17 Years | 117 (84.2%) | 78 (67.2%) |
| 18 to 24 Years | 402 (69.2%) | 441 (61.8%) |
| 25 to 34 Years | 543 (90.8%) | 594 (79.8%) |
| 35 to 44 Years | 593 (80.5%) | 585 (100.0%) |
| 45 to 54 Years | 232 (86.3%) | 241 (65.1%) |
| 55 to 64 Years | 328 (89.1%) | 372 (75.6%) |
| 65 to 74 Years | 265 (86.9%) | 278 (80.3%) |
| 75 Years and over | 137 (100.0%) | 204 (100.0%) |
| Total | 3,721 (84.3%) | 3,657 (79.3%) |
Income Below Poverty Among Married-Couple Families in Alamosa
The poverty statistics for married-couple families in Alamosa show that 7.3% or 100 of the total 1,369 families live below the poverty line. Families with 5 or more children have the highest poverty rate of 53.1%, comprising of 34 families. On the other hand, families with 1 or 2 children have the lowest poverty rate of 0.0%, which includes 0 families.
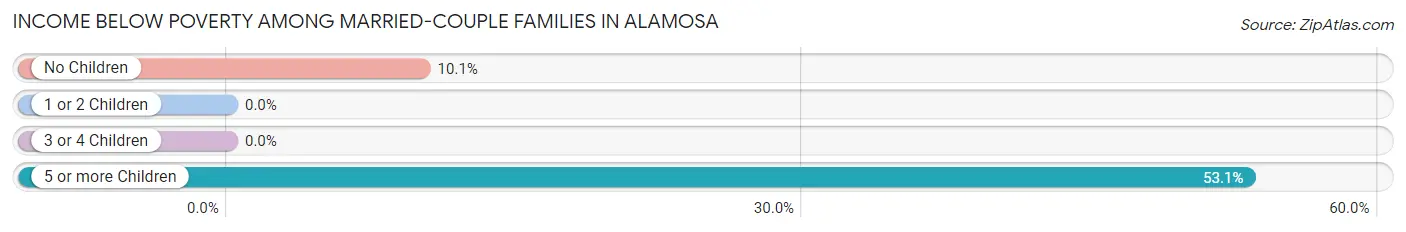
| Children | Above Poverty | Below Poverty |
| No Children | 590 (89.9%) | 66 (10.1%) |
| 1 or 2 Children | 553 (100.0%) | 0 (0.0%) |
| 3 or 4 Children | 96 (100.0%) | 0 (0.0%) |
| 5 or more Children | 30 (46.9%) | 34 (53.1%) |
| Total | 1,269 (92.7%) | 100 (7.3%) |
Income Below Poverty Among Single-Parent Households in Alamosa
According to the poverty data in Alamosa, 12.6% or 42 single-father households and 30.1% or 117 single-mother households are living below the poverty line. Among single-father households, those with 1 or 2 children have the highest poverty rate, with 31 households (32.0%) experiencing poverty. Likewise, among single-mother households, those with 1 or 2 children have the highest poverty rate, with 100 households (39.4%) falling below the poverty line.
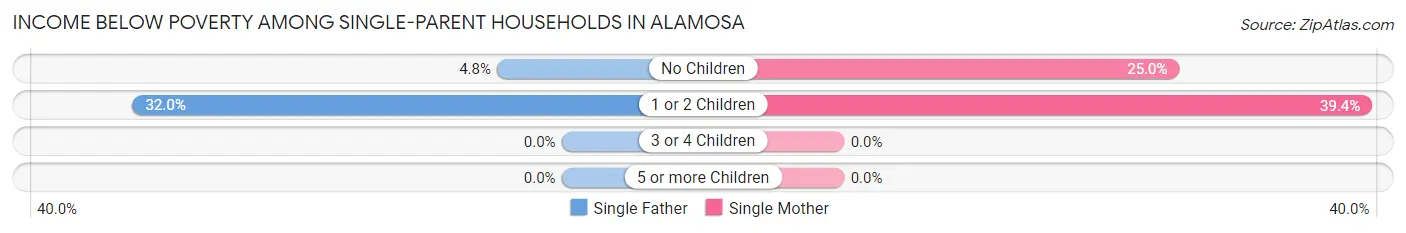
| Children | Single Father | Single Mother |
| No Children | 11 (4.8%) | 17 (25.0%) |
| 1 or 2 Children | 31 (32.0%) | 100 (39.4%) |
| 3 or 4 Children | 0 (0.0%) | 0 (0.0%) |
| 5 or more Children | 0 (0.0%) | 0 (0.0%) |
| Total | 42 (12.6%) | 117 (30.1%) |
Income Below Poverty Among Married-Couple vs Single-Parent Households in Alamosa
The poverty data for Alamosa shows that 100 of the married-couple family households (7.3%) and 159 of the single-parent households (22.1%) are living below the poverty level. Within the married-couple family households, those with 5 or more children have the highest poverty rate, with 34 households (53.1%) falling below the poverty line. Among the single-parent households, those with 1 or 2 children have the highest poverty rate, with 131 household (37.3%) living below poverty.
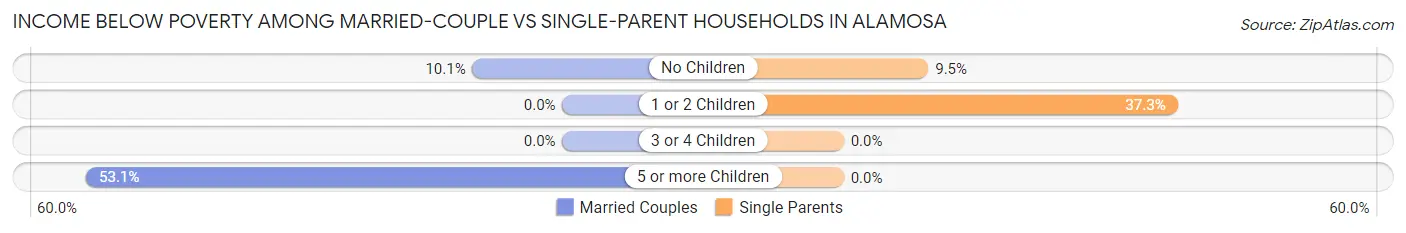
| Children | Married-Couple Families | Single-Parent Households |
| No Children | 66 (10.1%) | 28 (9.5%) |
| 1 or 2 Children | 0 (0.0%) | 131 (37.3%) |
| 3 or 4 Children | 0 (0.0%) | 0 (0.0%) |
| 5 or more Children | 34 (53.1%) | 0 (0.0%) |
| Total | 100 (7.3%) | 159 (22.1%) |
Race in Alamosa
The most populous races in Alamosa are White / Caucasian (6,091 | 62.2%), Hispanic or Latino (5,276 | 53.9%), and Two or more Races (2,041 | 20.8%).
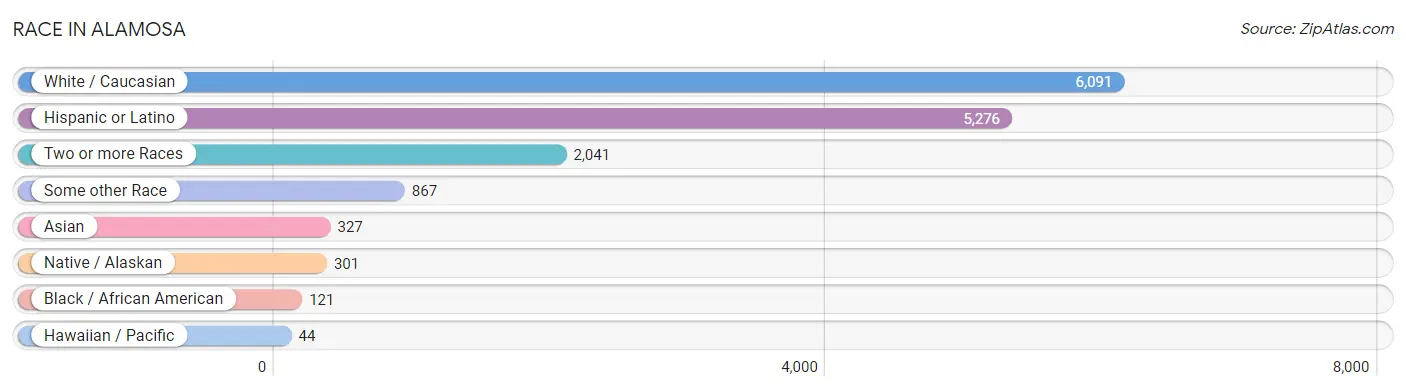
| Race | # Population | % Population |
| Asian | 327 | 3.3% |
| Black / African American | 121 | 1.2% |
| Hawaiian / Pacific | 44 | 0.4% |
| Hispanic or Latino | 5,276 | 53.9% |
| Native / Alaskan | 301 | 3.1% |
| White / Caucasian | 6,091 | 62.2% |
| Two or more Races | 2,041 | 20.8% |
| Some other Race | 867 | 8.8% |
| Total | 9,792 | 100.0% |
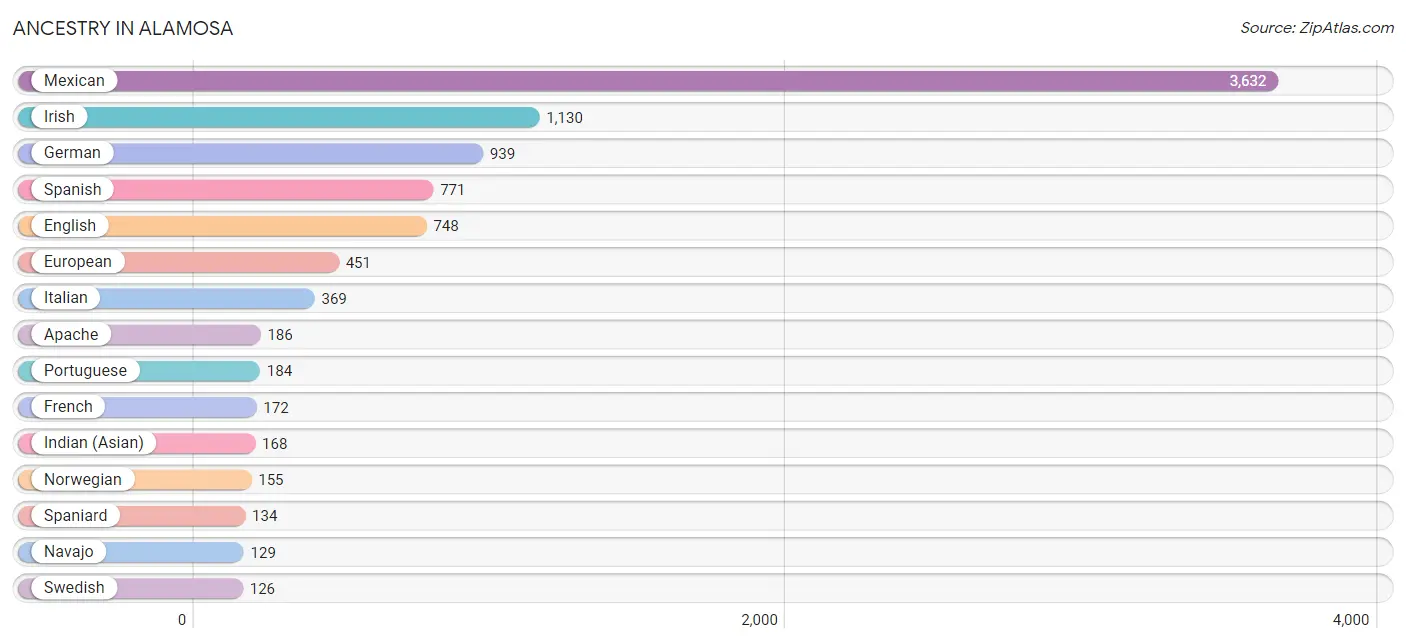
Ancestry in Alamosa
The most populous ancestries reported in Alamosa are Mexican (3,632 | 37.1%), Irish (1,130 | 11.5%), German (939 | 9.6%), Spanish (771 | 7.9%), and English (748 | 7.6%), together accounting for 73.7% of all Alamosa residents.
| Ancestry | # Population | % Population |
| American | 109 | 1.1% |
| Apache | 186 | 1.9% |
| Austrian | 88 | 0.9% |
| Bhutanese | 8 | 0.1% |
| Blackfeet | 79 | 0.8% |
| British | 81 | 0.8% |
| Burmese | 96 | 1.0% |
| Canadian | 24 | 0.3% |
| Central American | 49 | 0.5% |
| Cuban | 10 | 0.1% |
| Czech | 7 | 0.1% |
| Danish | 24 | 0.3% |
| Dutch | 56 | 0.6% |
| Eastern European | 11 | 0.1% |
| English | 748 | 7.6% |
| Ethiopian | 3 | 0.0% |
| European | 451 | 4.6% |
| French | 172 | 1.8% |
| German | 939 | 9.6% |
| Greek | 22 | 0.2% |
| Guamanian / Chamorro | 38 | 0.4% |
| Hungarian | 13 | 0.1% |
| Indian (Asian) | 168 | 1.7% |
| Irish | 1,130 | 11.5% |
| Italian | 369 | 3.8% |
| Korean | 27 | 0.3% |
| Lithuanian | 75 | 0.8% |
| Mexican | 3,632 | 37.1% |
| Native Hawaiian | 42 | 0.4% |
| Navajo | 129 | 1.3% |
| Nigerian | 23 | 0.2% |
| Norwegian | 155 | 1.6% |
| Pakistani | 38 | 0.4% |
| Polish | 56 | 0.6% |
| Portuguese | 184 | 1.9% |
| Pueblo | 35 | 0.4% |
| Puerto Rican | 97 | 1.0% |
| Russian | 6 | 0.1% |
| Salvadoran | 5 | 0.1% |
| Scandinavian | 62 | 0.6% |
| Scotch-Irish | 73 | 0.7% |
| Scottish | 44 | 0.4% |
| Sioux | 122 | 1.3% |
| Spaniard | 134 | 1.4% |
| Spanish | 771 | 7.9% |
| Sri Lankan | 85 | 0.9% |
| Subsaharan African | 26 | 0.3% |
| Swedish | 126 | 1.3% |
| Swiss | 31 | 0.3% |
| Ute | 1 | 0.0% |
| Welsh | 6 | 0.1% |
| Yugoslavian | 11 | 0.1% | View All 52 Rows |
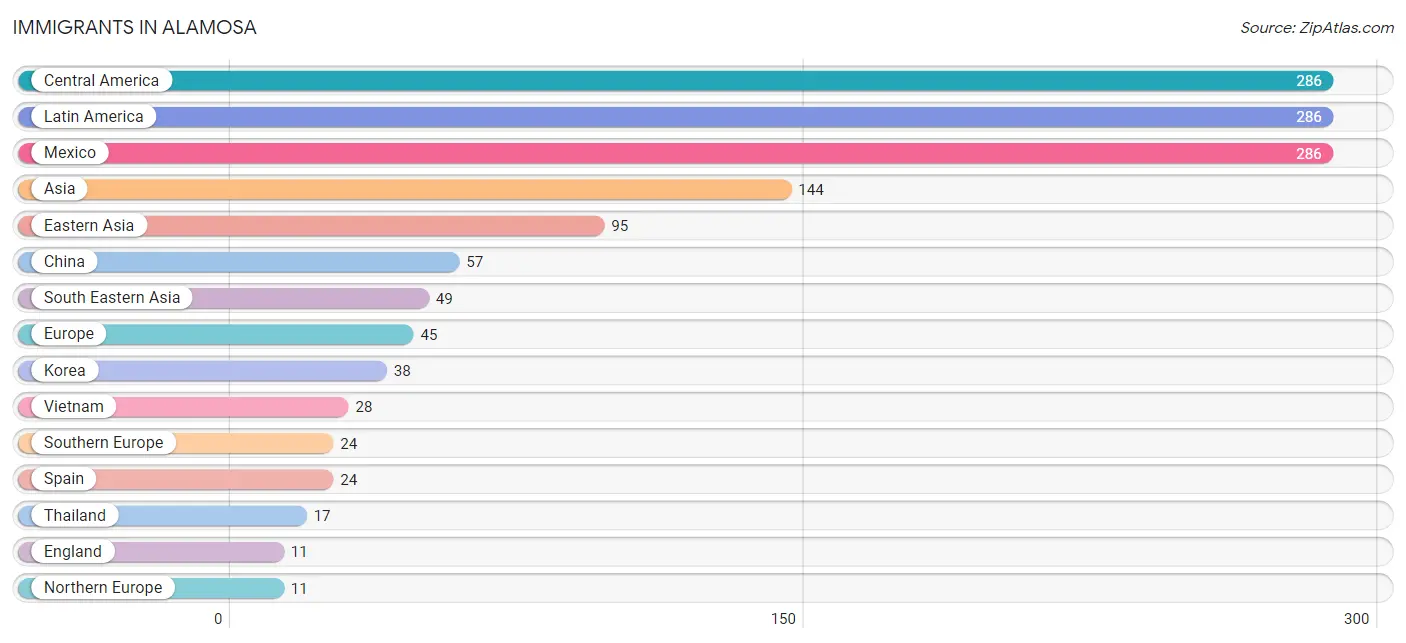
Immigrants in Alamosa
The most numerous immigrant groups reported in Alamosa came from Central America (286 | 2.9%), Latin America (286 | 2.9%), Mexico (286 | 2.9%), Asia (144 | 1.5%), and Eastern Asia (95 | 1.0%), together accounting for 11.2% of all Alamosa residents.
| Immigration Origin | # Population | % Population |
| Asia | 144 | 1.5% |
| Central America | 286 | 2.9% |
| China | 57 | 0.6% |
| Eastern Asia | 95 | 1.0% |
| England | 11 | 0.1% |
| Europe | 45 | 0.5% |
| Korea | 38 | 0.4% |
| Latin America | 286 | 2.9% |
| Mexico | 286 | 2.9% |
| Netherlands | 5 | 0.1% |
| Northern Europe | 11 | 0.1% |
| Philippines | 4 | 0.0% |
| South Eastern Asia | 49 | 0.5% |
| Southern Europe | 24 | 0.3% |
| Spain | 24 | 0.3% |
| Switzerland | 5 | 0.1% |
| Thailand | 17 | 0.2% |
| Vietnam | 28 | 0.3% |
| Western Europe | 10 | 0.1% | View All 19 Rows |
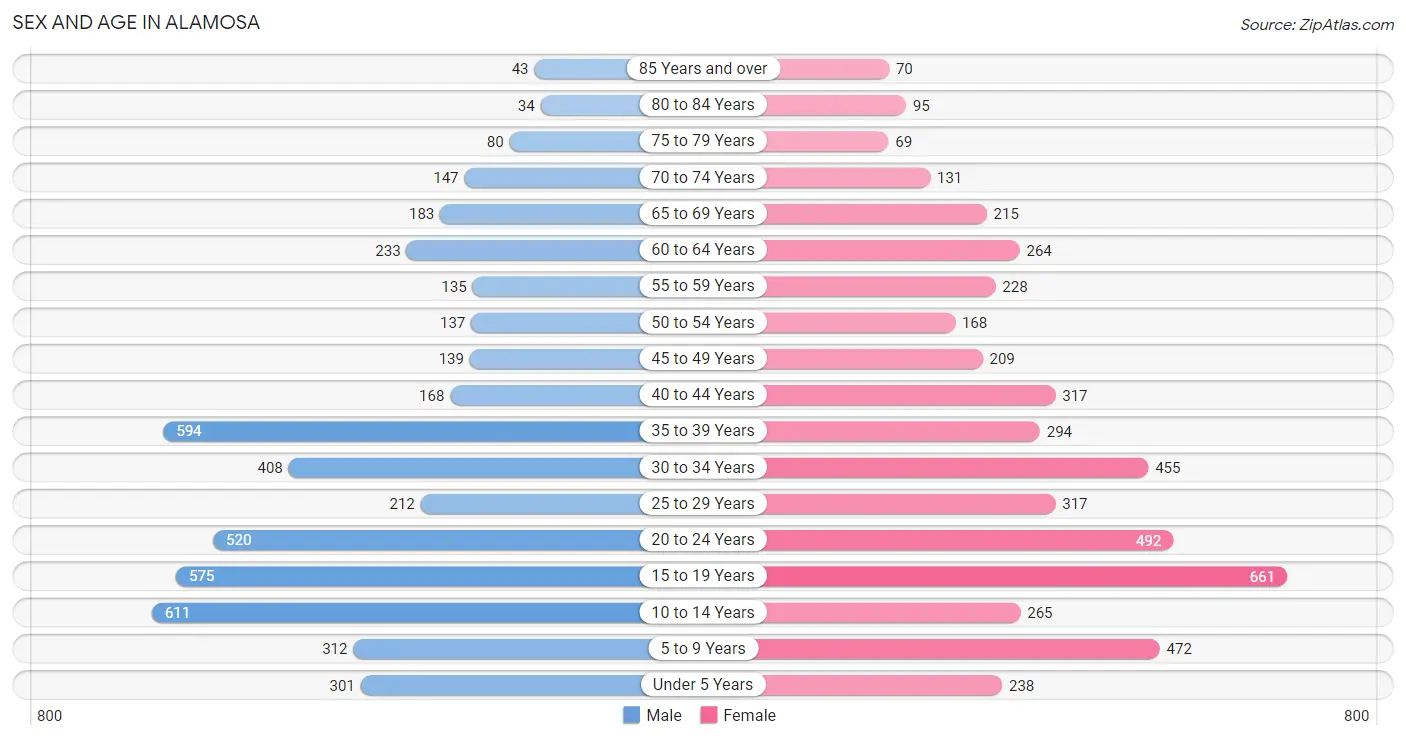
Sex and Age in Alamosa
Sex and Age in Alamosa
The most populous age groups in Alamosa are 10 to 14 Years (611 | 12.6%) for men and 15 to 19 Years (661 | 13.3%) for women.
| Age Bracket | Male | Female |
| Under 5 Years | 301 (6.2%) | 238 (4.8%) |
| 5 to 9 Years | 312 (6.5%) | 472 (9.5%) |
| 10 to 14 Years | 611 (12.6%) | 265 (5.3%) |
| 15 to 19 Years | 575 (11.9%) | 661 (13.3%) |
| 20 to 24 Years | 520 (10.8%) | 492 (9.9%) |
| 25 to 29 Years | 212 (4.4%) | 317 (6.4%) |
| 30 to 34 Years | 408 (8.4%) | 455 (9.2%) |
| 35 to 39 Years | 594 (12.3%) | 294 (5.9%) |
| 40 to 44 Years | 168 (3.5%) | 317 (6.4%) |
| 45 to 49 Years | 139 (2.9%) | 209 (4.2%) |
| 50 to 54 Years | 137 (2.8%) | 168 (3.4%) |
| 55 to 59 Years | 135 (2.8%) | 228 (4.6%) |
| 60 to 64 Years | 233 (4.8%) | 264 (5.3%) |
| 65 to 69 Years | 183 (3.8%) | 215 (4.3%) |
| 70 to 74 Years | 147 (3.0%) | 131 (2.6%) |
| 75 to 79 Years | 80 (1.7%) | 69 (1.4%) |
| 80 to 84 Years | 34 (0.7%) | 95 (1.9%) |
| 85 Years and over | 43 (0.9%) | 70 (1.4%) |
| Total | 4,832 (100.0%) | 4,960 (100.0%) |
Families and Households in Alamosa
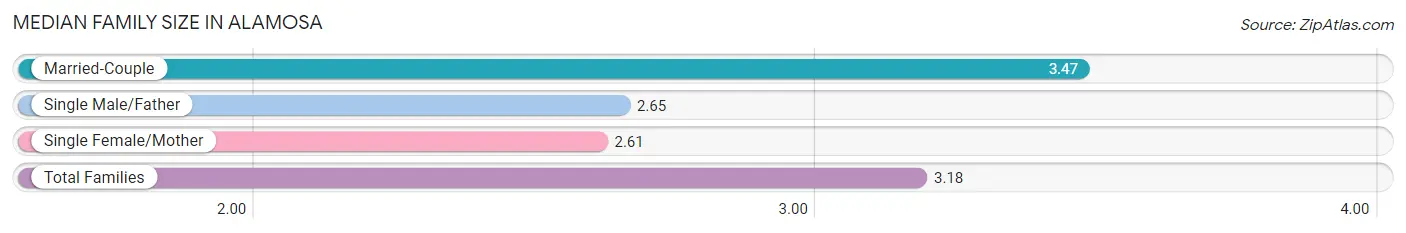
Median Family Size in Alamosa
The median family size in Alamosa is 3.18 persons per family, with married-couple families (1,369 | 65.5%) accounting for the largest median family size of 3.47 persons per family. On the other hand, single female/mother families (388 | 18.6%) represent the smallest median family size with 2.61 persons per family.
| Family Type | # Families | Family Size |
| Married-Couple | 1,369 (65.5%) | 3.47 |
| Single Male/Father | 333 (15.9%) | 2.65 |
| Single Female/Mother | 388 (18.6%) | 2.61 |
| Total Families | 2,090 (100.0%) | 3.18 |
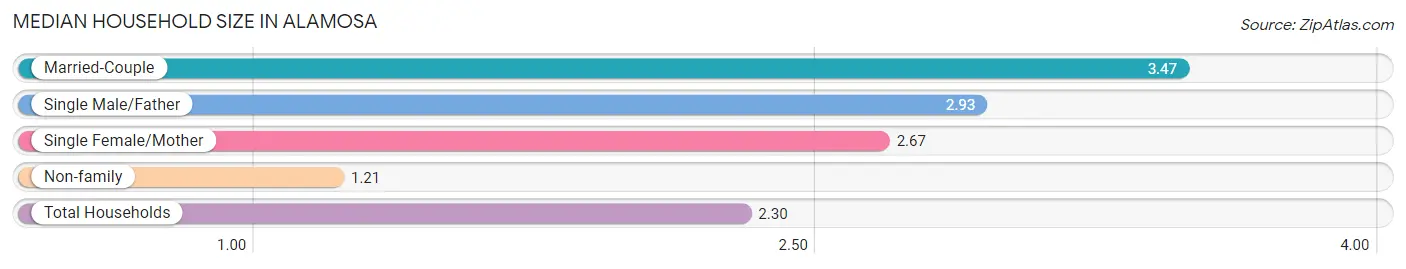
Median Household Size in Alamosa
The median household size in Alamosa is 2.30 persons per household, with married-couple households (1,369 | 35.2%) accounting for the largest median household size of 3.47 persons per household. non-family households (1,800 | 46.3%) represent the smallest median household size with 1.21 persons per household.
| Household Type | # Households | Household Size |
| Married-Couple | 1,369 (35.2%) | 3.47 |
| Single Male/Father | 333 (8.6%) | 2.93 |
| Single Female/Mother | 388 (10.0%) | 2.67 |
| Non-family | 1,800 (46.3%) | 1.21 |
| Total Households | 3,890 (100.0%) | 2.30 |
Household Size by Marriage Status in Alamosa
Out of a total of 3,890 households in Alamosa, 2,090 (53.7%) are family households, while 1,800 (46.3%) are nonfamily households. The most numerous type of family households are 2-person households, comprising 758, and the most common type of nonfamily households are 1-person households, comprising 1,421.
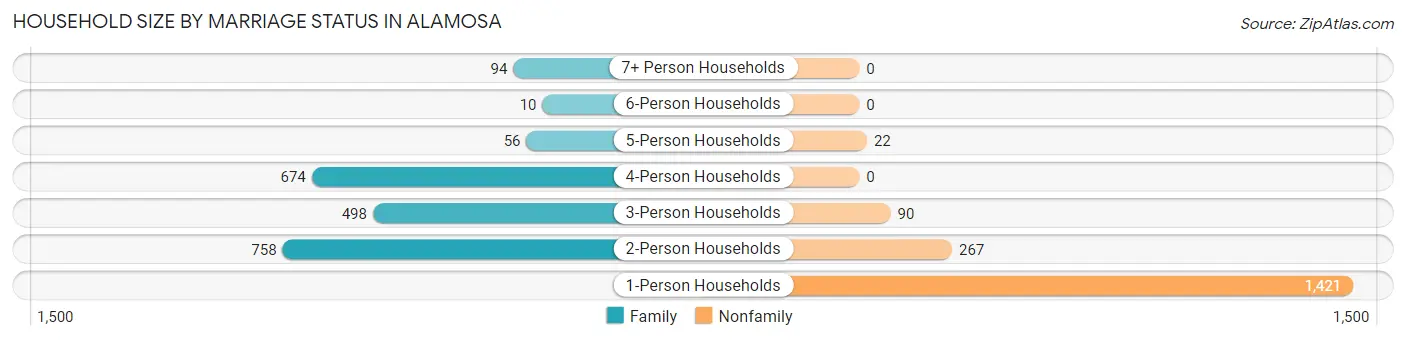
| Household Size | Family Households | Nonfamily Households |
| 1-Person Households | - | 1,421 (36.5%) |
| 2-Person Households | 758 (19.5%) | 267 (6.9%) |
| 3-Person Households | 498 (12.8%) | 90 (2.3%) |
| 4-Person Households | 674 (17.3%) | 0 (0.0%) |
| 5-Person Households | 56 (1.4%) | 22 (0.6%) |
| 6-Person Households | 10 (0.3%) | 0 (0.0%) |
| 7+ Person Households | 94 (2.4%) | 0 (0.0%) |
| Total | 2,090 (53.7%) | 1,800 (46.3%) |
Female Fertility in Alamosa
Fertility by Age in Alamosa
Average fertility rate in Alamosa is 54.0 births per 1,000 women. Women in the age bracket of 20 to 34 years have the highest fertility rate with 73.0 births per 1,000 women. Women in the age bracket of 20 to 34 years acount for 60.5% of all women with births.
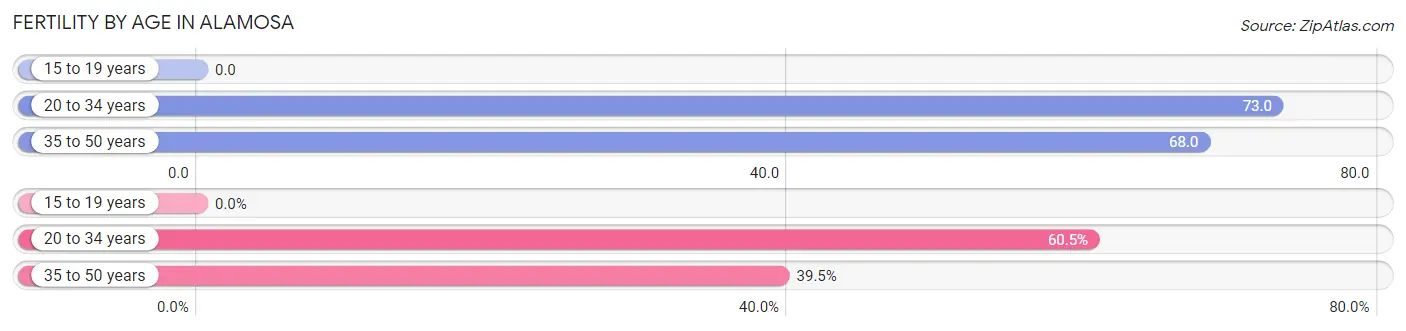
| Age Bracket | Women with Births | Births / 1,000 Women |
| 15 to 19 years | 0 (0.0%) | 0.0 |
| 20 to 34 years | 92 (60.5%) | 73.0 |
| 35 to 50 years | 60 (39.5%) | 68.0 |
| Total | 152 (100.0%) | 54.0 |
Fertility by Age by Marriage Status in Alamosa
54.6% of women with births (152) in Alamosa are married. The highest percentage of unmarried women with births falls into 20 to 34 years age bracket with 75.0% of them unmarried at the time of birth, while the lowest percentage of unmarried women with births belong to 35 to 50 years age bracket with 0.0% of them unmarried.
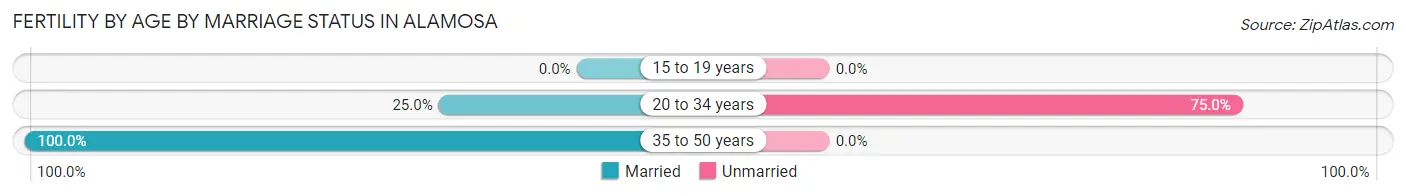
| Age Bracket | Married | Unmarried |
| 15 to 19 years | 0 (0.0%) | 0 (0.0%) |
| 20 to 34 years | 23 (25.0%) | 69 (75.0%) |
| 35 to 50 years | 60 (100.0%) | 0 (0.0%) |
| Total | 83 (54.6%) | 69 (45.4%) |
Fertility by Education in Alamosa
Average fertility rate in Alamosa is 54.0 births per 1,000 women. Women with the education attainment of graduate degree have the highest fertility rate of 106.0 births per 1,000 women, while women with the education attainment of high school diploma have the lowest fertility at 14.0 births per 1,000 women. Women with the education attainment of college or associate's degree represent 48.0% of all women with births.
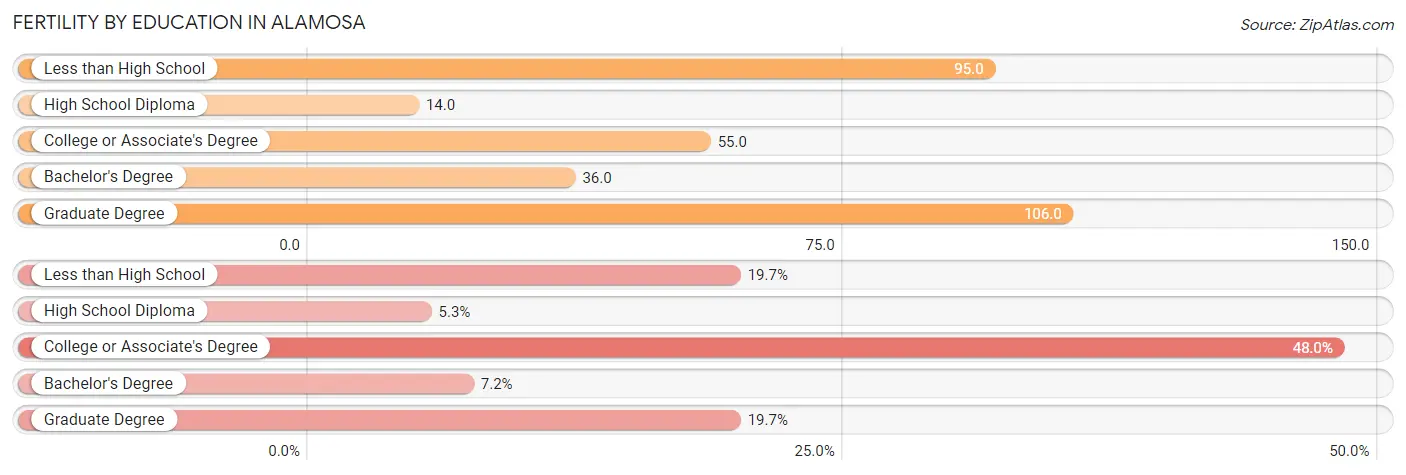
| Educational Attainment | Women with Births | Births / 1,000 Women |
| Less than High School | 30 (19.7%) | 95.0 |
| High School Diploma | 8 (5.3%) | 14.0 |
| College or Associate's Degree | 73 (48.0%) | 55.0 |
| Bachelor's Degree | 11 (7.2%) | 36.0 |
| Graduate Degree | 30 (19.7%) | 106.0 |
| Total | 152 (100.0%) | 54.0 |
Fertility by Education by Marriage Status in Alamosa
45.4% of women with births in Alamosa are unmarried. Women with the educational attainment of less than high school are most likely to be married with 100.0% of them married at childbirth, while women with the educational attainment of high school diploma are least likely to be married with 100.0% of them unmarried at childbirth.
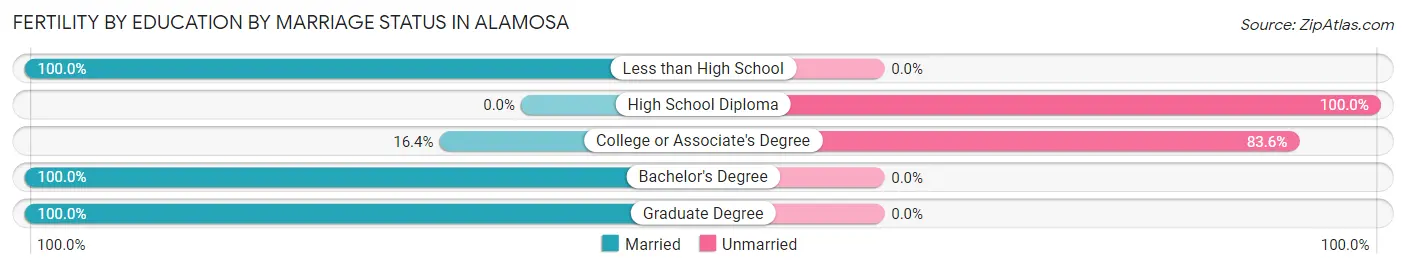
| Educational Attainment | Married | Unmarried |
| Less than High School | 30 (100.0%) | 0 (0.0%) |
| High School Diploma | 0 (0.0%) | 8 (100.0%) |
| College or Associate's Degree | 12 (16.4%) | 61 (83.6%) |
| Bachelor's Degree | 11 (100.0%) | 0 (0.0%) |
| Graduate Degree | 30 (100.0%) | 0 (0.0%) |
| Total | 83 (54.6%) | 69 (45.4%) |
Employment Characteristics in Alamosa
Employment by Class of Employer in Alamosa
Among the 4,305 employed individuals in Alamosa, private company employees (2,511 | 58.3%), state government employees (552 | 12.8%), and local government employees (528 | 12.3%) make up the most common classes of employment.
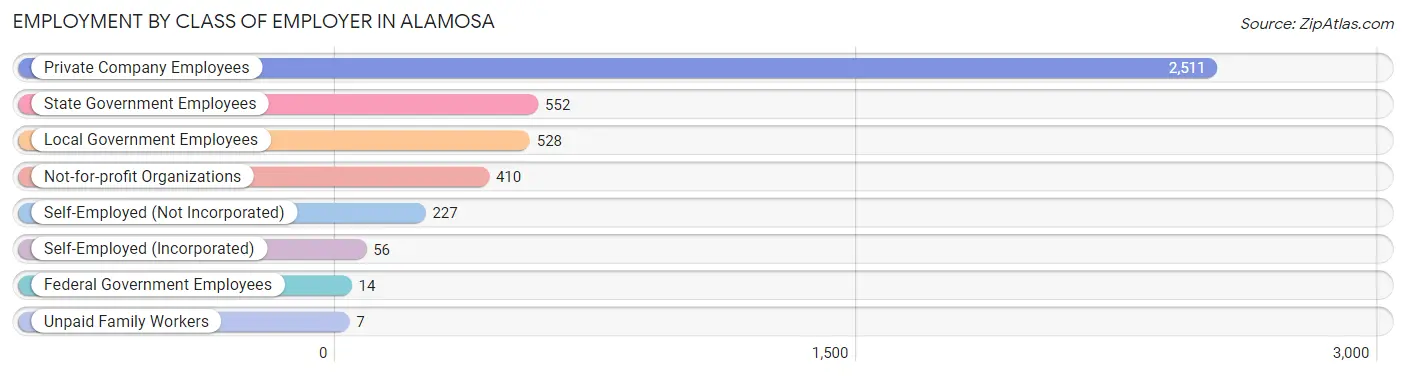
| Employer Class | # Employees | % Employees |
| Private Company Employees | 2,511 | 58.3% |
| Self-Employed (Incorporated) | 56 | 1.3% |
| Self-Employed (Not Incorporated) | 227 | 5.3% |
| Not-for-profit Organizations | 410 | 9.5% |
| Local Government Employees | 528 | 12.3% |
| State Government Employees | 552 | 12.8% |
| Federal Government Employees | 14 | 0.3% |
| Unpaid Family Workers | 7 | 0.2% |
| Total | 4,305 | 100.0% |
Employment Status by Age in Alamosa
According to the labor force statistics for Alamosa, out of the total population over 16 years of age (7,469), 62.2% or 4,646 individuals are in the labor force, with 3.9% or 181 of them unemployed. The age group with the highest labor force participation rate is 25 to 29 years, with 87.9% or 465 individuals in the labor force. Within the labor force, the 60 to 64 years age range has the highest percentage of unemployed individuals, with 17.2% or 30 of them being unemployed.
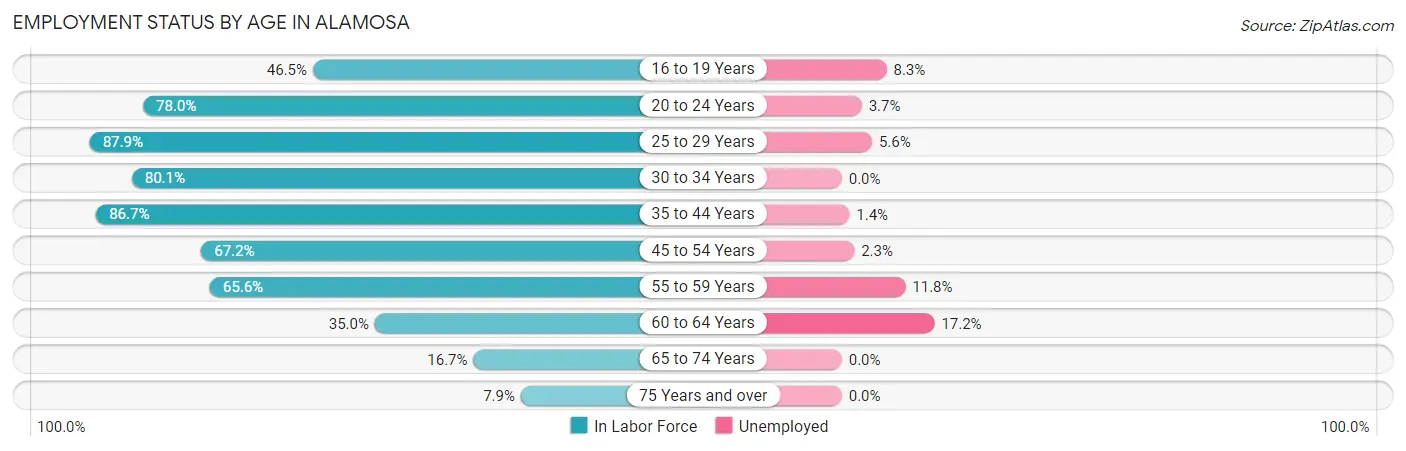
| Age Bracket | In Labor Force | Unemployed |
| 16 to 19 Years | 517 (46.5%) | 43 (8.3%) |
| 20 to 24 Years | 789 (78.0%) | 29 (3.7%) |
| 25 to 29 Years | 465 (87.9%) | 26 (5.6%) |
| 30 to 34 Years | 691 (80.1%) | 0 (0.0%) |
| 35 to 44 Years | 1,190 (86.7%) | 17 (1.4%) |
| 45 to 54 Years | 439 (67.2%) | 10 (2.3%) |
| 55 to 59 Years | 238 (65.6%) | 28 (11.8%) |
| 60 to 64 Years | 174 (35.0%) | 30 (17.2%) |
| 65 to 74 Years | 113 (16.7%) | 0 (0.0%) |
| 75 Years and over | 31 (7.9%) | 0 (0.0%) |
| Total | 4,646 (62.2%) | 181 (3.9%) |
Employment Status by Educational Attainment in Alamosa
According to labor force statistics for Alamosa, 74.7% of individuals (3,196) out of the total population between 25 and 64 years of age (4,278) are in the labor force, with 3.5% or 112 of them being unemployed. The group with the highest labor force participation rate are those with the educational attainment of bachelor's degree or higher, with 89.2% or 1,065 individuals in the labor force. Within the labor force, individuals with less than high school education have the highest percentage of unemployment, with 16.8% or 20 of them being unemployed.
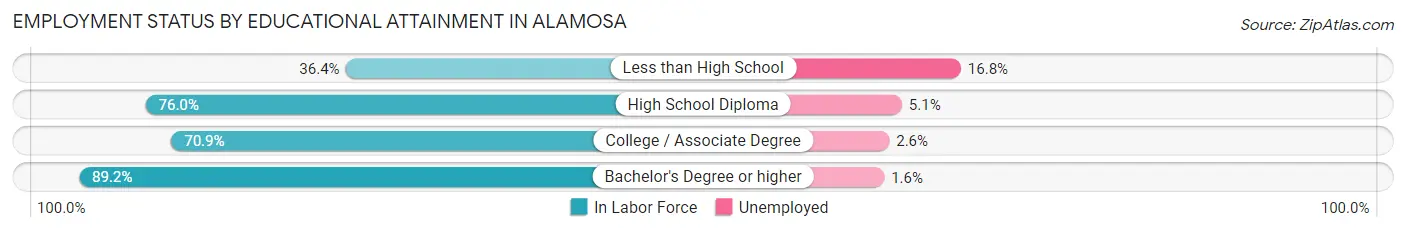
| Educational Attainment | In Labor Force | Unemployed |
| Less than High School | 119 (36.4%) | 55 (16.8%) |
| High School Diploma | 863 (76.0%) | 58 (5.1%) |
| College / Associate Degree | 1,149 (70.9%) | 42 (2.6%) |
| Bachelor's Degree or higher | 1,065 (89.2%) | 19 (1.6%) |
| Total | 3,196 (74.7%) | 150 (3.5%) |
Employment Occupations by Sex in Alamosa
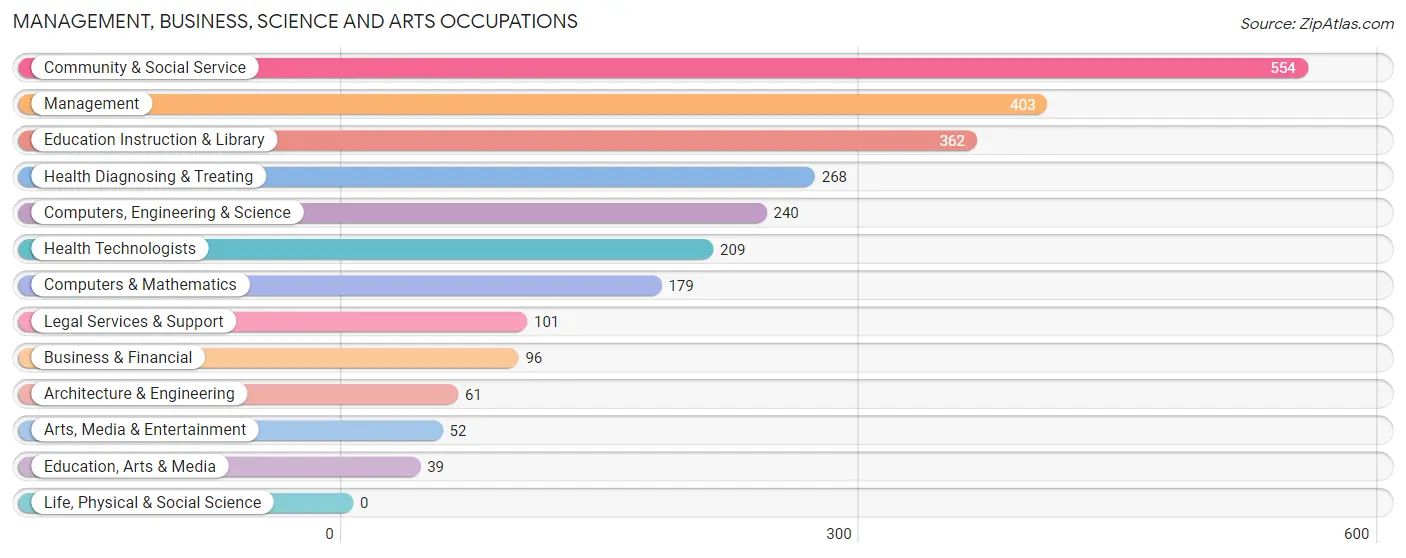
Management, Business, Science and Arts Occupations
The most common Management, Business, Science and Arts occupations in Alamosa are Community & Social Service (554 | 12.4%), Management (403 | 9.0%), Education Instruction & Library (362 | 8.1%), Health Diagnosing & Treating (268 | 6.0%), and Computers, Engineering & Science (240 | 5.4%).
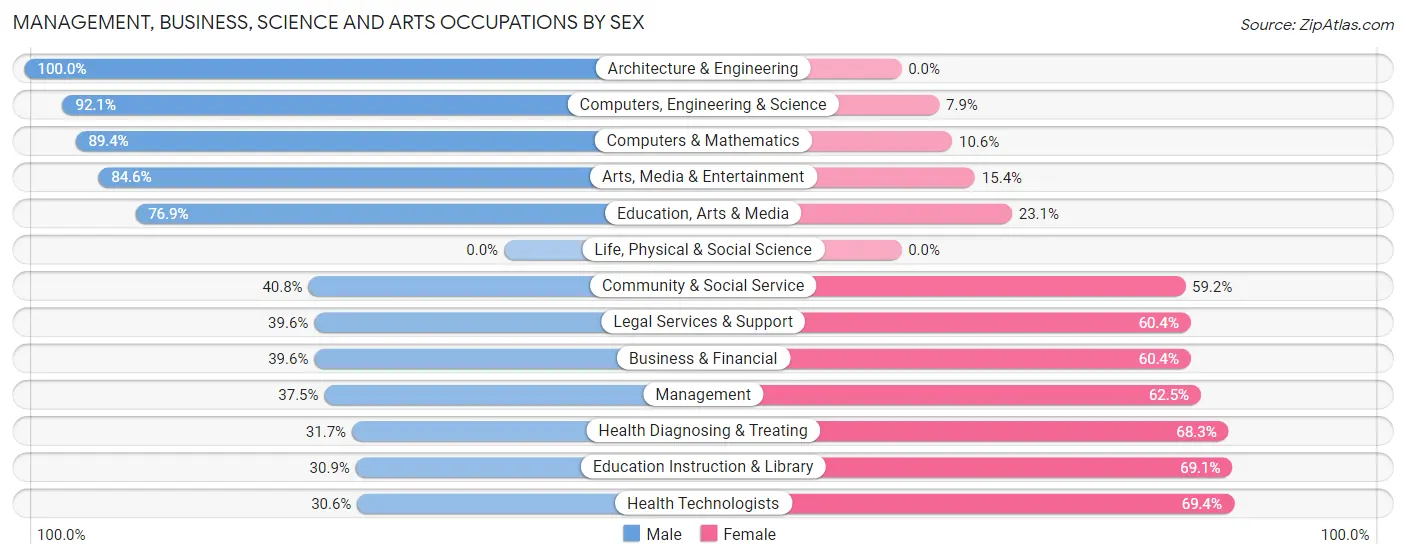
Management, Business, Science and Arts Occupations by Sex
Within the Management, Business, Science and Arts occupations in Alamosa, the most male-oriented occupations are Architecture & Engineering (100.0%), Computers, Engineering & Science (92.1%), and Computers & Mathematics (89.4%), while the most female-oriented occupations are Health Technologists (69.4%), Education Instruction & Library (69.1%), and Health Diagnosing & Treating (68.3%).
| Occupation | Male | Female |
| Management | 151 (37.5%) | 252 (62.5%) |
| Business & Financial | 38 (39.6%) | 58 (60.4%) |
| Computers, Engineering & Science | 221 (92.1%) | 19 (7.9%) |
| Computers & Mathematics | 160 (89.4%) | 19 (10.6%) |
| Architecture & Engineering | 61 (100.0%) | 0 (0.0%) |
| Life, Physical & Social Science | 0 (0.0%) | 0 (0.0%) |
| Community & Social Service | 226 (40.8%) | 328 (59.2%) |
| Education, Arts & Media | 30 (76.9%) | 9 (23.1%) |
| Legal Services & Support | 40 (39.6%) | 61 (60.4%) |
| Education Instruction & Library | 112 (30.9%) | 250 (69.1%) |
| Arts, Media & Entertainment | 44 (84.6%) | 8 (15.4%) |
| Health Diagnosing & Treating | 85 (31.7%) | 183 (68.3%) |
| Health Technologists | 64 (30.6%) | 145 (69.4%) |
| Total (Category) | 721 (46.2%) | 840 (53.8%) |
| Total (Overall) | 2,101 (47.1%) | 2,363 (52.9%) |
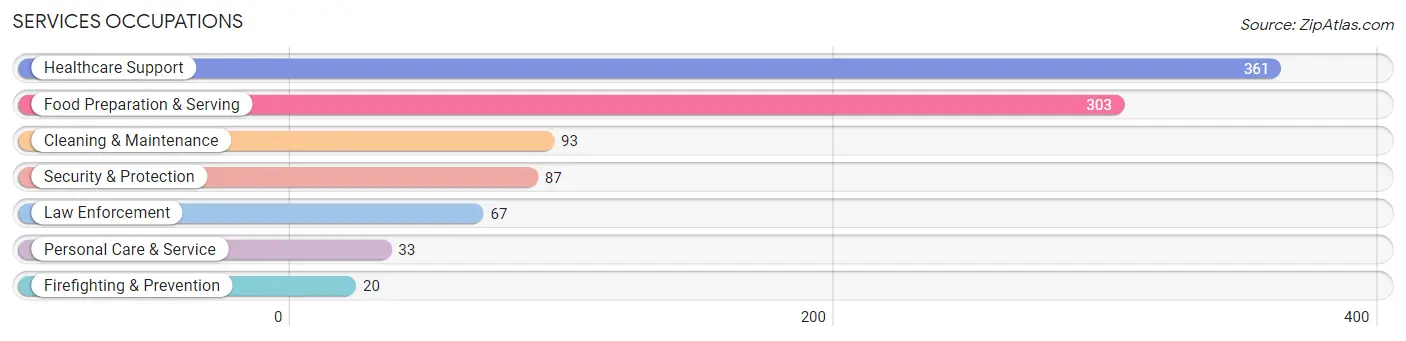
Services Occupations
The most common Services occupations in Alamosa are Healthcare Support (361 | 8.1%), Food Preparation & Serving (303 | 6.8%), Cleaning & Maintenance (93 | 2.1%), Security & Protection (87 | 1.9%), and Law Enforcement (67 | 1.5%).
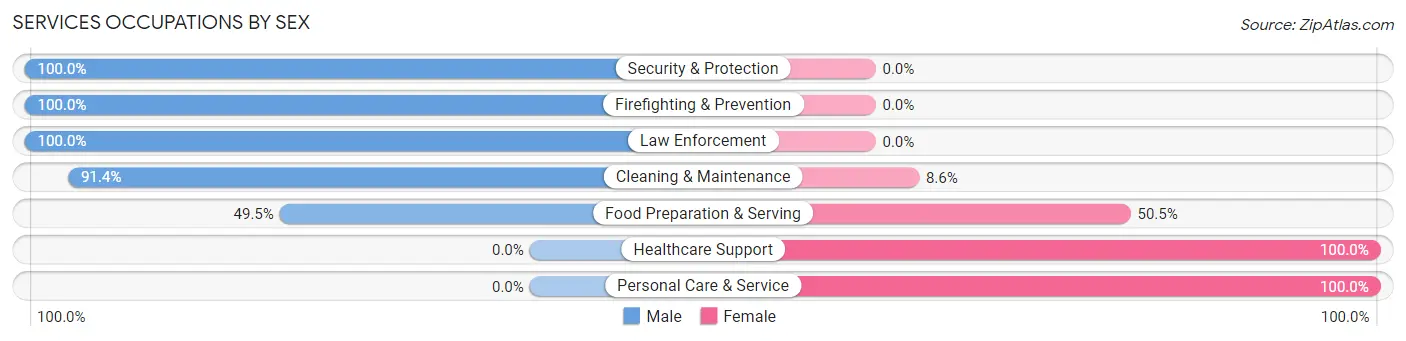
Services Occupations by Sex
Within the Services occupations in Alamosa, the most male-oriented occupations are Security & Protection (100.0%), Firefighting & Prevention (100.0%), and Law Enforcement (100.0%), while the most female-oriented occupations are Healthcare Support (100.0%), Personal Care & Service (100.0%), and Food Preparation & Serving (50.5%).
| Occupation | Male | Female |
| Healthcare Support | 0 (0.0%) | 361 (100.0%) |
| Security & Protection | 87 (100.0%) | 0 (0.0%) |
| Firefighting & Prevention | 20 (100.0%) | 0 (0.0%) |
| Law Enforcement | 67 (100.0%) | 0 (0.0%) |
| Food Preparation & Serving | 150 (49.5%) | 153 (50.5%) |
| Cleaning & Maintenance | 85 (91.4%) | 8 (8.6%) |
| Personal Care & Service | 0 (0.0%) | 33 (100.0%) |
| Total (Category) | 322 (36.7%) | 555 (63.3%) |
| Total (Overall) | 2,101 (47.1%) | 2,363 (52.9%) |
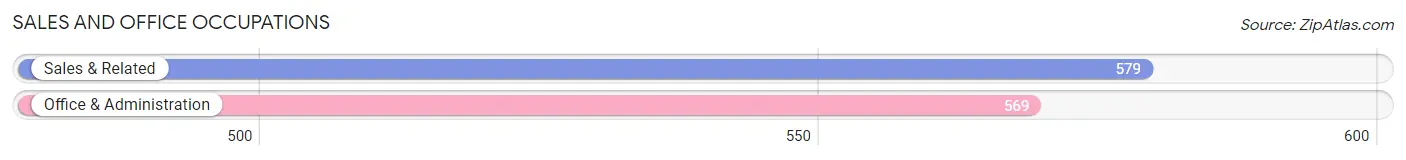
Sales and Office Occupations
The most common Sales and Office occupations in Alamosa are Sales & Related (579 | 13.0%), and Office & Administration (569 | 12.8%).
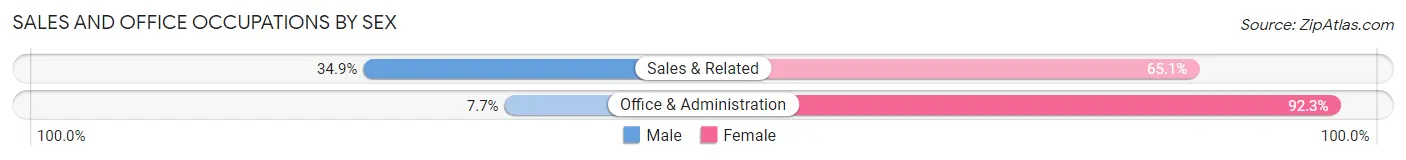
Sales and Office Occupations by Sex
| Occupation | Male | Female |
| Sales & Related | 202 (34.9%) | 377 (65.1%) |
| Office & Administration | 44 (7.7%) | 525 (92.3%) |
| Total (Category) | 246 (21.4%) | 902 (78.6%) |
| Total (Overall) | 2,101 (47.1%) | 2,363 (52.9%) |
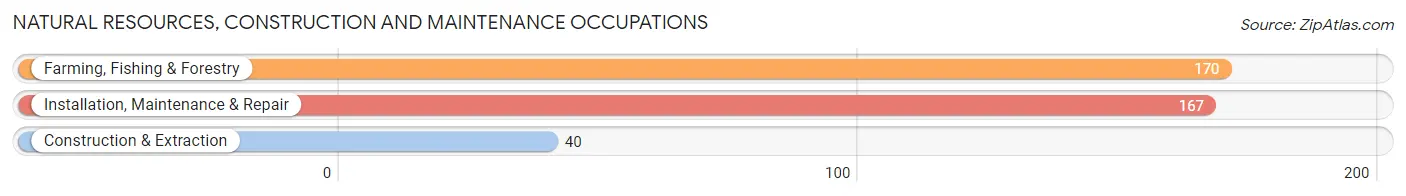
Natural Resources, Construction and Maintenance Occupations
The most common Natural Resources, Construction and Maintenance occupations in Alamosa are Farming, Fishing & Forestry (170 | 3.8%), Installation, Maintenance & Repair (167 | 3.7%), and Construction & Extraction (40 | 0.9%).
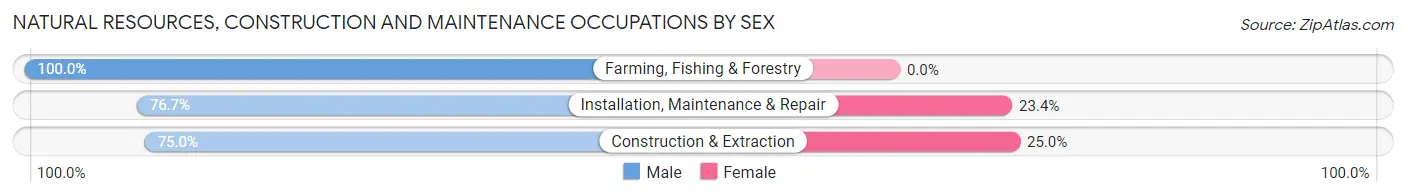
Natural Resources, Construction and Maintenance Occupations by Sex
| Occupation | Male | Female |
| Farming, Fishing & Forestry | 170 (100.0%) | 0 (0.0%) |
| Construction & Extraction | 30 (75.0%) | 10 (25.0%) |
| Installation, Maintenance & Repair | 128 (76.6%) | 39 (23.4%) |
| Total (Category) | 328 (87.0%) | 49 (13.0%) |
| Total (Overall) | 2,101 (47.1%) | 2,363 (52.9%) |
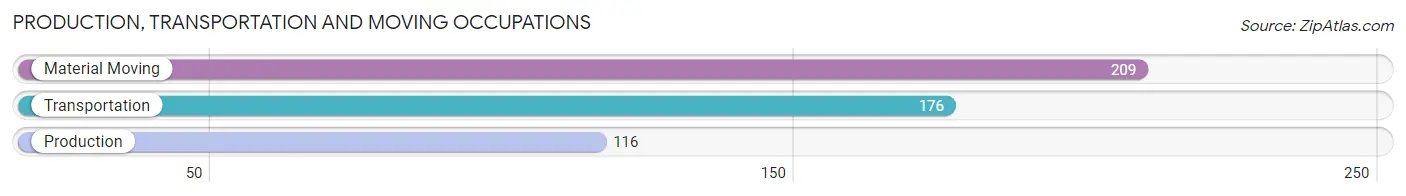
Production, Transportation and Moving Occupations
The most common Production, Transportation and Moving occupations in Alamosa are Material Moving (209 | 4.7%), Transportation (176 | 3.9%), and Production (116 | 2.6%).
Production, Transportation and Moving Occupations by Sex
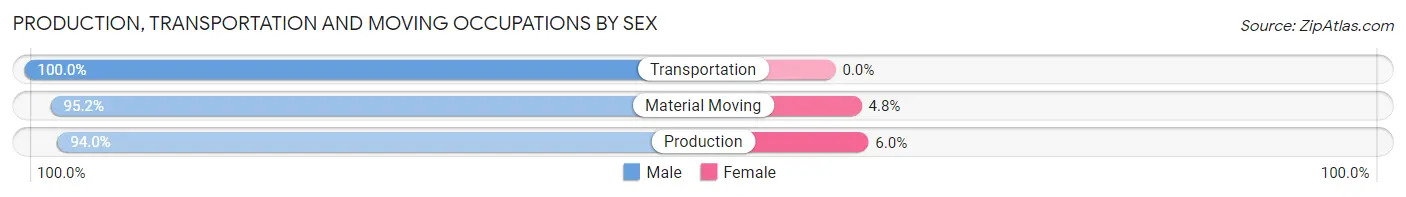
| Occupation | Male | Female |
| Production | 109 (94.0%) | 7 (6.0%) |
| Transportation | 176 (100.0%) | 0 (0.0%) |
| Material Moving | 199 (95.2%) | 10 (4.8%) |
| Total (Category) | 484 (96.6%) | 17 (3.4%) |
| Total (Overall) | 2,101 (47.1%) | 2,363 (52.9%) |
Employment Industries by Sex in Alamosa
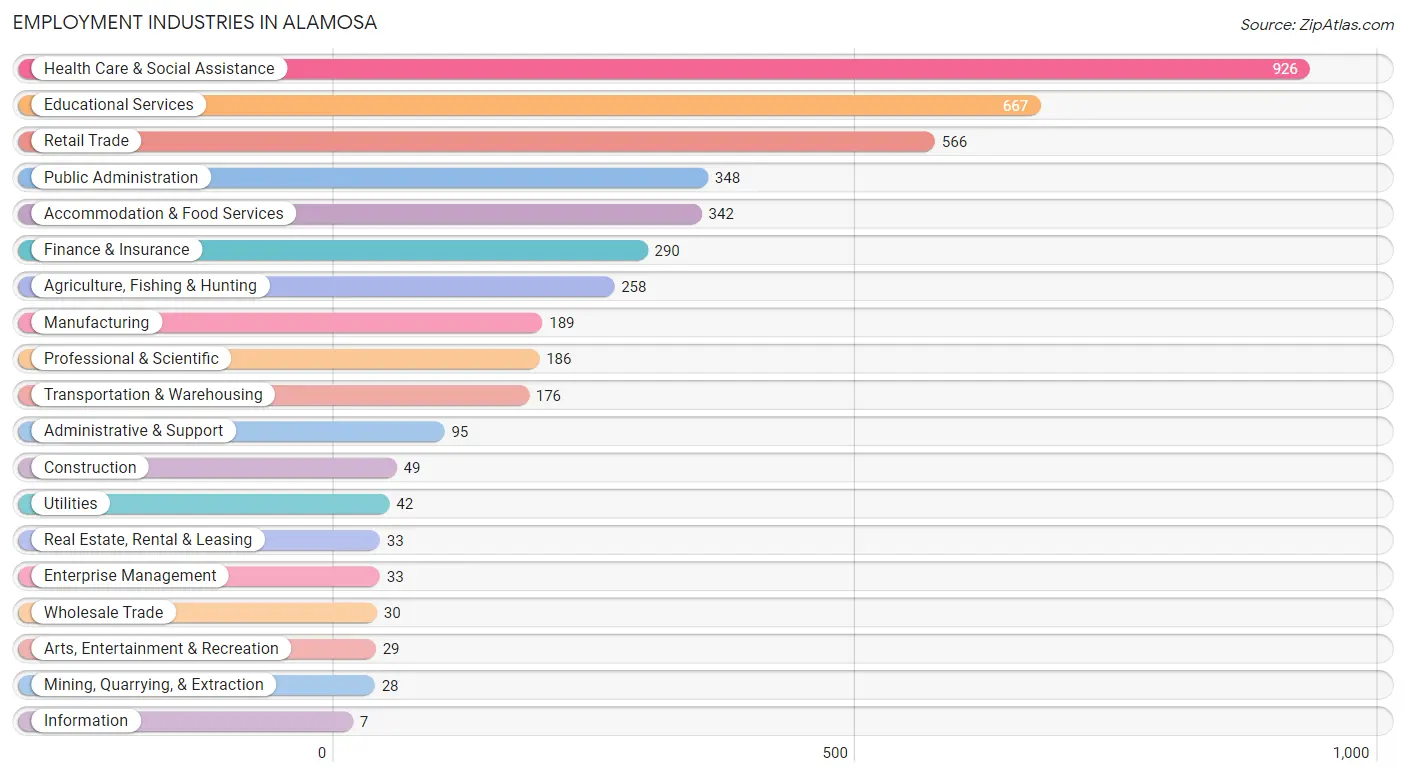
Employment Industries in Alamosa
The major employment industries in Alamosa include Health Care & Social Assistance (926 | 20.7%), Educational Services (667 | 14.9%), Retail Trade (566 | 12.7%), Public Administration (348 | 7.8%), and Accommodation & Food Services (342 | 7.7%).
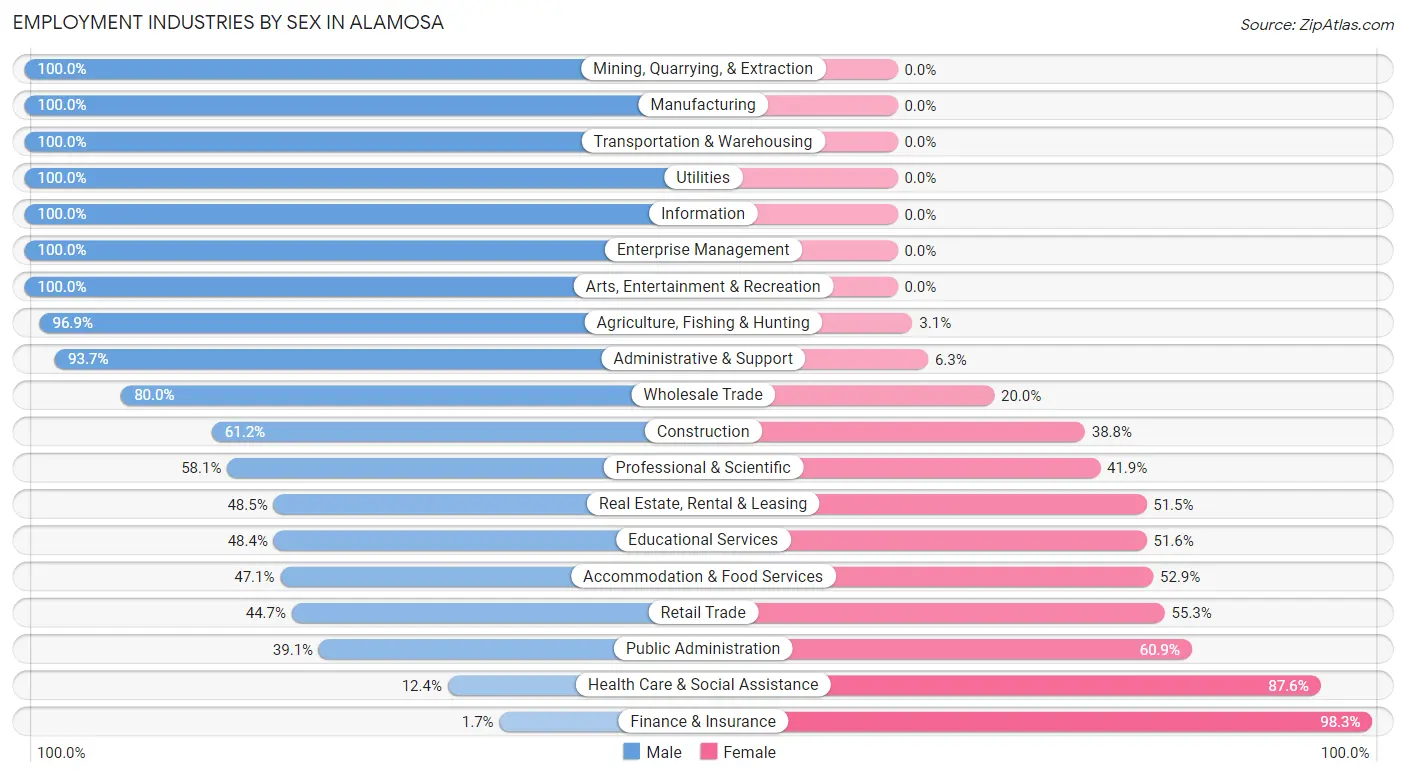
Employment Industries by Sex in Alamosa
The Alamosa industries that see more men than women are Mining, Quarrying, & Extraction (100.0%), Manufacturing (100.0%), and Transportation & Warehousing (100.0%), whereas the industries that tend to have a higher number of women are Finance & Insurance (98.3%), Health Care & Social Assistance (87.6%), and Public Administration (60.9%).
| Industry | Male | Female |
| Agriculture, Fishing & Hunting | 250 (96.9%) | 8 (3.1%) |
| Mining, Quarrying, & Extraction | 28 (100.0%) | 0 (0.0%) |
| Construction | 30 (61.2%) | 19 (38.8%) |
| Manufacturing | 189 (100.0%) | 0 (0.0%) |
| Wholesale Trade | 24 (80.0%) | 6 (20.0%) |
| Retail Trade | 253 (44.7%) | 313 (55.3%) |
| Transportation & Warehousing | 176 (100.0%) | 0 (0.0%) |
| Utilities | 42 (100.0%) | 0 (0.0%) |
| Information | 7 (100.0%) | 0 (0.0%) |
| Finance & Insurance | 5 (1.7%) | 285 (98.3%) |
| Real Estate, Rental & Leasing | 16 (48.5%) | 17 (51.5%) |
| Professional & Scientific | 108 (58.1%) | 78 (41.9%) |
| Enterprise Management | 33 (100.0%) | 0 (0.0%) |
| Administrative & Support | 89 (93.7%) | 6 (6.3%) |
| Educational Services | 323 (48.4%) | 344 (51.6%) |
| Health Care & Social Assistance | 115 (12.4%) | 811 (87.6%) |
| Arts, Entertainment & Recreation | 29 (100.0%) | 0 (0.0%) |
| Accommodation & Food Services | 161 (47.1%) | 181 (52.9%) |
| Public Administration | 136 (39.1%) | 212 (60.9%) |
| Total | 2,101 (47.1%) | 2,363 (52.9%) |
Education in Alamosa
School Enrollment in Alamosa
The most common levels of schooling among the 3,586 students in Alamosa are college / undergraduate (1,405 | 39.2%), middle school (696 | 19.4%), and elementary school (541 | 15.1%).
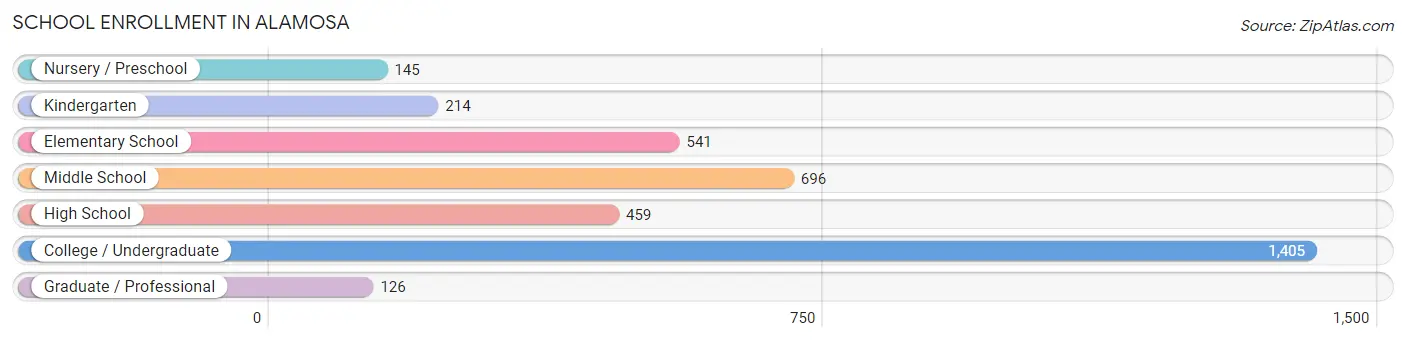
| School Level | # Students | % Students |
| Nursery / Preschool | 145 | 4.0% |
| Kindergarten | 214 | 6.0% |
| Elementary School | 541 | 15.1% |
| Middle School | 696 | 19.4% |
| High School | 459 | 12.8% |
| College / Undergraduate | 1,405 | 39.2% |
| Graduate / Professional | 126 | 3.5% |
| Total | 3,586 | 100.0% |
School Enrollment by Age by Funding Source in Alamosa
Out of a total of 3,586 students who are enrolled in schools in Alamosa, 143 (4.0%) attend a private institution, while the remaining 3,443 (96.0%) are enrolled in public schools. The age group of 35 years and over has the highest likelihood of being enrolled in private schools, with 10 (7.6% in the age bracket) enrolled. Conversely, the age group of 3 to 4 year olds has the lowest likelihood of being enrolled in a private school, with 77 (100.0% in the age bracket) attending a public institution.
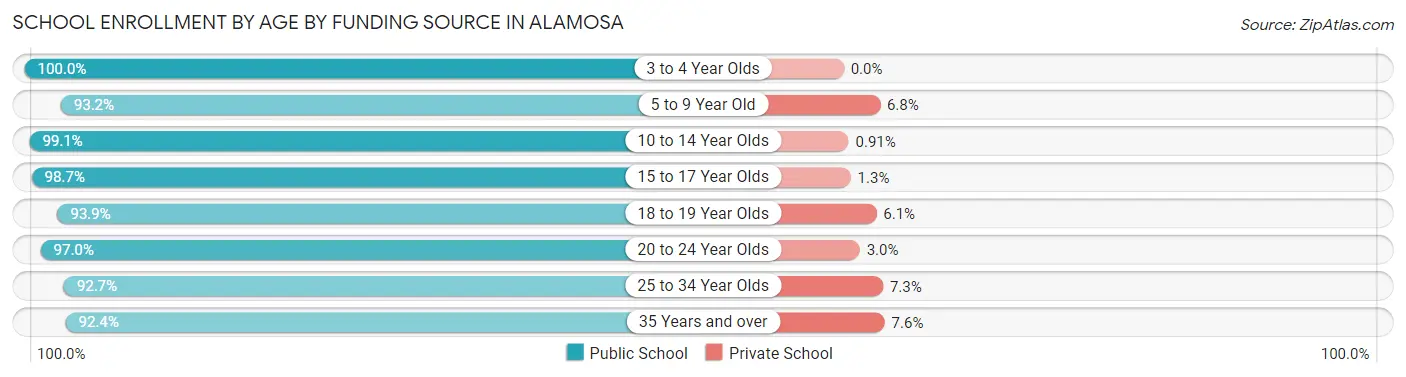
| Age Bracket | Public School | Private School |
| 3 to 4 Year Olds | 77 (100.0%) | 0 (0.0%) |
| 5 to 9 Year Old | 648 (93.2%) | 47 (6.8%) |
| 10 to 14 Year Olds | 868 (99.1%) | 8 (0.9%) |
| 15 to 17 Year Olds | 379 (98.7%) | 5 (1.3%) |
| 18 to 19 Year Olds | 679 (93.9%) | 44 (6.1%) |
| 20 to 24 Year Olds | 520 (97.0%) | 16 (3.0%) |
| 25 to 34 Year Olds | 152 (92.7%) | 12 (7.3%) |
| 35 Years and over | 121 (92.4%) | 10 (7.6%) |
| Total | 3,443 (96.0%) | 143 (4.0%) |
Educational Attainment by Field of Study in Alamosa
Business (289 | 17.4%), liberal arts & history (244 | 14.7%), education (242 | 14.6%), psychology (195 | 11.7%), and science & technology (178 | 10.7%) are the most common fields of study among 1,662 individuals in Alamosa who have obtained a bachelor's degree or higher.
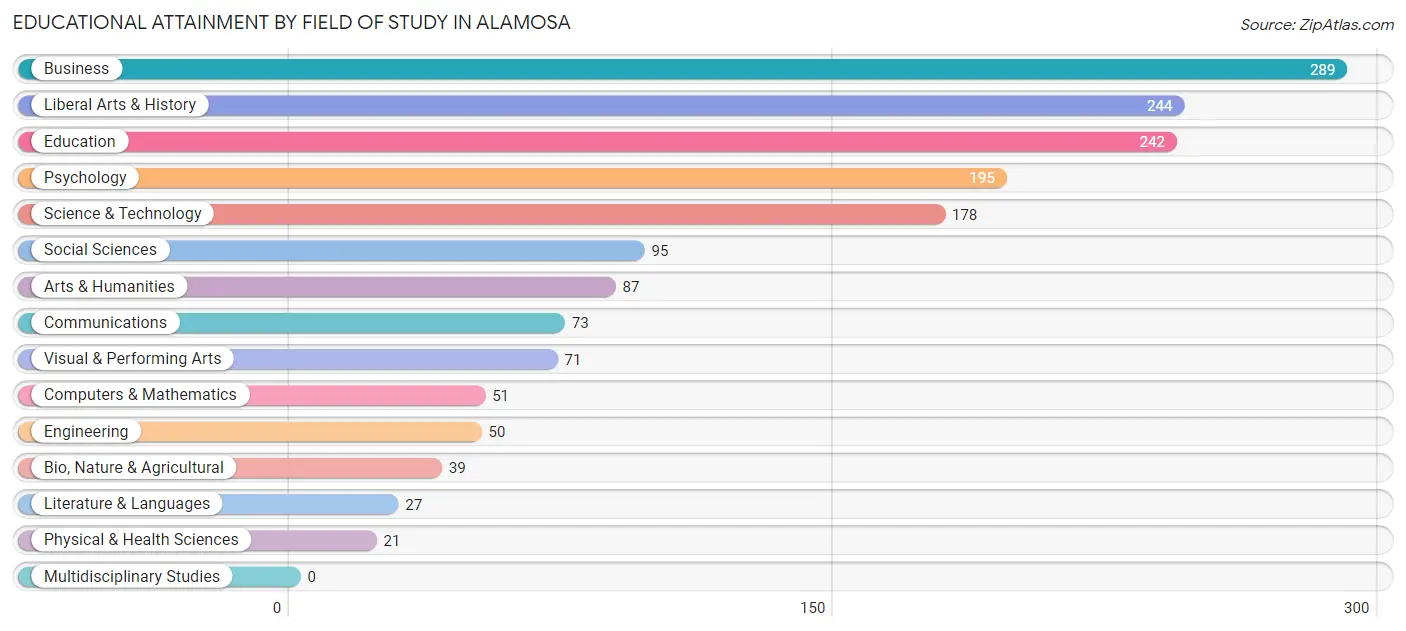
| Field of Study | # Graduates | % Graduates |
| Computers & Mathematics | 51 | 3.1% |
| Bio, Nature & Agricultural | 39 | 2.4% |
| Physical & Health Sciences | 21 | 1.3% |
| Psychology | 195 | 11.7% |
| Social Sciences | 95 | 5.7% |
| Engineering | 50 | 3.0% |
| Multidisciplinary Studies | 0 | 0.0% |
| Science & Technology | 178 | 10.7% |
| Business | 289 | 17.4% |
| Education | 242 | 14.6% |
| Literature & Languages | 27 | 1.6% |
| Liberal Arts & History | 244 | 14.7% |
| Visual & Performing Arts | 71 | 4.3% |
| Communications | 73 | 4.4% |
| Arts & Humanities | 87 | 5.2% |
| Total | 1,662 | 100.0% |
Transportation & Commute in Alamosa
Vehicle Availability by Sex in Alamosa
The most prevalent vehicle ownership categories in Alamosa are males with 2 vehicles (793, accounting for 40.2%) and females with 2 vehicles (943, making up 37.0%).
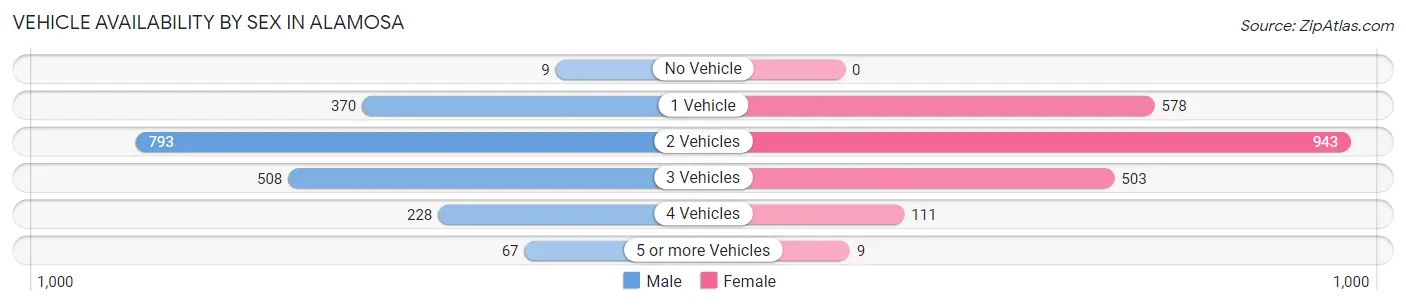
| Vehicles Available | Male | Female |
| No Vehicle | 9 (0.5%) | 0 (0.0%) |
| 1 Vehicle | 370 (18.7%) | 578 (27.0%) |
| 2 Vehicles | 793 (40.2%) | 943 (44.0%) |
| 3 Vehicles | 508 (25.7%) | 503 (23.5%) |
| 4 Vehicles | 228 (11.5%) | 111 (5.2%) |
| 5 or more Vehicles | 67 (3.4%) | 9 (0.4%) |
| Total | 1,975 (100.0%) | 2,144 (100.0%) |
Commute Time in Alamosa
The most frequently occuring commute durations in Alamosa are 5 to 9 minutes (1,992 commuters, 48.4%), 10 to 14 minutes (739 commuters, 18.0%), and 15 to 19 minutes (350 commuters, 8.5%).
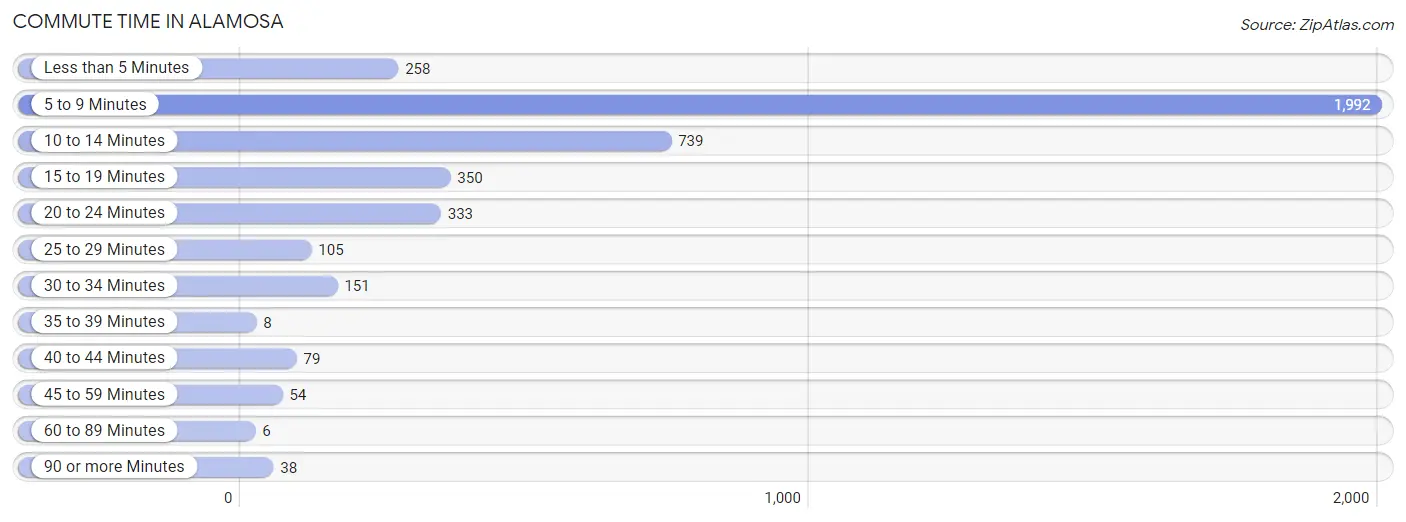
| Commute Time | # Commuters | % Commuters |
| Less than 5 Minutes | 258 | 6.3% |
| 5 to 9 Minutes | 1,992 | 48.4% |
| 10 to 14 Minutes | 739 | 18.0% |
| 15 to 19 Minutes | 350 | 8.5% |
| 20 to 24 Minutes | 333 | 8.1% |
| 25 to 29 Minutes | 105 | 2.5% |
| 30 to 34 Minutes | 151 | 3.7% |
| 35 to 39 Minutes | 8 | 0.2% |
| 40 to 44 Minutes | 79 | 1.9% |
| 45 to 59 Minutes | 54 | 1.3% |
| 60 to 89 Minutes | 6 | 0.2% |
| 90 or more Minutes | 38 | 0.9% |
Commute Time by Sex in Alamosa
The most common commute times in Alamosa are 5 to 9 minutes (689 commuters, 34.7%) for males and 5 to 9 minutes (1,303 commuters, 61.2%) for females.
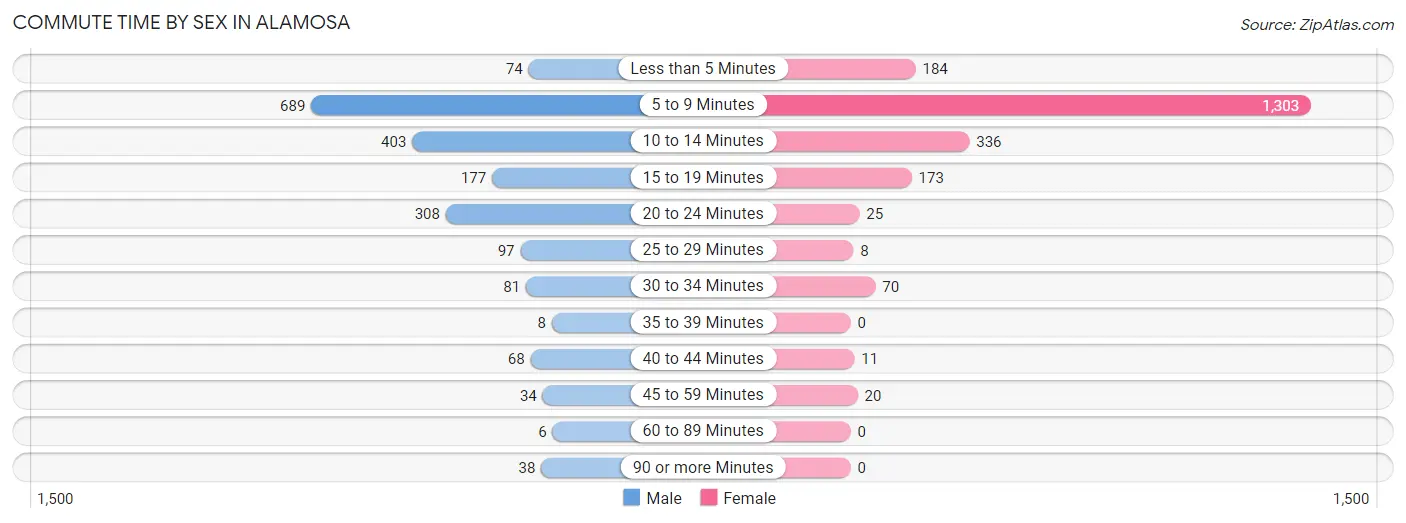
| Commute Time | Male | Female |
| Less than 5 Minutes | 74 (3.7%) | 184 (8.6%) |
| 5 to 9 Minutes | 689 (34.7%) | 1,303 (61.2%) |
| 10 to 14 Minutes | 403 (20.3%) | 336 (15.8%) |
| 15 to 19 Minutes | 177 (8.9%) | 173 (8.1%) |
| 20 to 24 Minutes | 308 (15.5%) | 25 (1.2%) |
| 25 to 29 Minutes | 97 (4.9%) | 8 (0.4%) |
| 30 to 34 Minutes | 81 (4.1%) | 70 (3.3%) |
| 35 to 39 Minutes | 8 (0.4%) | 0 (0.0%) |
| 40 to 44 Minutes | 68 (3.4%) | 11 (0.5%) |
| 45 to 59 Minutes | 34 (1.7%) | 20 (0.9%) |
| 60 to 89 Minutes | 6 (0.3%) | 0 (0.0%) |
| 90 or more Minutes | 38 (1.9%) | 0 (0.0%) |
Time of Departure to Work by Sex in Alamosa
The most frequent times of departure to work in Alamosa are 6:30 AM to 6:59 AM (364, 18.4%) for males and 7:30 AM to 7:59 AM (829, 38.9%) for females.
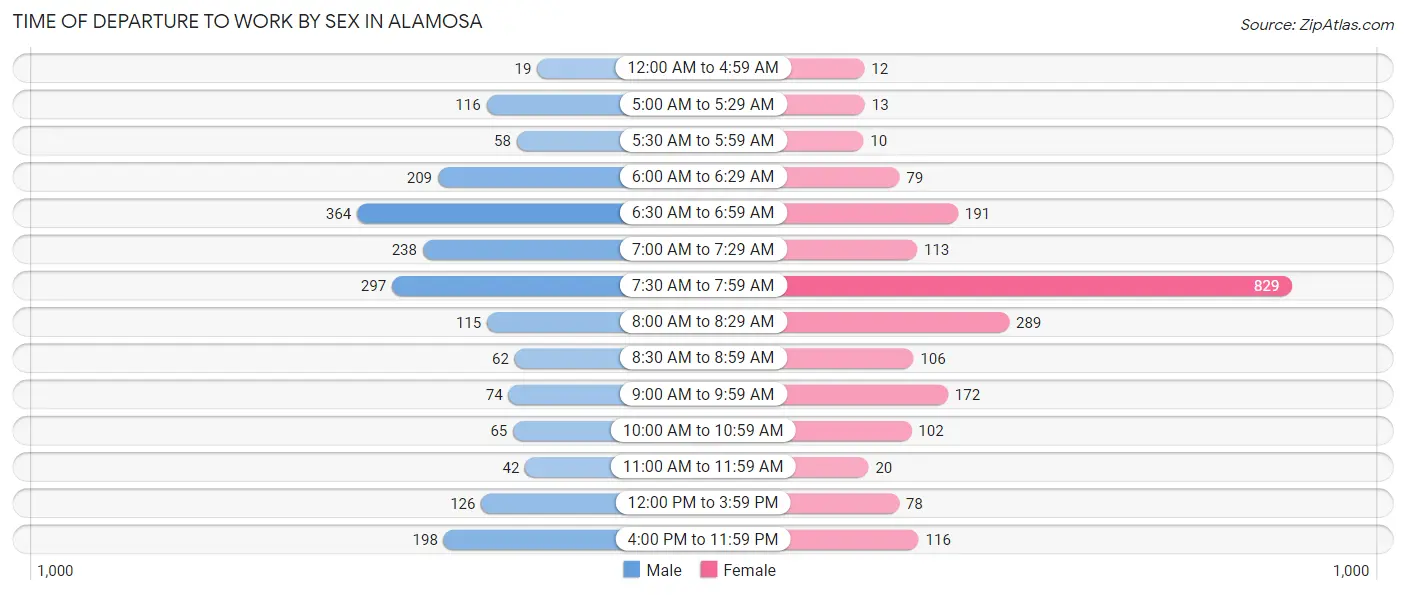
| Time of Departure | Male | Female |
| 12:00 AM to 4:59 AM | 19 (1.0%) | 12 (0.6%) |
| 5:00 AM to 5:29 AM | 116 (5.9%) | 13 (0.6%) |
| 5:30 AM to 5:59 AM | 58 (2.9%) | 10 (0.5%) |
| 6:00 AM to 6:29 AM | 209 (10.5%) | 79 (3.7%) |
| 6:30 AM to 6:59 AM | 364 (18.4%) | 191 (9.0%) |
| 7:00 AM to 7:29 AM | 238 (12.0%) | 113 (5.3%) |
| 7:30 AM to 7:59 AM | 297 (15.0%) | 829 (38.9%) |
| 8:00 AM to 8:29 AM | 115 (5.8%) | 289 (13.6%) |
| 8:30 AM to 8:59 AM | 62 (3.1%) | 106 (5.0%) |
| 9:00 AM to 9:59 AM | 74 (3.7%) | 172 (8.1%) |
| 10:00 AM to 10:59 AM | 65 (3.3%) | 102 (4.8%) |
| 11:00 AM to 11:59 AM | 42 (2.1%) | 20 (0.9%) |
| 12:00 PM to 3:59 PM | 126 (6.4%) | 78 (3.7%) |
| 4:00 PM to 11:59 PM | 198 (10.0%) | 116 (5.4%) |
| Total | 1,983 (100.0%) | 2,130 (100.0%) |
Housing Occupancy in Alamosa
Occupancy by Ownership in Alamosa
Of the total 3,890 dwellings in Alamosa, owner-occupied units account for 1,683 (43.3%), while renter-occupied units make up 2,207 (56.7%).
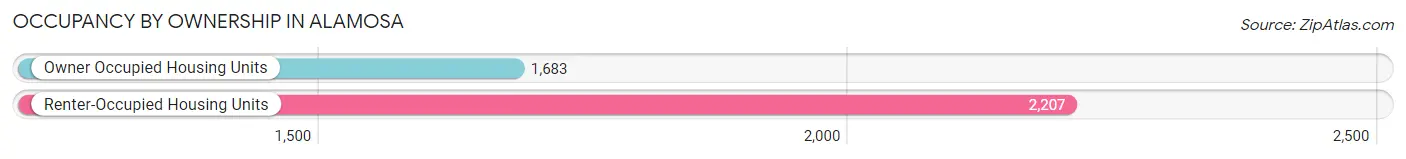
| Occupancy | # Housing Units | % Housing Units |
| Owner Occupied Housing Units | 1,683 | 43.3% |
| Renter-Occupied Housing Units | 2,207 | 56.7% |
| Total Occupied Housing Units | 3,890 | 100.0% |
Occupancy by Household Size in Alamosa
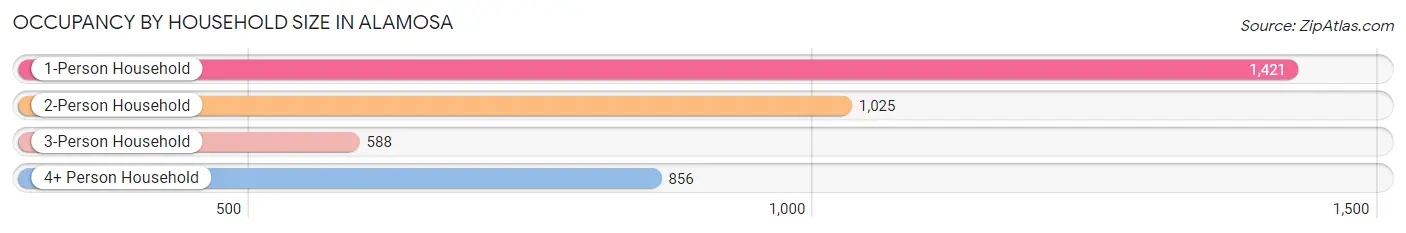
| Household Size | # Housing Units | % Housing Units |
| 1-Person Household | 1,421 | 36.5% |
| 2-Person Household | 1,025 | 26.4% |
| 3-Person Household | 588 | 15.1% |
| 4+ Person Household | 856 | 22.0% |
| Total Housing Units | 3,890 | 100.0% |
Occupancy by Ownership by Household Size in Alamosa
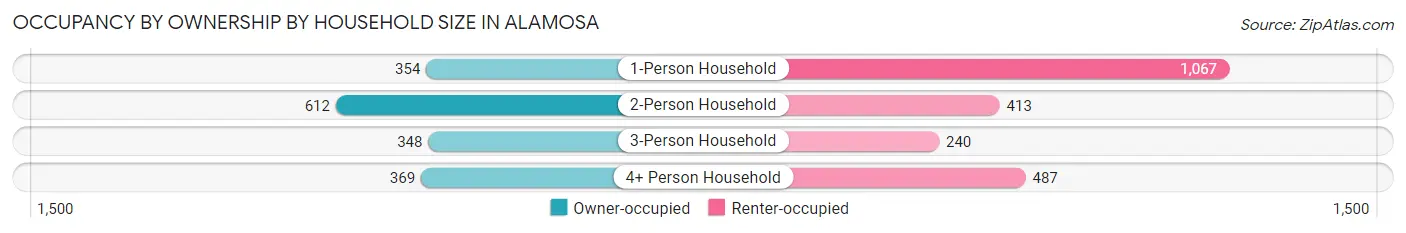
| Household Size | Owner-occupied | Renter-occupied |
| 1-Person Household | 354 (24.9%) | 1,067 (75.1%) |
| 2-Person Household | 612 (59.7%) | 413 (40.3%) |
| 3-Person Household | 348 (59.2%) | 240 (40.8%) |
| 4+ Person Household | 369 (43.1%) | 487 (56.9%) |
| Total Housing Units | 1,683 (43.3%) | 2,207 (56.7%) |
Occupancy by Educational Attainment in Alamosa
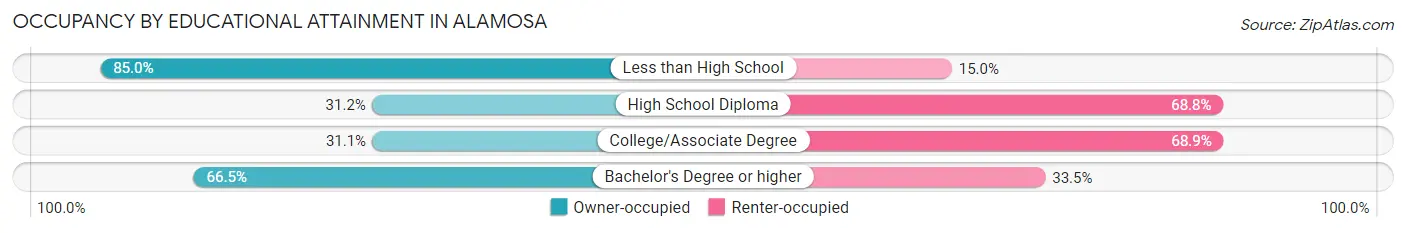
| Household Size | Owner-occupied | Renter-occupied |
| Less than High School | 170 (85.0%) | 30 (15.0%) |
| High School Diploma | 311 (31.2%) | 686 (68.8%) |
| College/Associate Degree | 518 (31.1%) | 1,146 (68.9%) |
| Bachelor's Degree or higher | 684 (66.5%) | 345 (33.5%) |
Occupancy by Age of Householder in Alamosa
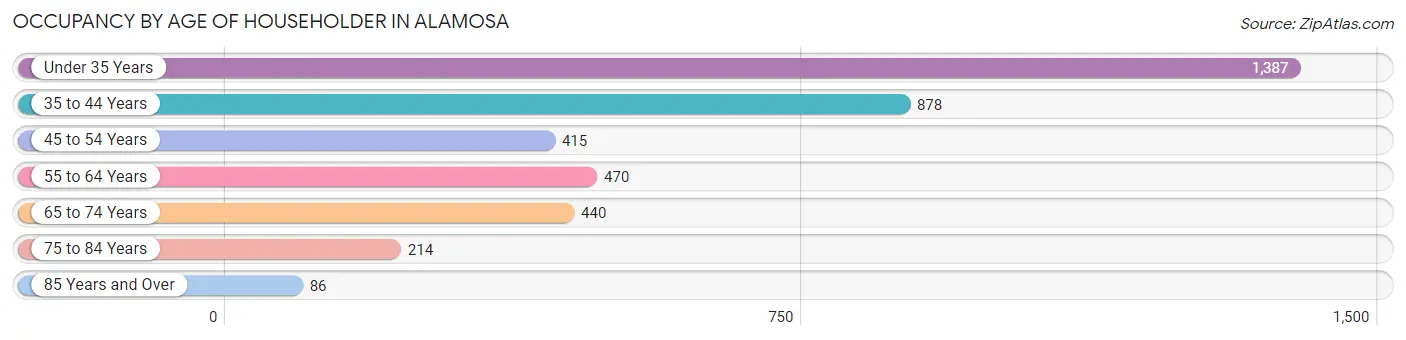
| Age Bracket | # Households | % Households |
| Under 35 Years | 1,387 | 35.7% |
| 35 to 44 Years | 878 | 22.6% |
| 45 to 54 Years | 415 | 10.7% |
| 55 to 64 Years | 470 | 12.1% |
| 65 to 74 Years | 440 | 11.3% |
| 75 to 84 Years | 214 | 5.5% |
| 85 Years and Over | 86 | 2.2% |
| Total | 3,890 | 100.0% |
Housing Finances in Alamosa
Median Income by Occupancy in Alamosa
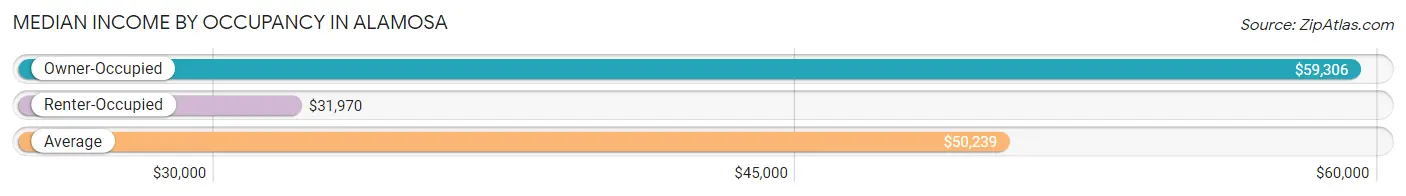
| Occupancy Type | # Households | Median Income |
| Owner-Occupied | 1,683 (43.3%) | $59,306 |
| Renter-Occupied | 2,207 (56.7%) | $31,970 |
| Average | 3,890 (100.0%) | $50,239 |
Occupancy by Householder Income Bracket in Alamosa
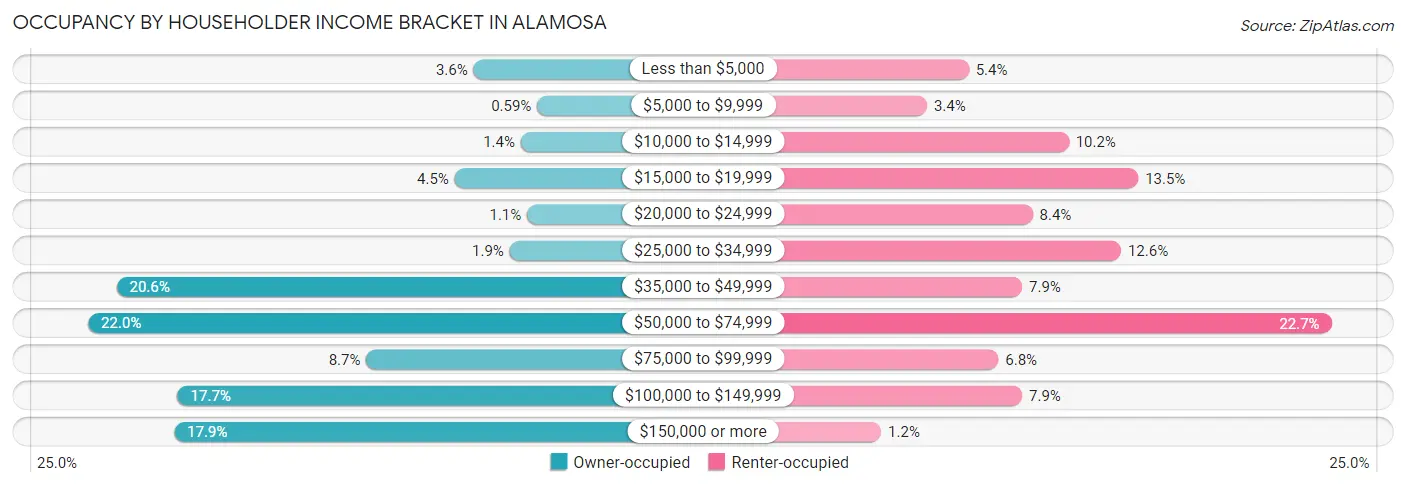
| Income Bracket | Owner-occupied | Renter-occupied |
| Less than $5,000 | 61 (3.6%) | 119 (5.4%) |
| $5,000 to $9,999 | 10 (0.6%) | 75 (3.4%) |
| $10,000 to $14,999 | 23 (1.4%) | 224 (10.2%) |
| $15,000 to $19,999 | 76 (4.5%) | 297 (13.5%) |
| $20,000 to $24,999 | 18 (1.1%) | 186 (8.4%) |
| $25,000 to $34,999 | 32 (1.9%) | 279 (12.6%) |
| $35,000 to $49,999 | 347 (20.6%) | 175 (7.9%) |
| $50,000 to $74,999 | 370 (22.0%) | 500 (22.7%) |
| $75,000 to $99,999 | 147 (8.7%) | 150 (6.8%) |
| $100,000 to $149,999 | 298 (17.7%) | 175 (7.9%) |
| $150,000 or more | 301 (17.9%) | 27 (1.2%) |
| Total | 1,683 (100.0%) | 2,207 (100.0%) |
Monthly Housing Cost Tiers in Alamosa
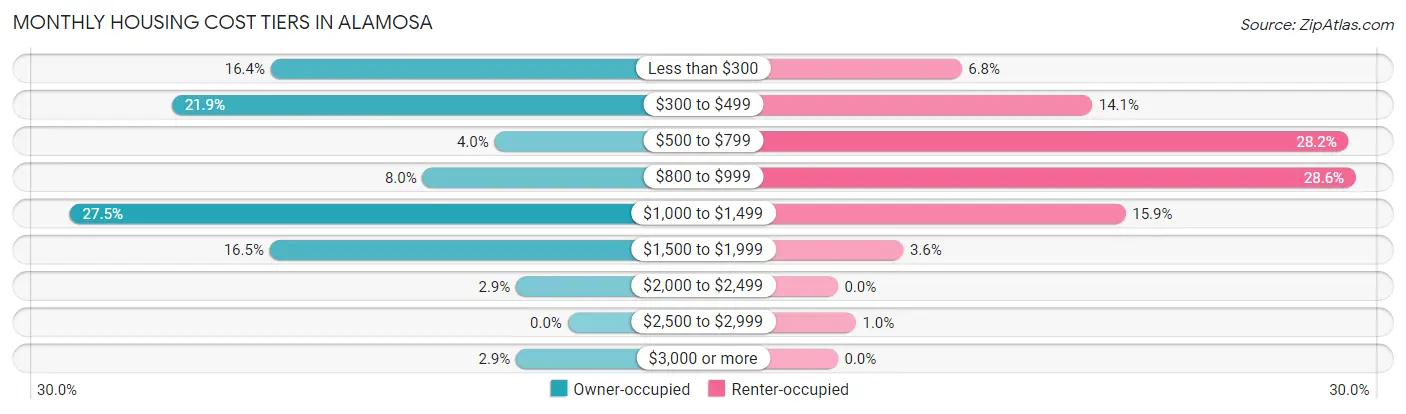
| Monthly Cost | Owner-occupied | Renter-occupied |
| Less than $300 | 276 (16.4%) | 151 (6.8%) |
| $300 to $499 | 368 (21.9%) | 310 (14.1%) |
| $500 to $799 | 68 (4.0%) | 623 (28.2%) |
| $800 to $999 | 135 (8.0%) | 632 (28.6%) |
| $1,000 to $1,499 | 463 (27.5%) | 351 (15.9%) |
| $1,500 to $1,999 | 277 (16.5%) | 80 (3.6%) |
| $2,000 to $2,499 | 48 (2.9%) | 0 (0.0%) |
| $2,500 to $2,999 | 0 (0.0%) | 22 (1.0%) |
| $3,000 or more | 48 (2.9%) | 0 (0.0%) |
| Total | 1,683 (100.0%) | 2,207 (100.0%) |
Physical Housing Characteristics in Alamosa
Housing Structures in Alamosa
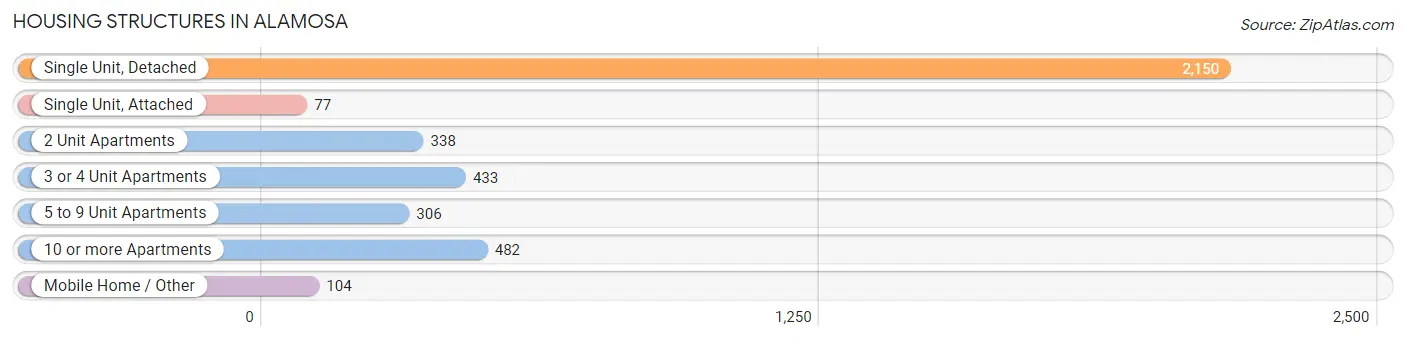
| Structure Type | # Housing Units | % Housing Units |
| Single Unit, Detached | 2,150 | 55.3% |
| Single Unit, Attached | 77 | 2.0% |
| 2 Unit Apartments | 338 | 8.7% |
| 3 or 4 Unit Apartments | 433 | 11.1% |
| 5 to 9 Unit Apartments | 306 | 7.9% |
| 10 or more Apartments | 482 | 12.4% |
| Mobile Home / Other | 104 | 2.7% |
| Total | 3,890 | 100.0% |
Housing Structures by Occupancy in Alamosa
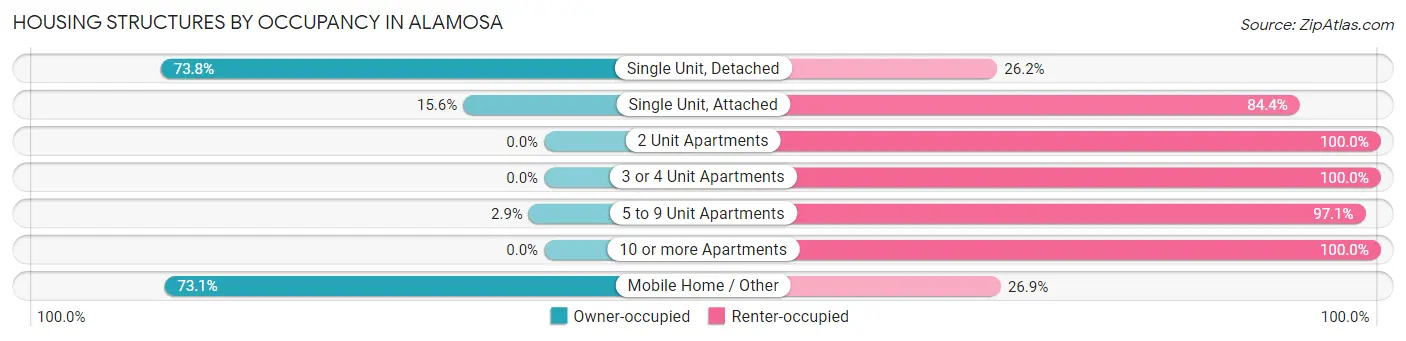
| Structure Type | Owner-occupied | Renter-occupied |
| Single Unit, Detached | 1,586 (73.8%) | 564 (26.2%) |
| Single Unit, Attached | 12 (15.6%) | 65 (84.4%) |
| 2 Unit Apartments | 0 (0.0%) | 338 (100.0%) |
| 3 or 4 Unit Apartments | 0 (0.0%) | 433 (100.0%) |
| 5 to 9 Unit Apartments | 9 (2.9%) | 297 (97.1%) |
| 10 or more Apartments | 0 (0.0%) | 482 (100.0%) |
| Mobile Home / Other | 76 (73.1%) | 28 (26.9%) |
| Total | 1,683 (43.3%) | 2,207 (56.7%) |
Housing Structures by Number of Rooms in Alamosa
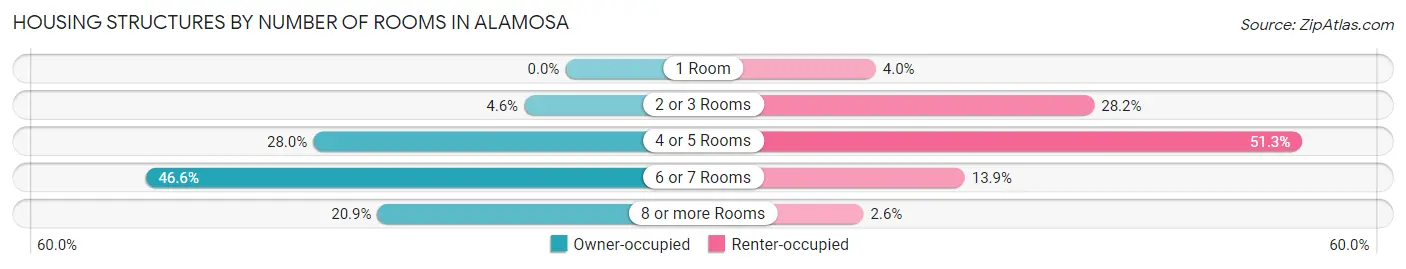
| Number of Rooms | Owner-occupied | Renter-occupied |
| 1 Room | 0 (0.0%) | 88 (4.0%) |
| 2 or 3 Rooms | 77 (4.6%) | 623 (28.2%) |
| 4 or 5 Rooms | 471 (28.0%) | 1,132 (51.3%) |
| 6 or 7 Rooms | 784 (46.6%) | 306 (13.9%) |
| 8 or more Rooms | 351 (20.9%) | 58 (2.6%) |
| Total | 1,683 (100.0%) | 2,207 (100.0%) |
Housing Structure by Heating Type in Alamosa
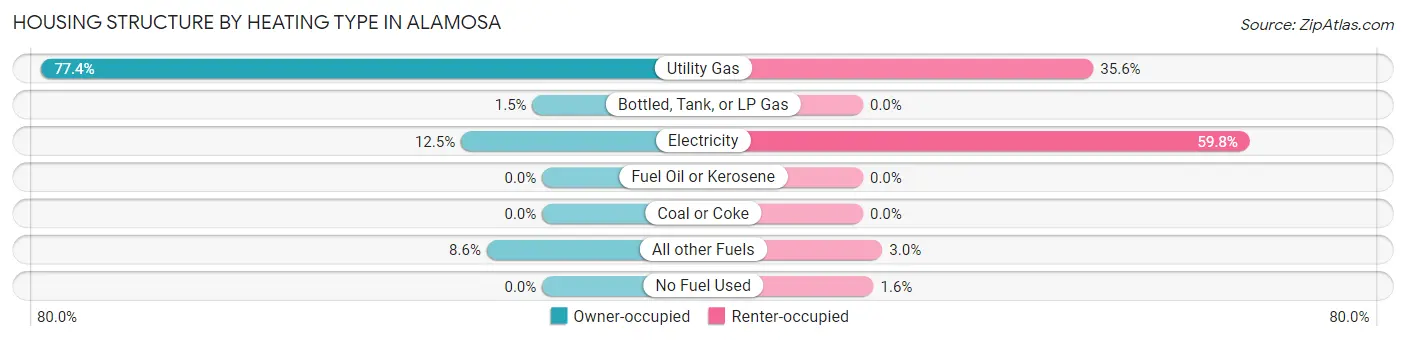
| Heating Type | Owner-occupied | Renter-occupied |
| Utility Gas | 1,303 (77.4%) | 786 (35.6%) |
| Bottled, Tank, or LP Gas | 25 (1.5%) | 0 (0.0%) |
| Electricity | 211 (12.5%) | 1,319 (59.8%) |
| Fuel Oil or Kerosene | 0 (0.0%) | 0 (0.0%) |
| Coal or Coke | 0 (0.0%) | 0 (0.0%) |
| All other Fuels | 144 (8.6%) | 66 (3.0%) |
| No Fuel Used | 0 (0.0%) | 36 (1.6%) |
| Total | 1,683 (100.0%) | 2,207 (100.0%) |
Household Vehicle Usage in Alamosa
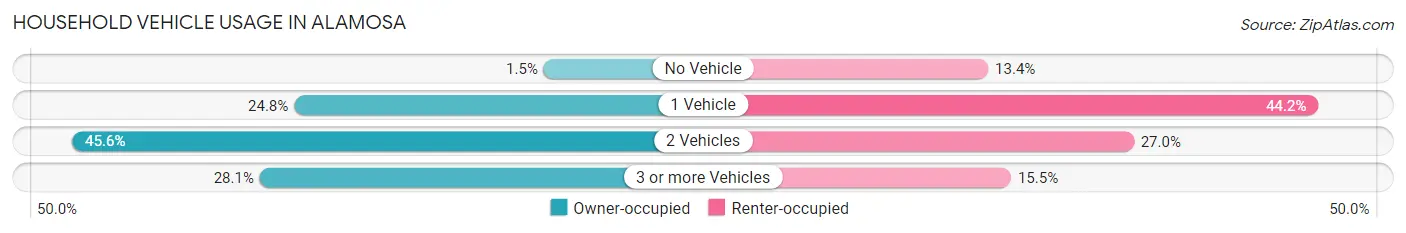
| Vehicles per Household | Owner-occupied | Renter-occupied |
| No Vehicle | 26 (1.5%) | 295 (13.4%) |
| 1 Vehicle | 418 (24.8%) | 975 (44.2%) |
| 2 Vehicles | 767 (45.6%) | 595 (27.0%) |
| 3 or more Vehicles | 472 (28.1%) | 342 (15.5%) |
| Total | 1,683 (100.0%) | 2,207 (100.0%) |
Real Estate & Mortgages in Alamosa
Real Estate and Mortgage Overview in Alamosa
| Characteristic | Without Mortgage | With Mortgage |
| Housing Units | 668 | 1,015 |
| Median Property Value | $145,300 | $194,700 |
| Median Household Income | $52,371 | $276 |
| Monthly Housing Costs | $321 | $48 |
| Real Estate Taxes | $850 | $8 |
Property Value by Mortgage Status in Alamosa
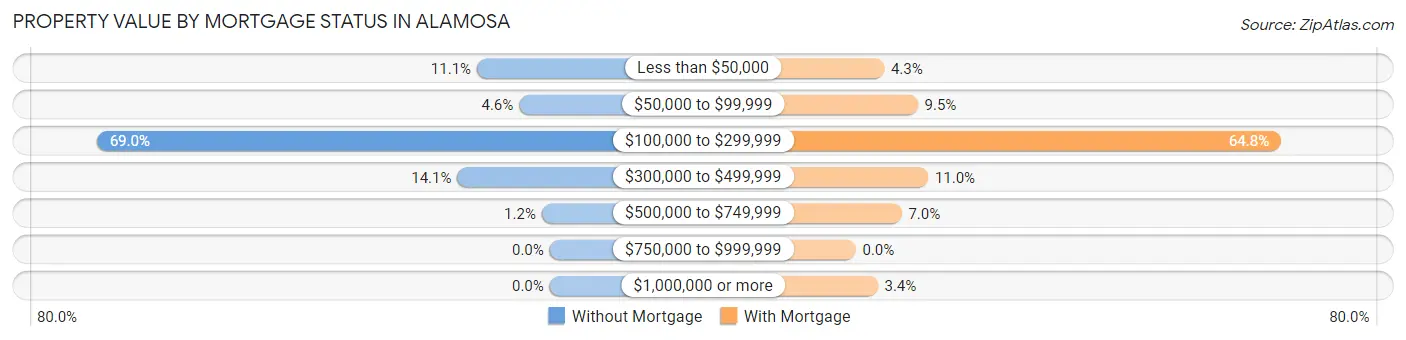
| Property Value | Without Mortgage | With Mortgage |
| Less than $50,000 | 74 (11.1%) | 44 (4.3%) |
| $50,000 to $99,999 | 31 (4.6%) | 96 (9.5%) |
| $100,000 to $299,999 | 461 (69.0%) | 658 (64.8%) |
| $300,000 to $499,999 | 94 (14.1%) | 112 (11.0%) |
| $500,000 to $749,999 | 8 (1.2%) | 71 (7.0%) |
| $750,000 to $999,999 | 0 (0.0%) | 0 (0.0%) |
| $1,000,000 or more | 0 (0.0%) | 34 (3.4%) |
| Total | 668 (100.0%) | 1,015 (100.0%) |
Household Income by Mortgage Status in Alamosa
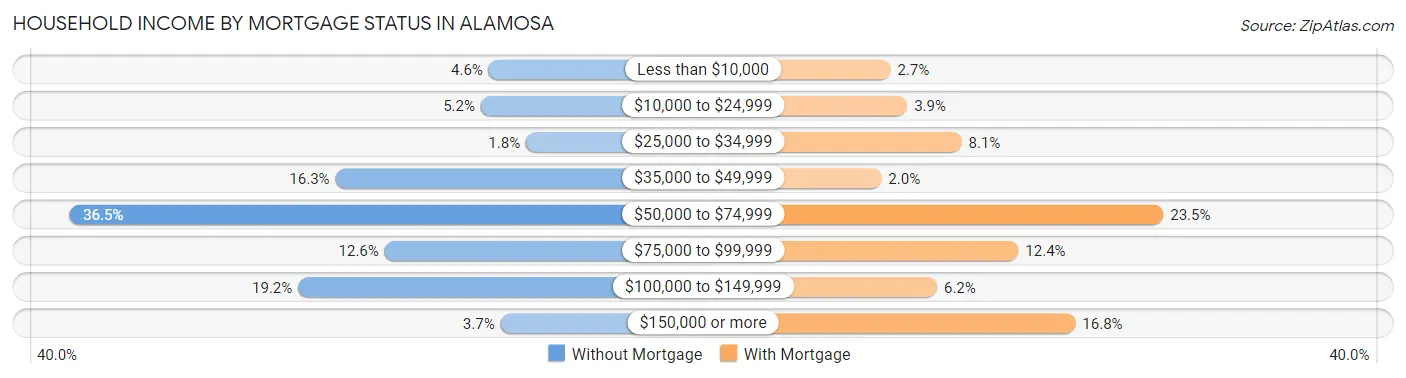
| Household Income | Without Mortgage | With Mortgage |
| Less than $10,000 | 31 (4.6%) | 27 (2.7%) |
| $10,000 to $24,999 | 35 (5.2%) | 40 (3.9%) |
| $25,000 to $34,999 | 12 (1.8%) | 82 (8.1%) |
| $35,000 to $49,999 | 109 (16.3%) | 20 (2.0%) |
| $50,000 to $74,999 | 244 (36.5%) | 238 (23.4%) |
| $75,000 to $99,999 | 84 (12.6%) | 126 (12.4%) |
| $100,000 to $149,999 | 128 (19.2%) | 63 (6.2%) |
| $150,000 or more | 25 (3.7%) | 170 (16.8%) |
| Total | 668 (100.0%) | 1,015 (100.0%) |
Property Value to Household Income Ratio in Alamosa
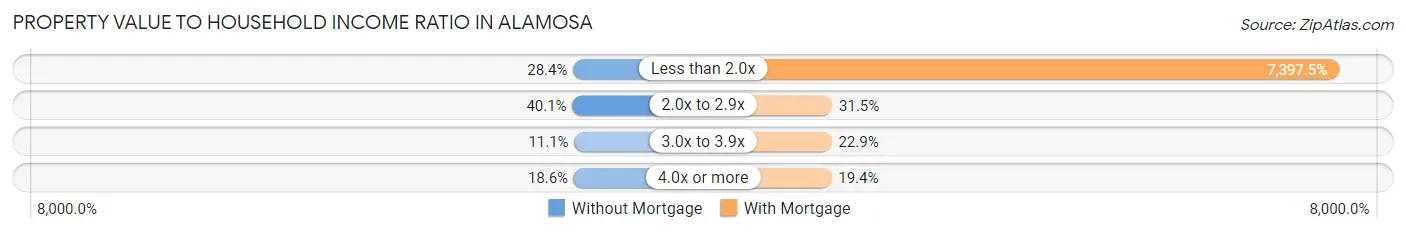
| Value-to-Income Ratio | Without Mortgage | With Mortgage |
| Less than 2.0x | 190 (28.4%) | 75,085 (7,397.5%) |
| 2.0x to 2.9x | 268 (40.1%) | 320 (31.5%) |
| 3.0x to 3.9x | 74 (11.1%) | 232 (22.9%) |
| 4.0x or more | 124 (18.6%) | 197 (19.4%) |
| Total | 668 (100.0%) | 1,015 (100.0%) |
Real Estate Taxes by Mortgage Status in Alamosa
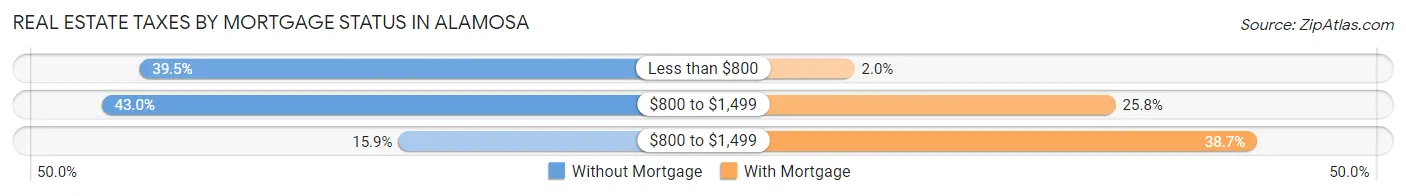
| Property Taxes | Without Mortgage | With Mortgage |
| Less than $800 | 264 (39.5%) | 20 (2.0%) |
| $800 to $1,499 | 287 (43.0%) | 262 (25.8%) |
| $800 to $1,499 | 106 (15.9%) | 393 (38.7%) |
| Total | 668 (100.0%) | 1,015 (100.0%) |
Health & Disability in Alamosa
Health Insurance Coverage by Age in Alamosa
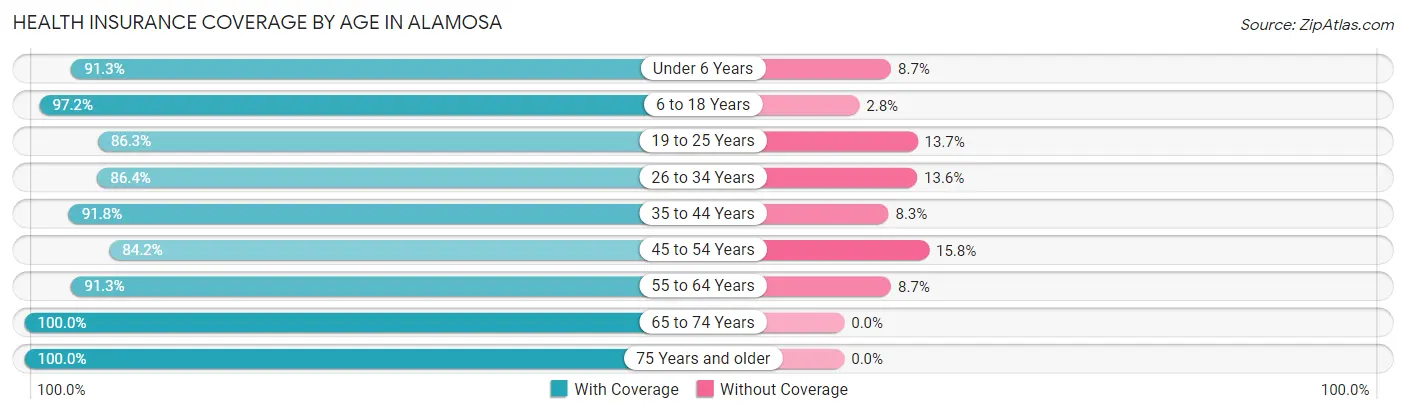
| Age Bracket | With Coverage | Without Coverage |
| Under 6 Years | 691 (91.3%) | 66 (8.7%) |
| 6 to 18 Years | 2,112 (97.2%) | 61 (2.8%) |
| 19 to 25 Years | 1,320 (86.3%) | 209 (13.7%) |
| 26 to 34 Years | 1,133 (86.4%) | 178 (13.6%) |
| 35 to 44 Years | 1,213 (91.7%) | 109 (8.3%) |
| 45 to 54 Years | 538 (84.2%) | 101 (15.8%) |
| 55 to 64 Years | 785 (91.3%) | 75 (8.7%) |
| 65 to 74 Years | 651 (100.0%) | 0 (0.0%) |
| 75 Years and older | 341 (100.0%) | 0 (0.0%) |
| Total | 8,784 (91.7%) | 799 (8.3%) |
Health Insurance Coverage by Citizenship Status in Alamosa
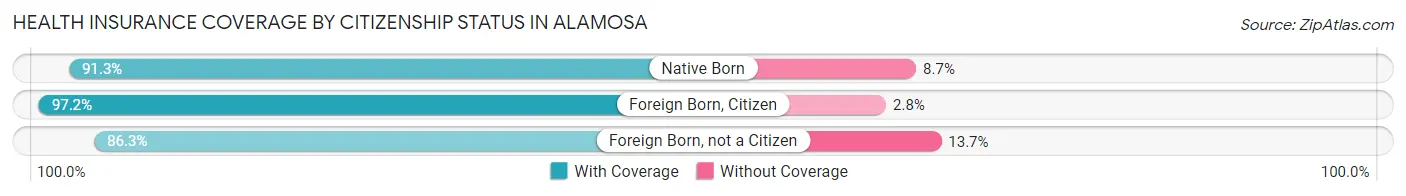
| Citizenship Status | With Coverage | Without Coverage |
| Native Born | 691 (91.3%) | 66 (8.7%) |
| Foreign Born, Citizen | 2,112 (97.2%) | 61 (2.8%) |
| Foreign Born, not a Citizen | 1,320 (86.3%) | 209 (13.7%) |
Health Insurance Coverage by Household Income in Alamosa
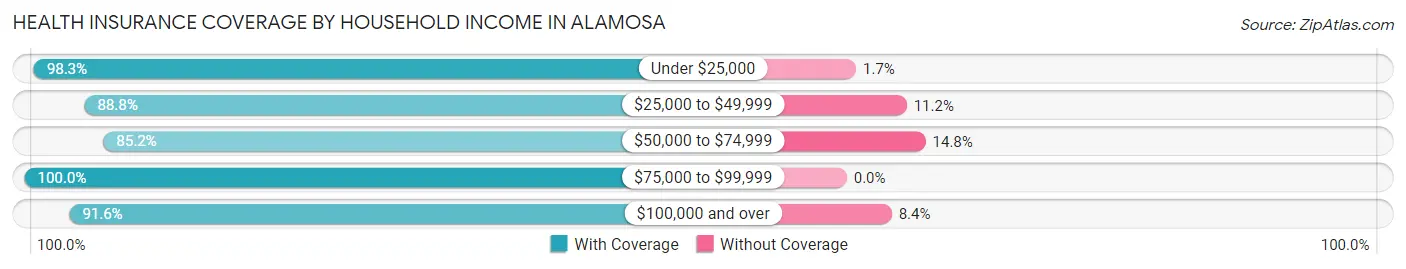
| Household Income | With Coverage | Without Coverage |
| Under $25,000 | 1,528 (98.3%) | 27 (1.7%) |
| $25,000 to $49,999 | 1,691 (88.8%) | 214 (11.2%) |
| $50,000 to $74,999 | 1,829 (85.2%) | 317 (14.8%) |
| $75,000 to $99,999 | 639 (100.0%) | 0 (0.0%) |
| $100,000 and over | 2,482 (91.6%) | 228 (8.4%) |
Public vs Private Health Insurance Coverage by Age in Alamosa
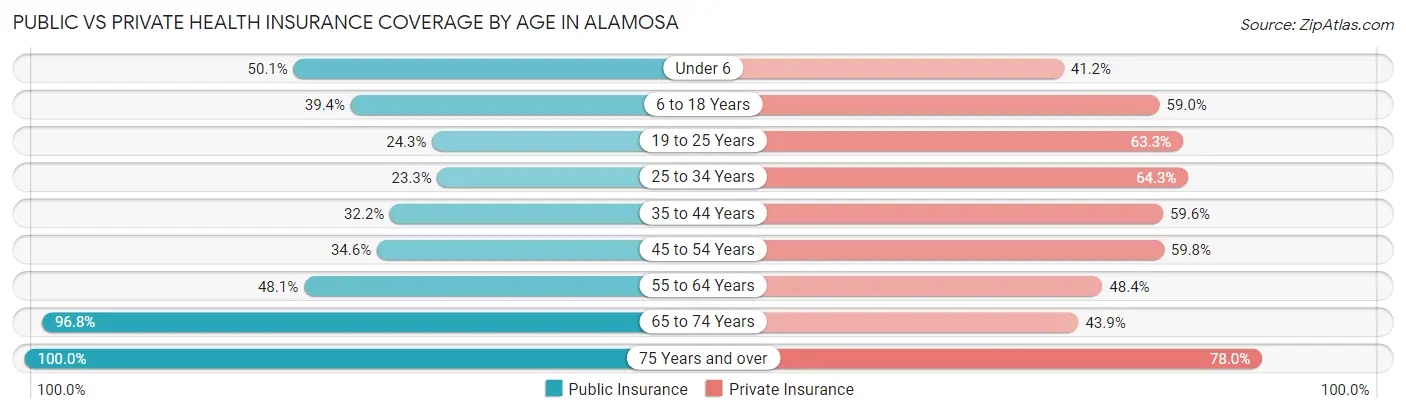
| Age Bracket | Public Insurance | Private Insurance |
| Under 6 | 379 (50.1%) | 312 (41.2%) |
| 6 to 18 Years | 857 (39.4%) | 1,282 (59.0%) |
| 19 to 25 Years | 372 (24.3%) | 968 (63.3%) |
| 25 to 34 Years | 306 (23.3%) | 843 (64.3%) |
| 35 to 44 Years | 425 (32.2%) | 788 (59.6%) |
| 45 to 54 Years | 221 (34.6%) | 382 (59.8%) |
| 55 to 64 Years | 414 (48.1%) | 416 (48.4%) |
| 65 to 74 Years | 630 (96.8%) | 286 (43.9%) |
| 75 Years and over | 341 (100.0%) | 266 (78.0%) |
| Total | 3,945 (41.2%) | 5,543 (57.8%) |
Disability Status by Sex by Age in Alamosa
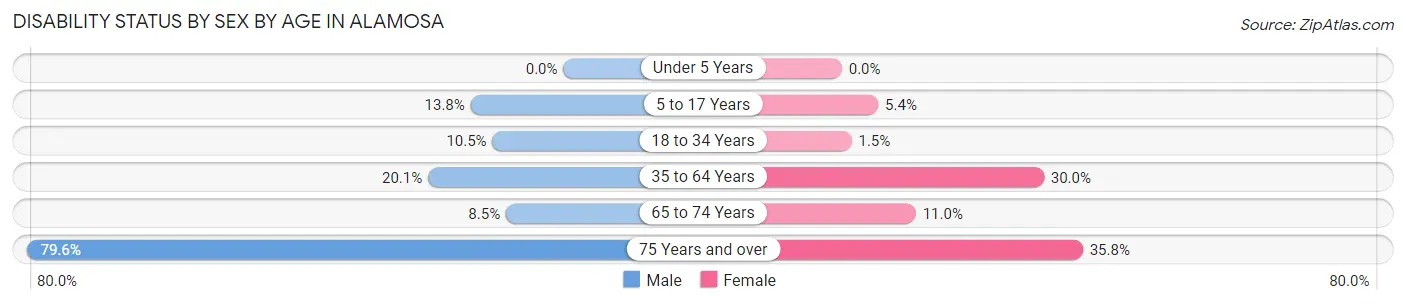
| Age Bracket | Male | Female |
| Under 5 Years | 0 (0.0%) | 0 (0.0%) |
| 5 to 17 Years | 154 (13.8%) | 50 (5.4%) |
| 18 to 34 Years | 154 (10.5%) | 25 (1.5%) |
| 35 to 64 Years | 276 (20.1%) | 434 (30.0%) |
| 65 to 74 Years | 26 (8.5%) | 38 (11.0%) |
| 75 Years and over | 109 (79.6%) | 73 (35.8%) |
Disability Class by Sex by Age in Alamosa
Disability Class: Hearing Difficulty
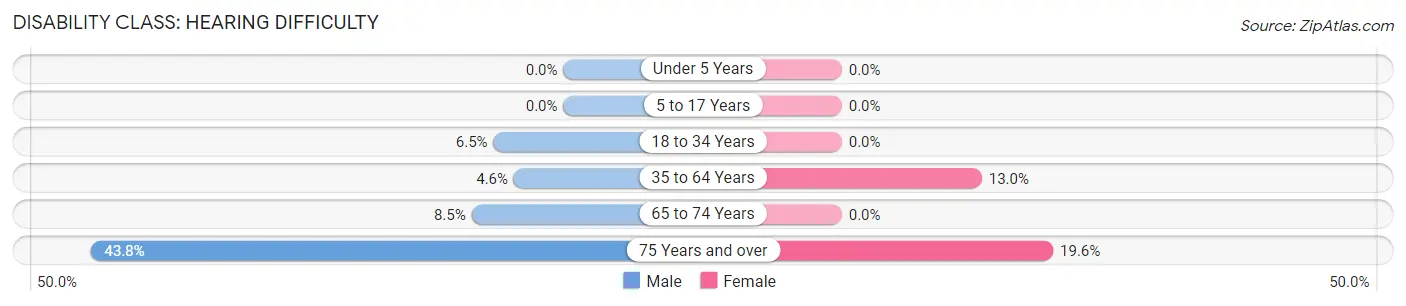
| Age Bracket | Male | Female |
| Under 5 Years | 0 (0.0%) | 0 (0.0%) |
| 5 to 17 Years | 0 (0.0%) | 0 (0.0%) |
| 18 to 34 Years | 95 (6.5%) | 0 (0.0%) |
| 35 to 64 Years | 63 (4.6%) | 188 (13.0%) |
| 65 to 74 Years | 26 (8.5%) | 0 (0.0%) |
| 75 Years and over | 60 (43.8%) | 40 (19.6%) |
Disability Class: Vision Difficulty
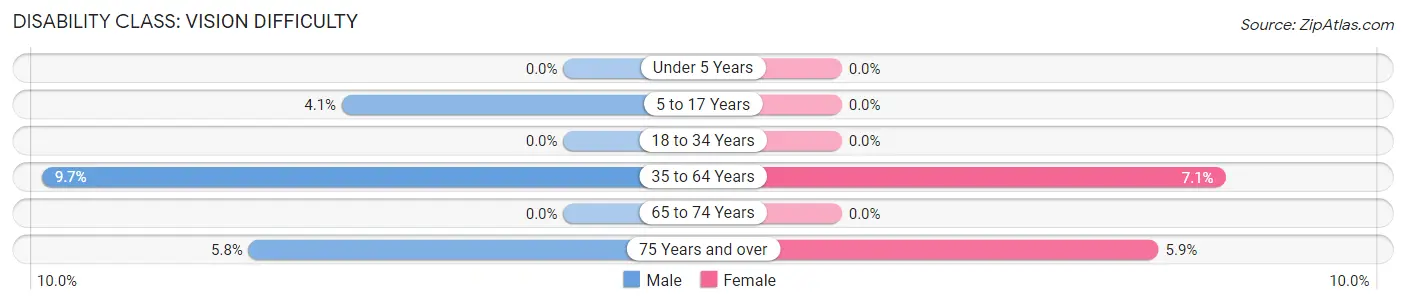
| Age Bracket | Male | Female |
| Under 5 Years | 0 (0.0%) | 0 (0.0%) |
| 5 to 17 Years | 46 (4.1%) | 0 (0.0%) |
| 18 to 34 Years | 0 (0.0%) | 0 (0.0%) |
| 35 to 64 Years | 133 (9.7%) | 103 (7.1%) |
| 65 to 74 Years | 0 (0.0%) | 0 (0.0%) |
| 75 Years and over | 8 (5.8%) | 12 (5.9%) |
Disability Class: Cognitive Difficulty
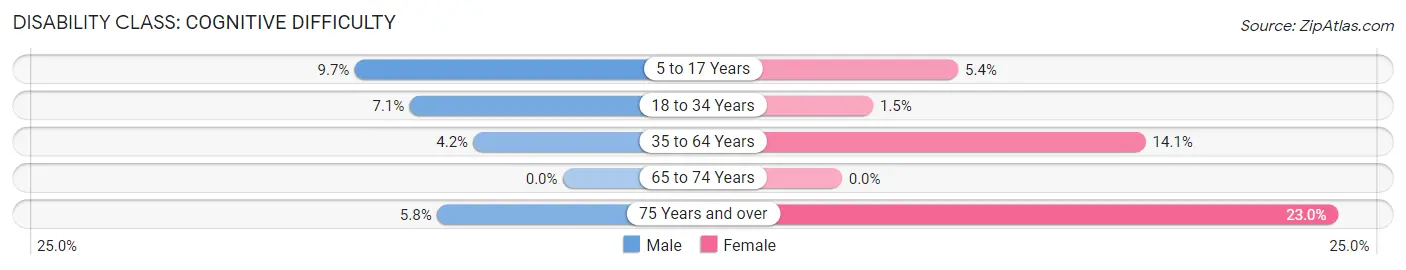
| Age Bracket | Male | Female |
| 5 to 17 Years | 108 (9.7%) | 50 (5.4%) |
| 18 to 34 Years | 104 (7.1%) | 25 (1.5%) |
| 35 to 64 Years | 57 (4.2%) | 204 (14.1%) |
| 65 to 74 Years | 0 (0.0%) | 0 (0.0%) |
| 75 Years and over | 8 (5.8%) | 47 (23.0%) |
Disability Class: Ambulatory Difficulty
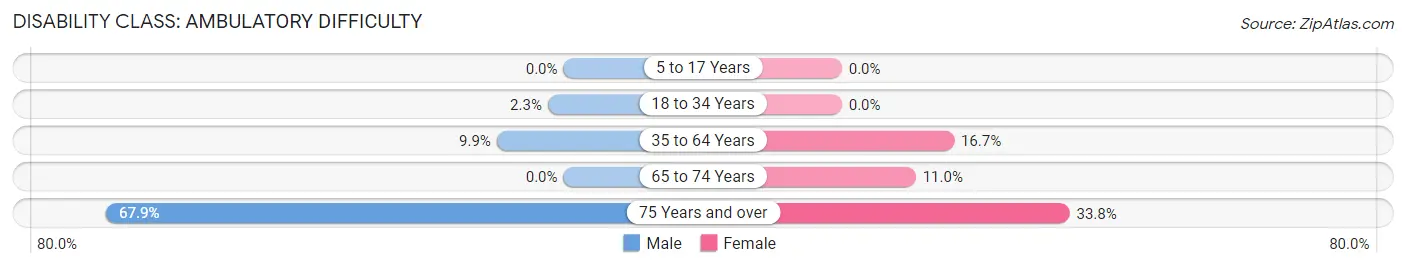
| Age Bracket | Male | Female |
| 5 to 17 Years | 0 (0.0%) | 0 (0.0%) |
| 18 to 34 Years | 34 (2.3%) | 0 (0.0%) |
| 35 to 64 Years | 136 (9.9%) | 241 (16.7%) |
| 65 to 74 Years | 0 (0.0%) | 38 (11.0%) |
| 75 Years and over | 93 (67.9%) | 69 (33.8%) |
Disability Class: Self-Care Difficulty
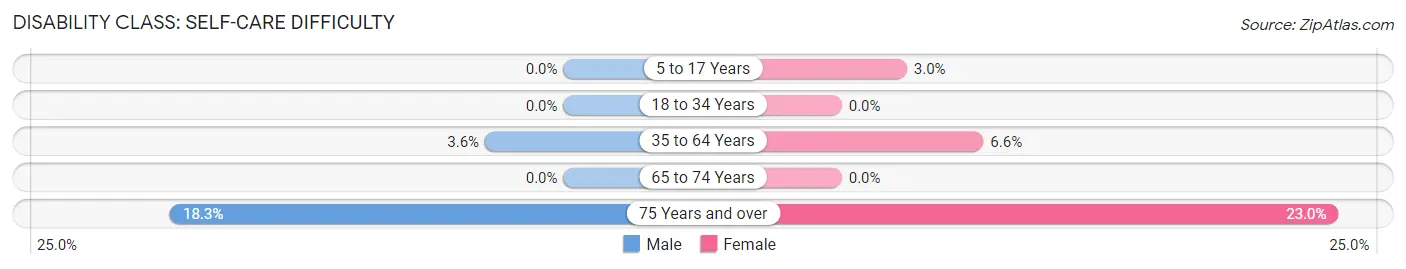
| Age Bracket | Male | Female |
| 5 to 17 Years | 0 (0.0%) | 28 (3.0%) |
| 18 to 34 Years | 0 (0.0%) | 0 (0.0%) |
| 35 to 64 Years | 50 (3.6%) | 95 (6.6%) |
| 65 to 74 Years | 0 (0.0%) | 0 (0.0%) |
| 75 Years and over | 25 (18.2%) | 47 (23.0%) |
Technology Access in Alamosa
Computing Device Access in Alamosa
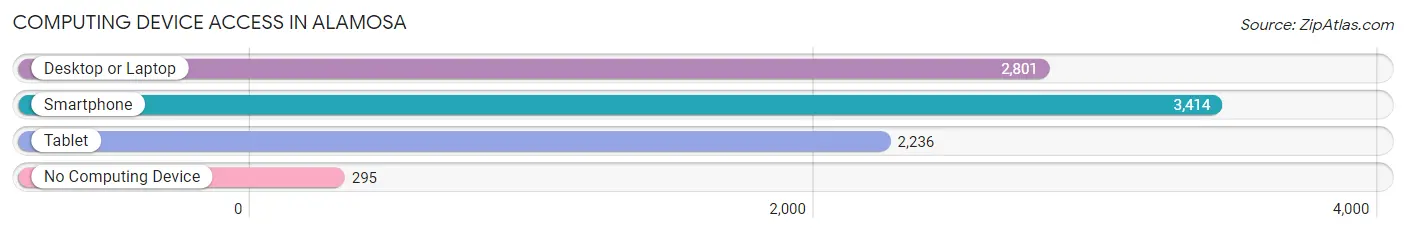
| Device Type | # Households | % Households |
| Desktop or Laptop | 2,801 | 72.0% |
| Smartphone | 3,414 | 87.8% |
| Tablet | 2,236 | 57.5% |
| No Computing Device | 295 | 7.6% |
| Total | 3,890 | 100.0% |
Internet Access in Alamosa
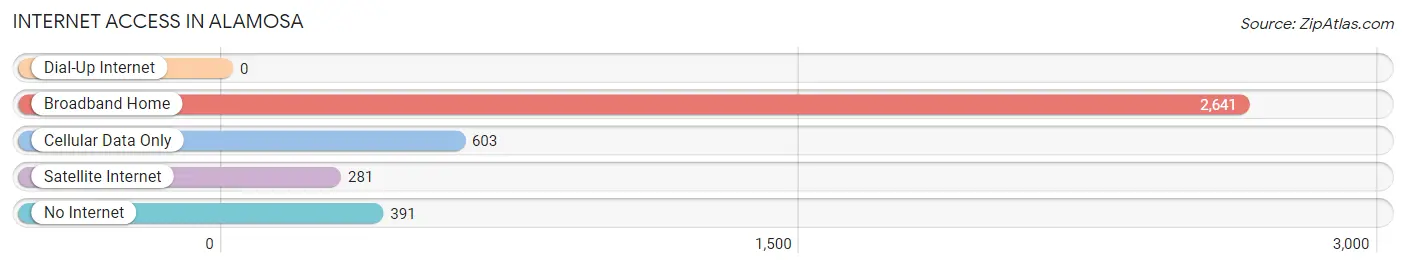
| Internet Type | # Households | % Households |
| Dial-Up Internet | 0 | 0.0% |
| Broadband Home | 2,641 | 67.9% |
| Cellular Data Only | 603 | 15.5% |
| Satellite Internet | 281 | 7.2% |
| No Internet | 391 | 10.1% |
| Total | 3,890 | 100.0% |
Alamosa Summary
Alamosa is a city located in the San Luis Valley of south-central Colorado. It is the county seat of Alamosa County and the most populous city in the valley. The city is situated along the Rio Grande, which is the longest river in the southwestern United States. Alamosa is located at the base of the Sangre de Cristo Mountains and is surrounded by the San Luis Valley.
History
The area around Alamosa was first inhabited by the Ute and Jicarilla Apache tribes. The first European settlers arrived in the area in the late 1800s. The town was founded in 1878 by the Denver and Rio Grande Railroad. The railroad was built to connect Denver to Santa Fe, New Mexico. The town was named after the nearby Alamosa Creek.
In the early 1900s, Alamosa experienced a period of rapid growth. The population increased from 1,000 in 1900 to over 5,000 by 1910. The town was incorporated in 1912.
During the Great Depression, Alamosa was hit hard by the economic downturn. The population decreased from 5,000 in 1930 to 3,000 in 1940. The economy began to recover in the 1940s and 1950s, and the population increased to over 5,000 by 1960.
Geography
Alamosa is located in the San Luis Valley of south-central Colorado. The city is situated along the Rio Grande, which is the longest river in the southwestern United States. The city is surrounded by the San Luis Valley, which is a large, flat, high-altitude basin. The valley is surrounded by the Sangre de Cristo Mountains to the east and the San Juan Mountains to the west.
The climate in Alamosa is semi-arid, with hot summers and cold winters. The average annual temperature is 50°F (10°C). The average annual precipitation is 11.5 inches (29 cm).
Economy
The economy of Alamosa is largely based on agriculture and tourism. The city is home to several large farms, which produce potatoes, onions, and other vegetables. The city is also home to several tourist attractions, including the Great Sand Dunes National Park and the Rio Grande Scenic Railroad.
The city is also home to several manufacturing companies, including a large potato chip factory. The city is also home to several educational institutions, including Adams State University and the San Luis Valley Regional Medical Center.
Demographics
As of the 2010 census, the population of Alamosa was 9,119. The racial makeup of the city was 73.3% White, 0.7% African American, 1.2% Native American, 0.7% Asian, 0.1% Pacific Islander, 21.2% from other races, and 3.0% from two or more races. Hispanic or Latino of any race were 57.2% of the population.
The median household income in Alamosa was $31,919, and the median family income was $37,917. The per capita income was $17,845. About 18.2% of families and 22.2% of the population were below the poverty line, including 28.2% of those under age 18 and 11.2% of those age 65 or over.
Common Questions
What is Per Capita Income in Alamosa?
Per Capita income in Alamosa is $26,750.
What is the Median Family Income in Alamosa?
Median Family Income in Alamosa is $61,786.
What is the Median Household income in Alamosa?
Median Household Income in Alamosa is $50,239.
What is Income or Wage Gap in Alamosa?
Income or Wage Gap in Alamosa is 17.5%.
Women in Alamosa earn 82.5 cents for every dollar earned by a man.
What is Family Income Deficit in Alamosa?
Family Income Deficit in Alamosa is $8,715.
Families that are below poverty line in Alamosa earn $8,715 less on average than the poverty threshold level.
What is Inequality or Gini Index in Alamosa?
Inequality or Gini Index in Alamosa is 0.49.
What is the Total Population of Alamosa?
Total Population of Alamosa is 9,792.
What is the Total Male Population of Alamosa?
Total Male Population of Alamosa is 4,832.
What is the Total Female Population of Alamosa?
Total Female Population of Alamosa is 4,960.
What is the Ratio of Males per 100 Females in Alamosa?
There are 97.42 Males per 100 Females in Alamosa.
What is the Ratio of Females per 100 Males in Alamosa?
There are 102.65 Females per 100 Males in Alamosa.
What is the Median Population Age in Alamosa?
Median Population Age in Alamosa is 29.7 Years.
What is the Average Family Size in Alamosa
Average Family Size in Alamosa is 3.2 People.
What is the Average Household Size in Alamosa
Average Household Size in Alamosa is 2.3 People.
How Large is the Labor Force in Alamosa?
There are 4,646 People in the Labor Forcein in Alamosa.
What is the Percentage of People in the Labor Force in Alamosa?
62.2% of People are in the Labor Force in Alamosa.
What is the Unemployment Rate in Alamosa?
Unemployment Rate in Alamosa is 3.9%.