Zip Codes with the Highest Percentage of Population Employed in Professional & Scientific Services in Victorville, CA
RELATED REPORTS & OPTIONS
Professional & Scientific Services
Victorville
Compare Zip Codes
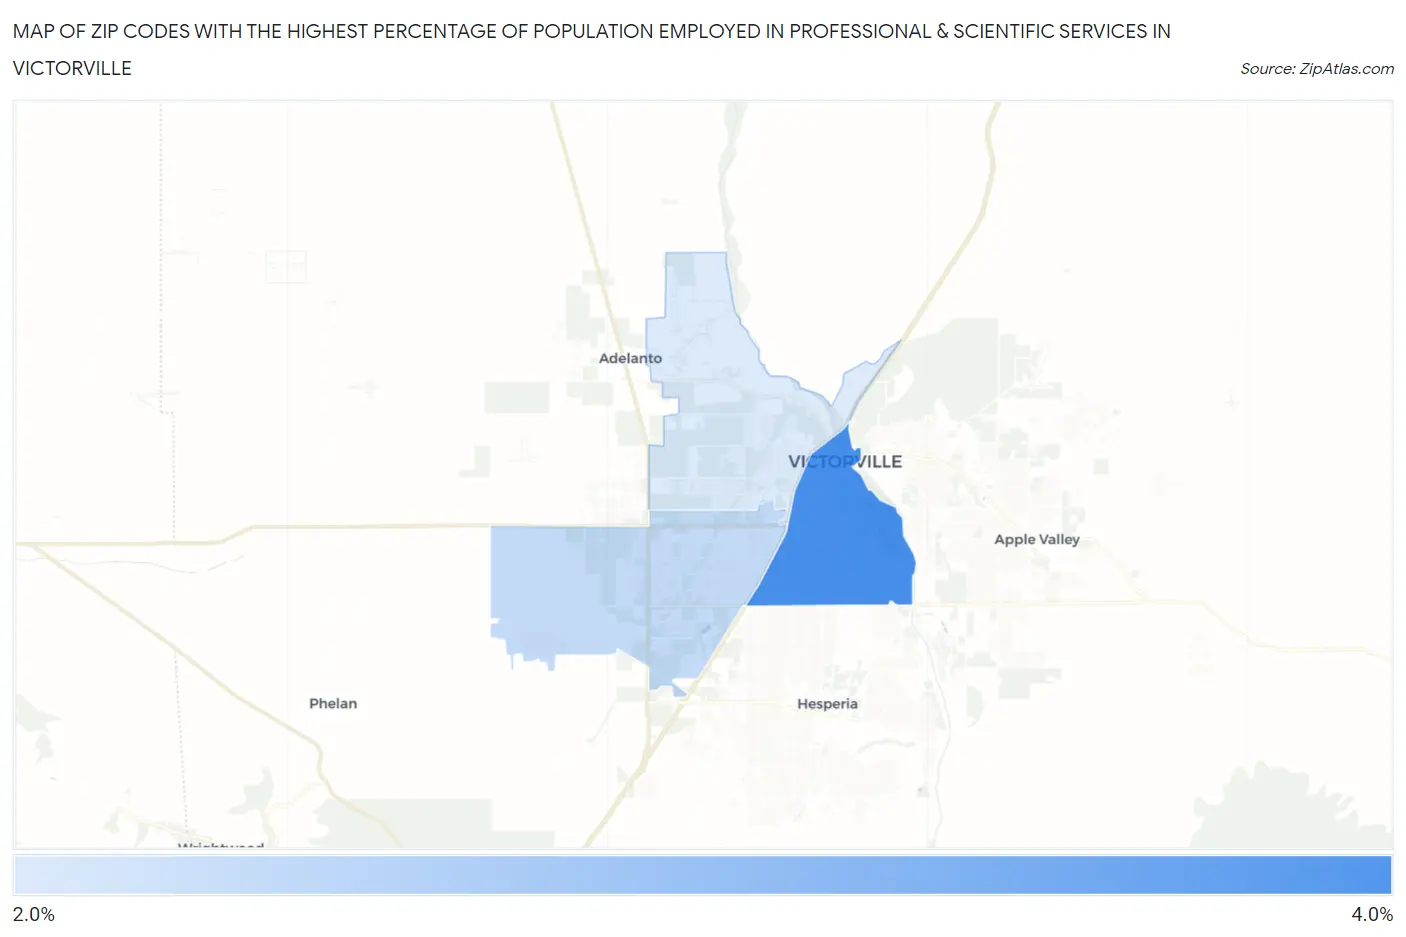
Map of Zip Codes with the Highest Percentage of Population Employed in Professional & Scientific Services in Victorville
0.0%
4.0%
Zip Codes with the Highest Percentage of Population Employed in Professional & Scientific Services in Victorville, CA
| Zip Code | % Employed | vs State | vs National | |
| 1. | 92395 | 3.1% | 9.4%(-6.32)#1,255 | 7.8%(-4.73)#18,033 |
| 2. | 92392 | 2.2% | 9.4%(-7.19)#1,358 | 7.8%(-5.60)#21,088 |
| 3. | 92394 | 2.1% | 9.4%(-7.37)#1,380 | 7.8%(-5.79)#21,695 |
1
Common Questions
What are the Top Zip Codes with the Highest Percentage of Population Employed in Professional & Scientific Services in Victorville, CA?
Top Zip Codes with the Highest Percentage of Population Employed in Professional & Scientific Services in Victorville, CA are:
What zip code has the Highest Percentage of Population Employed in Professional & Scientific Services in Victorville, CA?
92395 has the Highest Percentage of Population Employed in Professional & Scientific Services in Victorville, CA with 3.1%.
What is the Percentage of Population Employed in Professional & Scientific Services in Victorville, CA?
Percentage of Population Employed in Professional & Scientific Services in Victorville is 2.4%.
What is the Percentage of Population Employed in Professional & Scientific Services in California?
Percentage of Population Employed in Professional & Scientific Services in California is 9.4%.
What is the Percentage of Population Employed in Professional & Scientific Services in the United States?
Percentage of Population Employed in Professional & Scientific Services in the United States is 7.8%.