Zip Codes with the Highest Percentage of Population Employed in Farming, Fishing & Forestry in Tustin, CA
RELATED REPORTS & OPTIONS
Farming, Fishing & Forestry
Tustin
Compare Zip Codes
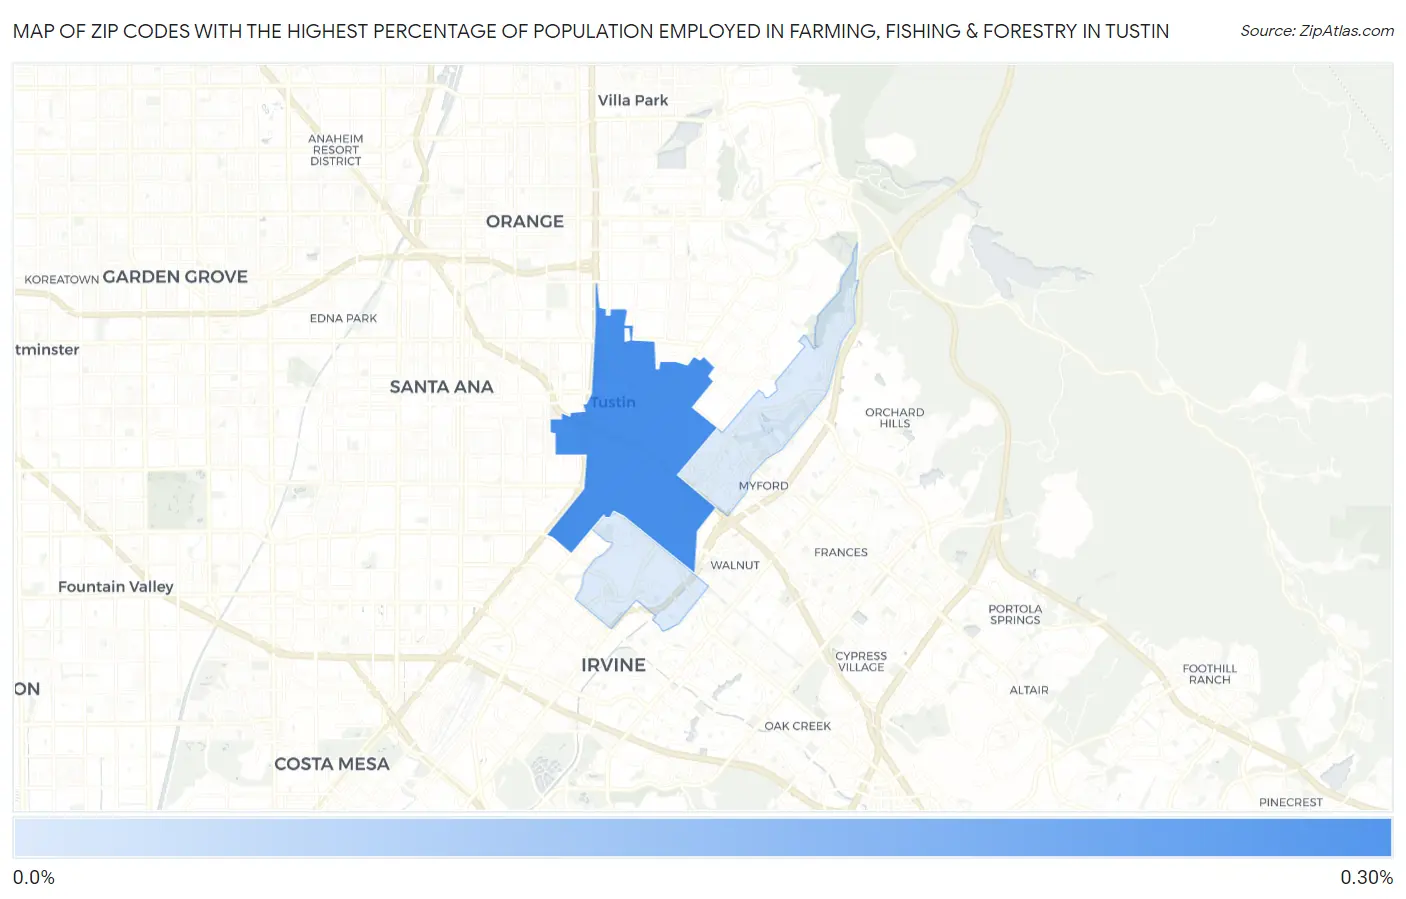
Map of Zip Codes with the Highest Percentage of Population Employed in Farming, Fishing & Forestry in Tustin
0.0%
0.30%
Zip Codes with the Highest Percentage of Population Employed in Farming, Fishing & Forestry in Tustin, CA
| Zip Code | % Employed | vs State | vs National | |
| 1. | 92780 | 0.29% | 1.4%(-1.12)#854 | 0.61%(-0.314)#14,936 |
| 2. | 92782 | 0.044% | 1.4%(-1.37)#1,158 | 0.61%(-0.561)#18,749 |
1
Common Questions
What are the Top Zip Codes with the Highest Percentage of Population Employed in Farming, Fishing & Forestry in Tustin, CA?
Top Zip Codes with the Highest Percentage of Population Employed in Farming, Fishing & Forestry in Tustin, CA are:
What zip code has the Highest Percentage of Population Employed in Farming, Fishing & Forestry in Tustin, CA?
92780 has the Highest Percentage of Population Employed in Farming, Fishing & Forestry in Tustin, CA with 0.29%.
What is the Percentage of Population Employed in Farming, Fishing & Forestry in Tustin, CA?
Percentage of Population Employed in Farming, Fishing & Forestry in Tustin is 0.22%.
What is the Percentage of Population Employed in Farming, Fishing & Forestry in California?
Percentage of Population Employed in Farming, Fishing & Forestry in California is 1.4%.
What is the Percentage of Population Employed in Farming, Fishing & Forestry in the United States?
Percentage of Population Employed in Farming, Fishing & Forestry in the United States is 0.61%.