Zip Codes with the Highest Percentage of Population Employed in Agriculture, Fishing & Hunting in San Jacinto, CA

RELATED REPORTS & OPTIONS

Agriculture, Fishing & Hunting
Population
Families and Households
Female Fertility
Female Fertility (Unmarried)
Race (Community Size)
Race (Percentage)
Ancestry (Community Size)
Ancestry (Percentage)
Immigrant Origin (Total)
Immigrant Origin (Percentage)
Income
Income (Families)
Income (Households)
Poverty
Poverty (Families)
Unemployment
Employment Occupations
Employment Industries
Employer Class
Commute Time
Commute Means
School Enrollment
Education by Degree Field
Occupancy
Finances
Physical Characteristics
San Jacinto
States
California Cities
AlamedaAlhambraAnaheimAntiochApple ValleyArcadiaAuburnBakersfieldBerkeleyBuena ParkBurbankCamarilloCanoga ParkCanyon CountryCarlsbadCastro ValleyChicoChula VistaCitrus HeightsClovisComptonConcordCoronaCosta MesaCovinaCulver CityDaly CityDanvilleDavisDesert Hot SpringsDowneyDuarteEl CajonEl MonteElk GroveEncinoEscondidoEurekaFairfieldFontanaFremontFresnoFullertonGarden GroveGardenaGlendaleGlendoraGrass ValleyHaywardHemetHesperiaHuntington BeachIndioInglewoodIrvineLa MesaLa PuenteLake ElsinoreLakewoodLancasterLivermoreLodiLompocLong BeachLos AltosLos AngelesLos GatosMaderaMantecaMenifeeMercedMission ViejoModestoMoreno ValleyMountain ViewMurrietaNapaNorth HollywoodNovatoOaklandOceansideOntarioOrangeOrovilleOxnardPalm SpringsPalmdalePalo AltoPasadenaPerrisPetalumaPleasantonPomonaPortervilleRancho CordovaRancho CucamongaReddingRedlandsRedondo BeachRedwood CityRialtoRichmondRiversideRocklinRosevilleSacramentoSalinasSan BernardinoSan DiegoSan FranciscoSan GabrielSan JacintoSan JoseSan LeandroSan Luis ObispoSan MarcosSan MateoSan PedroSan RafaelSanta AnaSanta BarbaraSanta ClaraSanta CruzSanta MariaSanta MonicaSanta RosaSherman OaksSimi ValleySpring ValleyStocktonSunnyvaleTemeculaThousand OaksTorranceTrabuco CanyonTracyTurlockTustinUplandVacavilleValenciaVallejoVan NuysVenturaVictorvilleVisaliaVistaWalnut CreekWest CovinaWest SacramentoWhittierWoodlandWoodland HillsYorba LindaYuba City
Compare Zip Codes
Comparison Subject

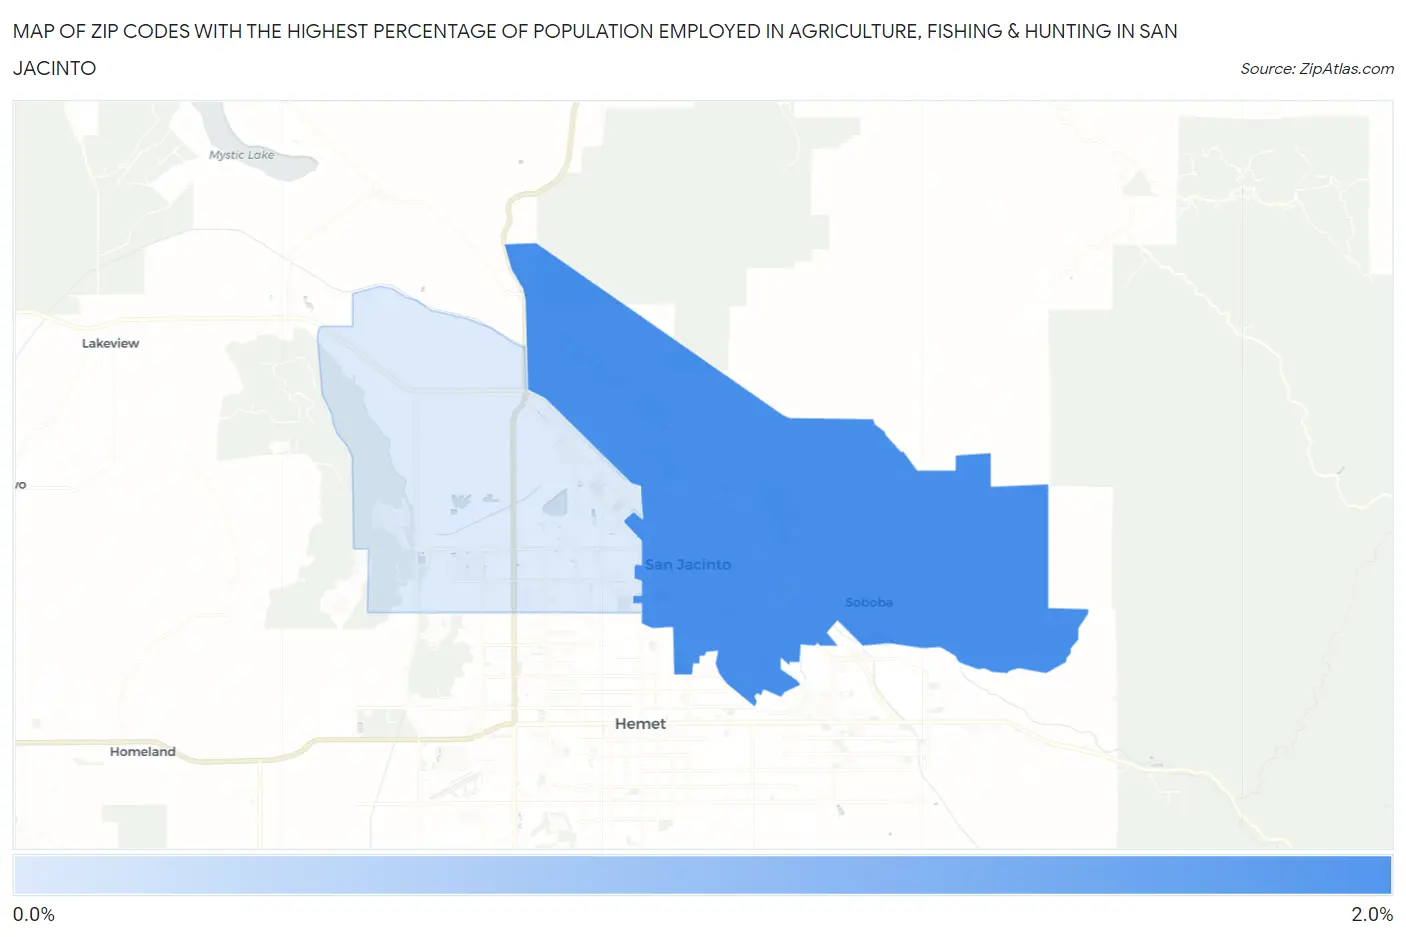
Map of Zip Codes with the Highest Percentage of Population Employed in Agriculture, Fishing & Hunting in San Jacinto

0.0%
2.0%
Zip Codes with the Highest Percentage of Population Employed in Agriculture, Fishing & Hunting in San Jacinto Map

Zip Codes with the Highest Percentage of Population Employed in Agriculture, Fishing & Hunting in San Jacinto, CA

Zip Code % Employed vs State vs National
1.925831.5%2.0%(-0.436)#6151.2%(+0.350)#14,128
2.925820.96%2.0%(-1.02)#7381.2%(-0.238)#16,398

Common Questions

What are the Top Zip Codes with the Highest Percentage of Population Employed in Agriculture, Fishing & Hunting in San Jacinto, CA?
Top Zip Codes with the Highest Percentage of Population Employed in Agriculture, Fishing & Hunting in San Jacinto, CA are:
#1
1.5%
#2
0.96%
What zip code has the Highest Percentage of Population Employed in Agriculture, Fishing & Hunting in San Jacinto, CA?
92583 has the Highest Percentage of Population Employed in Agriculture, Fishing & Hunting in San Jacinto, CA with 1.5%.
What is the Percentage of Population Employed in Agriculture, Fishing & Hunting in San Jacinto, CA?
Percentage of Population Employed in Agriculture, Fishing & Hunting in San Jacinto is 1.4%.
What is the Percentage of Population Employed in Agriculture, Fishing & Hunting in California?
Percentage of Population Employed in Agriculture, Fishing & Hunting in California is 2.0%.
What is the Percentage of Population Employed in Agriculture, Fishing & Hunting in the United States?
Percentage of Population Employed in Agriculture, Fishing & Hunting in the United States is 1.2%.