Zip Codes with the Highest Percentage of Population Employed in Transportation & Warehousing in San Gabriel, CA
RELATED REPORTS & OPTIONS
Transportation & Warehousing
San Gabriel
Compare Zip Codes
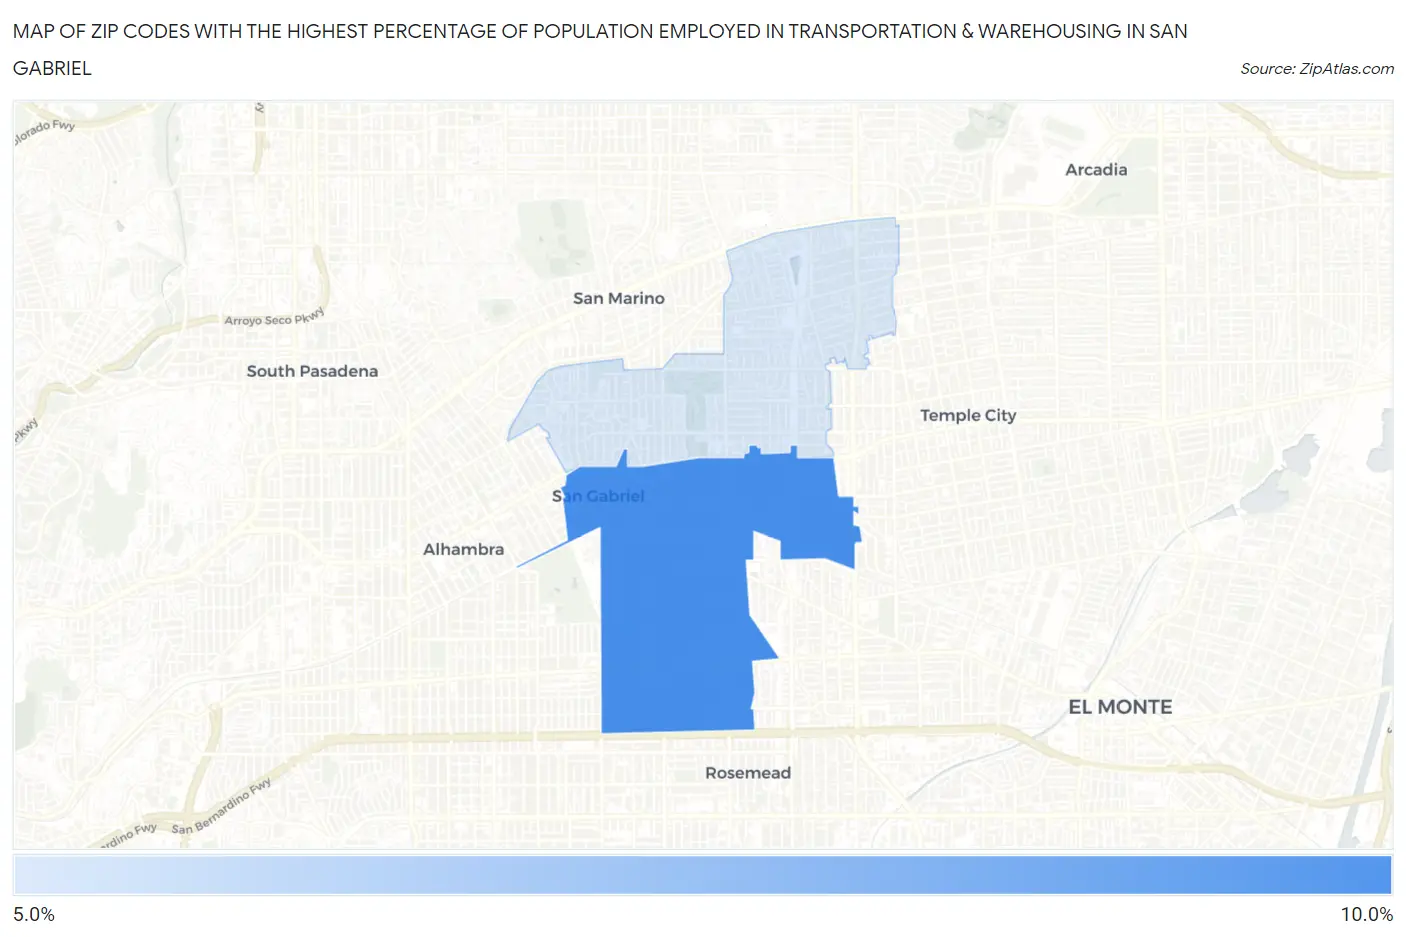
Map of Zip Codes with the Highest Percentage of Population Employed in Transportation & Warehousing in San Gabriel
5.7%
8.5%
Zip Codes with the Highest Percentage of Population Employed in Transportation & Warehousing in San Gabriel, CA
| Zip Code | % Employed | vs State | vs National | |
| 1. | 91776 | 8.5% | 5.1%(+3.33)#192 | 4.9%(+3.52)#4,314 |
| 2. | 91775 | 5.7% | 5.1%(+0.578)#464 | 4.9%(+0.762)#9,634 |
1
Common Questions
What are the Top Zip Codes with the Highest Percentage of Population Employed in Transportation & Warehousing in San Gabriel, CA?
Top Zip Codes with the Highest Percentage of Population Employed in Transportation & Warehousing in San Gabriel, CA are:
What zip code has the Highest Percentage of Population Employed in Transportation & Warehousing in San Gabriel, CA?
91776 has the Highest Percentage of Population Employed in Transportation & Warehousing in San Gabriel, CA with 8.5%.
What is the Percentage of Population Employed in Transportation & Warehousing in San Gabriel, CA?
Percentage of Population Employed in Transportation & Warehousing in San Gabriel is 7.8%.
What is the Percentage of Population Employed in Transportation & Warehousing in California?
Percentage of Population Employed in Transportation & Warehousing in California is 5.1%.
What is the Percentage of Population Employed in Transportation & Warehousing in the United States?
Percentage of Population Employed in Transportation & Warehousing in the United States is 4.9%.