Zip Codes with the Highest Percentage of Population Employed in Transportation & Warehousing in San Clemente, CA
RELATED REPORTS & OPTIONS
Transportation & Warehousing
San Clemente
Compare Zip Codes
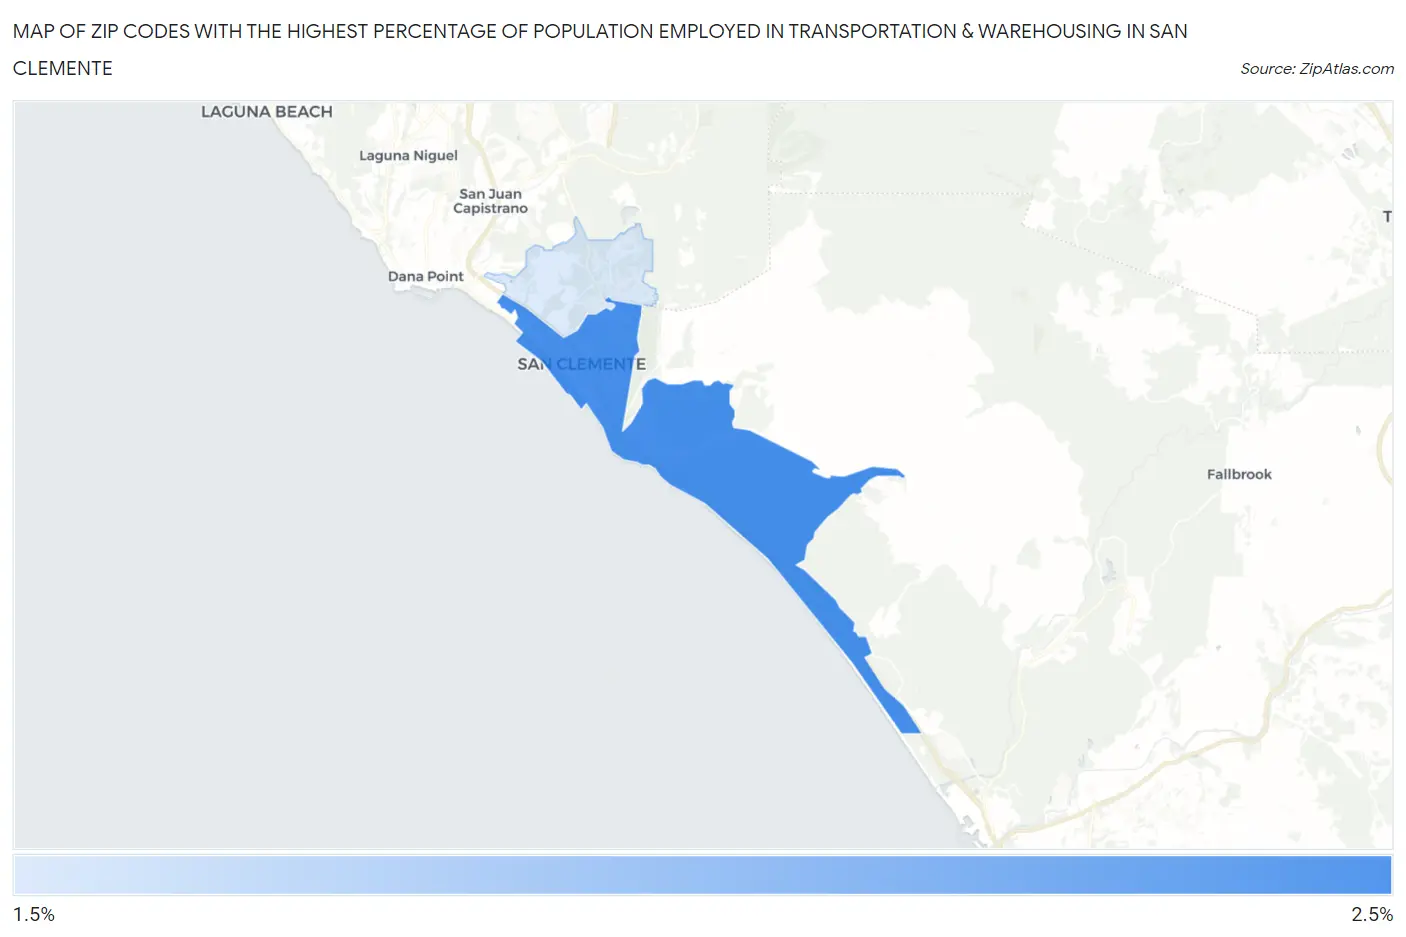
Map of Zip Codes with the Highest Percentage of Population Employed in Transportation & Warehousing in San Clemente
1.9%
2.0%
Zip Codes with the Highest Percentage of Population Employed in Transportation & Warehousing in San Clemente, CA
| Zip Code | % Employed | vs State | vs National | |
| 1. | 92672 | 2.0% | 5.1%(-3.13)#1,245 | 4.9%(-2.94)#24,261 |
| 2. | 92673 | 1.9% | 5.1%(-3.22)#1,268 | 4.9%(-3.04)#24,591 |
1
Common Questions
What are the Top Zip Codes with the Highest Percentage of Population Employed in Transportation & Warehousing in San Clemente, CA?
Top Zip Codes with the Highest Percentage of Population Employed in Transportation & Warehousing in San Clemente, CA are:
What zip code has the Highest Percentage of Population Employed in Transportation & Warehousing in San Clemente, CA?
92672 has the Highest Percentage of Population Employed in Transportation & Warehousing in San Clemente, CA with 2.0%.
What is the Percentage of Population Employed in Transportation & Warehousing in San Clemente, CA?
Percentage of Population Employed in Transportation & Warehousing in San Clemente is 2.0%.
What is the Percentage of Population Employed in Transportation & Warehousing in California?
Percentage of Population Employed in Transportation & Warehousing in California is 5.1%.
What is the Percentage of Population Employed in Transportation & Warehousing in the United States?
Percentage of Population Employed in Transportation & Warehousing in the United States is 4.9%.