Zip Codes with the Highest Percentage of Population Employed in Transportation & Warehousing in Malibu, CA
RELATED REPORTS & OPTIONS
Transportation & Warehousing
Malibu
Compare Zip Codes
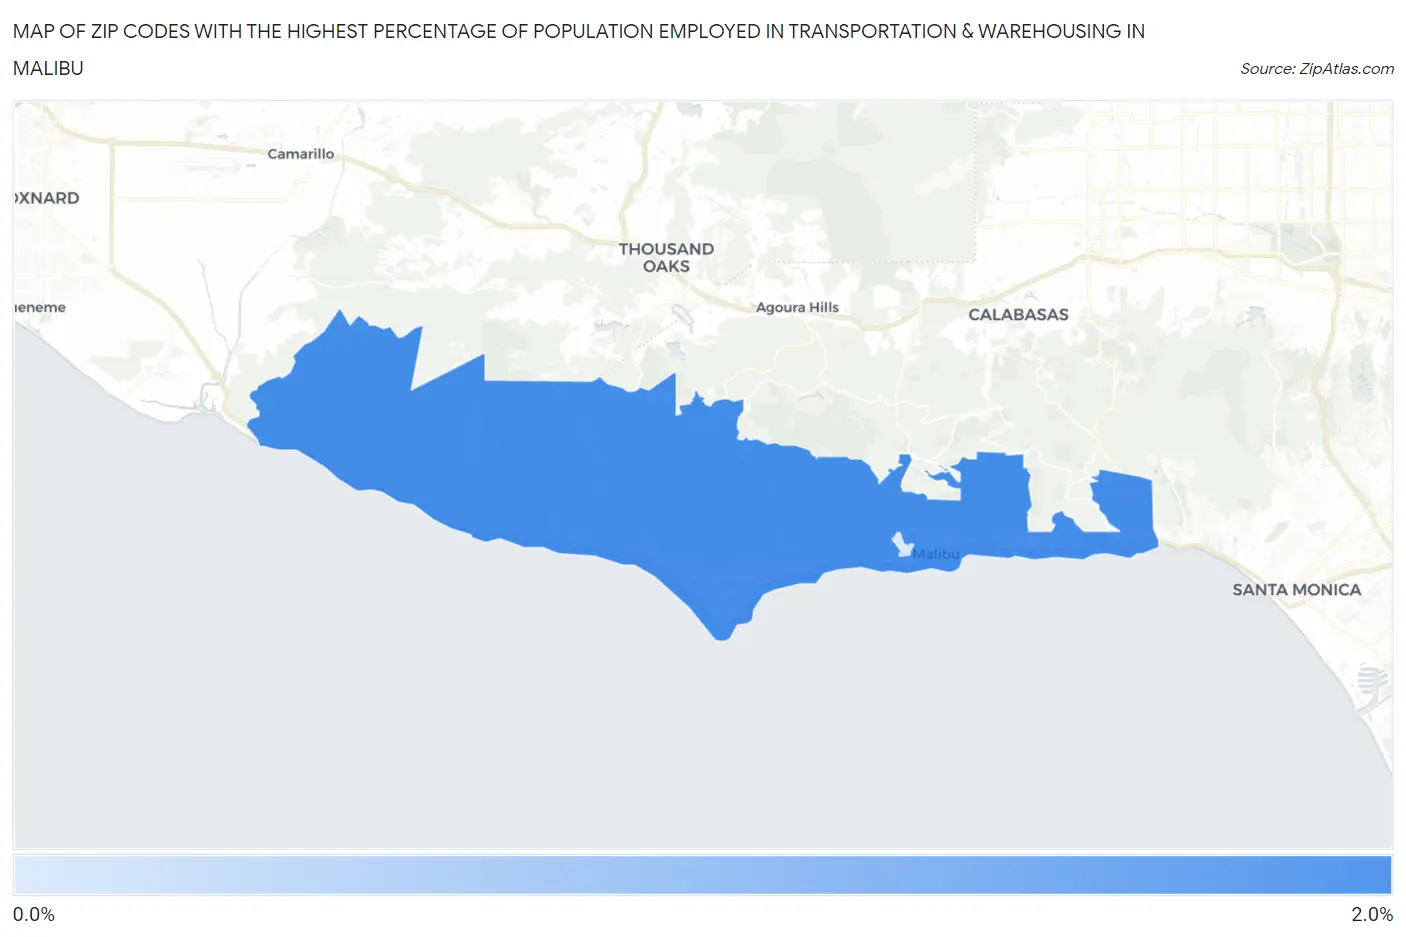
Map of Zip Codes with the Highest Percentage of Population Employed in Transportation & Warehousing in Malibu
0.0%
2.0%
Zip Codes with the Highest Percentage of Population Employed in Transportation & Warehousing in Malibu, CA
| Zip Code | % Employed | vs State | vs National | |
| 1. | 90265 | 1.6% | 5.1%(-3.52)#1,328 | 4.9%(-3.34)#25,523 |
| 2. | 90263 | 0.31% | 5.1%(-4.82)#1,449 | 4.9%(-4.63)#27,978 |
1
Common Questions
What are the Top Zip Codes with the Highest Percentage of Population Employed in Transportation & Warehousing in Malibu, CA?
Top Zip Codes with the Highest Percentage of Population Employed in Transportation & Warehousing in Malibu, CA are:
What zip code has the Highest Percentage of Population Employed in Transportation & Warehousing in Malibu, CA?
90265 has the Highest Percentage of Population Employed in Transportation & Warehousing in Malibu, CA with 1.6%.
What is the Percentage of Population Employed in Transportation & Warehousing in Malibu, CA?
Percentage of Population Employed in Transportation & Warehousing in Malibu is 2.0%.
What is the Percentage of Population Employed in Transportation & Warehousing in California?
Percentage of Population Employed in Transportation & Warehousing in California is 5.1%.
What is the Percentage of Population Employed in Transportation & Warehousing in the United States?
Percentage of Population Employed in Transportation & Warehousing in the United States is 4.9%.