Zip Codes with the Highest Percentage of Population Employed in Agriculture, Fishing & Hunting in Madera, CA
RELATED REPORTS & OPTIONS
Agriculture, Fishing & Hunting
Madera
Compare Zip Codes
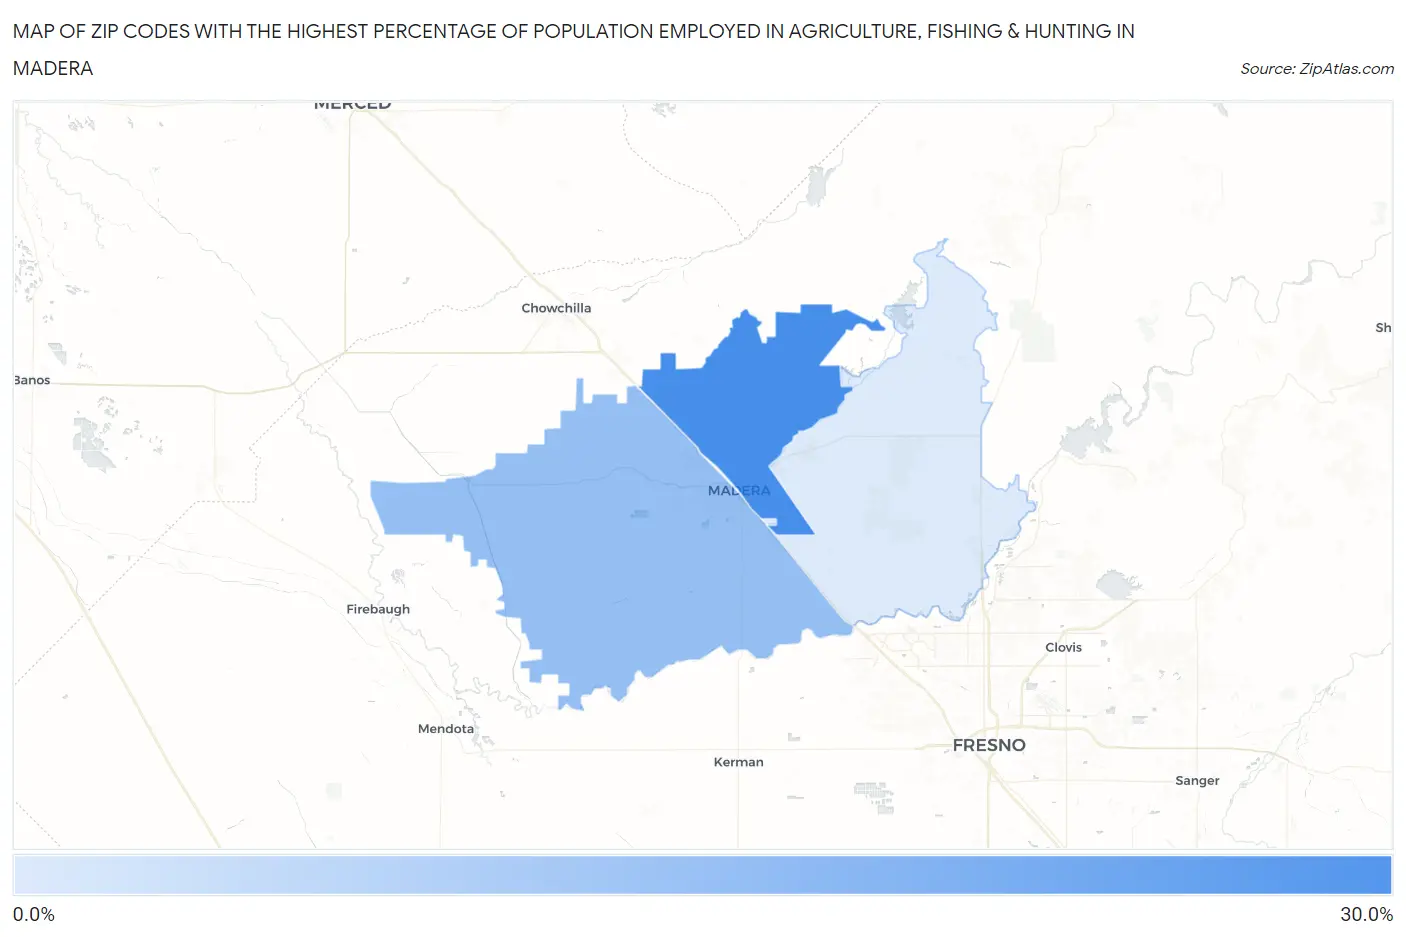
Map of Zip Codes with the Highest Percentage of Population Employed in Agriculture, Fishing & Hunting in Madera
3.0%
25.4%
Zip Codes with the Highest Percentage of Population Employed in Agriculture, Fishing & Hunting in Madera, CA
| Zip Code | % Employed | vs State | vs National | |
| 1. | 93638 | 25.4% | 2.0%(+23.5)#104 | 1.2%(+24.2)#1,208 |
| 2. | 93637 | 13.2% | 2.0%(+11.2)#214 | 1.2%(+12.0)#3,130 |
| 3. | 93636 | 3.0% | 2.0%(+1.05)#482 | 1.2%(+1.83)#10,510 |
1
Common Questions
What are the Top Zip Codes with the Highest Percentage of Population Employed in Agriculture, Fishing & Hunting in Madera, CA?
Top Zip Codes with the Highest Percentage of Population Employed in Agriculture, Fishing & Hunting in Madera, CA are:
What zip code has the Highest Percentage of Population Employed in Agriculture, Fishing & Hunting in Madera, CA?
93638 has the Highest Percentage of Population Employed in Agriculture, Fishing & Hunting in Madera, CA with 25.4%.
What is the Percentage of Population Employed in Agriculture, Fishing & Hunting in Madera, CA?
Percentage of Population Employed in Agriculture, Fishing & Hunting in Madera is 21.9%.
What is the Percentage of Population Employed in Agriculture, Fishing & Hunting in California?
Percentage of Population Employed in Agriculture, Fishing & Hunting in California is 2.0%.
What is the Percentage of Population Employed in Agriculture, Fishing & Hunting in the United States?
Percentage of Population Employed in Agriculture, Fishing & Hunting in the United States is 1.2%.