Zip Codes with the Highest Percentage of Population Employed in Transportation in Lompoc, CA
RELATED REPORTS & OPTIONS
Select to Compare
Select to Compare
Compare Zip Codes
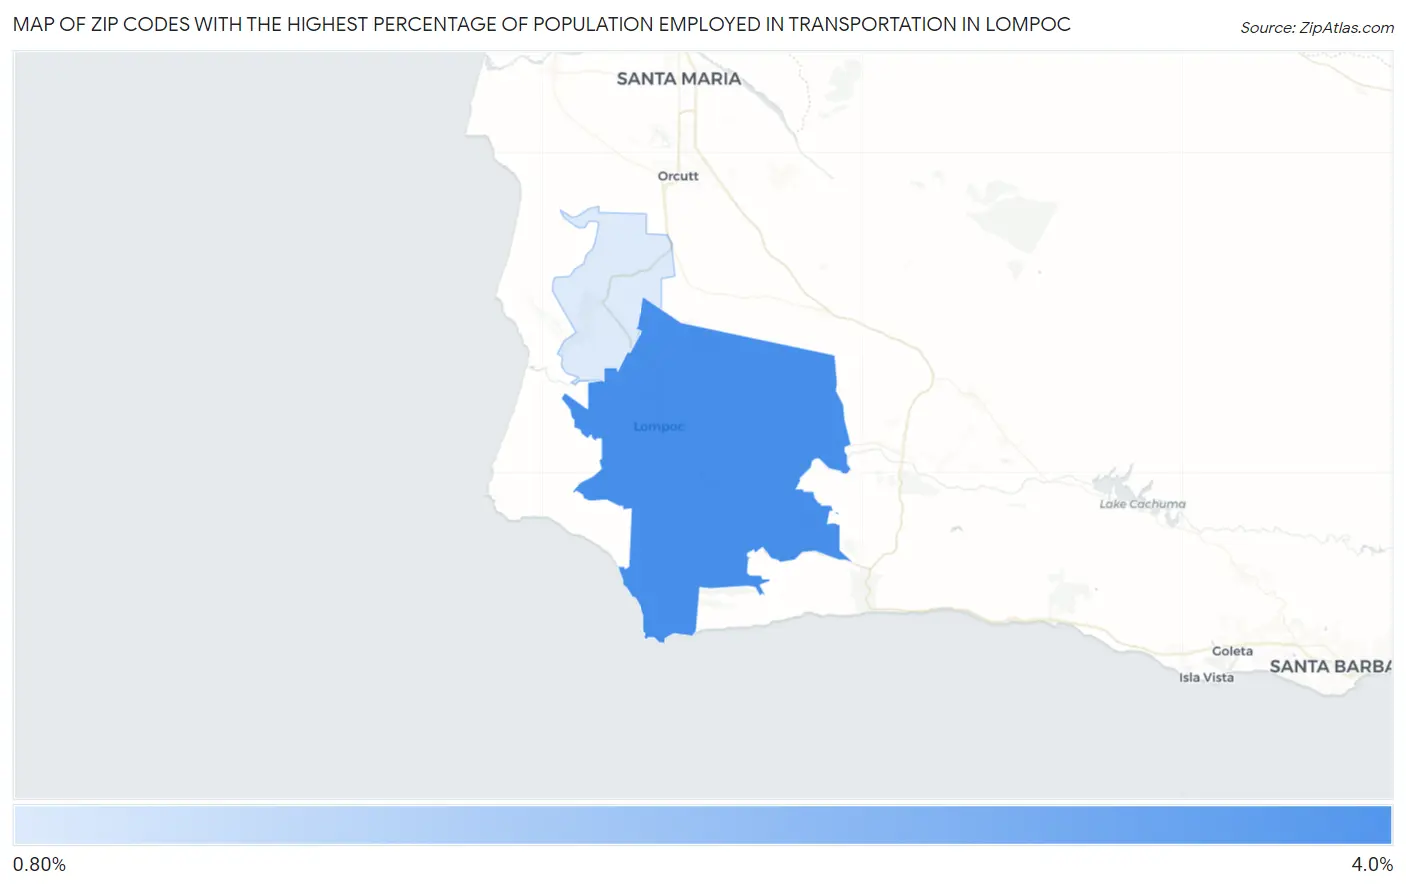
Map of Zip Codes with the Highest Percentage of Population Employed in Transportation in Lompoc
0.0%
4.0%
Zip Codes with the Highest Percentage of Population Employed in Transportation in Lompoc, CA
| Zip Code | % Employed | vs State | vs National | |
| 1. | 93436 | 3.9% | 3.5%(+0.402)#552 | 3.8%(+0.132)#14,595 |
1
Common Questions
What are the Top Zip Codes with the Highest Percentage of Population Employed in Transportation in Lompoc, CA?
Top Zip Codes with the Highest Percentage of Population Employed in Transportation in Lompoc, CA are:
What zip code has the Highest Percentage of Population Employed in Transportation in Lompoc, CA?
93436 has the Highest Percentage of Population Employed in Transportation in Lompoc, CA with 3.9%.
What is the Percentage of Population Employed in Transportation in Lompoc, CA?
Percentage of Population Employed in Transportation in Lompoc is 4.7%.
What is the Percentage of Population Employed in Transportation in California?
Percentage of Population Employed in Transportation in California is 3.5%.
What is the Percentage of Population Employed in Transportation in the United States?
Percentage of Population Employed in Transportation in the United States is 3.8%.