Zip Codes with the Highest Percentage of Population Employed in Agriculture, Fishing & Hunting in Lompoc, CA
RELATED REPORTS & OPTIONS
Agriculture, Fishing & Hunting
Lompoc
Compare Zip Codes
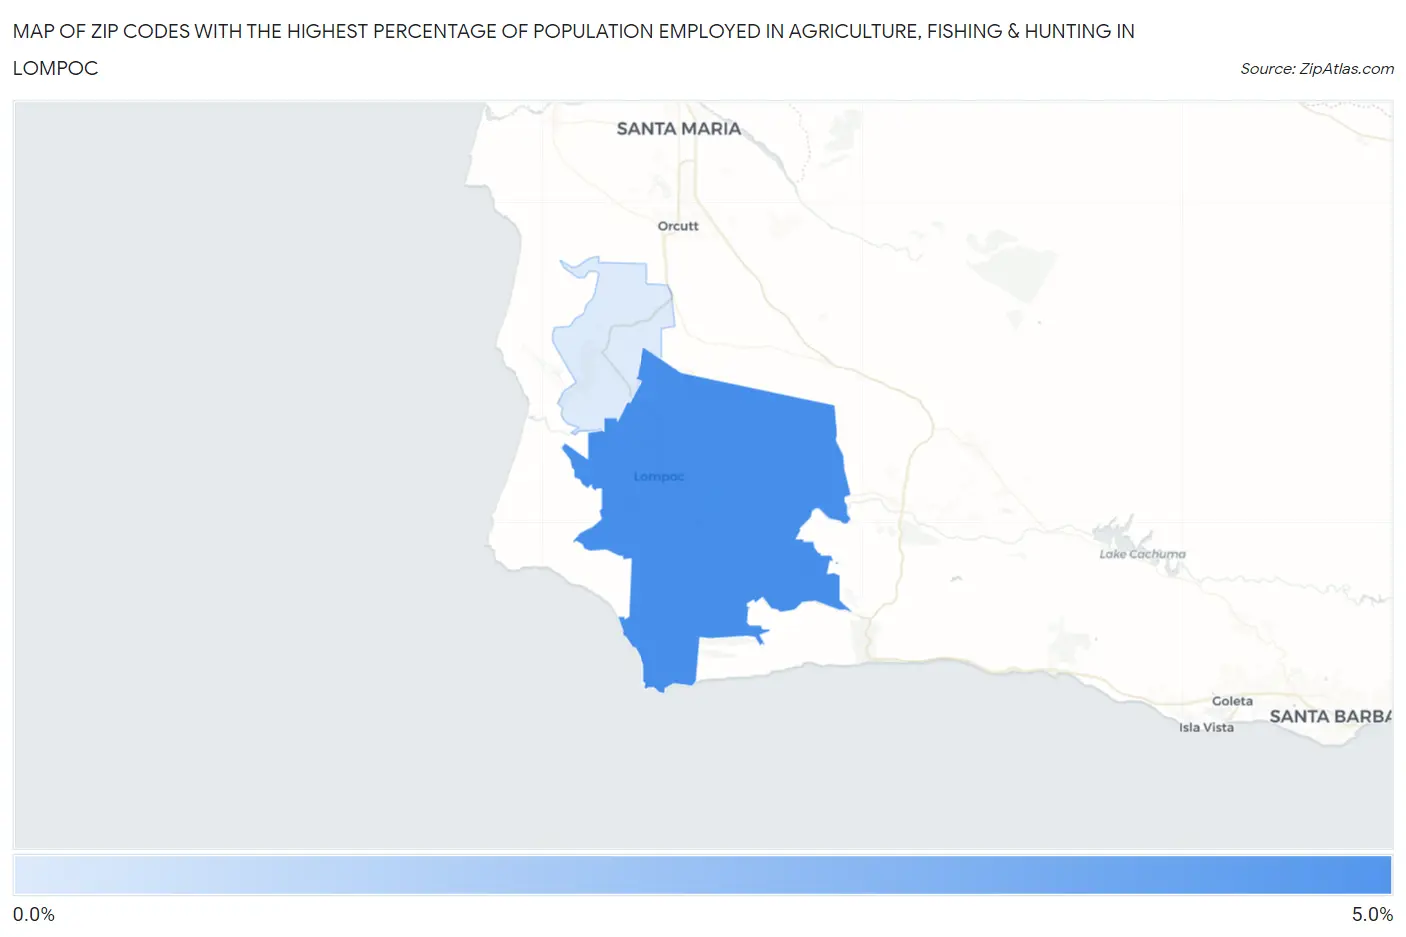
Map of Zip Codes with the Highest Percentage of Population Employed in Agriculture, Fishing & Hunting in Lompoc
0.90%
4.4%
Zip Codes with the Highest Percentage of Population Employed in Agriculture, Fishing & Hunting in Lompoc, CA
| Zip Code | % Employed | vs State | vs National | |
| 1. | 93436 | 4.4% | 2.0%(+2.42)#413 | 1.2%(+3.21)#8,502 |
| 2. | 93437 | 0.90% | 2.0%(-1.08)#751 | 1.2%(-0.294)#16,679 |
1
Common Questions
What are the Top Zip Codes with the Highest Percentage of Population Employed in Agriculture, Fishing & Hunting in Lompoc, CA?
Top Zip Codes with the Highest Percentage of Population Employed in Agriculture, Fishing & Hunting in Lompoc, CA are:
What zip code has the Highest Percentage of Population Employed in Agriculture, Fishing & Hunting in Lompoc, CA?
93436 has the Highest Percentage of Population Employed in Agriculture, Fishing & Hunting in Lompoc, CA with 4.4%.
What is the Percentage of Population Employed in Agriculture, Fishing & Hunting in Lompoc, CA?
Percentage of Population Employed in Agriculture, Fishing & Hunting in Lompoc is 5.1%.
What is the Percentage of Population Employed in Agriculture, Fishing & Hunting in California?
Percentage of Population Employed in Agriculture, Fishing & Hunting in California is 2.0%.
What is the Percentage of Population Employed in Agriculture, Fishing & Hunting in the United States?
Percentage of Population Employed in Agriculture, Fishing & Hunting in the United States is 1.2%.