Zip Codes with the Highest Percentage of Population Employed in Professional & Scientific Services in Gardena, CA
RELATED REPORTS & OPTIONS
Professional & Scientific Services
Gardena
Compare Zip Codes
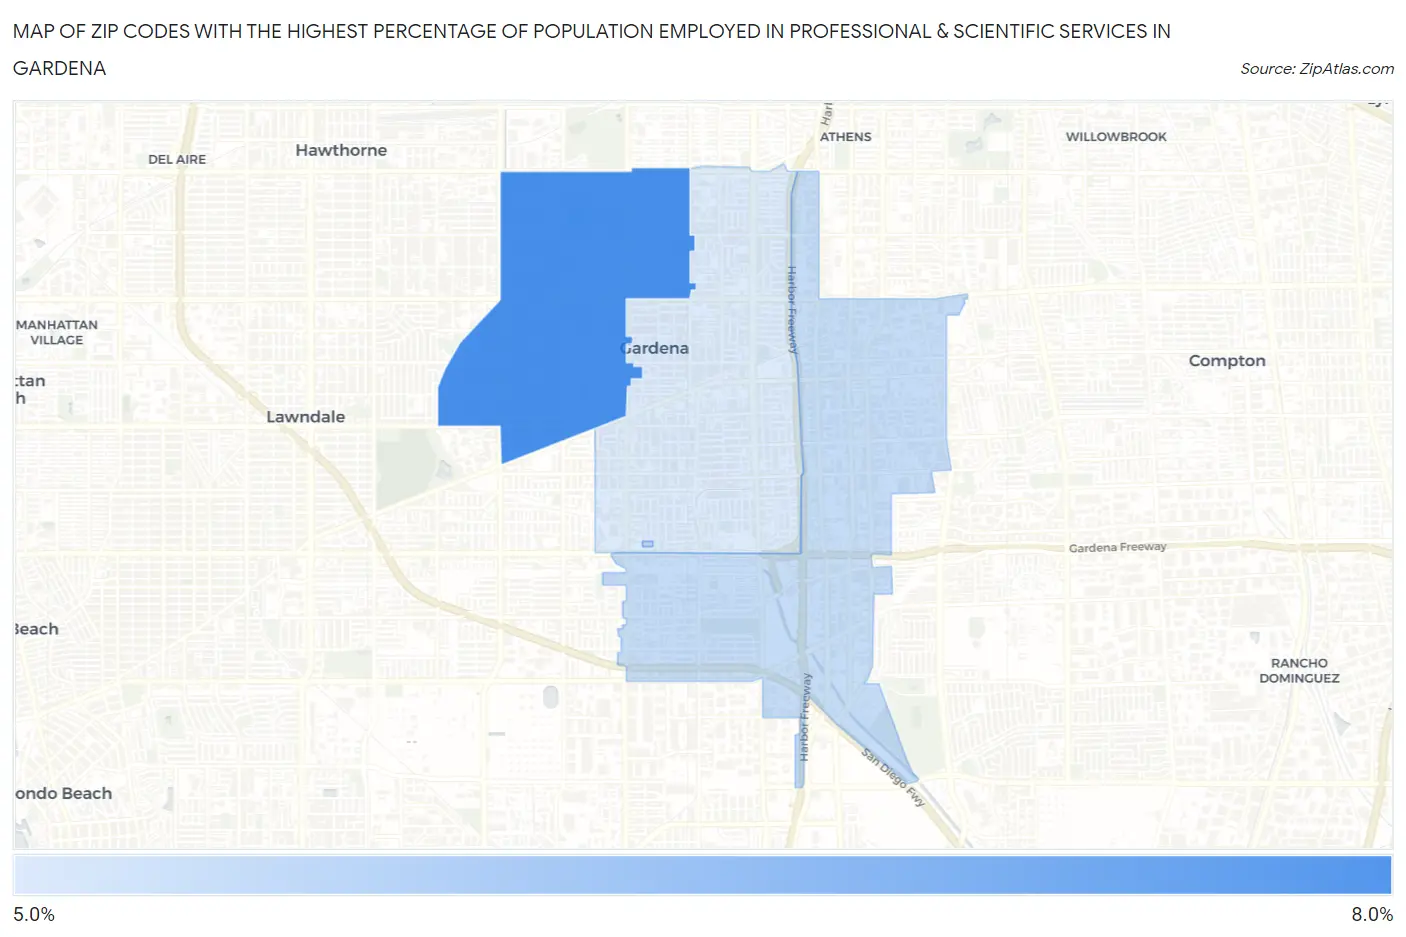
Map of Zip Codes with the Highest Percentage of Population Employed in Professional & Scientific Services in Gardena
5.4%
7.7%
Zip Codes with the Highest Percentage of Population Employed in Professional & Scientific Services in Gardena, CA
| Zip Code | % Employed | vs State | vs National | |
| 1. | 90249 | 7.7% | 9.4%(-1.77)#718 | 7.8%(-0.178)#7,102 |
| 2. | 90248 | 5.7% | 9.4%(-3.70)#919 | 7.8%(-2.11)#10,499 |
| 3. | 90247 | 5.4% | 9.4%(-4.05)#975 | 7.8%(-2.47)#11,363 |
1
Common Questions
What are the Top Zip Codes with the Highest Percentage of Population Employed in Professional & Scientific Services in Gardena, CA?
Top Zip Codes with the Highest Percentage of Population Employed in Professional & Scientific Services in Gardena, CA are:
What zip code has the Highest Percentage of Population Employed in Professional & Scientific Services in Gardena, CA?
90249 has the Highest Percentage of Population Employed in Professional & Scientific Services in Gardena, CA with 7.7%.
What is the Percentage of Population Employed in Professional & Scientific Services in Gardena, CA?
Percentage of Population Employed in Professional & Scientific Services in Gardena is 6.6%.
What is the Percentage of Population Employed in Professional & Scientific Services in California?
Percentage of Population Employed in Professional & Scientific Services in California is 9.4%.
What is the Percentage of Population Employed in Professional & Scientific Services in the United States?
Percentage of Population Employed in Professional & Scientific Services in the United States is 7.8%.