Gardena, CA Map & Demographics
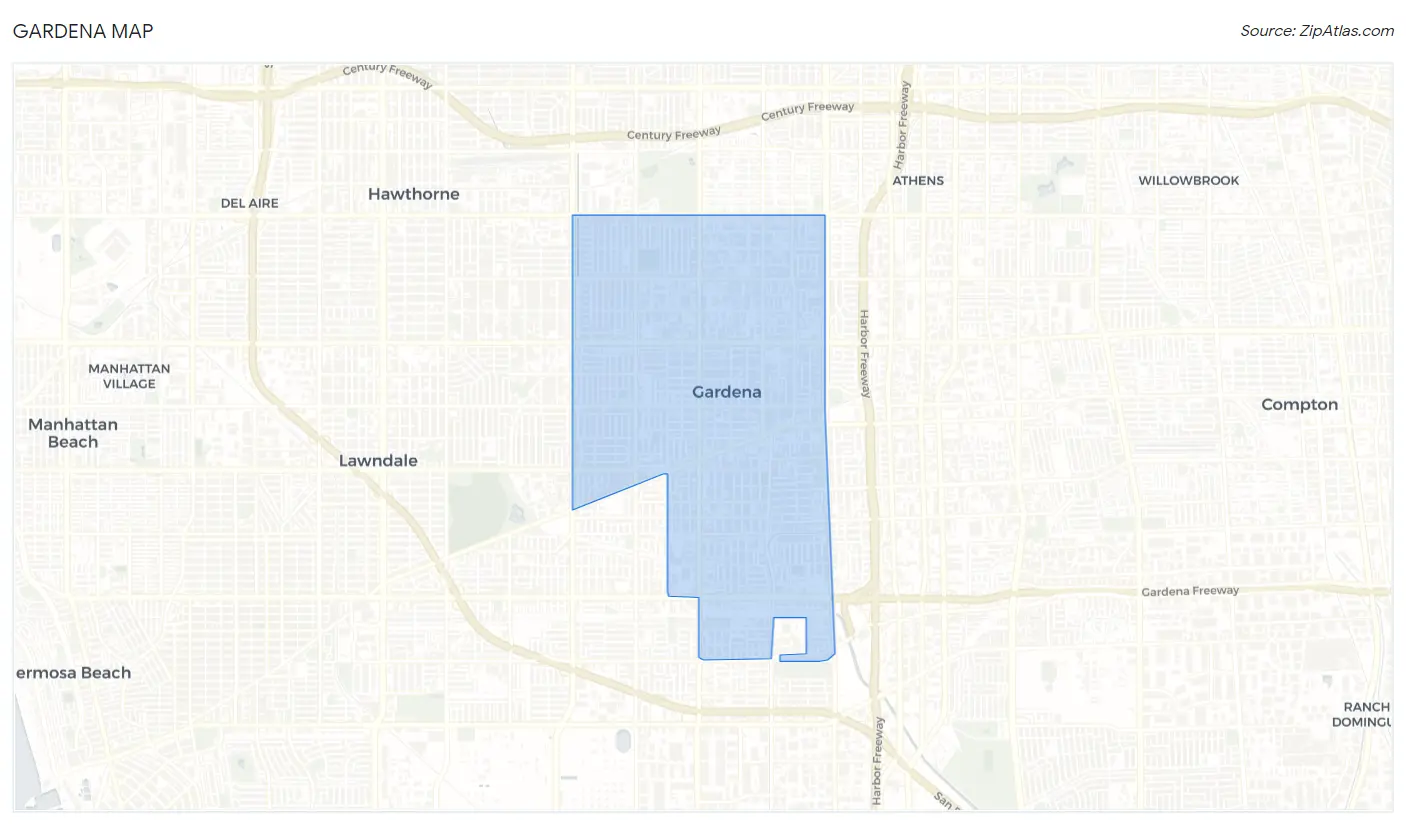
Gardena Map
Gardena Overview
$33,617
PER CAPITA INCOME
$90,313
AVG FAMILY INCOME
$75,443
AVG HOUSEHOLD INCOME
21.5%
WAGE / INCOME GAP [ % ]
78.5¢/ $1
WAGE / INCOME GAP [ $ ]
$11,214
FAMILY INCOME DEFICIT
0.43
INEQUALITY / GINI INDEX
60,377
TOTAL POPULATION
28,891
MALE POPULATION
31,486
FEMALE POPULATION
91.76
MALES / 100 FEMALES
108.98
FEMALES / 100 MALES
40.1
MEDIAN AGE
3.4
AVG FAMILY SIZE
2.9
AVG HOUSEHOLD SIZE
32,079
LABOR FORCE [ PEOPLE ]
65.0%
PERCENT IN LABOR FORCE
4.3%
UNEMPLOYMENT RATE
Income in Gardena
Income Overview in Gardena
Per Capita Income in Gardena is $33,617, while median incomes of families and households are $90,313 and $75,443 respectively.
| Characteristic | Number | Measure |
| Per Capita Income | 60,377 | $33,617 |
| Median Family Income | 14,321 | $90,313 |
| Mean Family Income | 14,321 | $107,852 |
| Median Household Income | 20,758 | $75,443 |
| Mean Household Income | 20,758 | $94,651 |
| Income Deficit | 14,321 | $11,214 |
| Wage / Income Gap (%) | 60,377 | 21.52% |
| Wage / Income Gap ($) | 60,377 | 78.48¢ per $1 |
| Gini / Inequality Index | 60,377 | 0.43 |
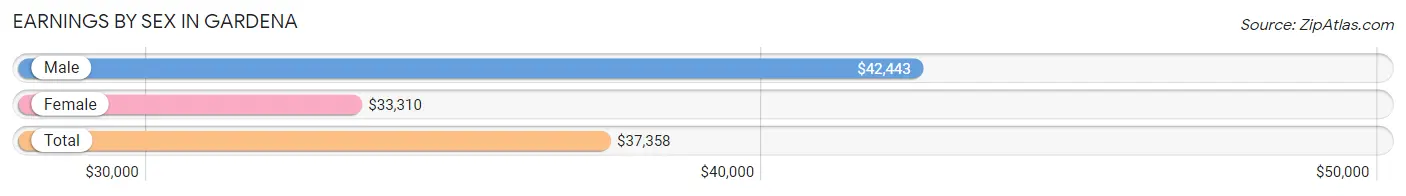
Earnings by Sex in Gardena
Average Earnings in Gardena are $37,358, $42,443 for men and $33,310 for women, a difference of 21.5%.
| Sex | Number | Average Earnings |
| Male | 16,918 (51.6%) | $42,443 |
| Female | 15,890 (48.4%) | $33,310 |
| Total | 32,808 (100.0%) | $37,358 |
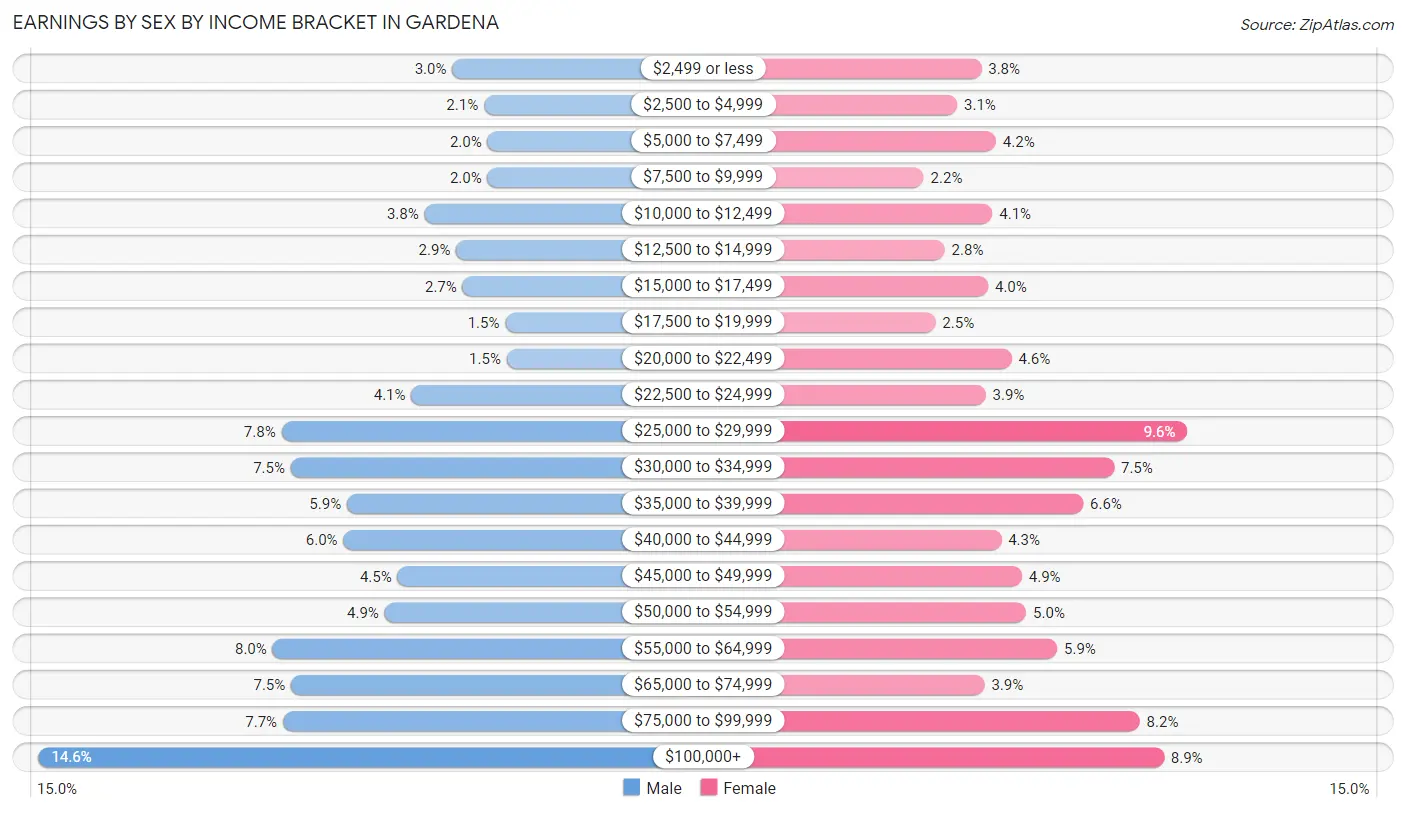
Earnings by Sex by Income Bracket in Gardena
The most common earnings brackets in Gardena are $100,000+ for men (2,471 | 14.6%) and $25,000 to $29,999 for women (1,520 | 9.6%).
| Income | Male | Female |
| $2,499 or less | 504 (3.0%) | 601 (3.8%) |
| $2,500 to $4,999 | 354 (2.1%) | 493 (3.1%) |
| $5,000 to $7,499 | 337 (2.0%) | 665 (4.2%) |
| $7,500 to $9,999 | 336 (2.0%) | 343 (2.2%) |
| $10,000 to $12,499 | 636 (3.8%) | 650 (4.1%) |
| $12,500 to $14,999 | 486 (2.9%) | 437 (2.8%) |
| $15,000 to $17,499 | 455 (2.7%) | 631 (4.0%) |
| $17,500 to $19,999 | 252 (1.5%) | 396 (2.5%) |
| $20,000 to $22,499 | 245 (1.5%) | 736 (4.6%) |
| $22,500 to $24,999 | 698 (4.1%) | 619 (3.9%) |
| $25,000 to $29,999 | 1,317 (7.8%) | 1,520 (9.6%) |
| $30,000 to $34,999 | 1,273 (7.5%) | 1,194 (7.5%) |
| $35,000 to $39,999 | 1,005 (5.9%) | 1,055 (6.6%) |
| $40,000 to $44,999 | 1,022 (6.0%) | 689 (4.3%) |
| $45,000 to $49,999 | 765 (4.5%) | 782 (4.9%) |
| $50,000 to $54,999 | 825 (4.9%) | 801 (5.0%) |
| $55,000 to $64,999 | 1,358 (8.0%) | 939 (5.9%) |
| $65,000 to $74,999 | 1,270 (7.5%) | 615 (3.9%) |
| $75,000 to $99,999 | 1,309 (7.7%) | 1,308 (8.2%) |
| $100,000+ | 2,471 (14.6%) | 1,416 (8.9%) |
| Total | 16,918 (100.0%) | 15,890 (100.0%) |
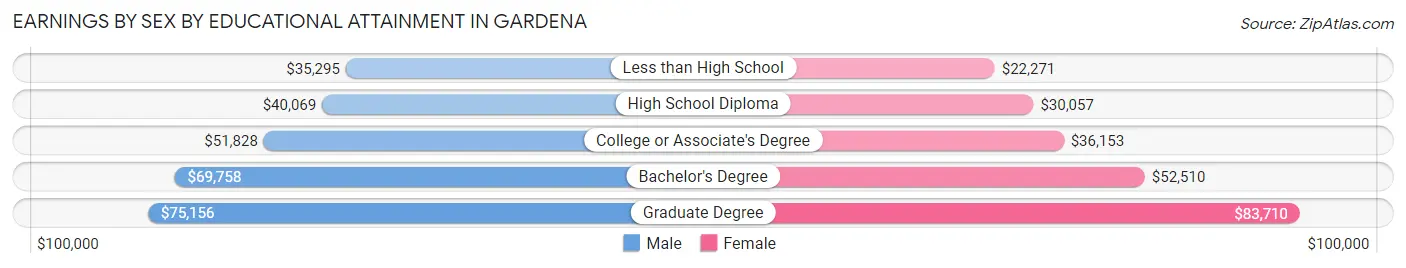
Earnings by Sex by Educational Attainment in Gardena
Average earnings in Gardena are $46,797 for men and $36,709 for women, a difference of 21.6%. Men with an educational attainment of graduate degree enjoy the highest average annual earnings of $75,156, while those with less than high school education earn the least with $35,295. Women with an educational attainment of graduate degree earn the most with the average annual earnings of $83,710, while those with less than high school education have the smallest earnings of $22,271.
| Educational Attainment | Male Income | Female Income |
| Less than High School | $35,295 | $22,271 |
| High School Diploma | $40,069 | $30,057 |
| College or Associate's Degree | $51,828 | $36,153 |
| Bachelor's Degree | $69,758 | $52,510 |
| Graduate Degree | $75,156 | $83,710 |
| Total | $46,797 | $36,709 |
Family Income in Gardena
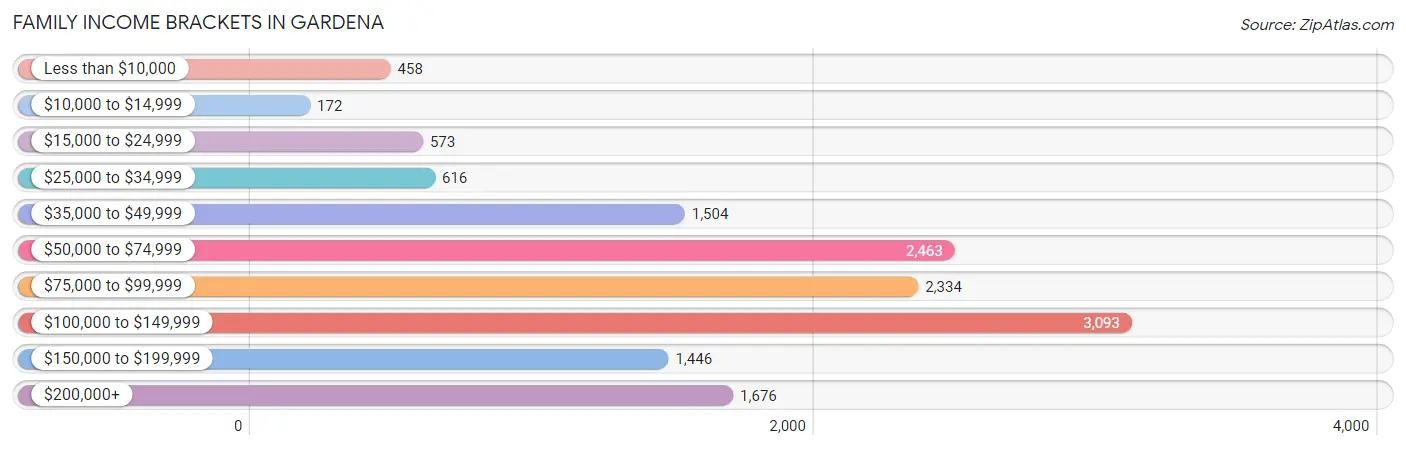
Family Income Brackets in Gardena
According to the Gardena family income data, there are 3,093 families falling into the $100,000 to $149,999 income range, which is the most common income bracket and makes up 21.6% of all families. Conversely, the $10,000 to $14,999 income bracket is the least frequent group with only 172 families (1.2%) belonging to this category.
| Income Bracket | # Families | % Families |
| Less than $10,000 | 458 | 3.2% |
| $10,000 to $14,999 | 172 | 1.2% |
| $15,000 to $24,999 | 573 | 4.0% |
| $25,000 to $34,999 | 616 | 4.3% |
| $35,000 to $49,999 | 1,504 | 10.5% |
| $50,000 to $74,999 | 2,463 | 17.2% |
| $75,000 to $99,999 | 2,334 | 16.3% |
| $100,000 to $149,999 | 3,093 | 21.6% |
| $150,000 to $199,999 | 1,446 | 10.1% |
| $200,000+ | 1,676 | 11.7% |
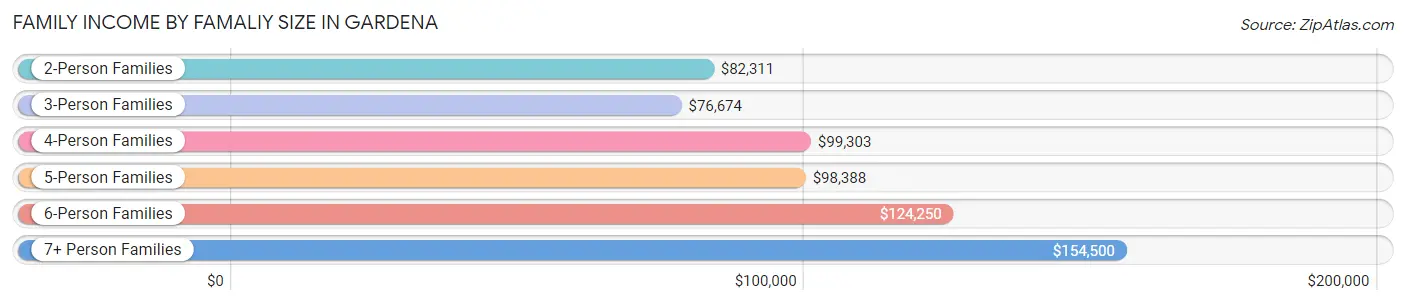
Family Income by Famaliy Size in Gardena
7+ person families (422 | 2.9%) account for the highest median family income in Gardena with $154,500 per family, while 2-person families (5,384 | 37.6%) have the highest median income of $41,156 per family member.
| Income Bracket | # Families | Median Income |
| 2-Person Families | 5,384 (37.6%) | $82,311 |
| 3-Person Families | 3,926 (27.4%) | $76,674 |
| 4-Person Families | 2,583 (18.0%) | $99,303 |
| 5-Person Families | 1,491 (10.4%) | $98,388 |
| 6-Person Families | 515 (3.6%) | $124,250 |
| 7+ Person Families | 422 (2.9%) | $154,500 |
| Total | 14,321 (100.0%) | $90,313 |
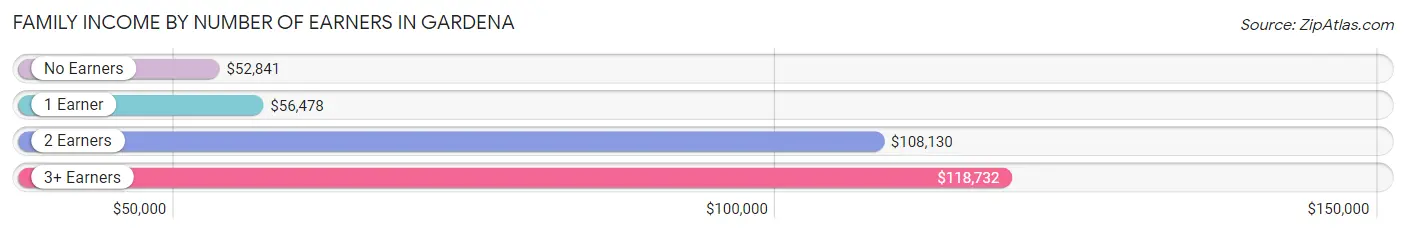
Family Income by Number of Earners in Gardena
The median family income in Gardena is $90,313, with families comprising 3+ earners (2,638) having the highest median family income of $118,732, while families with no earners (1,357) have the lowest median family income of $52,841, accounting for 18.4% and 9.5% of families, respectively.
| Number of Earners | # Families | Median Income |
| No Earners | 1,357 (9.5%) | $52,841 |
| 1 Earner | 4,506 (31.5%) | $56,478 |
| 2 Earners | 5,820 (40.6%) | $108,130 |
| 3+ Earners | 2,638 (18.4%) | $118,732 |
| Total | 14,321 (100.0%) | $90,313 |
Household Income in Gardena
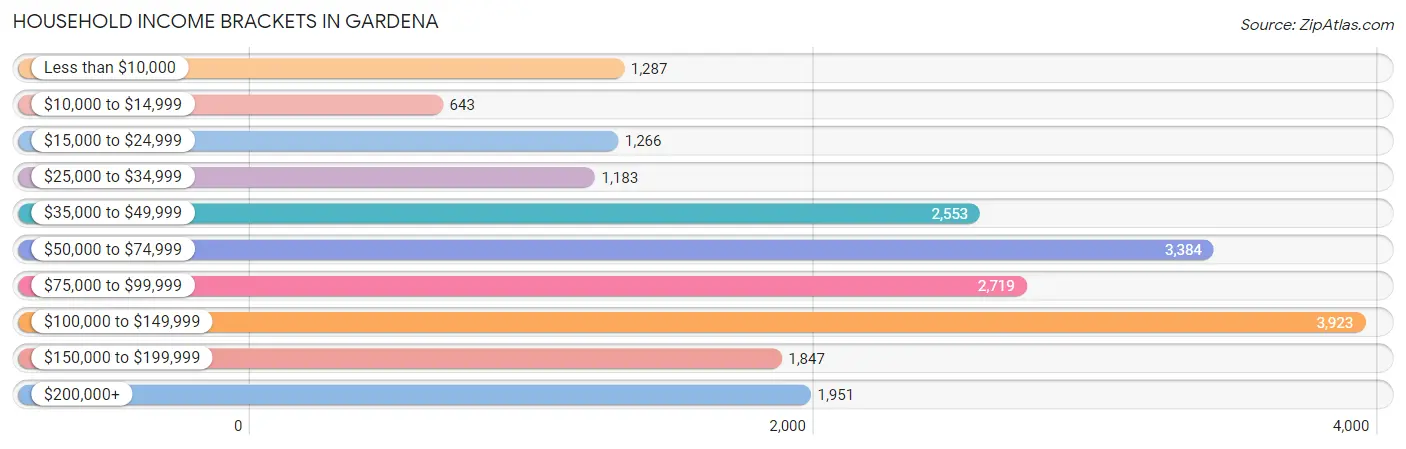
Household Income Brackets in Gardena
With 3,923 households falling in the category, the $100,000 to $149,999 income range is the most frequent in Gardena, accounting for 18.9% of all households. In contrast, only 643 households (3.1%) fall into the $10,000 to $14,999 income bracket, making it the least populous group.
| Income Bracket | # Households | % Households |
| Less than $10,000 | 1,287 | 6.2% |
| $10,000 to $14,999 | 643 | 3.1% |
| $15,000 to $24,999 | 1,266 | 6.1% |
| $25,000 to $34,999 | 1,183 | 5.7% |
| $35,000 to $49,999 | 2,553 | 12.3% |
| $50,000 to $74,999 | 3,384 | 16.3% |
| $75,000 to $99,999 | 2,719 | 13.1% |
| $100,000 to $149,999 | 3,923 | 18.9% |
| $150,000 to $199,999 | 1,847 | 8.9% |
| $200,000+ | 1,951 | 9.4% |
Household Income by Householder Age in Gardena
The median household income in Gardena is $75,443, with the highest median household income of $88,081 found in the 45 to 64 years age bracket for the primary householder. A total of 8,557 households (41.2%) fall into this category. Meanwhile, the 65+ years age bracket for the primary householder has the lowest median household income of $54,340, with 5,711 households (27.5%) in this group.
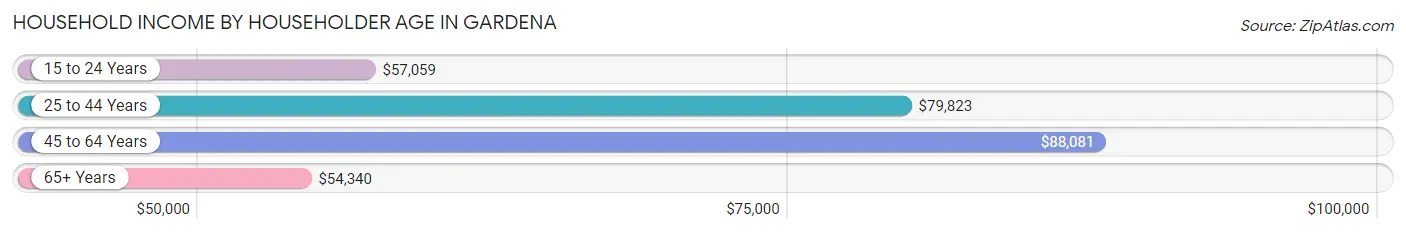
| Income Bracket | # Households | Median Income |
| 15 to 24 Years | 316 (1.5%) | $57,059 |
| 25 to 44 Years | 6,174 (29.7%) | $79,823 |
| 45 to 64 Years | 8,557 (41.2%) | $88,081 |
| 65+ Years | 5,711 (27.5%) | $54,340 |
| Total | 20,758 (100.0%) | $75,443 |
Poverty in Gardena
Income Below Poverty by Sex and Age in Gardena
With 11.7% poverty level for males and 10.5% for females among the residents of Gardena, 5 year old males and 15 year old females are the most vulnerable to poverty, with 91 males (29.7%) and 83 females (21.0%) in their respective age groups living below the poverty level.
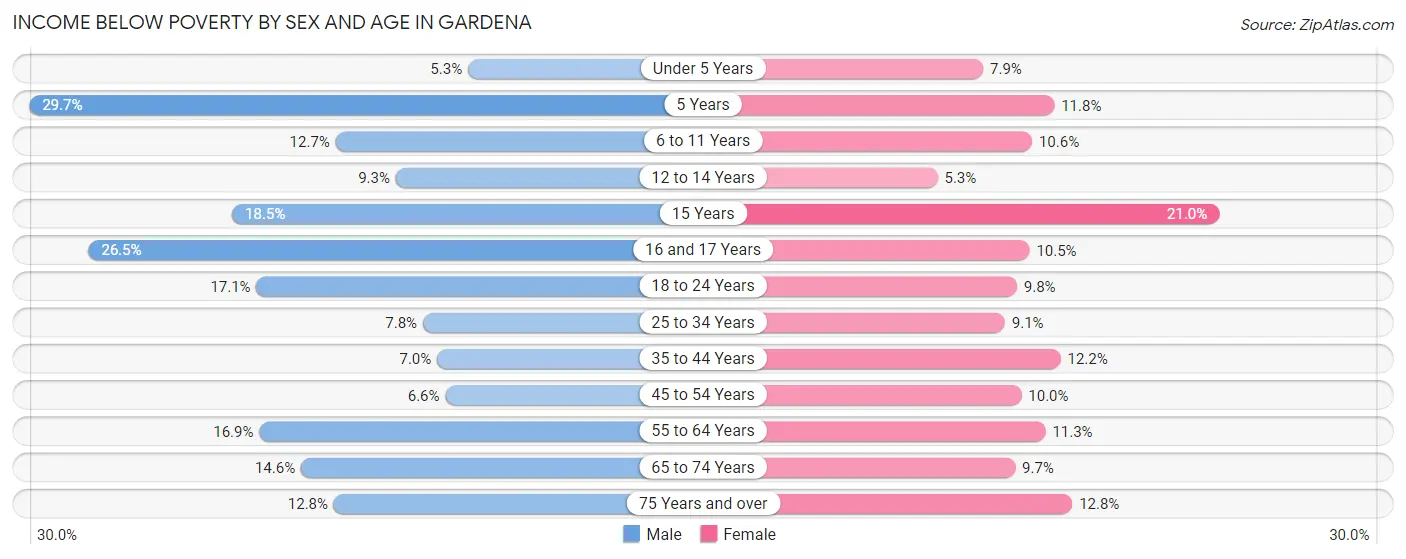
| Age Bracket | Male | Female |
| Under 5 Years | 57 (5.3%) | 124 (7.9%) |
| 5 Years | 91 (29.7%) | 33 (11.8%) |
| 6 to 11 Years | 300 (12.7%) | 262 (10.6%) |
| 12 to 14 Years | 91 (9.3%) | 41 (5.3%) |
| 15 Years | 95 (18.4%) | 83 (21.0%) |
| 16 and 17 Years | 128 (26.5%) | 56 (10.4%) |
| 18 to 24 Years | 413 (17.1%) | 246 (9.8%) |
| 25 to 34 Years | 354 (7.8%) | 432 (9.1%) |
| 35 to 44 Years | 246 (7.0%) | 500 (12.2%) |
| 45 to 54 Years | 250 (6.6%) | 452 (10.0%) |
| 55 to 64 Years | 707 (16.9%) | 440 (11.3%) |
| 65 to 74 Years | 388 (14.6%) | 272 (9.7%) |
| 75 Years and over | 209 (12.8%) | 304 (12.8%) |
| Total | 3,329 (11.7%) | 3,245 (10.5%) |
Income Above Poverty by Sex and Age in Gardena
According to the poverty statistics in Gardena, males aged under 5 years and females aged 12 to 14 years are the age groups that are most secure financially, with 94.7% of males and 94.7% of females in these age groups living above the poverty line.
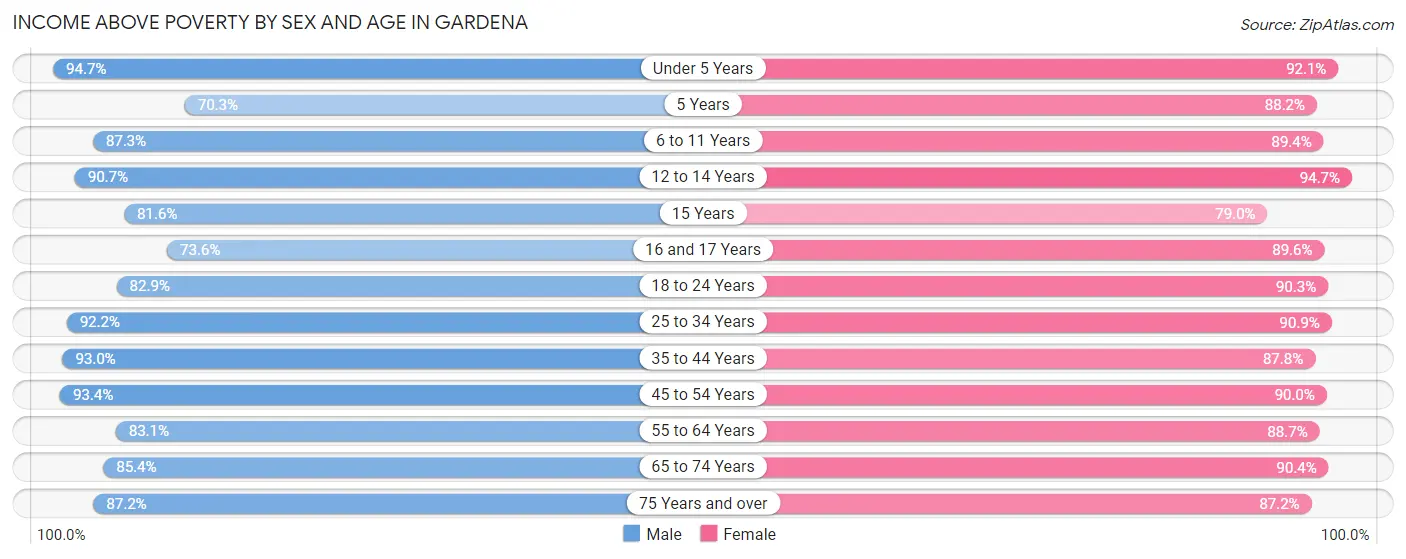
| Age Bracket | Male | Female |
| Under 5 Years | 1,016 (94.7%) | 1,452 (92.1%) |
| 5 Years | 215 (70.3%) | 246 (88.2%) |
| 6 to 11 Years | 2,065 (87.3%) | 2,211 (89.4%) |
| 12 to 14 Years | 884 (90.7%) | 728 (94.7%) |
| 15 Years | 420 (81.6%) | 312 (79.0%) |
| 16 and 17 Years | 356 (73.6%) | 480 (89.5%) |
| 18 to 24 Years | 2,003 (82.9%) | 2,277 (90.2%) |
| 25 to 34 Years | 4,174 (92.2%) | 4,324 (90.9%) |
| 35 to 44 Years | 3,252 (93.0%) | 3,606 (87.8%) |
| 45 to 54 Years | 3,554 (93.4%) | 4,070 (90.0%) |
| 55 to 64 Years | 3,470 (83.1%) | 3,440 (88.7%) |
| 65 to 74 Years | 2,268 (85.4%) | 2,546 (90.3%) |
| 75 Years and over | 1,427 (87.2%) | 2,066 (87.2%) |
| Total | 25,104 (88.3%) | 27,758 (89.5%) |
Income Below Poverty Among Married-Couple Families in Gardena
The poverty statistics for married-couple families in Gardena show that 6.4% or 586 of the total 9,201 families live below the poverty line. Families with 3 or 4 children have the highest poverty rate of 19.8%, comprising of 96 families. On the other hand, families with 1 or 2 children have the lowest poverty rate of 5.4%, which includes 184 families.
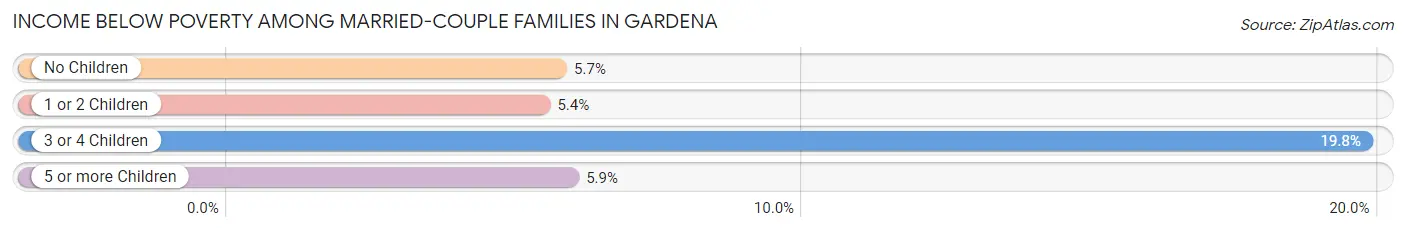
| Children | Above Poverty | Below Poverty |
| No Children | 4,934 (94.3%) | 300 (5.7%) |
| 1 or 2 Children | 3,196 (94.6%) | 184 (5.4%) |
| 3 or 4 Children | 390 (80.2%) | 96 (19.8%) |
| 5 or more Children | 95 (94.1%) | 6 (5.9%) |
| Total | 8,615 (93.6%) | 586 (6.4%) |
Income Below Poverty Among Single-Parent Households in Gardena
According to the poverty data in Gardena, 11.1% or 171 single-father households and 9.7% or 349 single-mother households are living below the poverty line. Among single-father households, those with 1 or 2 children have the highest poverty rate, with 106 households (17.7%) experiencing poverty. Likewise, among single-mother households, those with 3 or 4 children have the highest poverty rate, with 34 households (24.6%) falling below the poverty line.
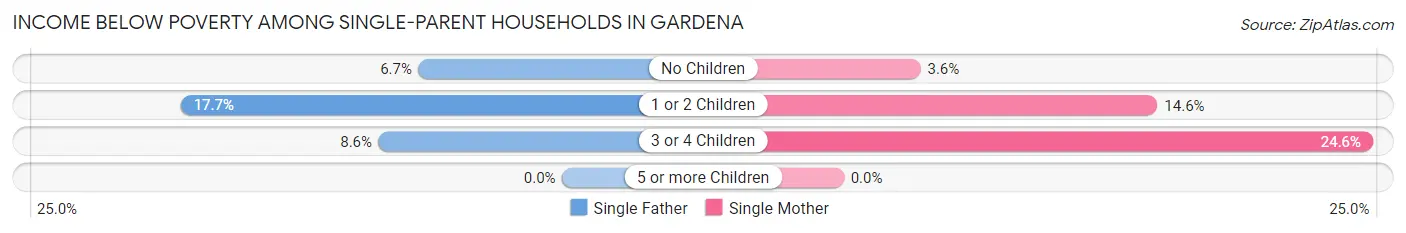
| Children | Single Father | Single Mother |
| No Children | 55 (6.7%) | 61 (3.6%) |
| 1 or 2 Children | 106 (17.7%) | 254 (14.6%) |
| 3 or 4 Children | 10 (8.6%) | 34 (24.6%) |
| 5 or more Children | 0 (0.0%) | 0 (0.0%) |
| Total | 171 (11.1%) | 349 (9.7%) |
Income Below Poverty Among Married-Couple vs Single-Parent Households in Gardena
The poverty data for Gardena shows that 586 of the married-couple family households (6.4%) and 520 of the single-parent households (10.2%) are living below the poverty level. Within the married-couple family households, those with 3 or 4 children have the highest poverty rate, with 96 households (19.8%) falling below the poverty line. Among the single-parent households, those with 3 or 4 children have the highest poverty rate, with 44 household (17.2%) living below poverty.
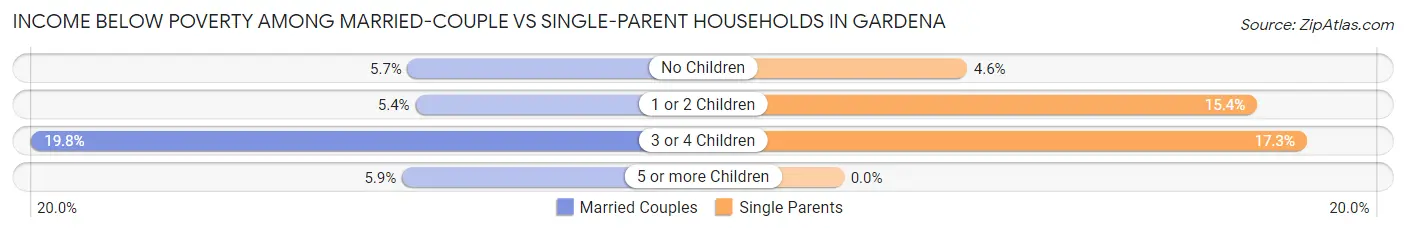
| Children | Married-Couple Families | Single-Parent Households |
| No Children | 300 (5.7%) | 116 (4.6%) |
| 1 or 2 Children | 184 (5.4%) | 360 (15.4%) |
| 3 or 4 Children | 96 (19.8%) | 44 (17.2%) |
| 5 or more Children | 6 (5.9%) | 0 (0.0%) |
| Total | 586 (6.4%) | 520 (10.2%) |
Race in Gardena
The most populous races in Gardena are Hispanic or Latino (25,802 | 42.7%), Asian (14,829 | 24.6%), and Some other Race (13,108 | 21.7%).
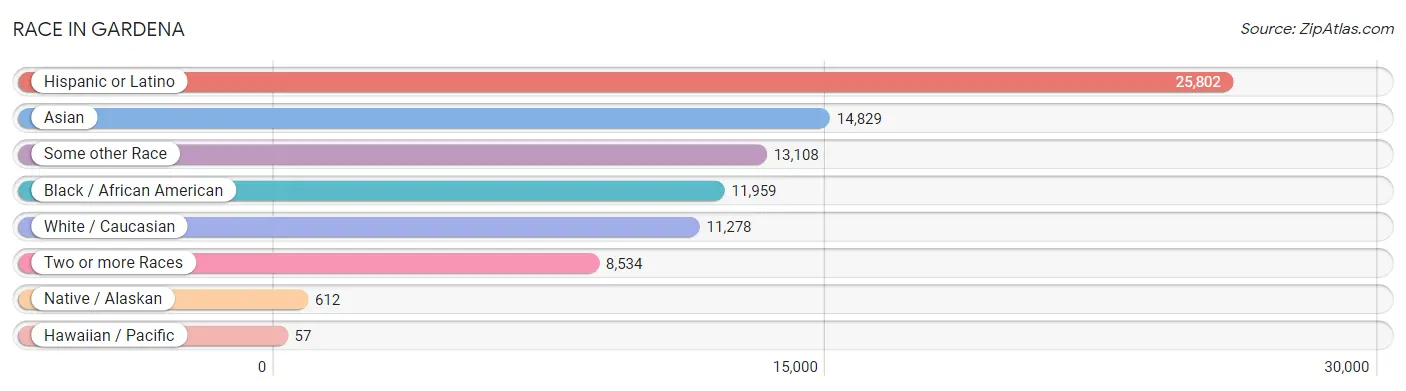
| Race | # Population | % Population |
| Asian | 14,829 | 24.6% |
| Black / African American | 11,959 | 19.8% |
| Hawaiian / Pacific | 57 | 0.1% |
| Hispanic or Latino | 25,802 | 42.7% |
| Native / Alaskan | 612 | 1.0% |
| White / Caucasian | 11,278 | 18.7% |
| Two or more Races | 8,534 | 14.1% |
| Some other Race | 13,108 | 21.7% |
| Total | 60,377 | 100.0% |
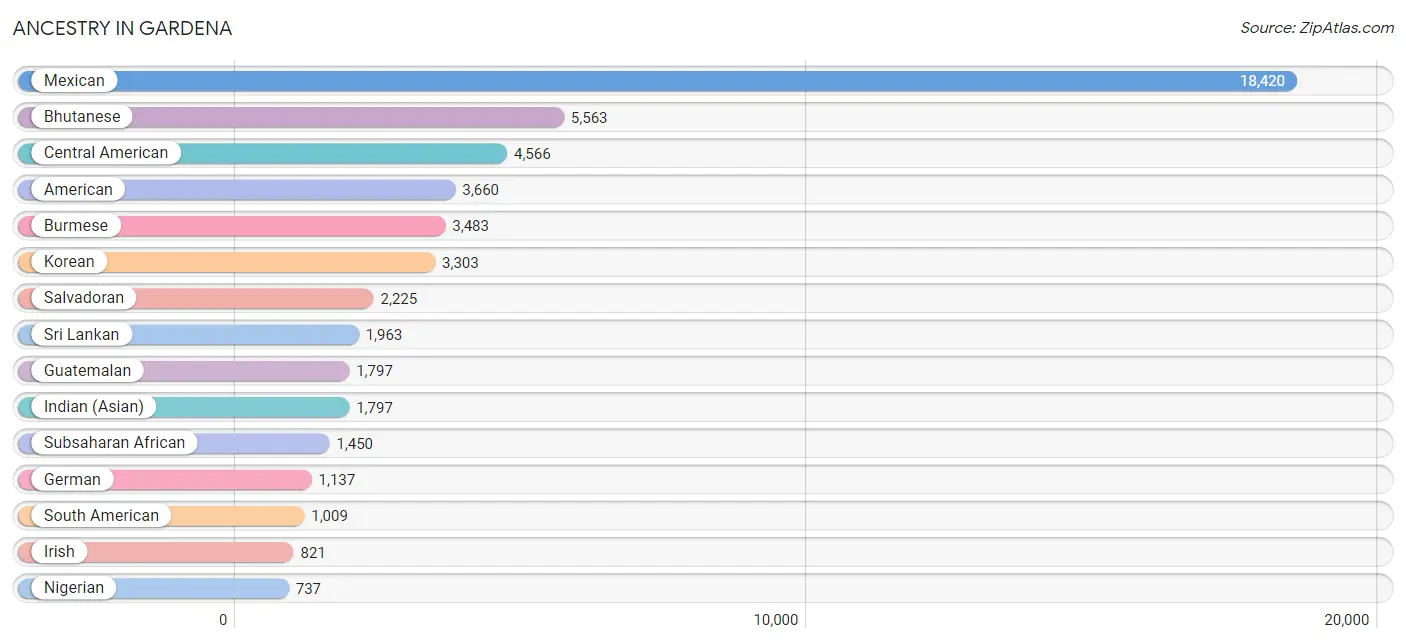
Ancestry in Gardena
The most populous ancestries reported in Gardena are Mexican (18,420 | 30.5%), Bhutanese (5,563 | 9.2%), Central American (4,566 | 7.6%), American (3,660 | 6.1%), and Burmese (3,483 | 5.8%), together accounting for 59.1% of all Gardena residents.
| Ancestry | # Population | % Population |
| Afghan | 8 | 0.0% |
| African | 486 | 0.8% |
| American | 3,660 | 6.1% |
| Apache | 249 | 0.4% |
| Arab | 181 | 0.3% |
| Argentinean | 78 | 0.1% |
| Armenian | 35 | 0.1% |
| Australian | 50 | 0.1% |
| Austrian | 73 | 0.1% |
| Belgian | 16 | 0.0% |
| Belizean | 584 | 1.0% |
| Bhutanese | 5,563 | 9.2% |
| Blackfeet | 4 | 0.0% |
| Bolivian | 6 | 0.0% |
| Brazilian | 248 | 0.4% |
| British | 59 | 0.1% |
| Burmese | 3,483 | 5.8% |
| Cambodian | 52 | 0.1% |
| Cape Verdean | 10 | 0.0% |
| Central American | 4,566 | 7.6% |
| Central American Indian | 192 | 0.3% |
| Cherokee | 49 | 0.1% |
| Chilean | 19 | 0.0% |
| Chinese | 10 | 0.0% |
| Chippewa | 5 | 0.0% |
| Choctaw | 14 | 0.0% |
| Colombian | 142 | 0.2% |
| Costa Rican | 16 | 0.0% |
| Cuban | 194 | 0.3% |
| Czech | 36 | 0.1% |
| Czechoslovakian | 4 | 0.0% |
| Danish | 34 | 0.1% |
| Delaware | 5 | 0.0% |
| Dominican | 20 | 0.0% |
| Dutch | 67 | 0.1% |
| Eastern European | 16 | 0.0% |
| Ecuadorian | 221 | 0.4% |
| Egyptian | 54 | 0.1% |
| English | 650 | 1.1% |
| Ethiopian | 8 | 0.0% |
| European | 199 | 0.3% |
| Filipino | 117 | 0.2% |
| French | 392 | 0.6% |
| French Canadian | 108 | 0.2% |
| German | 1,137 | 1.9% |
| Ghanaian | 130 | 0.2% |
| Greek | 12 | 0.0% |
| Guamanian / Chamorro | 27 | 0.0% |
| Guatemalan | 1,797 | 3.0% |
| Haitian | 326 | 0.5% |
| Honduran | 207 | 0.3% |
| Hopi | 7 | 0.0% |
| Hungarian | 11 | 0.0% |
| Icelander | 16 | 0.0% |
| Indian (Asian) | 1,797 | 3.0% |
| Iranian | 12 | 0.0% |
| Irish | 821 | 1.4% |
| Italian | 671 | 1.1% |
| Jamaican | 31 | 0.1% |
| Japanese | 484 | 0.8% |
| Jordanian | 87 | 0.1% |
| Korean | 3,303 | 5.5% |
| Lebanese | 19 | 0.0% |
| Lithuanian | 7 | 0.0% |
| Malaysian | 68 | 0.1% |
| Mexican | 18,420 | 30.5% |
| Mexican American Indian | 681 | 1.1% |
| Native Hawaiian | 468 | 0.8% |
| Navajo | 46 | 0.1% |
| Nicaraguan | 191 | 0.3% |
| Nigerian | 737 | 1.2% |
| Norwegian | 134 | 0.2% |
| Pakistani | 248 | 0.4% |
| Panamanian | 130 | 0.2% |
| Peruvian | 479 | 0.8% |
| Polish | 161 | 0.3% |
| Portuguese | 113 | 0.2% |
| Puerto Rican | 430 | 0.7% |
| Romanian | 36 | 0.1% |
| Russian | 47 | 0.1% |
| Salvadoran | 2,225 | 3.7% |
| Samoan | 102 | 0.2% |
| Scandinavian | 24 | 0.0% |
| Scotch-Irish | 6 | 0.0% |
| Scottish | 134 | 0.2% |
| Serbian | 9 | 0.0% |
| Slovak | 5 | 0.0% |
| Slovene | 29 | 0.1% |
| South American | 1,009 | 1.7% |
| South American Indian | 68 | 0.1% |
| Spaniard | 241 | 0.4% |
| Spanish | 157 | 0.3% |
| Spanish American | 6 | 0.0% |
| Spanish American Indian | 13 | 0.0% |
| Sri Lankan | 1,963 | 3.3% |
| Subsaharan African | 1,450 | 2.4% |
| Swedish | 43 | 0.1% |
| Swiss | 22 | 0.0% |
| Thai | 216 | 0.4% |
| Tohono O'Odham | 28 | 0.1% |
| Tongan | 31 | 0.1% |
| Trinidadian and Tobagonian | 14 | 0.0% |
| Ukrainian | 33 | 0.1% |
| Uruguayan | 4 | 0.0% |
| Venezuelan | 29 | 0.1% |
| Vietnamese | 1 | 0.0% |
| Welsh | 21 | 0.0% |
| West Indian | 10 | 0.0% | View All 108 Rows |
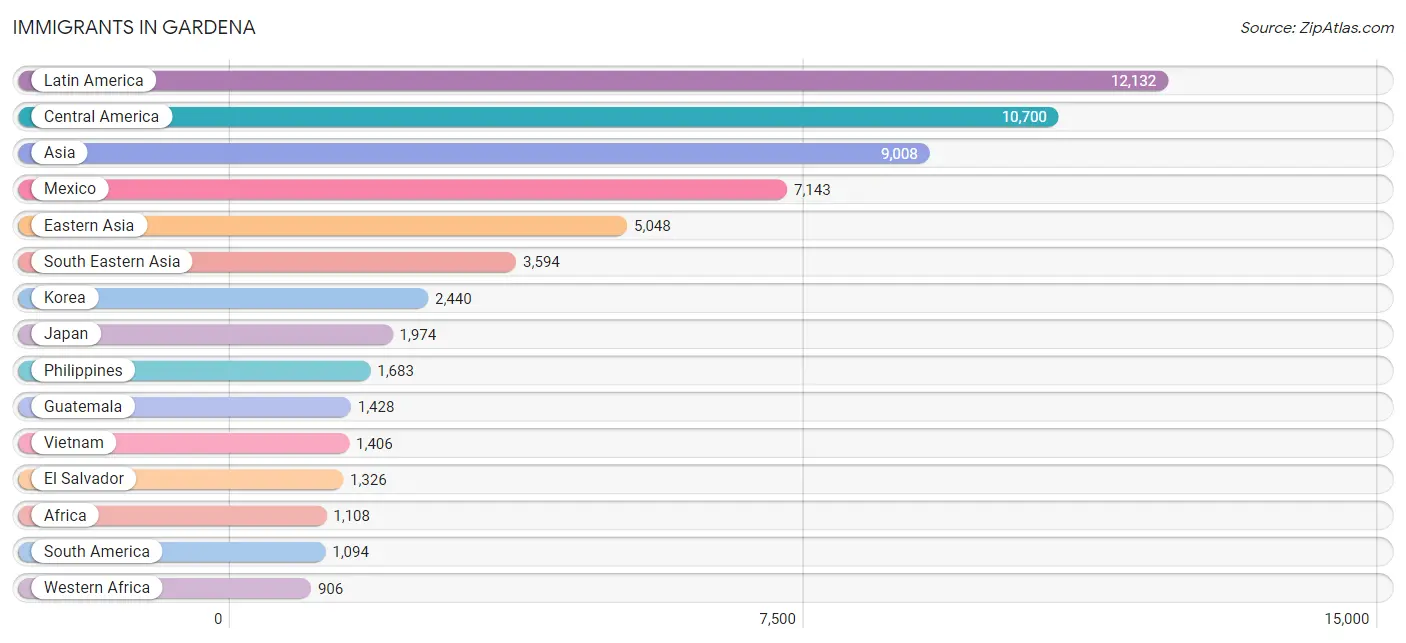
Immigrants in Gardena
The most numerous immigrant groups reported in Gardena came from Latin America (12,132 | 20.1%), Central America (10,700 | 17.7%), Asia (9,008 | 14.9%), Mexico (7,143 | 11.8%), and Eastern Asia (5,048 | 8.4%), together accounting for 72.9% of all Gardena residents.
| Immigration Origin | # Population | % Population |
| Africa | 1,108 | 1.8% |
| Argentina | 52 | 0.1% |
| Armenia | 9 | 0.0% |
| Asia | 9,008 | 14.9% |
| Australia | 50 | 0.1% |
| Bangladesh | 1 | 0.0% |
| Belize | 393 | 0.6% |
| Brazil | 359 | 0.6% |
| Cambodia | 229 | 0.4% |
| Cameroon | 12 | 0.0% |
| Canada | 127 | 0.2% |
| Caribbean | 338 | 0.6% |
| Central America | 10,700 | 17.7% |
| Chile | 14 | 0.0% |
| China | 627 | 1.0% |
| Colombia | 78 | 0.1% |
| Cuba | 162 | 0.3% |
| Czechoslovakia | 5 | 0.0% |
| Eastern Africa | 63 | 0.1% |
| Eastern Asia | 5,048 | 8.4% |
| Eastern Europe | 78 | 0.1% |
| Ecuador | 138 | 0.2% |
| Egypt | 54 | 0.1% |
| El Salvador | 1,326 | 2.2% |
| England | 139 | 0.2% |
| Ethiopia | 8 | 0.0% |
| Europe | 556 | 0.9% |
| Fiji | 17 | 0.0% |
| France | 1 | 0.0% |
| Germany | 72 | 0.1% |
| Ghana | 91 | 0.2% |
| Guatemala | 1,428 | 2.4% |
| Haiti | 70 | 0.1% |
| Honduras | 206 | 0.3% |
| Hong Kong | 27 | 0.0% |
| India | 121 | 0.2% |
| Indonesia | 33 | 0.1% |
| Iran | 6 | 0.0% |
| Israel | 3 | 0.0% |
| Italy | 59 | 0.1% |
| Jamaica | 92 | 0.2% |
| Japan | 1,974 | 3.3% |
| Jordan | 99 | 0.2% |
| Kenya | 55 | 0.1% |
| Korea | 2,440 | 4.0% |
| Laos | 41 | 0.1% |
| Latin America | 12,132 | 20.1% |
| Lebanon | 17 | 0.0% |
| Mexico | 7,143 | 11.8% |
| Middle Africa | 12 | 0.0% |
| Moldova | 6 | 0.0% |
| Nepal | 30 | 0.1% |
| Nicaragua | 136 | 0.2% |
| Nigeria | 815 | 1.3% |
| Northern Africa | 54 | 0.1% |
| Northern Europe | 302 | 0.5% |
| Oceania | 93 | 0.2% |
| Pakistan | 27 | 0.0% |
| Panama | 68 | 0.1% |
| Peru | 401 | 0.7% |
| Philippines | 1,683 | 2.8% |
| Poland | 11 | 0.0% |
| Portugal | 23 | 0.0% |
| Saudi Arabia | 3 | 0.0% |
| Scotland | 18 | 0.0% |
| Serbia | 19 | 0.0% |
| South America | 1,094 | 1.8% |
| South Central Asia | 214 | 0.4% |
| South Eastern Asia | 3,594 | 5.9% |
| Southern Europe | 82 | 0.1% |
| Sri Lanka | 29 | 0.1% |
| Switzerland | 21 | 0.0% |
| Taiwan | 214 | 0.4% |
| Thailand | 162 | 0.3% |
| Trinidad and Tobago | 14 | 0.0% |
| Turkey | 13 | 0.0% |
| Ukraine | 37 | 0.1% |
| Uruguay | 4 | 0.0% |
| Venezuela | 48 | 0.1% |
| Vietnam | 1,406 | 2.3% |
| Western Africa | 906 | 1.5% |
| Western Asia | 152 | 0.3% |
| Western Europe | 94 | 0.2% | View All 83 Rows |
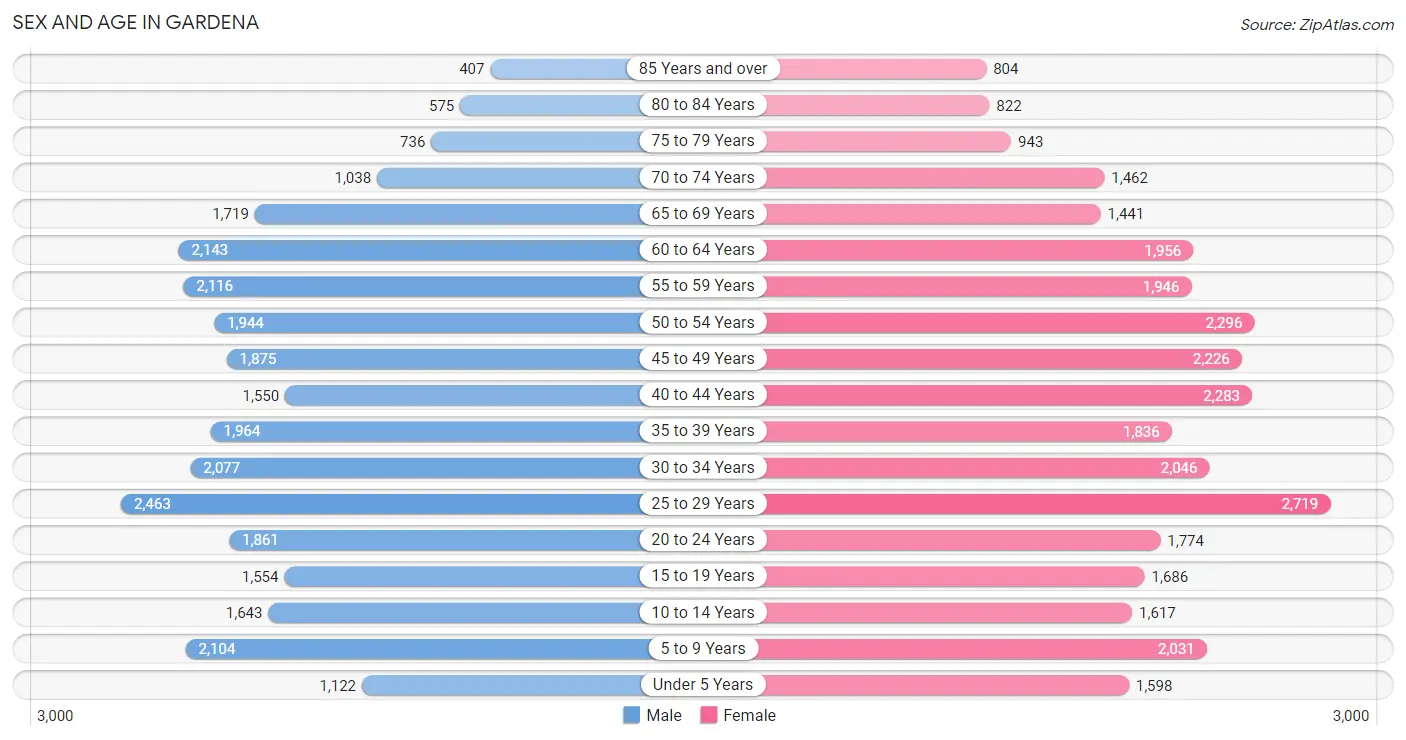
Sex and Age in Gardena
Sex and Age in Gardena
The most populous age groups in Gardena are 25 to 29 Years (2,463 | 8.5%) for men and 25 to 29 Years (2,719 | 8.6%) for women.
| Age Bracket | Male | Female |
| Under 5 Years | 1,122 (3.9%) | 1,598 (5.1%) |
| 5 to 9 Years | 2,104 (7.3%) | 2,031 (6.5%) |
| 10 to 14 Years | 1,643 (5.7%) | 1,617 (5.1%) |
| 15 to 19 Years | 1,554 (5.4%) | 1,686 (5.3%) |
| 20 to 24 Years | 1,861 (6.4%) | 1,774 (5.6%) |
| 25 to 29 Years | 2,463 (8.5%) | 2,719 (8.6%) |
| 30 to 34 Years | 2,077 (7.2%) | 2,046 (6.5%) |
| 35 to 39 Years | 1,964 (6.8%) | 1,836 (5.8%) |
| 40 to 44 Years | 1,550 (5.4%) | 2,283 (7.2%) |
| 45 to 49 Years | 1,875 (6.5%) | 2,226 (7.1%) |
| 50 to 54 Years | 1,944 (6.7%) | 2,296 (7.3%) |
| 55 to 59 Years | 2,116 (7.3%) | 1,946 (6.2%) |
| 60 to 64 Years | 2,143 (7.4%) | 1,956 (6.2%) |
| 65 to 69 Years | 1,719 (5.9%) | 1,441 (4.6%) |
| 70 to 74 Years | 1,038 (3.6%) | 1,462 (4.6%) |
| 75 to 79 Years | 736 (2.5%) | 943 (3.0%) |
| 80 to 84 Years | 575 (2.0%) | 822 (2.6%) |
| 85 Years and over | 407 (1.4%) | 804 (2.5%) |
| Total | 28,891 (100.0%) | 31,486 (100.0%) |
Families and Households in Gardena
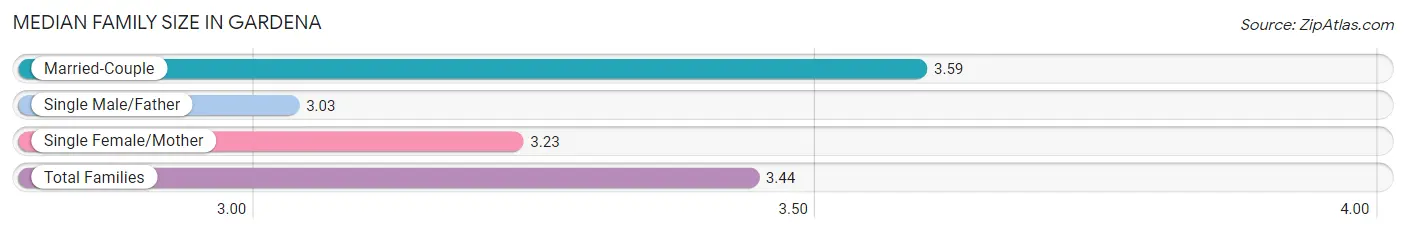
Median Family Size in Gardena
The median family size in Gardena is 3.44 persons per family, with married-couple families (9,201 | 64.2%) accounting for the largest median family size of 3.59 persons per family. On the other hand, single male/father families (1,537 | 10.7%) represent the smallest median family size with 3.03 persons per family.
| Family Type | # Families | Family Size |
| Married-Couple | 9,201 (64.2%) | 3.59 |
| Single Male/Father | 1,537 (10.7%) | 3.03 |
| Single Female/Mother | 3,583 (25.0%) | 3.23 |
| Total Families | 14,321 (100.0%) | 3.44 |
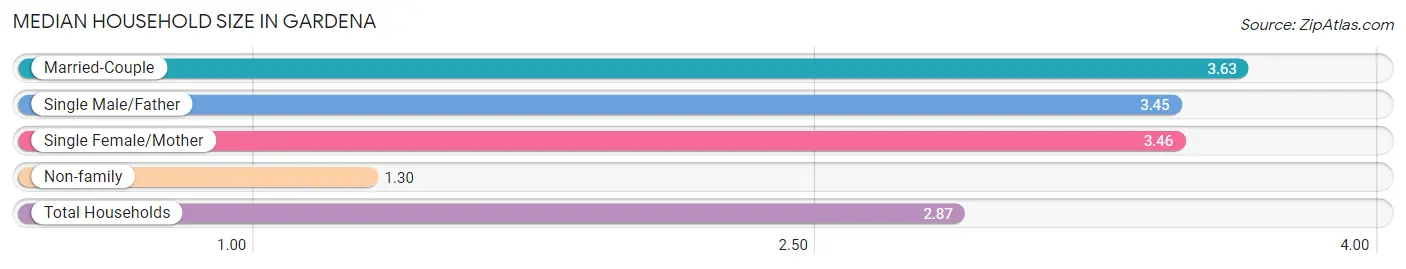
Median Household Size in Gardena
The median household size in Gardena is 2.87 persons per household, with married-couple households (9,201 | 44.3%) accounting for the largest median household size of 3.63 persons per household. non-family households (6,437 | 31.0%) represent the smallest median household size with 1.30 persons per household.
| Household Type | # Households | Household Size |
| Married-Couple | 9,201 (44.3%) | 3.63 |
| Single Male/Father | 1,537 (7.4%) | 3.45 |
| Single Female/Mother | 3,583 (17.3%) | 3.46 |
| Non-family | 6,437 (31.0%) | 1.30 |
| Total Households | 20,758 (100.0%) | 2.87 |
Household Size by Marriage Status in Gardena
Out of a total of 20,758 households in Gardena, 14,321 (69.0%) are family households, while 6,437 (31.0%) are nonfamily households. The most numerous type of family households are 2-person households, comprising 5,011, and the most common type of nonfamily households are 1-person households, comprising 5,130.
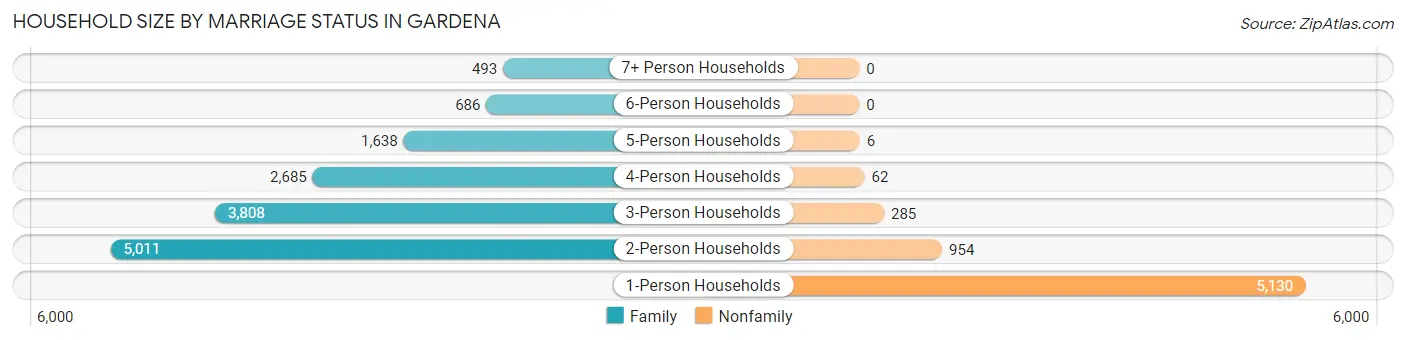
| Household Size | Family Households | Nonfamily Households |
| 1-Person Households | - | 5,130 (24.7%) |
| 2-Person Households | 5,011 (24.1%) | 954 (4.6%) |
| 3-Person Households | 3,808 (18.3%) | 285 (1.4%) |
| 4-Person Households | 2,685 (12.9%) | 62 (0.3%) |
| 5-Person Households | 1,638 (7.9%) | 6 (0.0%) |
| 6-Person Households | 686 (3.3%) | 0 (0.0%) |
| 7+ Person Households | 493 (2.4%) | 0 (0.0%) |
| Total | 14,321 (69.0%) | 6,437 (31.0%) |
Female Fertility in Gardena
Fertility by Age in Gardena
Average fertility rate in Gardena is 47.0 births per 1,000 women. Women in the age bracket of 20 to 34 years have the highest fertility rate with 76.0 births per 1,000 women. Women in the age bracket of 20 to 34 years acount for 70.4% of all women with births.
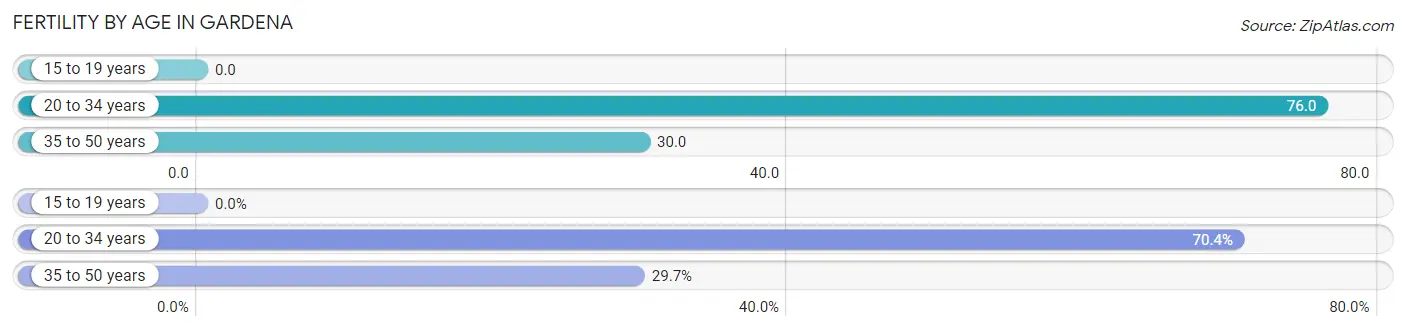
| Age Bracket | Women with Births | Births / 1,000 Women |
| 15 to 19 years | 0 (0.0%) | 0.0 |
| 20 to 34 years | 496 (70.4%) | 76.0 |
| 35 to 50 years | 209 (29.6%) | 30.0 |
| Total | 705 (100.0%) | 47.0 |
Fertility by Age by Marriage Status in Gardena
70.5% of women with births (705) in Gardena are married. The highest percentage of unmarried women with births falls into 20 to 34 years age bracket with 34.7% of them unmarried at the time of birth, while the lowest percentage of unmarried women with births belong to 35 to 50 years age bracket with 17.2% of them unmarried.
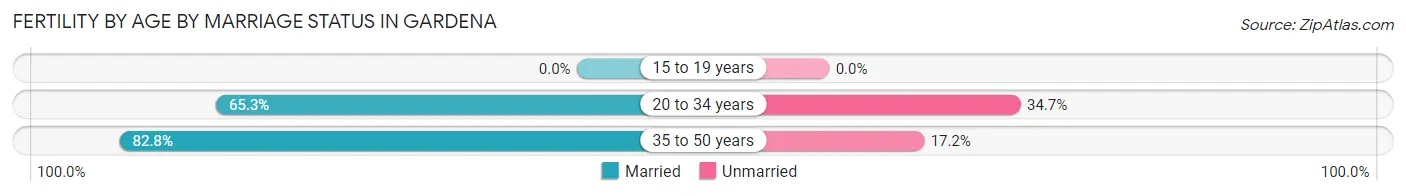
| Age Bracket | Married | Unmarried |
| 15 to 19 years | 0 (0.0%) | 0 (0.0%) |
| 20 to 34 years | 324 (65.3%) | 172 (34.7%) |
| 35 to 50 years | 173 (82.8%) | 36 (17.2%) |
| Total | 497 (70.5%) | 208 (29.5%) |
Fertility by Education in Gardena
Average fertility rate in Gardena is 47.0 births per 1,000 women. Women with the education attainment of college or associate's degree have the highest fertility rate of 59.0 births per 1,000 women, while women with the education attainment of bachelor's degree have the lowest fertility at 20.0 births per 1,000 women. Women with the education attainment of college or associate's degree represent 44.4% of all women with births.
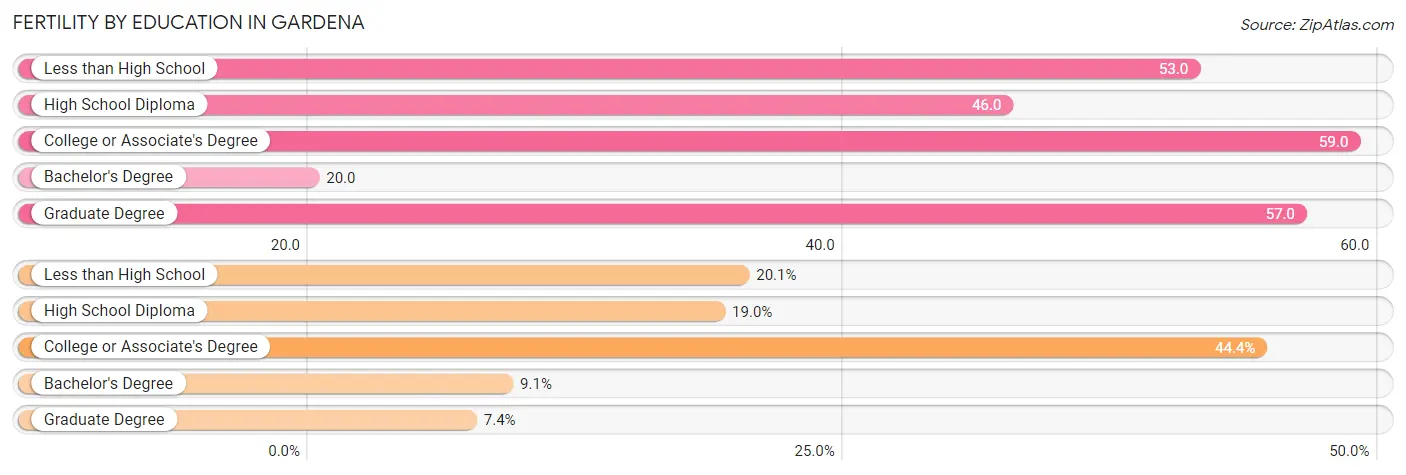
| Educational Attainment | Women with Births | Births / 1,000 Women |
| Less than High School | 142 (20.1%) | 53.0 |
| High School Diploma | 134 (19.0%) | 46.0 |
| College or Associate's Degree | 313 (44.4%) | 59.0 |
| Bachelor's Degree | 64 (9.1%) | 20.0 |
| Graduate Degree | 52 (7.4%) | 57.0 |
| Total | 705 (100.0%) | 47.0 |
Fertility by Education by Marriage Status in Gardena
29.5% of women with births in Gardena are unmarried. Women with the educational attainment of graduate degree are most likely to be married with 100.0% of them married at childbirth, while women with the educational attainment of less than high school are least likely to be married with 57.0% of them unmarried at childbirth.
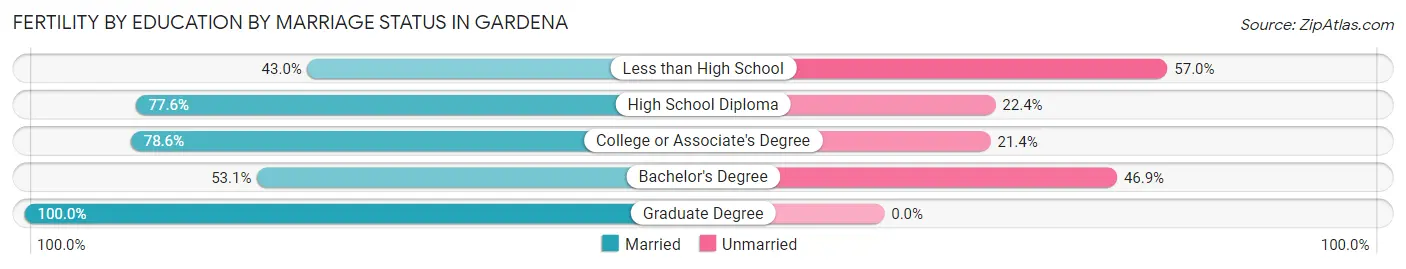
| Educational Attainment | Married | Unmarried |
| Less than High School | 61 (43.0%) | 81 (57.0%) |
| High School Diploma | 104 (77.6%) | 30 (22.4%) |
| College or Associate's Degree | 246 (78.6%) | 67 (21.4%) |
| Bachelor's Degree | 34 (53.1%) | 30 (46.9%) |
| Graduate Degree | 52 (100.0%) | 0 (0.0%) |
| Total | 497 (70.5%) | 208 (29.5%) |
Employment Characteristics in Gardena
Employment by Class of Employer in Gardena
Among the 30,004 employed individuals in Gardena, private company employees (20,109 | 67.0%), local government employees (2,489 | 8.3%), and self-employed (not incorporated) (2,423 | 8.1%) make up the most common classes of employment.
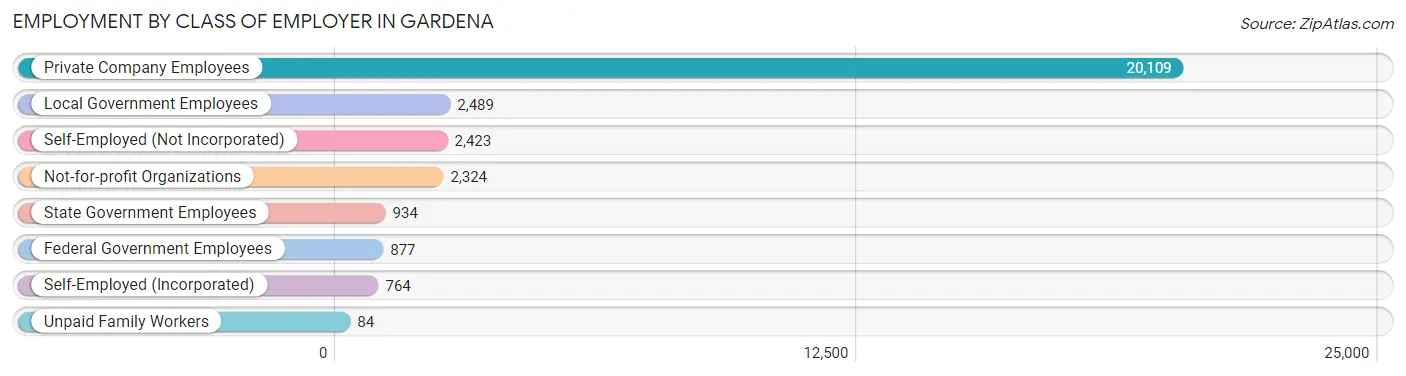
| Employer Class | # Employees | % Employees |
| Private Company Employees | 20,109 | 67.0% |
| Self-Employed (Incorporated) | 764 | 2.5% |
| Self-Employed (Not Incorporated) | 2,423 | 8.1% |
| Not-for-profit Organizations | 2,324 | 7.7% |
| Local Government Employees | 2,489 | 8.3% |
| State Government Employees | 934 | 3.1% |
| Federal Government Employees | 877 | 2.9% |
| Unpaid Family Workers | 84 | 0.3% |
| Total | 30,004 | 100.0% |
Employment Status by Age in Gardena
According to the labor force statistics for Gardena, out of the total population over 16 years of age (49,352), 65.0% or 32,079 individuals are in the labor force, with 4.3% or 1,379 of them unemployed. The age group with the highest labor force participation rate is 35 to 44 years, with 87.0% or 6,641 individuals in the labor force. Within the labor force, the 16 to 19 years age range has the highest percentage of unemployed individuals, with 17.1% or 147 of them being unemployed.
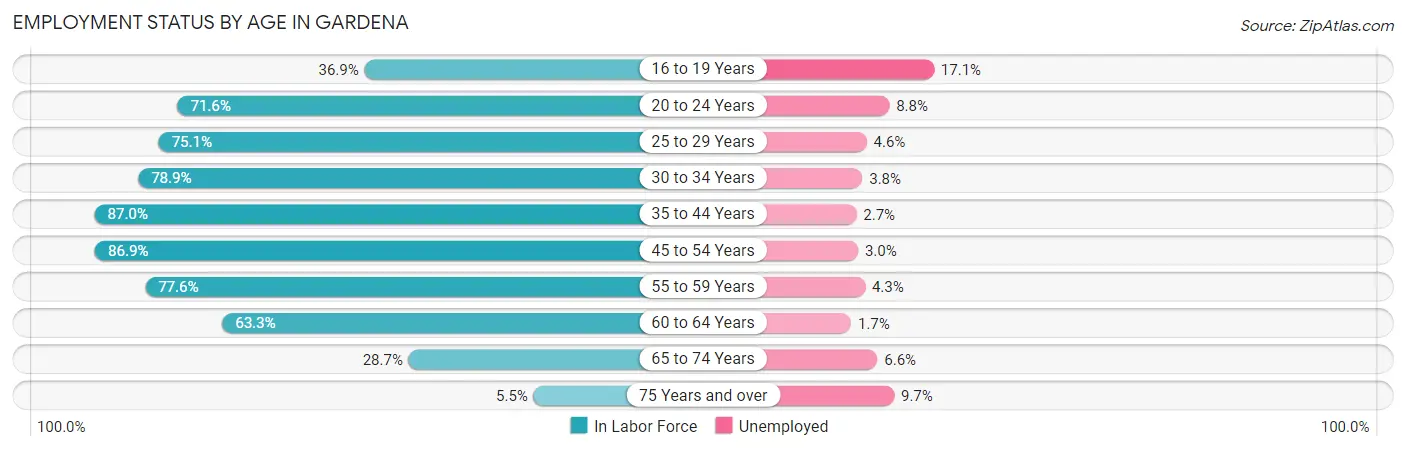
| Age Bracket | In Labor Force | Unemployed |
| 16 to 19 Years | 860 (36.9%) | 147 (17.1%) |
| 20 to 24 Years | 2,603 (71.6%) | 229 (8.8%) |
| 25 to 29 Years | 3,892 (75.1%) | 179 (4.6%) |
| 30 to 34 Years | 3,253 (78.9%) | 124 (3.8%) |
| 35 to 44 Years | 6,641 (87.0%) | 179 (2.7%) |
| 45 to 54 Years | 7,248 (86.9%) | 217 (3.0%) |
| 55 to 59 Years | 3,152 (77.6%) | 136 (4.3%) |
| 60 to 64 Years | 2,595 (63.3%) | 44 (1.7%) |
| 65 to 74 Years | 1,624 (28.7%) | 107 (6.6%) |
| 75 Years and over | 236 (5.5%) | 23 (9.7%) |
| Total | 32,079 (65.0%) | 1,379 (4.3%) |
Employment Status by Educational Attainment in Gardena
According to labor force statistics for Gardena, 80.1% of individuals (26,785) out of the total population between 25 and 64 years of age (33,440) are in the labor force, with 3.3% or 884 of them being unemployed. The group with the highest labor force participation rate are those with the educational attainment of bachelor's degree or higher, with 88.1% or 8,244 individuals in the labor force. Within the labor force, individuals with less than high school education have the highest percentage of unemployment, with 3.8% or 169 of them being unemployed.
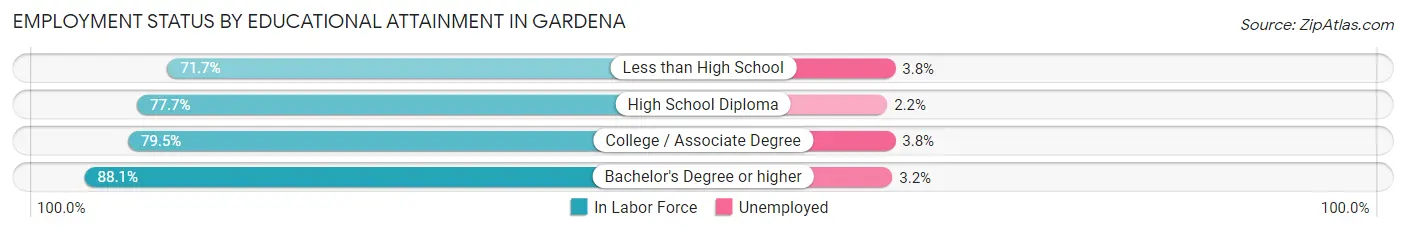
| Educational Attainment | In Labor Force | Unemployed |
| Less than High School | 4,450 (71.7%) | 236 (3.8%) |
| High School Diploma | 5,672 (77.7%) | 161 (2.2%) |
| College / Associate Degree | 8,407 (79.5%) | 402 (3.8%) |
| Bachelor's Degree or higher | 8,244 (88.1%) | 299 (3.2%) |
| Total | 26,785 (80.1%) | 1,104 (3.3%) |
Employment Occupations by Sex in Gardena
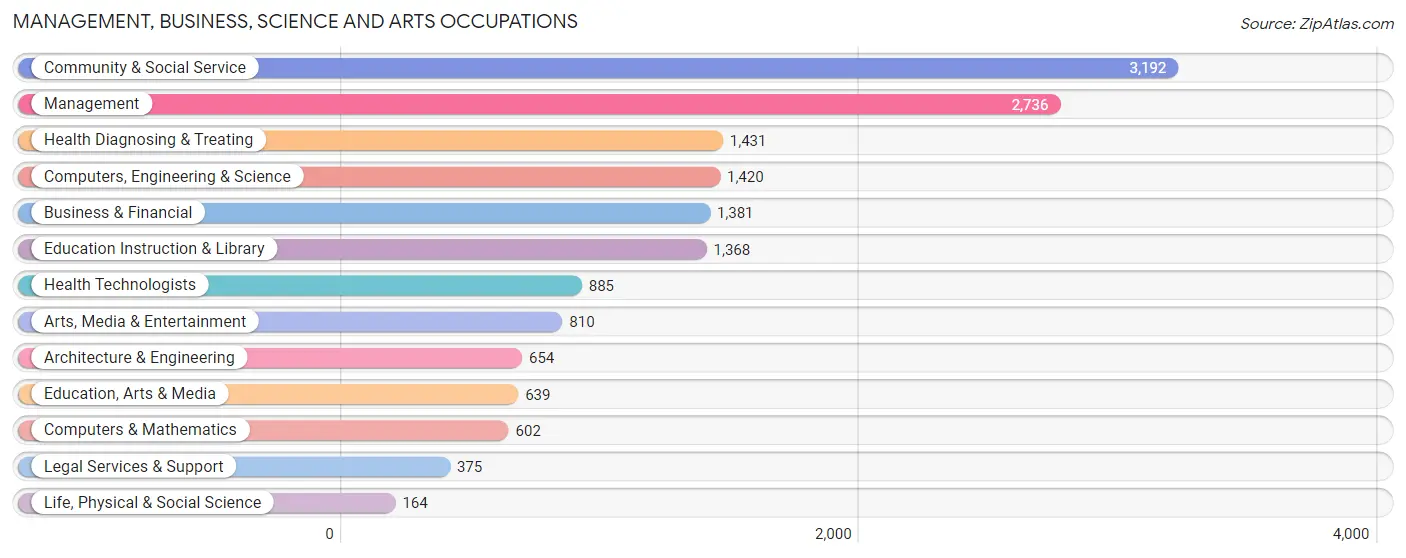
Management, Business, Science and Arts Occupations
The most common Management, Business, Science and Arts occupations in Gardena are Community & Social Service (3,192 | 10.4%), Management (2,736 | 8.9%), Health Diagnosing & Treating (1,431 | 4.7%), Computers, Engineering & Science (1,420 | 4.6%), and Business & Financial (1,381 | 4.5%).
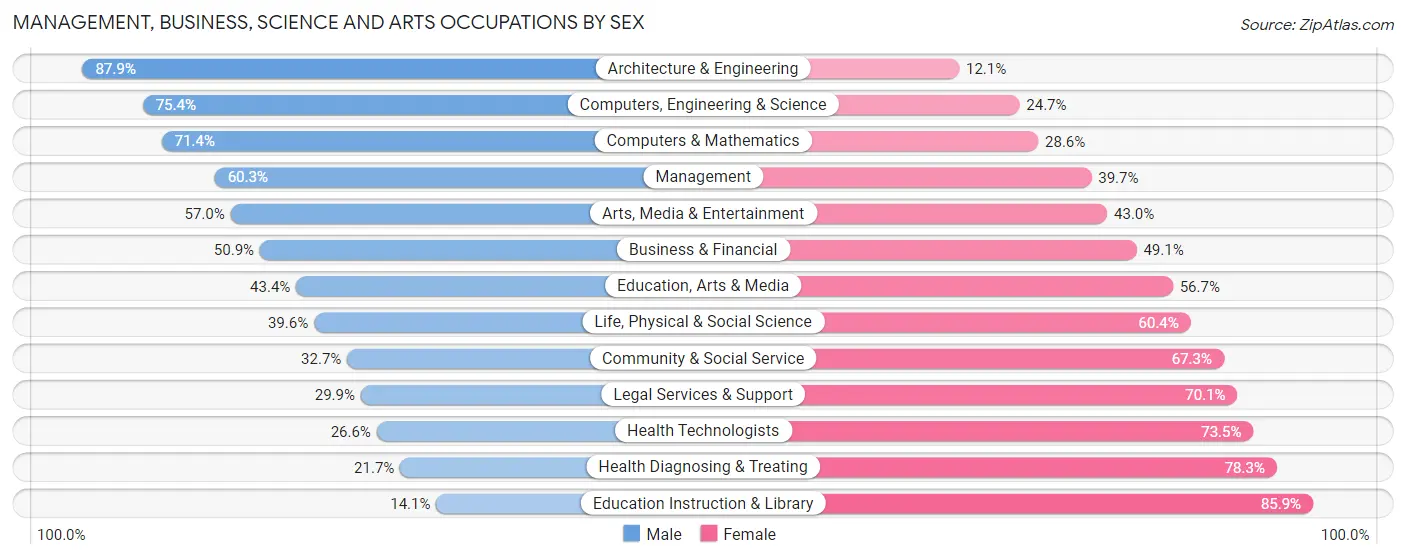
Management, Business, Science and Arts Occupations by Sex
Within the Management, Business, Science and Arts occupations in Gardena, the most male-oriented occupations are Architecture & Engineering (87.9%), Computers, Engineering & Science (75.3%), and Computers & Mathematics (71.4%), while the most female-oriented occupations are Education Instruction & Library (85.9%), Health Diagnosing & Treating (78.3%), and Health Technologists (73.5%).
| Occupation | Male | Female |
| Management | 1,651 (60.3%) | 1,085 (39.7%) |
| Business & Financial | 703 (50.9%) | 678 (49.1%) |
| Computers, Engineering & Science | 1,070 (75.3%) | 350 (24.6%) |
| Computers & Mathematics | 430 (71.4%) | 172 (28.6%) |
| Architecture & Engineering | 575 (87.9%) | 79 (12.1%) |
| Life, Physical & Social Science | 65 (39.6%) | 99 (60.4%) |
| Community & Social Service | 1,044 (32.7%) | 2,148 (67.3%) |
| Education, Arts & Media | 277 (43.3%) | 362 (56.7%) |
| Legal Services & Support | 112 (29.9%) | 263 (70.1%) |
| Education Instruction & Library | 193 (14.1%) | 1,175 (85.9%) |
| Arts, Media & Entertainment | 462 (57.0%) | 348 (43.0%) |
| Health Diagnosing & Treating | 310 (21.7%) | 1,121 (78.3%) |
| Health Technologists | 235 (26.6%) | 650 (73.5%) |
| Total (Category) | 4,778 (47.0%) | 5,382 (53.0%) |
| Total (Overall) | 15,833 (51.6%) | 14,865 (48.4%) |
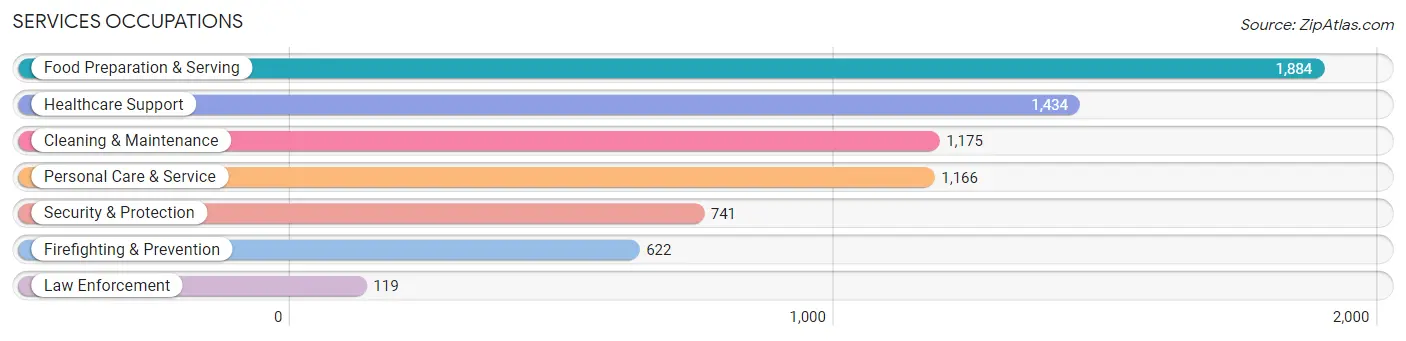
Services Occupations
The most common Services occupations in Gardena are Food Preparation & Serving (1,884 | 6.1%), Healthcare Support (1,434 | 4.7%), Cleaning & Maintenance (1,175 | 3.8%), Personal Care & Service (1,166 | 3.8%), and Security & Protection (741 | 2.4%).
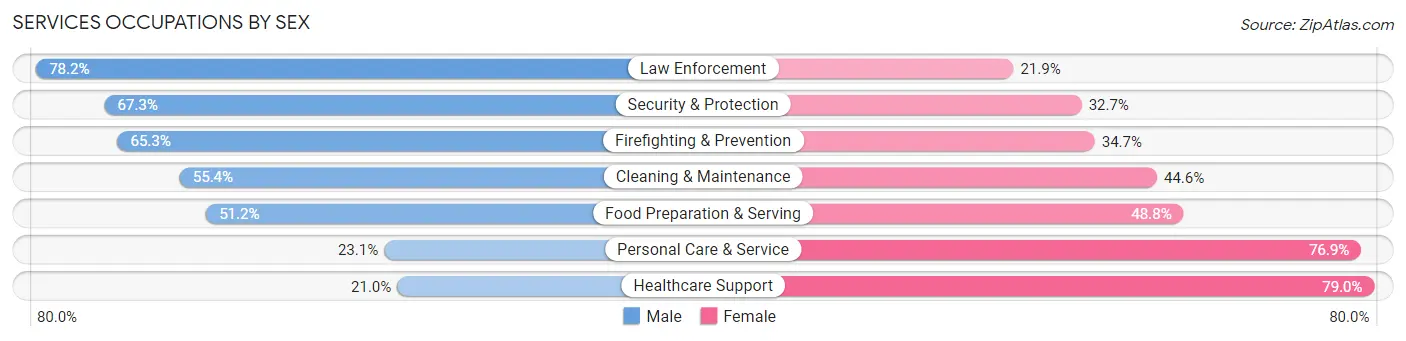
Services Occupations by Sex
Within the Services occupations in Gardena, the most male-oriented occupations are Law Enforcement (78.1%), Security & Protection (67.3%), and Firefighting & Prevention (65.3%), while the most female-oriented occupations are Healthcare Support (79.0%), Personal Care & Service (76.9%), and Food Preparation & Serving (48.8%).
| Occupation | Male | Female |
| Healthcare Support | 301 (21.0%) | 1,133 (79.0%) |
| Security & Protection | 499 (67.3%) | 242 (32.7%) |
| Firefighting & Prevention | 406 (65.3%) | 216 (34.7%) |
| Law Enforcement | 93 (78.1%) | 26 (21.8%) |
| Food Preparation & Serving | 965 (51.2%) | 919 (48.8%) |
| Cleaning & Maintenance | 651 (55.4%) | 524 (44.6%) |
| Personal Care & Service | 269 (23.1%) | 897 (76.9%) |
| Total (Category) | 2,685 (41.9%) | 3,715 (58.1%) |
| Total (Overall) | 15,833 (51.6%) | 14,865 (48.4%) |
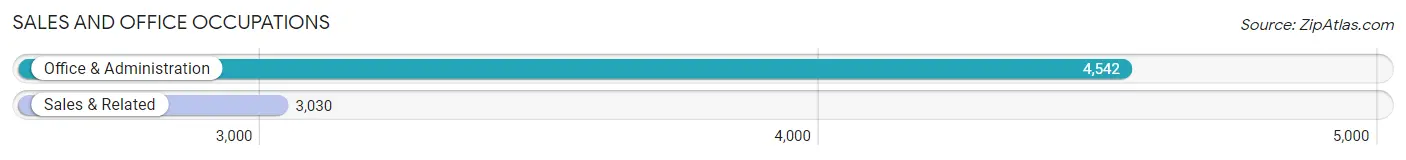
Sales and Office Occupations
The most common Sales and Office occupations in Gardena are Office & Administration (4,542 | 14.8%), and Sales & Related (3,030 | 9.9%).
Sales and Office Occupations by Sex
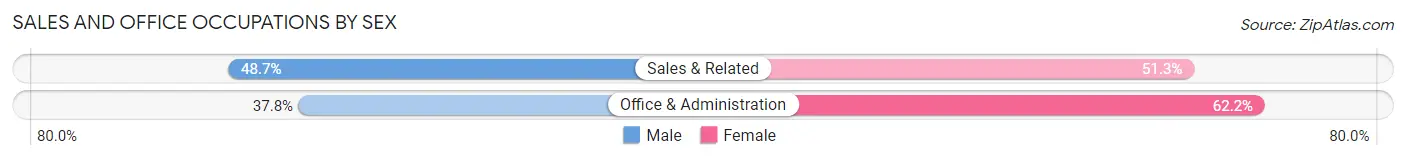
| Occupation | Male | Female |
| Sales & Related | 1,475 (48.7%) | 1,555 (51.3%) |
| Office & Administration | 1,717 (37.8%) | 2,825 (62.2%) |
| Total (Category) | 3,192 (42.2%) | 4,380 (57.8%) |
| Total (Overall) | 15,833 (51.6%) | 14,865 (48.4%) |
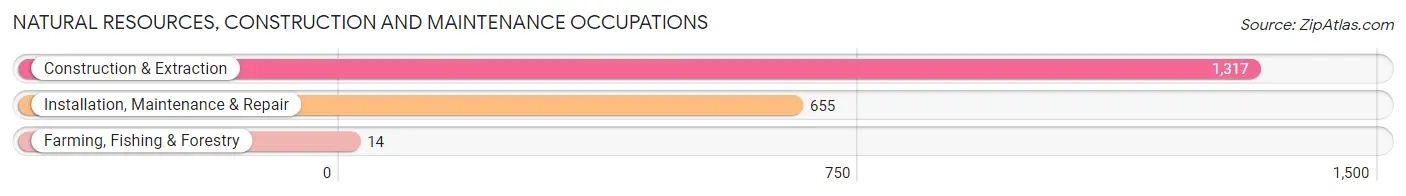
Natural Resources, Construction and Maintenance Occupations
The most common Natural Resources, Construction and Maintenance occupations in Gardena are Construction & Extraction (1,317 | 4.3%), Installation, Maintenance & Repair (655 | 2.1%), and Farming, Fishing & Forestry (14 | 0.1%).
Natural Resources, Construction and Maintenance Occupations by Sex
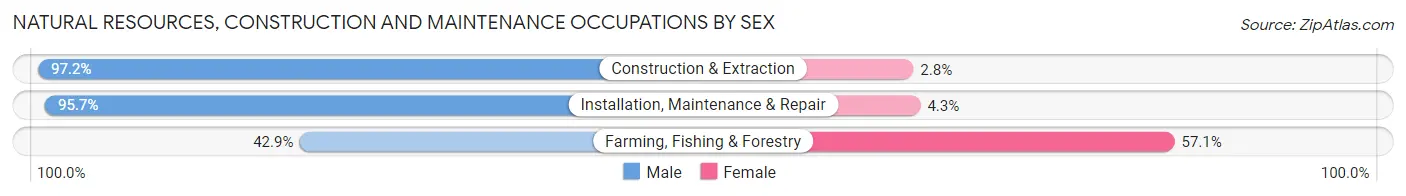
| Occupation | Male | Female |
| Farming, Fishing & Forestry | 6 (42.9%) | 8 (57.1%) |
| Construction & Extraction | 1,280 (97.2%) | 37 (2.8%) |
| Installation, Maintenance & Repair | 627 (95.7%) | 28 (4.3%) |
| Total (Category) | 1,913 (96.3%) | 73 (3.7%) |
| Total (Overall) | 15,833 (51.6%) | 14,865 (48.4%) |
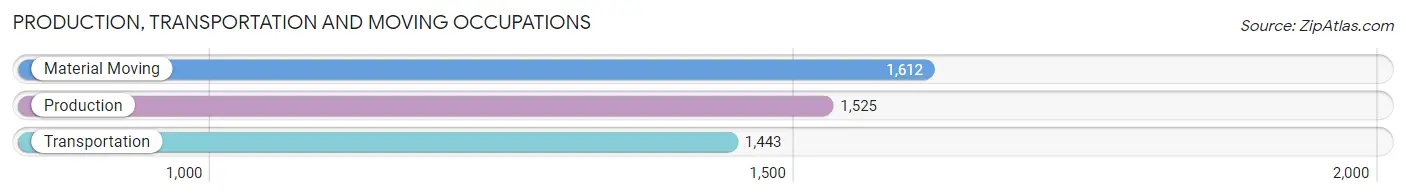
Production, Transportation and Moving Occupations
The most common Production, Transportation and Moving occupations in Gardena are Material Moving (1,612 | 5.2%), Production (1,525 | 5.0%), and Transportation (1,443 | 4.7%).
Production, Transportation and Moving Occupations by Sex
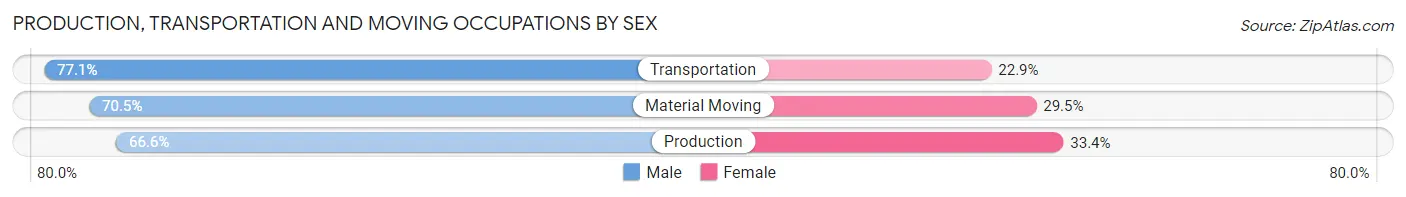
| Occupation | Male | Female |
| Production | 1,015 (66.6%) | 510 (33.4%) |
| Transportation | 1,113 (77.1%) | 330 (22.9%) |
| Material Moving | 1,137 (70.5%) | 475 (29.5%) |
| Total (Category) | 3,265 (71.3%) | 1,315 (28.7%) |
| Total (Overall) | 15,833 (51.6%) | 14,865 (48.4%) |
Employment Industries by Sex in Gardena
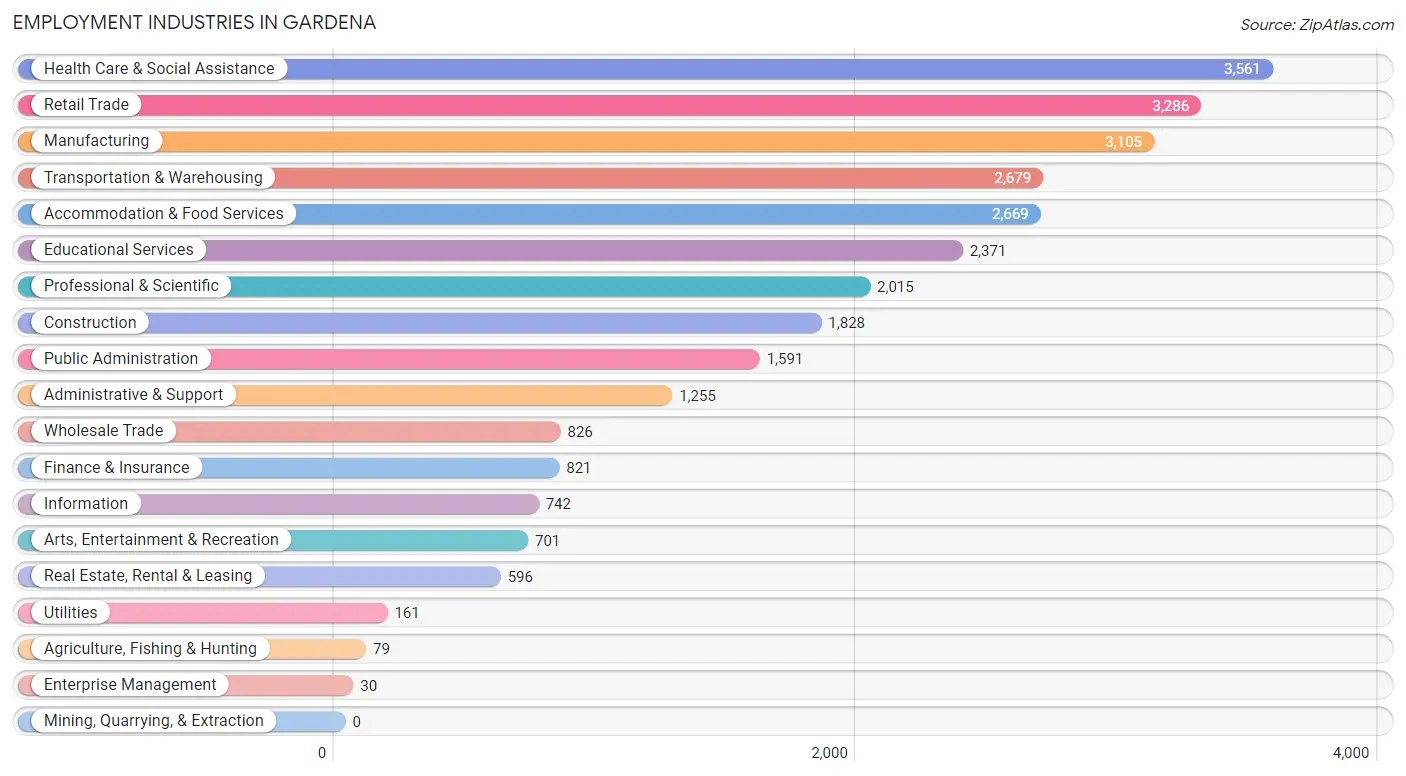
Employment Industries in Gardena
The major employment industries in Gardena include Health Care & Social Assistance (3,561 | 11.6%), Retail Trade (3,286 | 10.7%), Manufacturing (3,105 | 10.1%), Transportation & Warehousing (2,679 | 8.7%), and Accommodation & Food Services (2,669 | 8.7%).
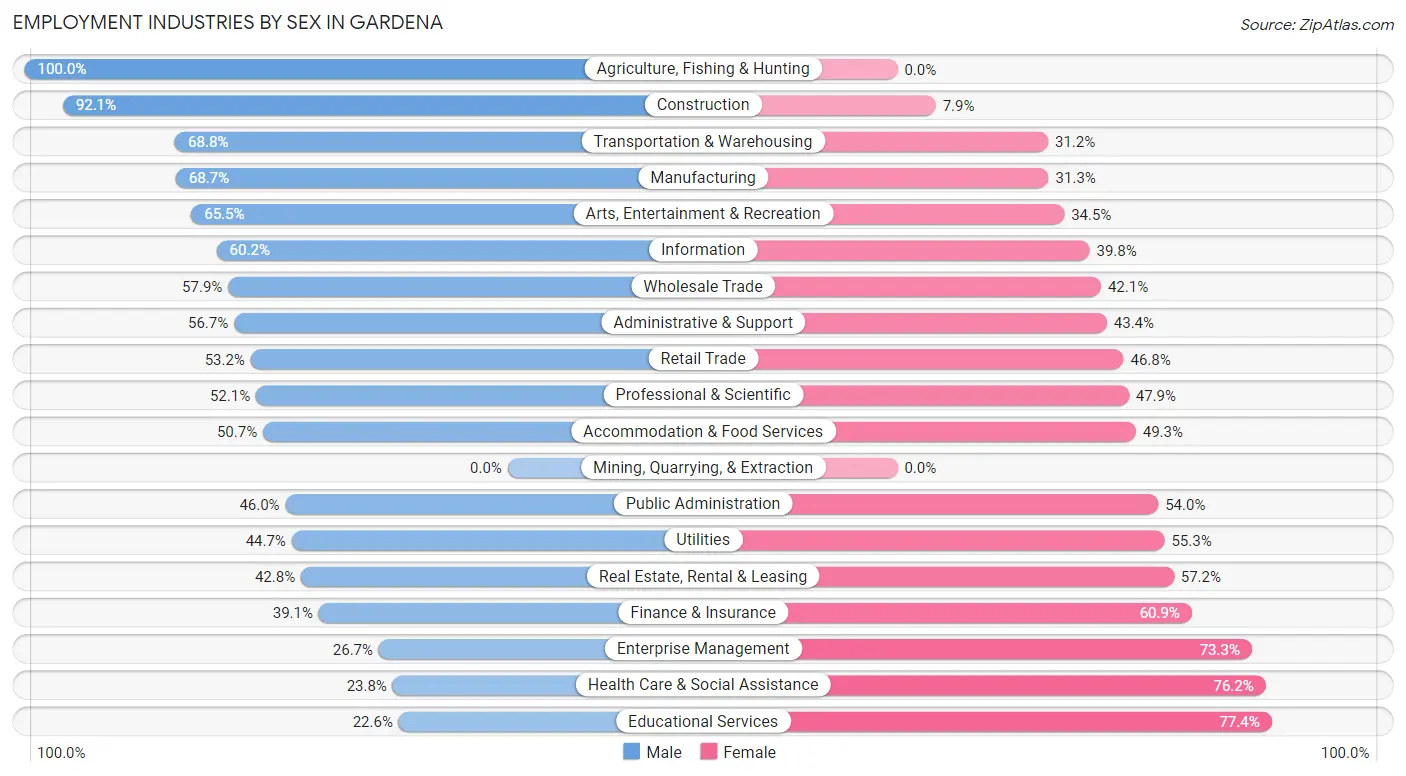
Employment Industries by Sex in Gardena
The Gardena industries that see more men than women are Agriculture, Fishing & Hunting (100.0%), Construction (92.1%), and Transportation & Warehousing (68.8%), whereas the industries that tend to have a higher number of women are Educational Services (77.4%), Health Care & Social Assistance (76.2%), and Enterprise Management (73.3%).
| Industry | Male | Female |
| Agriculture, Fishing & Hunting | 79 (100.0%) | 0 (0.0%) |
| Mining, Quarrying, & Extraction | 0 (0.0%) | 0 (0.0%) |
| Construction | 1,683 (92.1%) | 145 (7.9%) |
| Manufacturing | 2,133 (68.7%) | 972 (31.3%) |
| Wholesale Trade | 478 (57.9%) | 348 (42.1%) |
| Retail Trade | 1,748 (53.2%) | 1,538 (46.8%) |
| Transportation & Warehousing | 1,844 (68.8%) | 835 (31.2%) |
| Utilities | 72 (44.7%) | 89 (55.3%) |
| Information | 447 (60.2%) | 295 (39.8%) |
| Finance & Insurance | 321 (39.1%) | 500 (60.9%) |
| Real Estate, Rental & Leasing | 255 (42.8%) | 341 (57.2%) |
| Professional & Scientific | 1,050 (52.1%) | 965 (47.9%) |
| Enterprise Management | 8 (26.7%) | 22 (73.3%) |
| Administrative & Support | 711 (56.7%) | 544 (43.3%) |
| Educational Services | 535 (22.6%) | 1,836 (77.4%) |
| Health Care & Social Assistance | 848 (23.8%) | 2,713 (76.2%) |
| Arts, Entertainment & Recreation | 459 (65.5%) | 242 (34.5%) |
| Accommodation & Food Services | 1,352 (50.7%) | 1,317 (49.3%) |
| Public Administration | 732 (46.0%) | 859 (54.0%) |
| Total | 15,833 (51.6%) | 14,865 (48.4%) |
Education in Gardena
School Enrollment in Gardena
The most common levels of schooling among the 14,852 students in Gardena are college / undergraduate (4,051 | 27.3%), elementary school (3,384 | 22.8%), and middle school (2,790 | 18.8%).
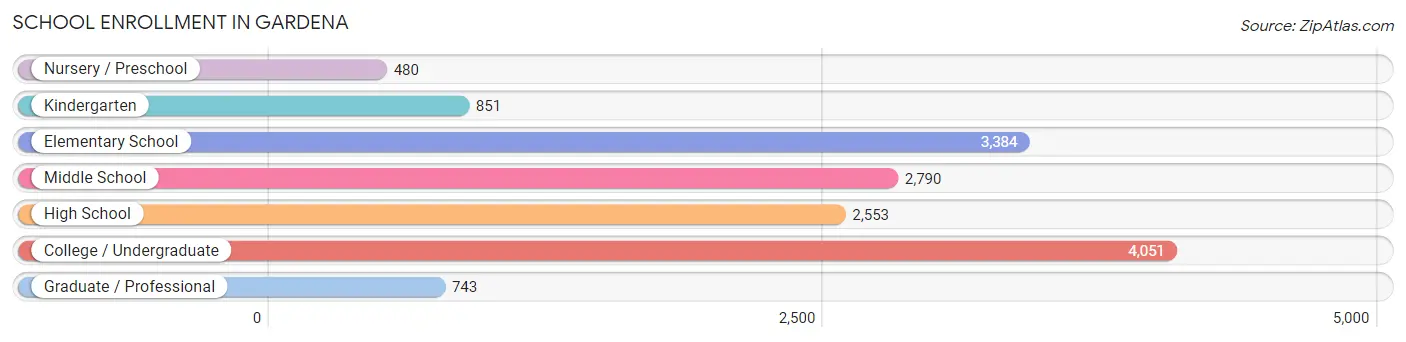
| School Level | # Students | % Students |
| Nursery / Preschool | 480 | 3.2% |
| Kindergarten | 851 | 5.7% |
| Elementary School | 3,384 | 22.8% |
| Middle School | 2,790 | 18.8% |
| High School | 2,553 | 17.2% |
| College / Undergraduate | 4,051 | 27.3% |
| Graduate / Professional | 743 | 5.0% |
| Total | 14,852 | 100.0% |
School Enrollment by Age by Funding Source in Gardena
Out of a total of 14,852 students who are enrolled in schools in Gardena, 1,782 (12.0%) attend a private institution, while the remaining 13,070 (88.0%) are enrolled in public schools. The age group of 3 to 4 year olds has the highest likelihood of being enrolled in private schools, with 290 (52.8% in the age bracket) enrolled. Conversely, the age group of 18 to 19 year olds has the lowest likelihood of being enrolled in a private school, with 934 (98.6% in the age bracket) attending a public institution.
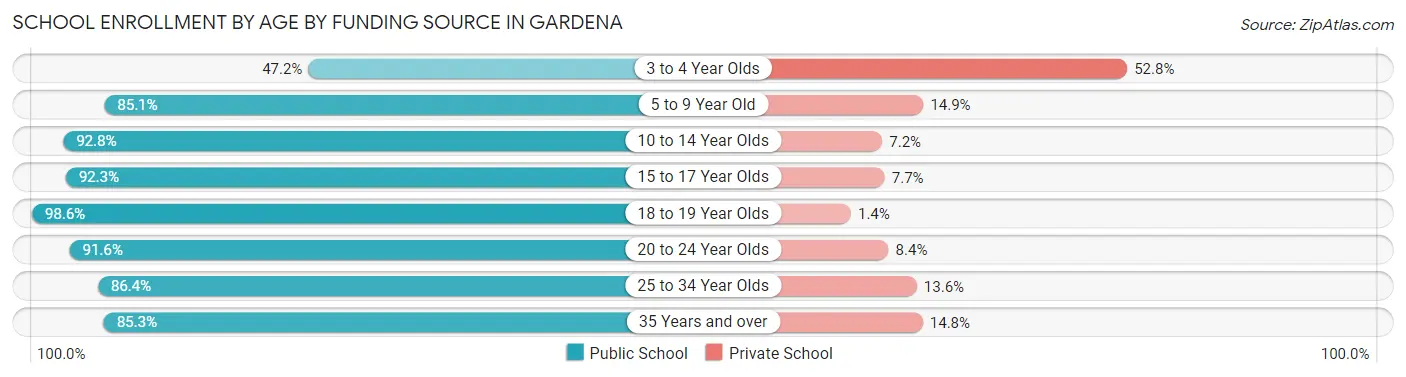
| Age Bracket | Public School | Private School |
| 3 to 4 Year Olds | 259 (47.2%) | 290 (52.8%) |
| 5 to 9 Year Old | 3,454 (85.1%) | 603 (14.9%) |
| 10 to 14 Year Olds | 2,952 (92.8%) | 229 (7.2%) |
| 15 to 17 Year Olds | 1,757 (92.3%) | 146 (7.7%) |
| 18 to 19 Year Olds | 934 (98.6%) | 13 (1.4%) |
| 20 to 24 Year Olds | 1,465 (91.6%) | 134 (8.4%) |
| 25 to 34 Year Olds | 1,311 (86.4%) | 207 (13.6%) |
| 35 Years and over | 936 (85.3%) | 162 (14.7%) |
| Total | 13,070 (88.0%) | 1,782 (12.0%) |
Educational Attainment by Field of Study in Gardena
Business (2,509 | 20.1%), social sciences (1,166 | 9.4%), engineering (1,137 | 9.1%), science & technology (1,088 | 8.7%), and education (943 | 7.6%) are the most common fields of study among 12,457 individuals in Gardena who have obtained a bachelor's degree or higher.
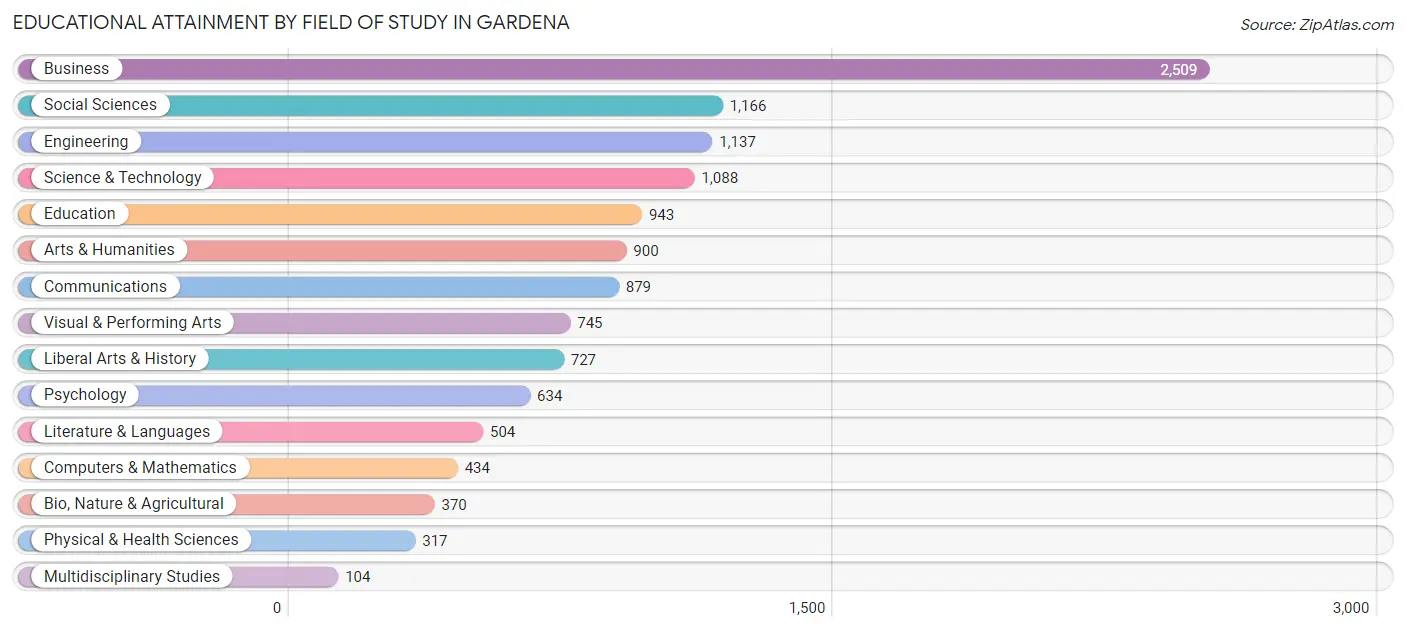
| Field of Study | # Graduates | % Graduates |
| Computers & Mathematics | 434 | 3.5% |
| Bio, Nature & Agricultural | 370 | 3.0% |
| Physical & Health Sciences | 317 | 2.5% |
| Psychology | 634 | 5.1% |
| Social Sciences | 1,166 | 9.4% |
| Engineering | 1,137 | 9.1% |
| Multidisciplinary Studies | 104 | 0.8% |
| Science & Technology | 1,088 | 8.7% |
| Business | 2,509 | 20.1% |
| Education | 943 | 7.6% |
| Literature & Languages | 504 | 4.1% |
| Liberal Arts & History | 727 | 5.8% |
| Visual & Performing Arts | 745 | 6.0% |
| Communications | 879 | 7.1% |
| Arts & Humanities | 900 | 7.2% |
| Total | 12,457 | 100.0% |
Transportation & Commute in Gardena
Vehicle Availability by Sex in Gardena
The most prevalent vehicle ownership categories in Gardena are males with 2 vehicles (6,564, accounting for 42.1%) and females with 2 vehicles (5,527, making up 45.7%).
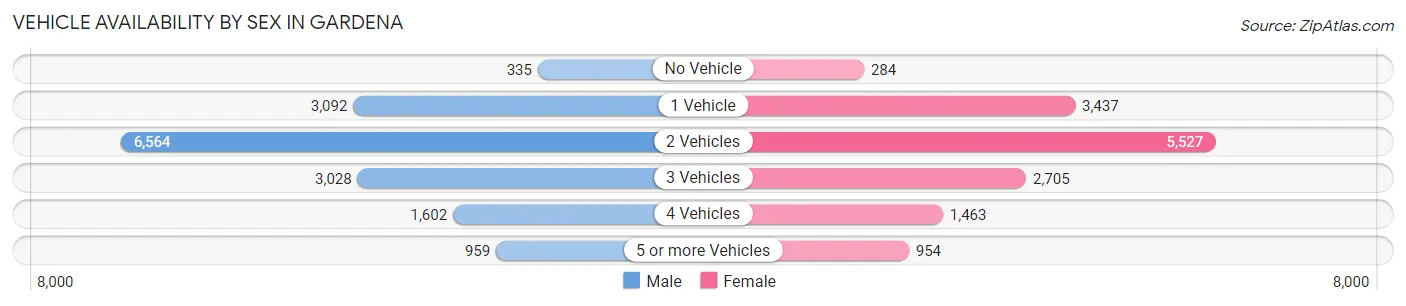
| Vehicles Available | Male | Female |
| No Vehicle | 335 (2.1%) | 284 (2.0%) |
| 1 Vehicle | 3,092 (19.9%) | 3,437 (23.9%) |
| 2 Vehicles | 6,564 (42.1%) | 5,527 (38.5%) |
| 3 Vehicles | 3,028 (19.4%) | 2,705 (18.8%) |
| 4 Vehicles | 1,602 (10.3%) | 1,463 (10.2%) |
| 5 or more Vehicles | 959 (6.2%) | 954 (6.6%) |
| Total | 15,580 (100.0%) | 14,370 (100.0%) |
Commute Time in Gardena
The most frequently occuring commute durations in Gardena are 15 to 19 minutes (4,442 commuters, 16.1%), 30 to 34 minutes (4,413 commuters, 16.0%), and 20 to 24 minutes (4,383 commuters, 15.9%).
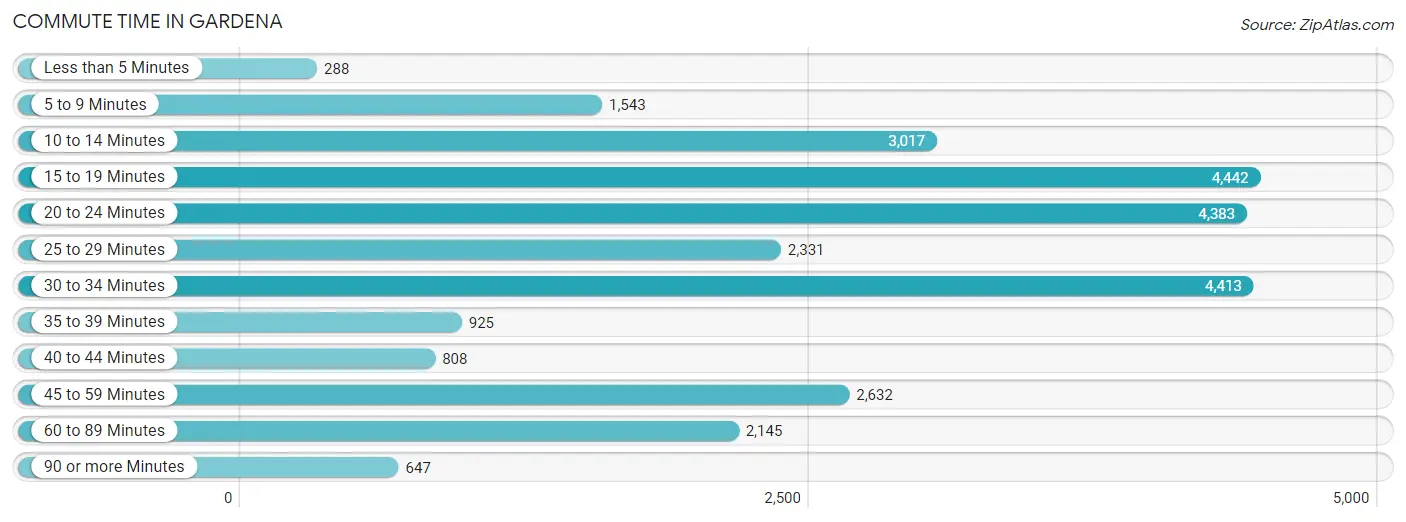
| Commute Time | # Commuters | % Commuters |
| Less than 5 Minutes | 288 | 1.0% |
| 5 to 9 Minutes | 1,543 | 5.6% |
| 10 to 14 Minutes | 3,017 | 10.9% |
| 15 to 19 Minutes | 4,442 | 16.1% |
| 20 to 24 Minutes | 4,383 | 15.9% |
| 25 to 29 Minutes | 2,331 | 8.5% |
| 30 to 34 Minutes | 4,413 | 16.0% |
| 35 to 39 Minutes | 925 | 3.4% |
| 40 to 44 Minutes | 808 | 2.9% |
| 45 to 59 Minutes | 2,632 | 9.6% |
| 60 to 89 Minutes | 2,145 | 7.8% |
| 90 or more Minutes | 647 | 2.4% |
Commute Time by Sex in Gardena
The most common commute times in Gardena are 20 to 24 minutes (2,288 commuters, 15.6%) for males and 30 to 34 minutes (2,345 commuters, 18.2%) for females.
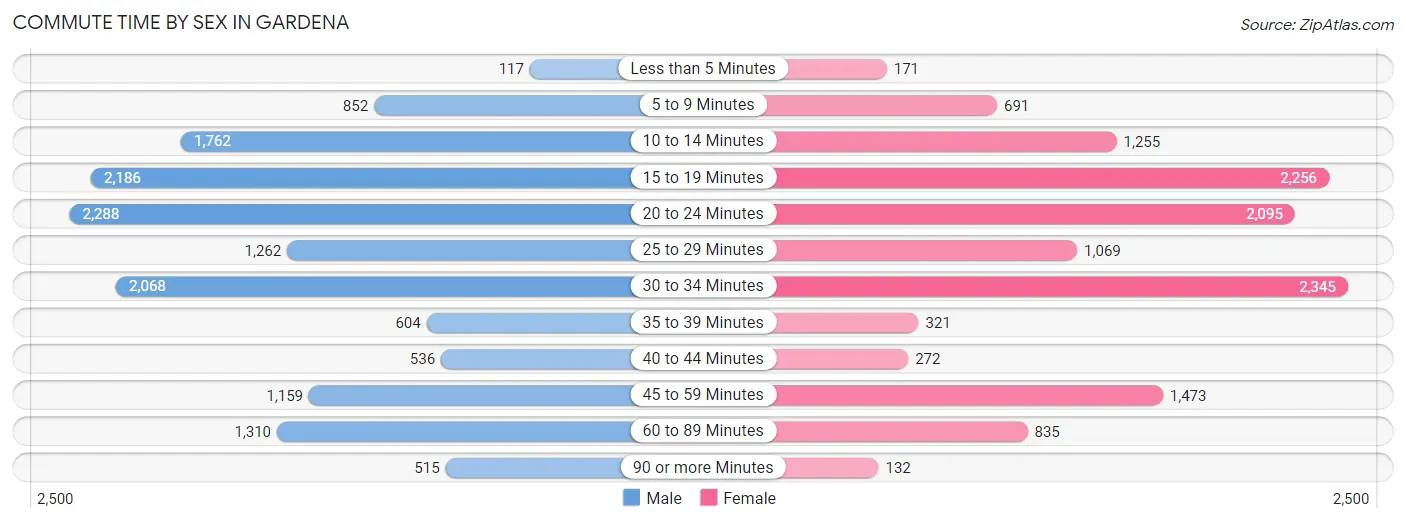
| Commute Time | Male | Female |
| Less than 5 Minutes | 117 (0.8%) | 171 (1.3%) |
| 5 to 9 Minutes | 852 (5.8%) | 691 (5.3%) |
| 10 to 14 Minutes | 1,762 (12.0%) | 1,255 (9.7%) |
| 15 to 19 Minutes | 2,186 (14.9%) | 2,256 (17.5%) |
| 20 to 24 Minutes | 2,288 (15.6%) | 2,095 (16.2%) |
| 25 to 29 Minutes | 1,262 (8.6%) | 1,069 (8.3%) |
| 30 to 34 Minutes | 2,068 (14.1%) | 2,345 (18.2%) |
| 35 to 39 Minutes | 604 (4.1%) | 321 (2.5%) |
| 40 to 44 Minutes | 536 (3.7%) | 272 (2.1%) |
| 45 to 59 Minutes | 1,159 (7.9%) | 1,473 (11.4%) |
| 60 to 89 Minutes | 1,310 (8.9%) | 835 (6.5%) |
| 90 or more Minutes | 515 (3.5%) | 132 (1.0%) |
Time of Departure to Work by Sex in Gardena
The most frequent times of departure to work in Gardena are 7:00 AM to 7:29 AM (1,920, 13.1%) for males and 7:30 AM to 7:59 AM (1,933, 15.0%) for females.
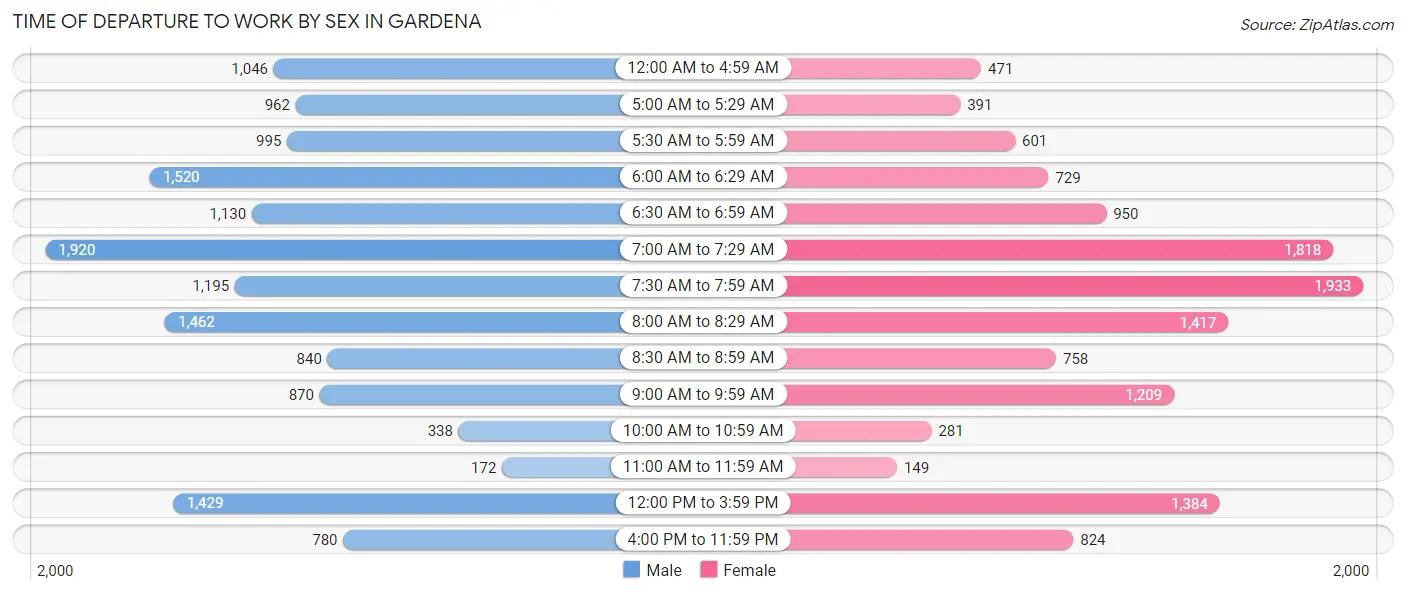
| Time of Departure | Male | Female |
| 12:00 AM to 4:59 AM | 1,046 (7.1%) | 471 (3.6%) |
| 5:00 AM to 5:29 AM | 962 (6.6%) | 391 (3.0%) |
| 5:30 AM to 5:59 AM | 995 (6.8%) | 601 (4.6%) |
| 6:00 AM to 6:29 AM | 1,520 (10.4%) | 729 (5.6%) |
| 6:30 AM to 6:59 AM | 1,130 (7.7%) | 950 (7.4%) |
| 7:00 AM to 7:29 AM | 1,920 (13.1%) | 1,818 (14.1%) |
| 7:30 AM to 7:59 AM | 1,195 (8.2%) | 1,933 (15.0%) |
| 8:00 AM to 8:29 AM | 1,462 (10.0%) | 1,417 (11.0%) |
| 8:30 AM to 8:59 AM | 840 (5.7%) | 758 (5.9%) |
| 9:00 AM to 9:59 AM | 870 (5.9%) | 1,209 (9.4%) |
| 10:00 AM to 10:59 AM | 338 (2.3%) | 281 (2.2%) |
| 11:00 AM to 11:59 AM | 172 (1.2%) | 149 (1.1%) |
| 12:00 PM to 3:59 PM | 1,429 (9.8%) | 1,384 (10.7%) |
| 4:00 PM to 11:59 PM | 780 (5.3%) | 824 (6.4%) |
| Total | 14,659 (100.0%) | 12,915 (100.0%) |
Housing Occupancy in Gardena
Occupancy by Ownership in Gardena
Of the total 20,758 dwellings in Gardena, owner-occupied units account for 10,164 (49.0%), while renter-occupied units make up 10,594 (51.0%).
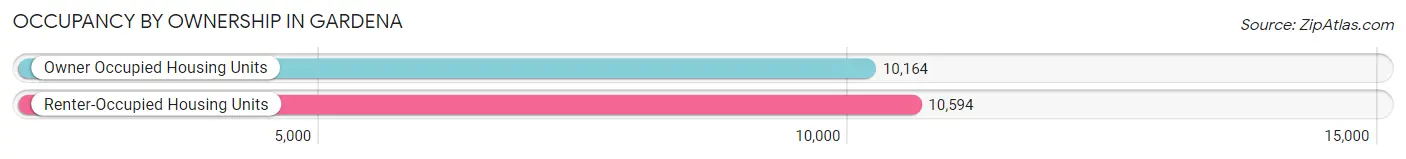
| Occupancy | # Housing Units | % Housing Units |
| Owner Occupied Housing Units | 10,164 | 49.0% |
| Renter-Occupied Housing Units | 10,594 | 51.0% |
| Total Occupied Housing Units | 20,758 | 100.0% |
Occupancy by Household Size in Gardena
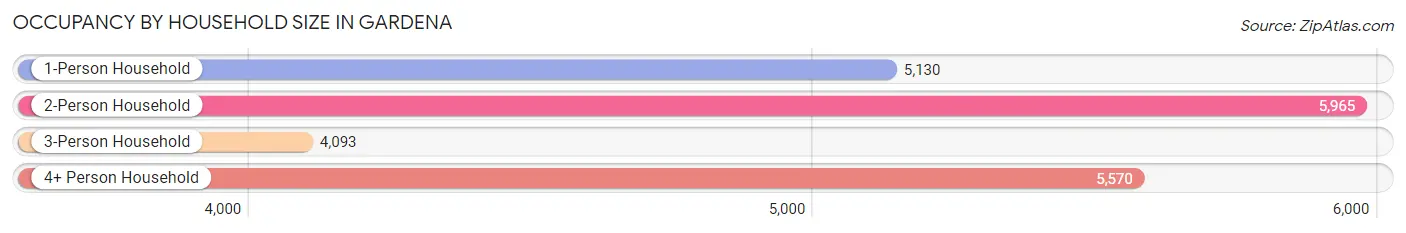
| Household Size | # Housing Units | % Housing Units |
| 1-Person Household | 5,130 | 24.7% |
| 2-Person Household | 5,965 | 28.7% |
| 3-Person Household | 4,093 | 19.7% |
| 4+ Person Household | 5,570 | 26.8% |
| Total Housing Units | 20,758 | 100.0% |
Occupancy by Ownership by Household Size in Gardena
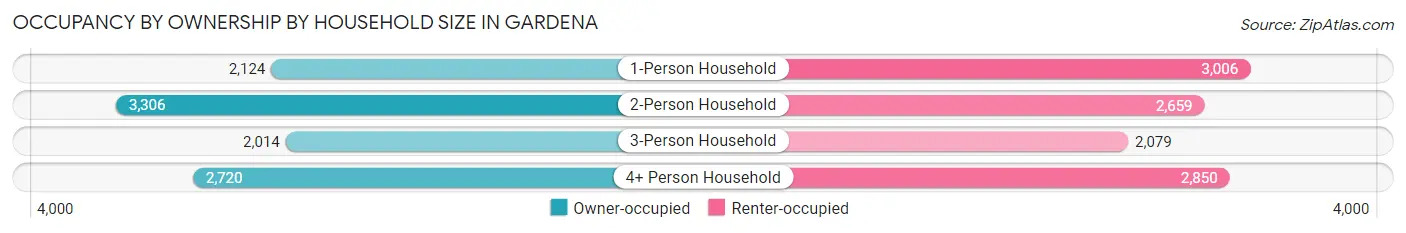
| Household Size | Owner-occupied | Renter-occupied |
| 1-Person Household | 2,124 (41.4%) | 3,006 (58.6%) |
| 2-Person Household | 3,306 (55.4%) | 2,659 (44.6%) |
| 3-Person Household | 2,014 (49.2%) | 2,079 (50.8%) |
| 4+ Person Household | 2,720 (48.8%) | 2,850 (51.2%) |
| Total Housing Units | 10,164 (49.0%) | 10,594 (51.0%) |
Occupancy by Educational Attainment in Gardena
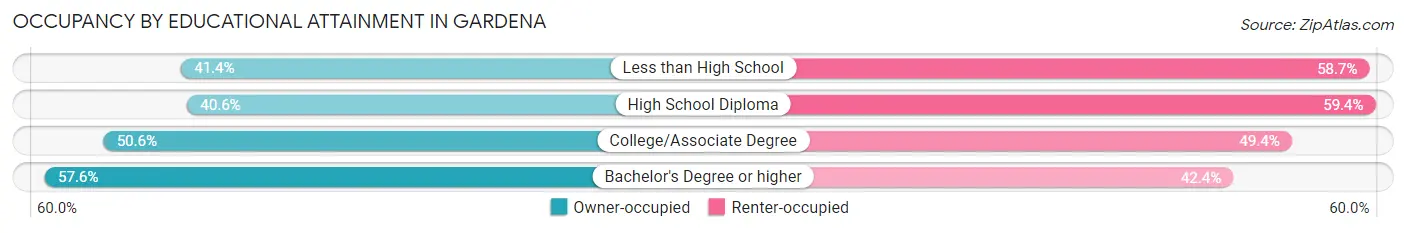
| Household Size | Owner-occupied | Renter-occupied |
| Less than High School | 1,429 (41.3%) | 2,027 (58.7%) |
| High School Diploma | 1,848 (40.6%) | 2,700 (59.4%) |
| College/Associate Degree | 3,292 (50.6%) | 3,216 (49.4%) |
| Bachelor's Degree or higher | 3,595 (57.6%) | 2,651 (42.4%) |
Occupancy by Age of Householder in Gardena
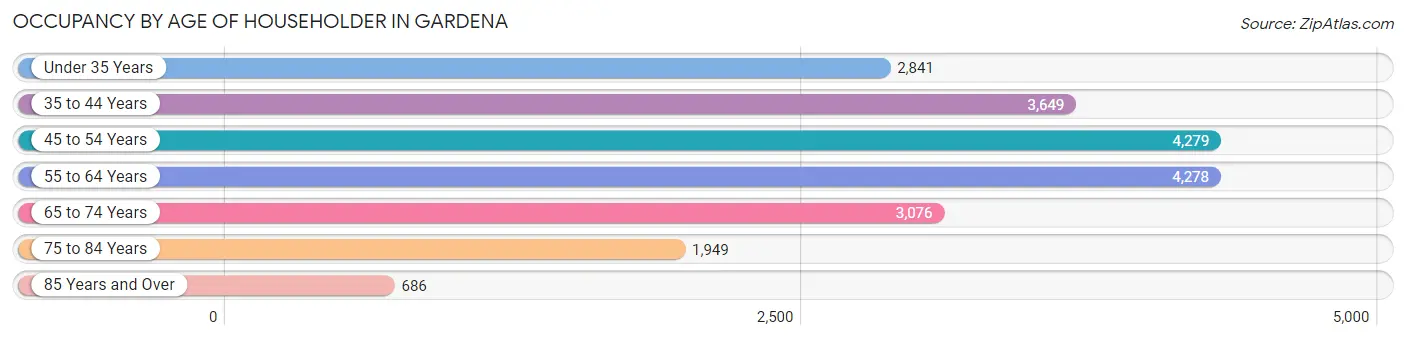
| Age Bracket | # Households | % Households |
| Under 35 Years | 2,841 | 13.7% |
| 35 to 44 Years | 3,649 | 17.6% |
| 45 to 54 Years | 4,279 | 20.6% |
| 55 to 64 Years | 4,278 | 20.6% |
| 65 to 74 Years | 3,076 | 14.8% |
| 75 to 84 Years | 1,949 | 9.4% |
| 85 Years and Over | 686 | 3.3% |
| Total | 20,758 | 100.0% |
Housing Finances in Gardena
Median Income by Occupancy in Gardena
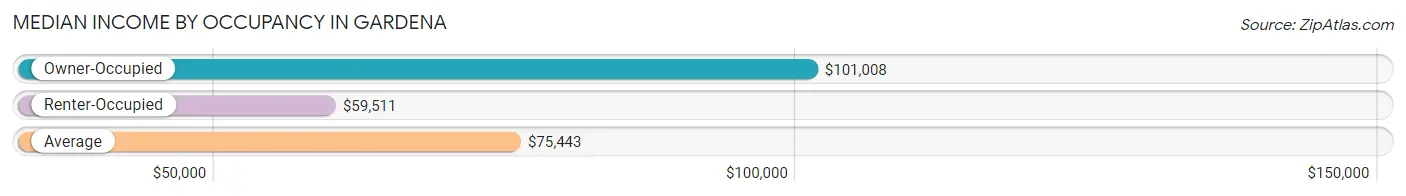
| Occupancy Type | # Households | Median Income |
| Owner-Occupied | 10,164 (49.0%) | $101,008 |
| Renter-Occupied | 10,594 (51.0%) | $59,511 |
| Average | 20,758 (100.0%) | $75,443 |
Occupancy by Householder Income Bracket in Gardena
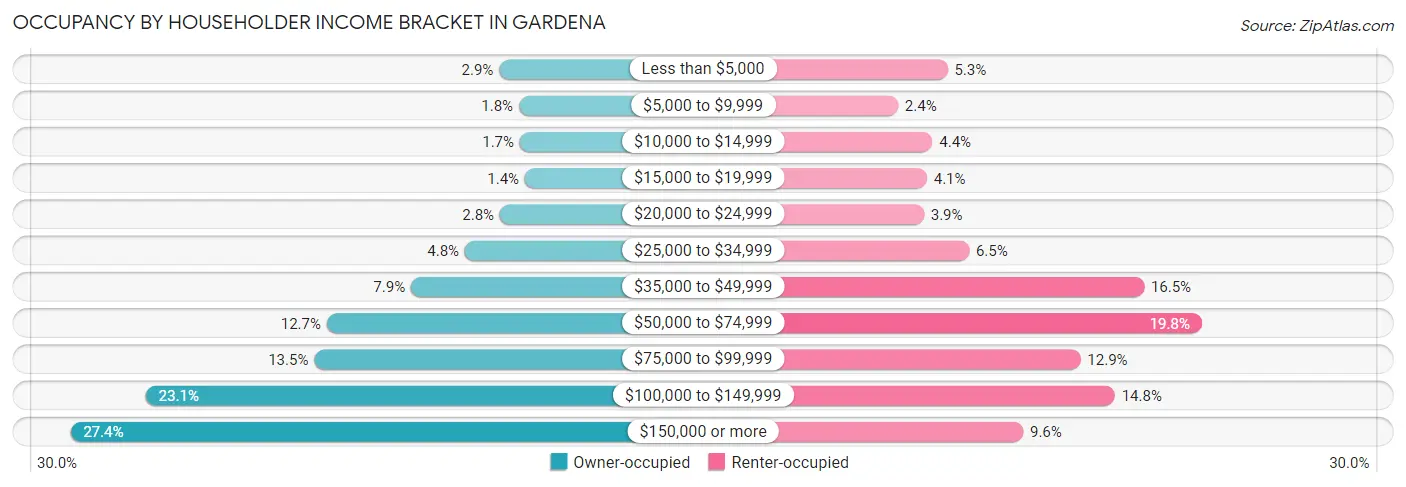
| Income Bracket | Owner-occupied | Renter-occupied |
| Less than $5,000 | 293 (2.9%) | 556 (5.2%) |
| $5,000 to $9,999 | 178 (1.8%) | 256 (2.4%) |
| $10,000 to $14,999 | 173 (1.7%) | 465 (4.4%) |
| $15,000 to $19,999 | 143 (1.4%) | 431 (4.1%) |
| $20,000 to $24,999 | 289 (2.8%) | 413 (3.9%) |
| $25,000 to $34,999 | 492 (4.8%) | 687 (6.5%) |
| $35,000 to $49,999 | 805 (7.9%) | 1,746 (16.5%) |
| $50,000 to $74,999 | 1,294 (12.7%) | 2,096 (19.8%) |
| $75,000 to $99,999 | 1,367 (13.5%) | 1,361 (12.9%) |
| $100,000 to $149,999 | 2,346 (23.1%) | 1,569 (14.8%) |
| $150,000 or more | 2,784 (27.4%) | 1,014 (9.6%) |
| Total | 10,164 (100.0%) | 10,594 (100.0%) |
Monthly Housing Cost Tiers in Gardena
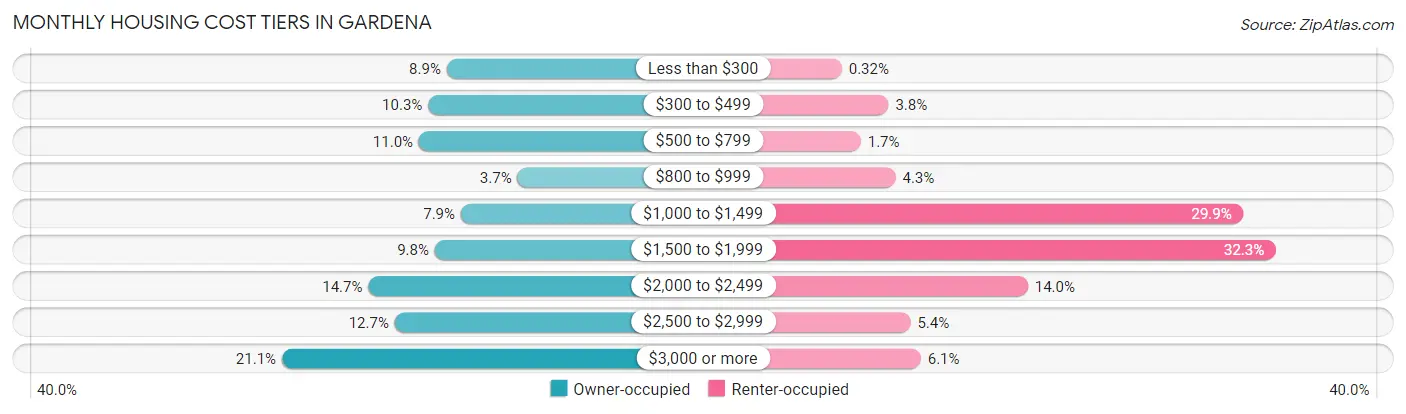
| Monthly Cost | Owner-occupied | Renter-occupied |
| Less than $300 | 906 (8.9%) | 34 (0.3%) |
| $300 to $499 | 1,045 (10.3%) | 398 (3.8%) |
| $500 to $799 | 1,114 (11.0%) | 182 (1.7%) |
| $800 to $999 | 376 (3.7%) | 453 (4.3%) |
| $1,000 to $1,499 | 800 (7.9%) | 3,169 (29.9%) |
| $1,500 to $1,999 | 995 (9.8%) | 3,422 (32.3%) |
| $2,000 to $2,499 | 1,493 (14.7%) | 1,485 (14.0%) |
| $2,500 to $2,999 | 1,295 (12.7%) | 570 (5.4%) |
| $3,000 or more | 2,140 (21.0%) | 650 (6.1%) |
| Total | 10,164 (100.0%) | 10,594 (100.0%) |
Physical Housing Characteristics in Gardena
Housing Structures in Gardena
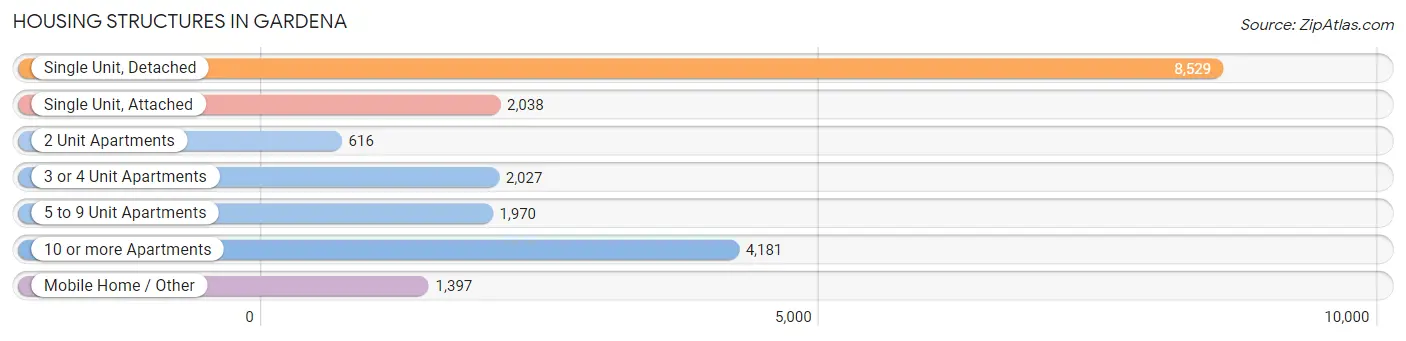
| Structure Type | # Housing Units | % Housing Units |
| Single Unit, Detached | 8,529 | 41.1% |
| Single Unit, Attached | 2,038 | 9.8% |
| 2 Unit Apartments | 616 | 3.0% |
| 3 or 4 Unit Apartments | 2,027 | 9.8% |
| 5 to 9 Unit Apartments | 1,970 | 9.5% |
| 10 or more Apartments | 4,181 | 20.1% |
| Mobile Home / Other | 1,397 | 6.7% |
| Total | 20,758 | 100.0% |
Housing Structures by Occupancy in Gardena
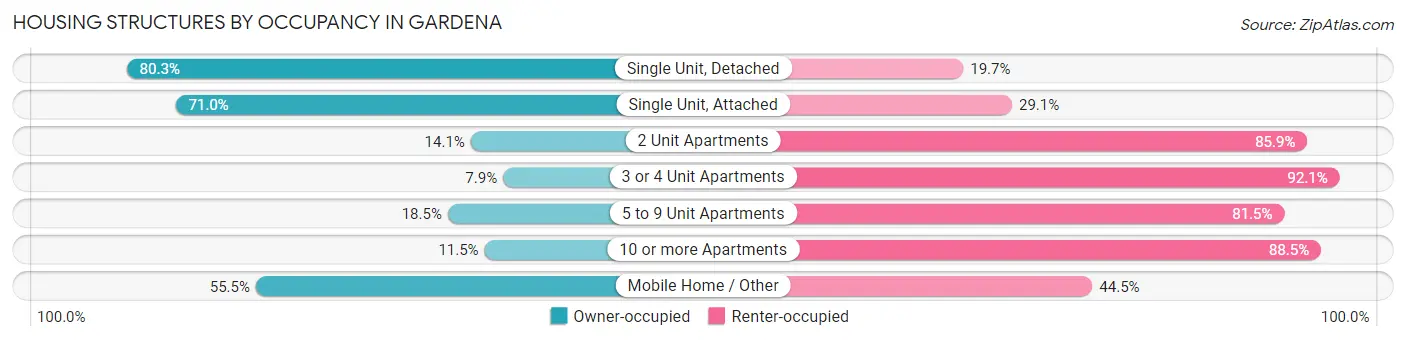
| Structure Type | Owner-occupied | Renter-occupied |
| Single Unit, Detached | 6,852 (80.3%) | 1,677 (19.7%) |
| Single Unit, Attached | 1,446 (71.0%) | 592 (29.0%) |
| 2 Unit Apartments | 87 (14.1%) | 529 (85.9%) |
| 3 or 4 Unit Apartments | 160 (7.9%) | 1,867 (92.1%) |
| 5 to 9 Unit Apartments | 365 (18.5%) | 1,605 (81.5%) |
| 10 or more Apartments | 479 (11.5%) | 3,702 (88.5%) |
| Mobile Home / Other | 775 (55.5%) | 622 (44.5%) |
| Total | 10,164 (49.0%) | 10,594 (51.0%) |
Housing Structures by Number of Rooms in Gardena
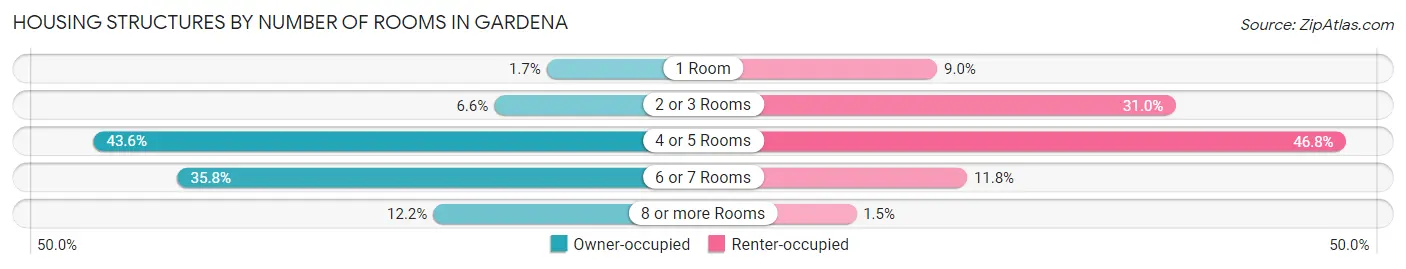
| Number of Rooms | Owner-occupied | Renter-occupied |
| 1 Room | 176 (1.7%) | 952 (9.0%) |
| 2 or 3 Rooms | 669 (6.6%) | 3,284 (31.0%) |
| 4 or 5 Rooms | 4,434 (43.6%) | 4,953 (46.8%) |
| 6 or 7 Rooms | 3,643 (35.8%) | 1,245 (11.7%) |
| 8 or more Rooms | 1,242 (12.2%) | 160 (1.5%) |
| Total | 10,164 (100.0%) | 10,594 (100.0%) |
Housing Structure by Heating Type in Gardena
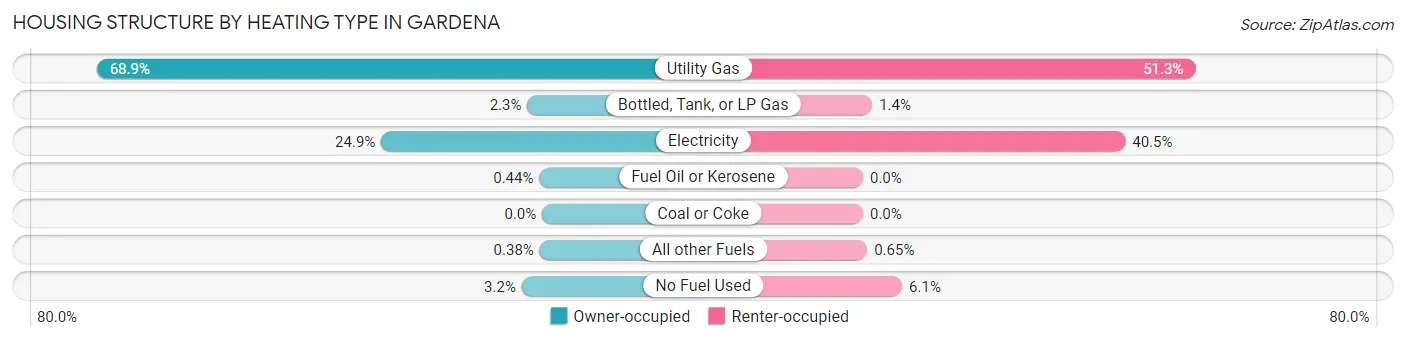
| Heating Type | Owner-occupied | Renter-occupied |
| Utility Gas | 6,998 (68.9%) | 5,439 (51.3%) |
| Bottled, Tank, or LP Gas | 233 (2.3%) | 150 (1.4%) |
| Electricity | 2,529 (24.9%) | 4,295 (40.5%) |
| Fuel Oil or Kerosene | 45 (0.4%) | 0 (0.0%) |
| Coal or Coke | 0 (0.0%) | 0 (0.0%) |
| All other Fuels | 39 (0.4%) | 69 (0.6%) |
| No Fuel Used | 320 (3.2%) | 641 (6.0%) |
| Total | 10,164 (100.0%) | 10,594 (100.0%) |
Household Vehicle Usage in Gardena
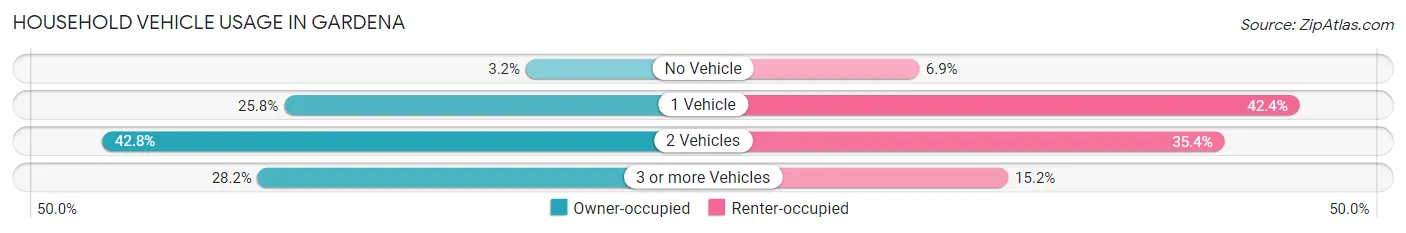
| Vehicles per Household | Owner-occupied | Renter-occupied |
| No Vehicle | 326 (3.2%) | 731 (6.9%) |
| 1 Vehicle | 2,620 (25.8%) | 4,496 (42.4%) |
| 2 Vehicles | 4,348 (42.8%) | 3,753 (35.4%) |
| 3 or more Vehicles | 2,870 (28.2%) | 1,614 (15.2%) |
| Total | 10,164 (100.0%) | 10,594 (100.0%) |
Real Estate & Mortgages in Gardena
Real Estate and Mortgage Overview in Gardena
| Characteristic | Without Mortgage | With Mortgage |
| Housing Units | 3,788 | 6,376 |
| Median Property Value | $560,100 | $646,800 |
| Median Household Income | $70,877 | $2,282 |
| Monthly Housing Costs | $492 | $2,117 |
| Real Estate Taxes | $1,977 | $48 |
Property Value by Mortgage Status in Gardena
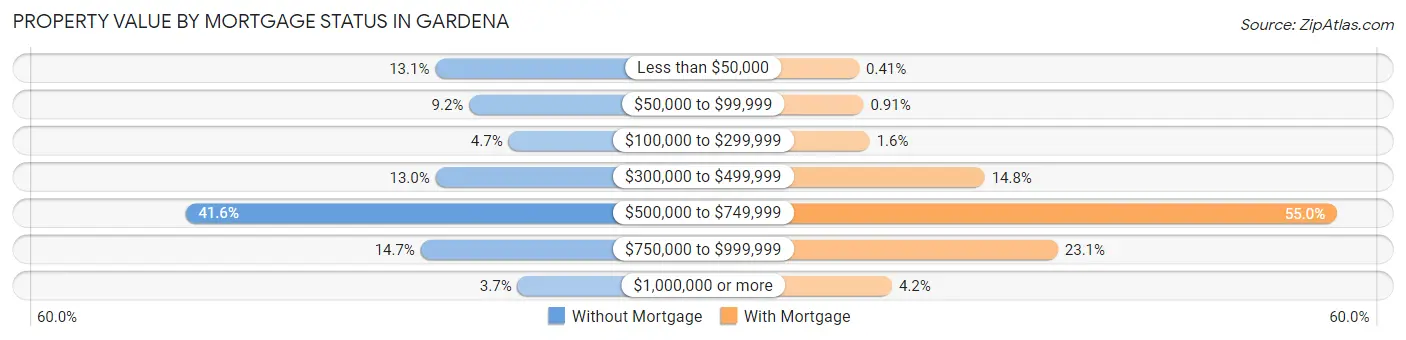
| Property Value | Without Mortgage | With Mortgage |
| Less than $50,000 | 495 (13.1%) | 26 (0.4%) |
| $50,000 to $99,999 | 348 (9.2%) | 58 (0.9%) |
| $100,000 to $299,999 | 178 (4.7%) | 103 (1.6%) |
| $300,000 to $499,999 | 494 (13.0%) | 941 (14.8%) |
| $500,000 to $749,999 | 1,576 (41.6%) | 3,508 (55.0%) |
| $750,000 to $999,999 | 558 (14.7%) | 1,474 (23.1%) |
| $1,000,000 or more | 139 (3.7%) | 266 (4.2%) |
| Total | 3,788 (100.0%) | 6,376 (100.0%) |
Household Income by Mortgage Status in Gardena
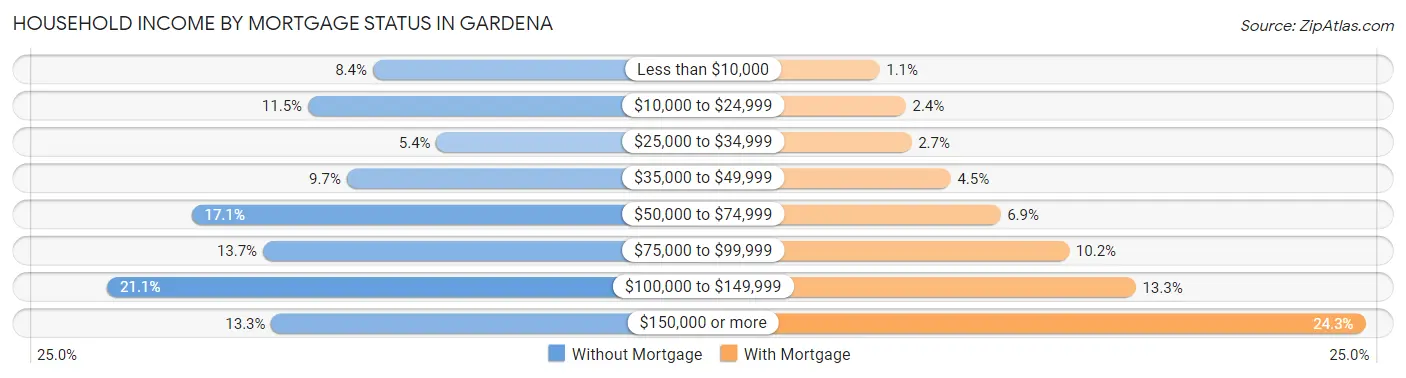
| Household Income | Without Mortgage | With Mortgage |
| Less than $10,000 | 319 (8.4%) | 72 (1.1%) |
| $10,000 to $24,999 | 436 (11.5%) | 152 (2.4%) |
| $25,000 to $34,999 | 204 (5.4%) | 169 (2.6%) |
| $35,000 to $49,999 | 366 (9.7%) | 288 (4.5%) |
| $50,000 to $74,999 | 646 (17.1%) | 439 (6.9%) |
| $75,000 to $99,999 | 517 (13.7%) | 648 (10.2%) |
| $100,000 to $149,999 | 798 (21.1%) | 850 (13.3%) |
| $150,000 or more | 502 (13.3%) | 1,548 (24.3%) |
| Total | 3,788 (100.0%) | 6,376 (100.0%) |
Property Value to Household Income Ratio in Gardena
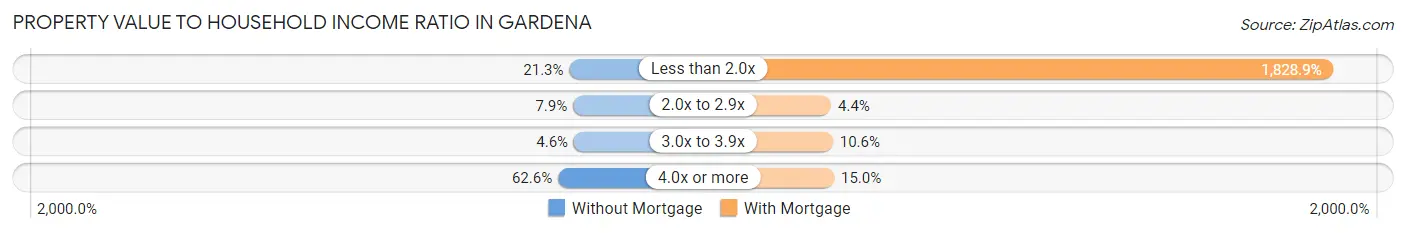
| Value-to-Income Ratio | Without Mortgage | With Mortgage |
| Less than 2.0x | 807 (21.3%) | 116,609 (1,828.9%) |
| 2.0x to 2.9x | 298 (7.9%) | 279 (4.4%) |
| 3.0x to 3.9x | 175 (4.6%) | 673 (10.6%) |
| 4.0x or more | 2,372 (62.6%) | 954 (15.0%) |
| Total | 3,788 (100.0%) | 6,376 (100.0%) |
Real Estate Taxes by Mortgage Status in Gardena
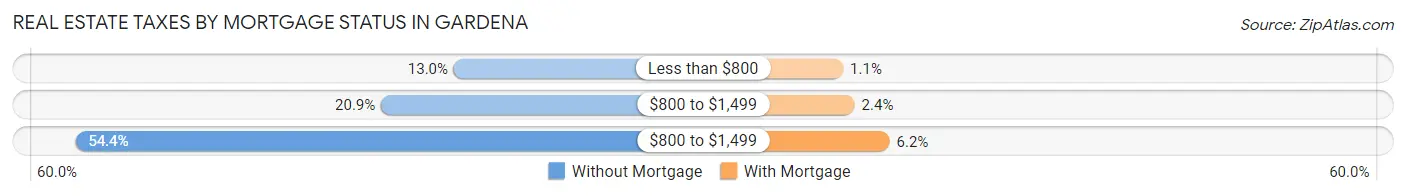
| Property Taxes | Without Mortgage | With Mortgage |
| Less than $800 | 491 (13.0%) | 71 (1.1%) |
| $800 to $1,499 | 793 (20.9%) | 151 (2.4%) |
| $800 to $1,499 | 2,062 (54.4%) | 395 (6.2%) |
| Total | 3,788 (100.0%) | 6,376 (100.0%) |
Health & Disability in Gardena
Health Insurance Coverage by Age in Gardena
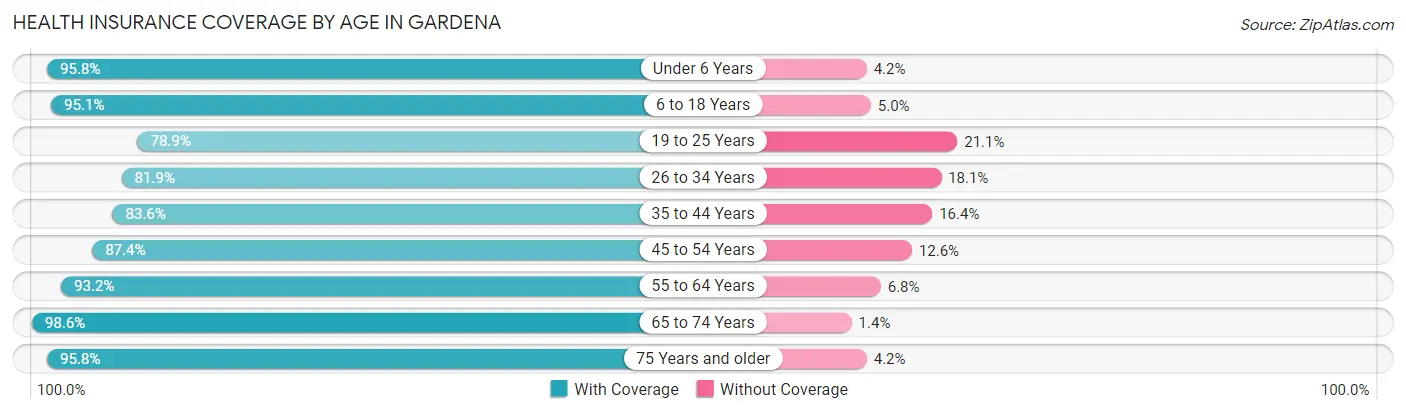
| Age Bracket | With Coverage | Without Coverage |
| Under 6 Years | 3,186 (95.8%) | 139 (4.2%) |
| 6 to 18 Years | 9,035 (95.1%) | 471 (5.0%) |
| 19 to 25 Years | 4,249 (78.9%) | 1,134 (21.1%) |
| 26 to 34 Years | 6,603 (81.9%) | 1,456 (18.1%) |
| 35 to 44 Years | 6,343 (83.6%) | 1,244 (16.4%) |
| 45 to 54 Years | 7,275 (87.4%) | 1,051 (12.6%) |
| 55 to 64 Years | 7,508 (93.2%) | 549 (6.8%) |
| 65 to 74 Years | 5,399 (98.6%) | 75 (1.4%) |
| 75 Years and older | 3,838 (95.8%) | 168 (4.2%) |
| Total | 53,436 (89.5%) | 6,287 (10.5%) |
Health Insurance Coverage by Citizenship Status in Gardena
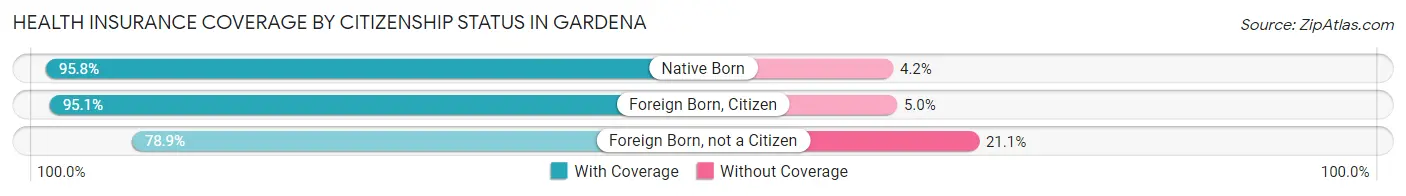
| Citizenship Status | With Coverage | Without Coverage |
| Native Born | 3,186 (95.8%) | 139 (4.2%) |
| Foreign Born, Citizen | 9,035 (95.1%) | 471 (5.0%) |
| Foreign Born, not a Citizen | 4,249 (78.9%) | 1,134 (21.1%) |
Health Insurance Coverage by Household Income in Gardena
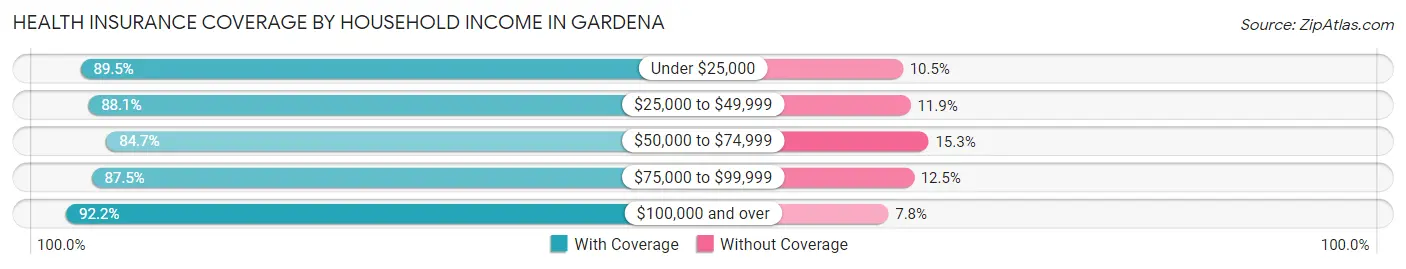
| Household Income | With Coverage | Without Coverage |
| Under $25,000 | 5,077 (89.5%) | 594 (10.5%) |
| $25,000 to $49,999 | 6,871 (88.1%) | 931 (11.9%) |
| $50,000 to $74,999 | 8,138 (84.7%) | 1,471 (15.3%) |
| $75,000 to $99,999 | 8,140 (87.5%) | 1,166 (12.5%) |
| $100,000 and over | 24,986 (92.2%) | 2,106 (7.8%) |
Public vs Private Health Insurance Coverage by Age in Gardena
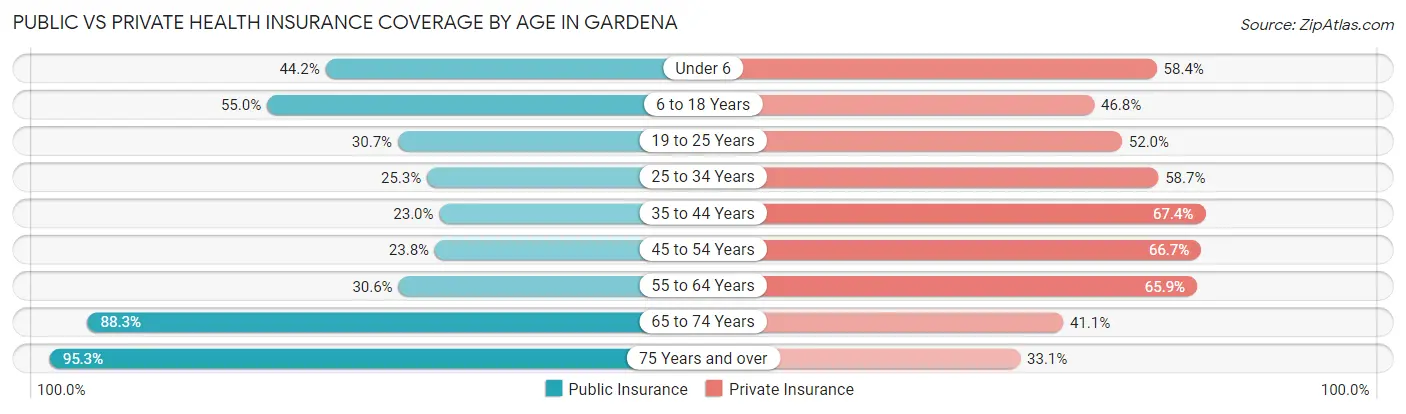
| Age Bracket | Public Insurance | Private Insurance |
| Under 6 | 1,468 (44.2%) | 1,943 (58.4%) |
| 6 to 18 Years | 5,229 (55.0%) | 4,451 (46.8%) |
| 19 to 25 Years | 1,653 (30.7%) | 2,798 (52.0%) |
| 25 to 34 Years | 2,039 (25.3%) | 4,734 (58.7%) |
| 35 to 44 Years | 1,746 (23.0%) | 5,117 (67.4%) |
| 45 to 54 Years | 1,985 (23.8%) | 5,552 (66.7%) |
| 55 to 64 Years | 2,466 (30.6%) | 5,310 (65.9%) |
| 65 to 74 Years | 4,833 (88.3%) | 2,248 (41.1%) |
| 75 Years and over | 3,818 (95.3%) | 1,326 (33.1%) |
| Total | 25,237 (42.3%) | 33,479 (56.1%) |
Disability Status by Sex by Age in Gardena
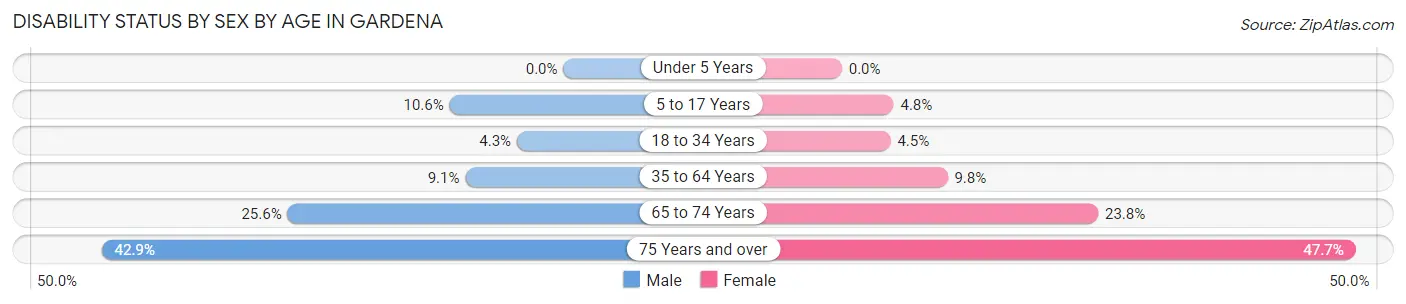
| Age Bracket | Male | Female |
| Under 5 Years | 0 (0.0%) | 0 (0.0%) |
| 5 to 17 Years | 501 (10.6%) | 220 (4.8%) |
| 18 to 34 Years | 299 (4.3%) | 329 (4.5%) |
| 35 to 64 Years | 1,043 (9.1%) | 1,227 (9.8%) |
| 65 to 74 Years | 680 (25.6%) | 670 (23.8%) |
| 75 Years and over | 701 (42.8%) | 1,130 (47.7%) |
Disability Class by Sex by Age in Gardena
Disability Class: Hearing Difficulty
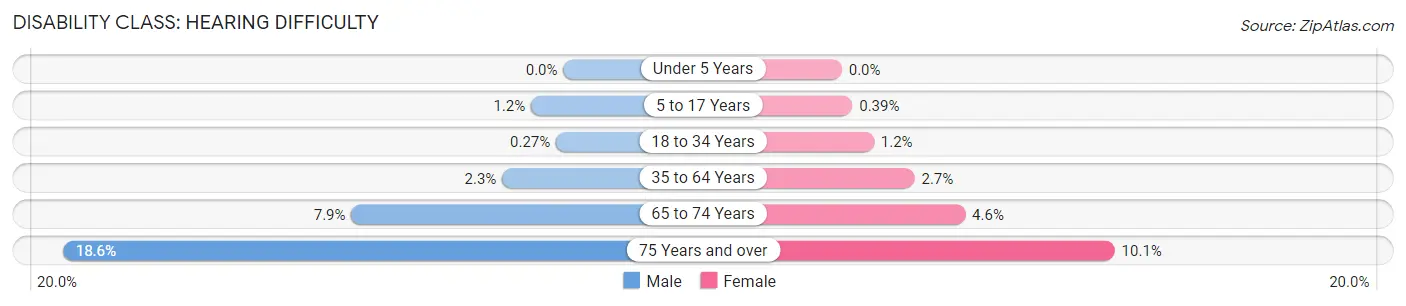
| Age Bracket | Male | Female |
| Under 5 Years | 0 (0.0%) | 0 (0.0%) |
| 5 to 17 Years | 57 (1.2%) | 18 (0.4%) |
| 18 to 34 Years | 19 (0.3%) | 87 (1.2%) |
| 35 to 64 Years | 260 (2.3%) | 338 (2.7%) |
| 65 to 74 Years | 209 (7.9%) | 129 (4.6%) |
| 75 Years and over | 304 (18.6%) | 240 (10.1%) |
Disability Class: Vision Difficulty
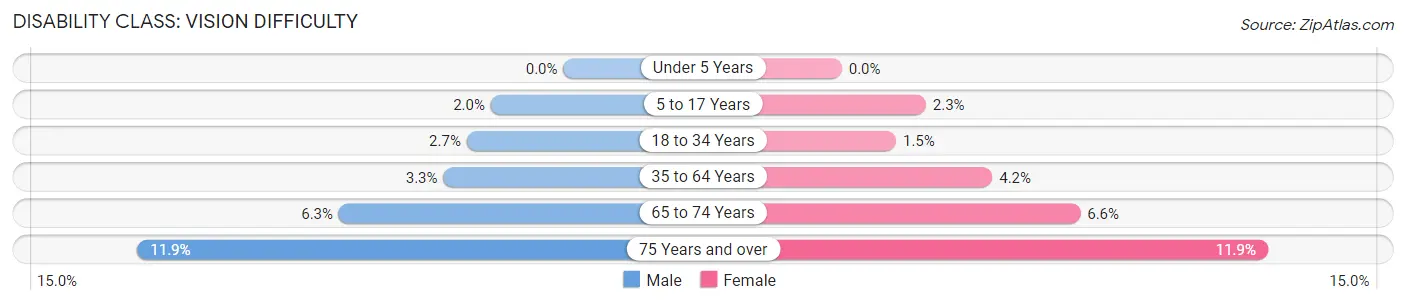
| Age Bracket | Male | Female |
| Under 5 Years | 0 (0.0%) | 0 (0.0%) |
| 5 to 17 Years | 96 (2.0%) | 107 (2.3%) |
| 18 to 34 Years | 187 (2.7%) | 110 (1.5%) |
| 35 to 64 Years | 383 (3.3%) | 524 (4.2%) |
| 65 to 74 Years | 166 (6.2%) | 187 (6.6%) |
| 75 Years and over | 194 (11.9%) | 281 (11.9%) |
Disability Class: Cognitive Difficulty
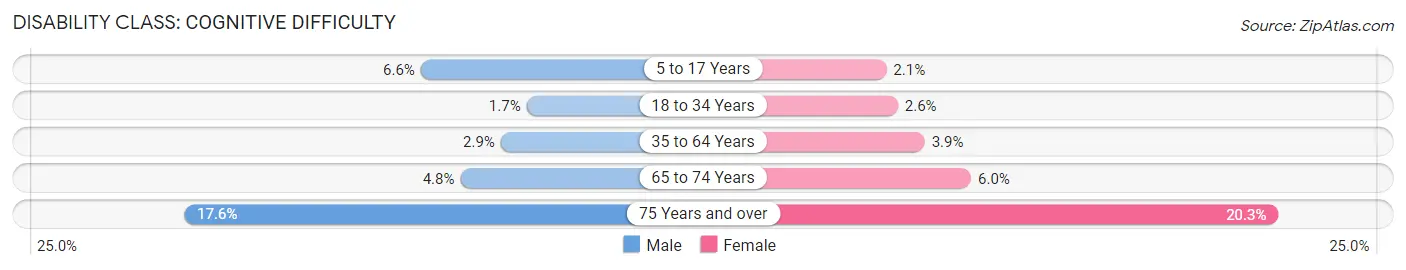
| Age Bracket | Male | Female |
| 5 to 17 Years | 314 (6.6%) | 95 (2.1%) |
| 18 to 34 Years | 119 (1.7%) | 189 (2.6%) |
| 35 to 64 Years | 333 (2.9%) | 481 (3.8%) |
| 65 to 74 Years | 127 (4.8%) | 169 (6.0%) |
| 75 Years and over | 288 (17.6%) | 480 (20.3%) |
Disability Class: Ambulatory Difficulty
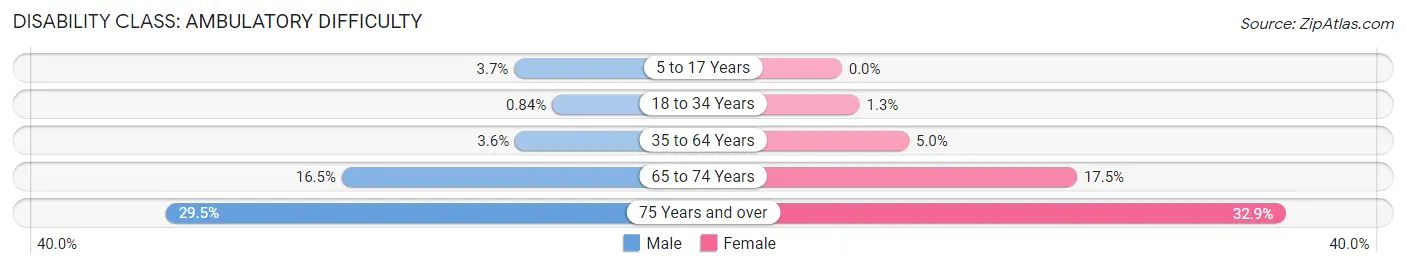
| Age Bracket | Male | Female |
| 5 to 17 Years | 173 (3.6%) | 0 (0.0%) |
| 18 to 34 Years | 58 (0.8%) | 96 (1.3%) |
| 35 to 64 Years | 412 (3.6%) | 624 (5.0%) |
| 65 to 74 Years | 437 (16.5%) | 492 (17.5%) |
| 75 Years and over | 483 (29.5%) | 780 (32.9%) |
Disability Class: Self-Care Difficulty
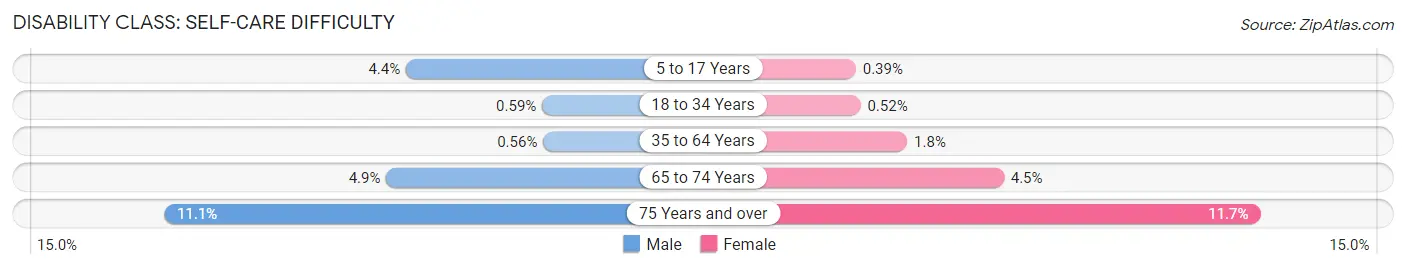
| Age Bracket | Male | Female |
| 5 to 17 Years | 208 (4.4%) | 18 (0.4%) |
| 18 to 34 Years | 41 (0.6%) | 38 (0.5%) |
| 35 to 64 Years | 64 (0.6%) | 228 (1.8%) |
| 65 to 74 Years | 131 (4.9%) | 127 (4.5%) |
| 75 Years and over | 182 (11.1%) | 276 (11.7%) |
Technology Access in Gardena
Computing Device Access in Gardena
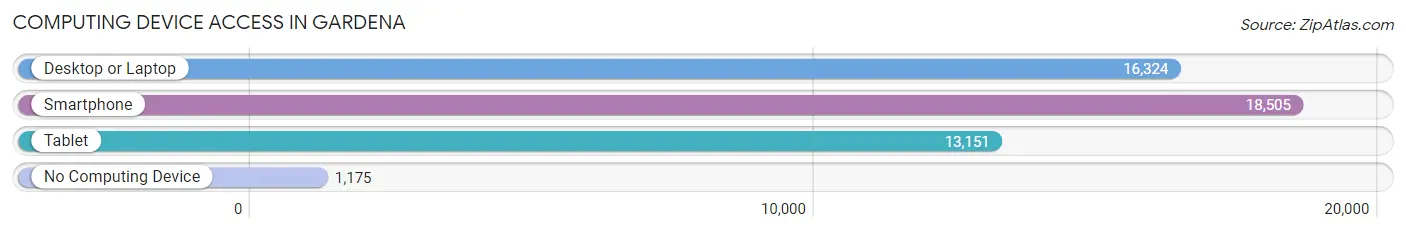
| Device Type | # Households | % Households |
| Desktop or Laptop | 16,324 | 78.6% |
| Smartphone | 18,505 | 89.1% |
| Tablet | 13,151 | 63.3% |
| No Computing Device | 1,175 | 5.7% |
| Total | 20,758 | 100.0% |
Internet Access in Gardena
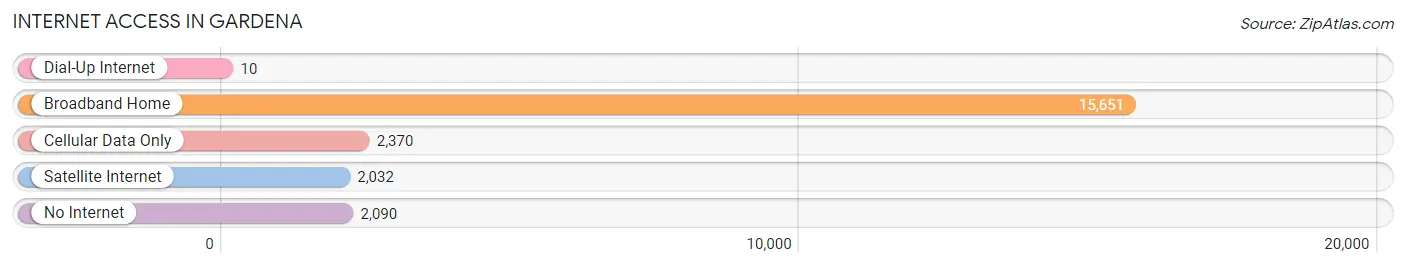
| Internet Type | # Households | % Households |
| Dial-Up Internet | 10 | 0.1% |
| Broadband Home | 15,651 | 75.4% |
| Cellular Data Only | 2,370 | 11.4% |
| Satellite Internet | 2,032 | 9.8% |
| No Internet | 2,090 | 10.1% |
| Total | 20,758 | 100.0% |
Gardena Summary
Gardena is a city located in the South Bay region of Los Angeles County, California. It is bordered by the cities of Torrance, Hawthorne, Lawndale, and Redondo Beach. The population of Gardena was 58,829 at the 2010 census, up from 57,746 at the 2000 census.
History
Gardena was founded in 1930 by Japanese-American farmers and was incorporated as a city in 1930. The city was named after its founder, the Gardena Valley Irrigation Company. The company was founded in 1906 to provide water for the local farmers. The city was originally a farming community, but it has since become a residential and commercial center.
Geography
Gardena is located at 33°53′N 118°18′W (33.88, -118.30). According to the United States Census Bureau, the city has a total area of 5.2 square miles (13.4 km2), all of it land.
Economy
Gardena is a major center for the automotive industry, with many car dealerships, auto parts stores, and repair shops located in the city. The city is also home to several manufacturing companies, including Honda, Toyota, and Yamaha.
Gardena is also home to several retail stores, including Target, Walmart, and Home Depot. The city is also home to several restaurants, including fast food chains, family-style restaurants, and fine dining establishments.
Demographics
As of the 2010 census, there were 58,829 people, 20,845 households, and 14,845 families residing in the city. The population density was 11,344.2 people per square mile (4,380.2/km2). There were 22,845 housing units at an average density of 4,421.3 per square mile (1,704.2/km2). The racial makeup of the city was 44.2% White, 11.2% African American, 0.8% Native American, 25.2% Asian, 0.7% Pacific Islander, 11.2% from other races, and 6.7% from two or more races. Hispanic or Latino of any race were 28.2% of the population.
The median income for a household in the city was $45,945, and the median income for a family was $51,824. Males had a median income of $37,845 versus $31,935 for females. The per capita income for the city was $20,945. About 11.2% of families and 13.7% of the population were below the poverty line, including 18.2% of those under age 18 and 8.7% of those age 65 or over.
Common Questions
What is Per Capita Income in Gardena?
Per Capita income in Gardena is $33,617.
What is the Median Family Income in Gardena?
Median Family Income in Gardena is $90,313.
What is the Median Household income in Gardena?
Median Household Income in Gardena is $75,443.
What is Income or Wage Gap in Gardena?
Income or Wage Gap in Gardena is 21.5%.
Women in Gardena earn 78.5 cents for every dollar earned by a man.
What is Family Income Deficit in Gardena?
Family Income Deficit in Gardena is $11,214.
Families that are below poverty line in Gardena earn $11,214 less on average than the poverty threshold level.
What is Inequality or Gini Index in Gardena?
Inequality or Gini Index in Gardena is 0.43.
What is the Total Population of Gardena?
Total Population of Gardena is 60,377.
What is the Total Male Population of Gardena?
Total Male Population of Gardena is 28,891.
What is the Total Female Population of Gardena?
Total Female Population of Gardena is 31,486.
What is the Ratio of Males per 100 Females in Gardena?
There are 91.76 Males per 100 Females in Gardena.
What is the Ratio of Females per 100 Males in Gardena?
There are 108.98 Females per 100 Males in Gardena.
What is the Median Population Age in Gardena?
Median Population Age in Gardena is 40.1 Years.
What is the Average Family Size in Gardena
Average Family Size in Gardena is 3.4 People.
What is the Average Household Size in Gardena
Average Household Size in Gardena is 2.9 People.
How Large is the Labor Force in Gardena?
There are 32,079 People in the Labor Forcein in Gardena.
What is the Percentage of People in the Labor Force in Gardena?
65.0% of People are in the Labor Force in Gardena.
What is the Unemployment Rate in Gardena?
Unemployment Rate in Gardena is 4.3%.