Zip Codes with the Highest Percentage of Population Employed in Farming, Fishing & Forestry in Fresno, CA

RELATED REPORTS & OPTIONS

Farming, Fishing & Forestry
Population
Families and Households
Female Fertility
Female Fertility (Unmarried)
Race (Community Size)
Race (Percentage)
Ancestry (Community Size)
AfghanAfricanAmericanApacheArabArapahoArgentineanArmenianAustralianAustrianBangladeshiBasqueBelgianBelizeanBhutaneseBlackfeetBolivianBrazilianBritishBulgarianBurmeseCanadianCelticCentral AmericanCentral American IndianCherokeeChickasawChileanChineseChippewaChoctawColombianComancheCosta RicanCreekCroatianCrowCubanCzechCzechoslovakianDanishDelawareDominicanDutchDutch West IndianEastern EuropeanEcuadorianEgyptianEnglishEstonianEthiopianEuropeanFilipinoFinnishFrenchFrench American IndianFrench CanadianGermanGerman RussianGreekGuamanian / ChamorroGuatemalanGuyaneseHaitianHonduranHopiHungarianIndian (Asian)IndonesianIranianIraqiIrishIroquoisIsraeliItalianJamaicanJapaneseJordanianKenyanKoreanLaotianLatvianLebaneseLithuanianMalaysianMexicanMexican American IndianMongolianMoroccanNative HawaiianNavajoNepaleseNew ZealanderNicaraguanNigerianNorthern EuropeanNorwegianOsagePakistaniPalestinianPanamanianPennsylvania GermanPeruvianPolishPortuguesePotawatomiPuebloPuerto RicanRomanianRussianSalvadoranSamoanScandinavianScotch-IrishScottishSeminoleSerbianSiouxSlavicSloveneSouth AmericanSouth American IndianSpaniardSpanishSpanish AmericanSpanish American IndianSri LankanSubsaharan AfricanSwedishSwissSyrianThaiTohono O'OdhamTonganTurkishUkrainianVenezuelanVietnameseWelshWest IndianYaquiYugoslavian
Ancestry (Percentage)
AfghanAfricanAmericanApacheArabArapahoArgentineanArmenianAustralianAustrianBangladeshiBasqueBelgianBelizeanBhutaneseBlackfeetBolivianBrazilianBritishBulgarianBurmeseCanadianCelticCentral AmericanCentral American IndianCherokeeChickasawChileanChineseChippewaChoctawColombianComancheCosta RicanCreekCroatianCrowCubanCzechCzechoslovakianDanishDelawareDominicanDutchDutch West IndianEastern EuropeanEcuadorianEgyptianEnglishEstonianEthiopianEuropeanFilipinoFinnishFrenchFrench American IndianFrench CanadianGermanGerman RussianGreekGuamanian / ChamorroGuatemalanGuyaneseHaitianHonduranHopiHungarianIndian (Asian)IndonesianIranianIraqiIrishIroquoisIsraeliItalianJamaicanJapaneseJordanianKenyanKoreanLaotianLatvianLebaneseLithuanianMalaysianMexicanMexican American IndianMongolianMoroccanNative HawaiianNavajoNepaleseNew ZealanderNicaraguanNigerianNorthern EuropeanNorwegianOsagePakistaniPalestinianPanamanianPennsylvania GermanPeruvianPolishPortuguesePotawatomiPuebloPuerto RicanRomanianRussianSalvadoranSamoanScandinavianScotch-IrishScottishSeminoleSerbianSiouxSlavicSloveneSouth AmericanSouth American IndianSpaniardSpanishSpanish AmericanSpanish American IndianSri LankanSubsaharan AfricanSwedishSwissSyrianThaiTohono O'OdhamTonganTurkishUkrainianVenezuelanVietnameseWelshWest IndianYaquiYugoslavian
Immigrant Origin (Total)
AfghanistanAfricaArgentinaArmeniaAsiaAustraliaAustriaAzoresBangladeshBelgiumBoliviaBrazilBurma / MyanmarCambodiaCanadaCaribbeanCentral AmericaChileChinaColombiaCroatiaCubaCzechoslovakiaDenmarkEastern AfricaEastern AsiaEastern EuropeEcuadorEgyptEl SalvadorEnglandEritreaEthiopiaEuropeFijiFranceGermanyGhanaGreeceGuatemalaHondurasHong KongIndiaIndonesiaIranIraqIrelandIsraelItalyJamaicaJapanJordanKenyaKoreaKuwaitLaosLatin AmericaLatviaLebanonLiberiaMalaysiaMexicoMiddle AfricaMoldovaMoroccoNepalNetherlandsNicaraguaNigeriaNorthern AfricaNorthern EuropeNorwayOceaniaPakistanPanamaPeruPhilippinesPolandPortugalRomaniaRussiaSaudi ArabiaScotlandSouth AmericaSouth Central AsiaSouth Eastern AsiaSouthern EuropeSpainSri LankaSwedenSwitzerlandSyriaTaiwanThailandTrinidad and TobagoUgandaUkraineVenezuelaVietnamWestern AfricaWestern AsiaWestern EuropeYemen
Immigrant Origin (Percentage)
AfghanistanAfricaArgentinaArmeniaAsiaAustraliaAustriaAzoresBangladeshBelgiumBoliviaBrazilBurma / MyanmarCambodiaCanadaCaribbeanCentral AmericaChileChinaColombiaCroatiaCubaCzechoslovakiaDenmarkEastern AfricaEastern AsiaEastern EuropeEcuadorEgyptEl SalvadorEnglandEritreaEthiopiaEuropeFijiFranceGermanyGhanaGreeceGuatemalaHondurasHong KongIndiaIndonesiaIranIraqIrelandIsraelItalyJamaicaJapanJordanKenyaKoreaKuwaitLaosLatin AmericaLatviaLebanonLiberiaMalaysiaMexicoMiddle AfricaMoldovaMoroccoNepalNetherlandsNicaraguaNigeriaNorthern AfricaNorthern EuropeNorwayOceaniaPakistanPanamaPeruPhilippinesPolandPortugalRomaniaRussiaSaudi ArabiaScotlandSouth AmericaSouth Central AsiaSouth Eastern AsiaSouthern EuropeSpainSri LankaSwedenSwitzerlandSyriaTaiwanThailandTrinidad and TobagoUgandaUkraineVenezuelaVietnamWestern AfricaWestern AsiaWestern EuropeYemen
Income
Income (Families)
Income (Households)
Poverty
Poverty (Families)
Unemployment
Employment Occupations
Employment Industries
Employer Class
Commute Time
Commute Means
School Enrollment
Education by Degree Field
Occupancy
Finances
Physical Characteristics
Fresno
States
California Cities
AlhambraAnaheimApple ValleyAuburnBakersfieldBerkeleyBuena ParkCamarilloCanoga ParkCanyon CountryCastro ValleyChicoChula VistaCitrus HeightsClovisComptonConcordCoronaCosta MesaCovinaDaly CityDavisDesert Hot SpringsDuarteEl CajonEl MonteElk GroveEscondidoEurekaFairfieldFontanaFremontFresnoFullertonGarden GroveGardenaGlendaleGlendoraGrass ValleyHaywardHemetHesperiaHuntington BeachIndioInglewoodIrvineLa MesaLa PuenteLake ElsinoreLakewoodLancasterLivermoreLodiLong BeachLos AngelesLos GatosMaderaMantecaMenifeeMercedMission ViejoModestoMoreno ValleyMountain ViewMurrietaNapaNorth HollywoodNovatoOaklandOceansideOntarioOrangeOrovilleOxnardPalm SpringsPalmdalePalo AltoPerrisPetalumaPomonaPortervilleRancho CordovaRancho CucamongaReddingRedlandsRedwood CityRialtoRichmondRiversideRocklinRosevilleSacramentoSalinasSan BernardinoSan DiegoSan FranciscoSan GabrielSan JacintoSan JoseSan LeandroSan Luis ObispoSan MarcosSan MateoSan PedroSan RafaelSanta AnaSanta BarbaraSanta ClaraSanta CruzSanta MariaSanta MonicaSanta RosaSimi ValleySpring ValleyStocktonSunnyvaleTemeculaThousand OaksTorranceTracyTurlockTustinUplandVacavilleVallejoVan NuysVenturaVictorvilleVisaliaVistaWalnut CreekWest CovinaWest SacramentoWhittierWoodlandYorba LindaYuba City
Compare Zip Codes
Comparison Subject

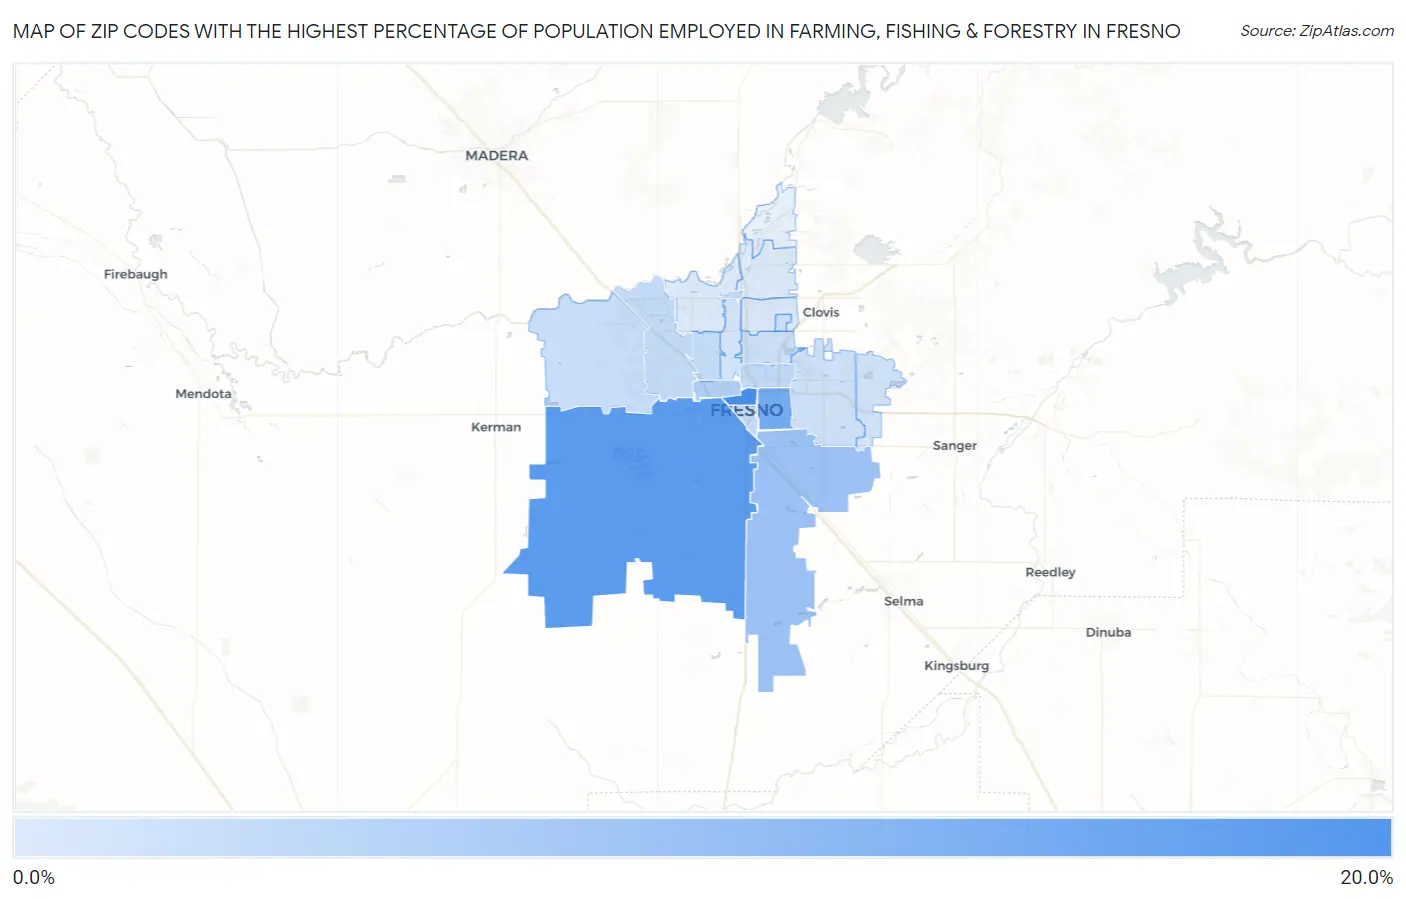
Map of Zip Codes with the Highest Percentage of Population Employed in Farming, Fishing & Forestry in Fresno

0.0%
20.0%
Zip Codes with the Highest Percentage of Population Employed in Farming, Fishing & Forestry in Fresno Map

Zip Codes with the Highest Percentage of Population Employed in Farming, Fishing & Forestry in Fresno, CA

Zip Code % Employed vs State vs National
1.9370116.7%1.4%(+15.3)#970.61%(+16.1)#545
2.9370614.5%1.4%(+13.0)#1130.61%(+13.9)#685
3.9370211.4%1.4%(+9.97)#1440.61%(+10.8)#1,008
4.937257.3%1.4%(+5.94)#1980.61%(+6.74)#1,870
5.937284.7%1.4%(+3.30)#2560.61%(+4.11)#3,145
6.937033.2%1.4%(+1.79)#3020.61%(+2.60)#4,545
7.936503.0%1.4%(+1.60)#3110.61%(+2.41)#4,790
8.937212.8%1.4%(+1.38)#3250.61%(+2.19)#5,117
9.937222.7%1.4%(+1.32)#3270.61%(+2.13)#5,197
10.937052.6%1.4%(+1.16)#3360.61%(+1.96)#5,434
11.937232.4%1.4%(+0.993)#3480.61%(+1.80)#5,723
12.937402.0%1.4%(+0.614)#3770.61%(+1.42)#6,490
13.937261.9%1.4%(+0.443)#3880.61%(+1.25)#6,882
14.937271.6%1.4%(+0.154)#4180.61%(+0.959)#7,707
15.937371.3%1.4%(-0.098)#4550.61%(+0.707)#8,526
16.937041.1%1.4%(-0.319)#4860.61%(+0.486)#9,360
17.937100.46%1.4%(-0.948)#7080.61%(-0.144)#13,167
18.937200.28%1.4%(-1.13)#8600.61%(-0.321)#15,012
19.937110.22%1.4%(-1.19)#9340.61%(-0.388)#15,876

Common Questions

What are the Top 10 Zip Codes with the Highest Percentage of Population Employed in Farming, Fishing & Forestry in Fresno, CA?
Top 10 Zip Codes with the Highest Percentage of Population Employed in Farming, Fishing & Forestry in Fresno, CA are:
#1
16.7%
#2
14.5%
#3
11.4%
#4
7.3%
#5
4.7%
#6
3.2%
#7
3.0%
#8
2.8%
#9
2.7%
#10
2.6%
What zip code has the Highest Percentage of Population Employed in Farming, Fishing & Forestry in Fresno, CA?
93701 has the Highest Percentage of Population Employed in Farming, Fishing & Forestry in Fresno, CA with 16.7%.
What is the Percentage of Population Employed in Farming, Fishing & Forestry in Fresno, CA?
Percentage of Population Employed in Farming, Fishing & Forestry in Fresno is 3.2%.
What is the Percentage of Population Employed in Farming, Fishing & Forestry in California?
Percentage of Population Employed in Farming, Fishing & Forestry in California is 1.4%.
What is the Percentage of Population Employed in Farming, Fishing & Forestry in the United States?
Percentage of Population Employed in Farming, Fishing & Forestry in the United States is 0.61%.