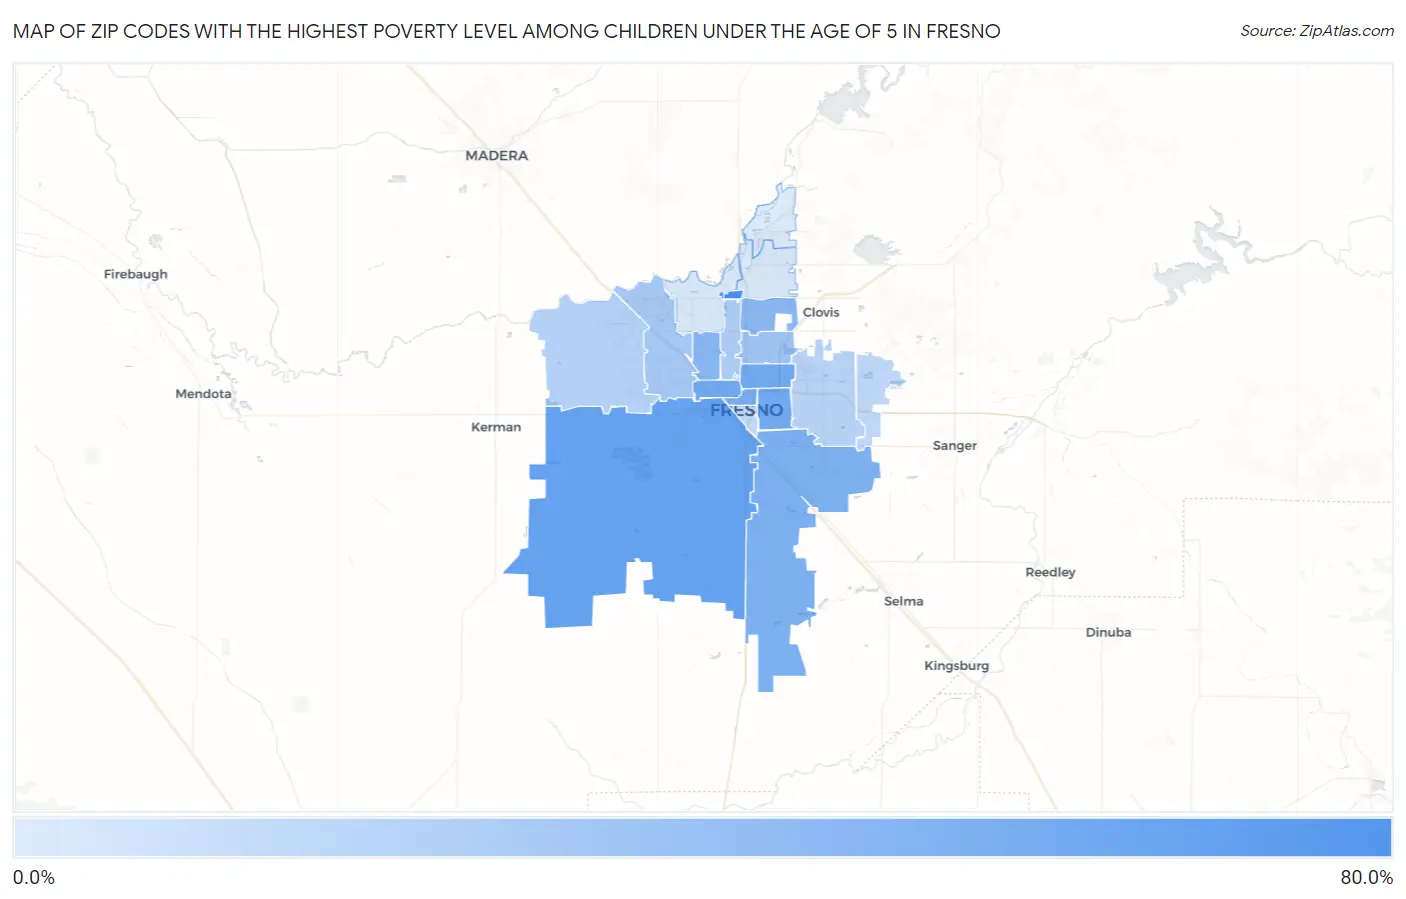
Zip Codes with the Highest Poverty Level Among Children Under the Age of 5 in Fresno, CA
RELATED REPORTS & OPTIONS
Highest Poverty | Child 0-5
Fresno
Compare Zip Codes
Map of Zip Codes with the Highest Poverty Level Among Children Under the Age of 5 in Fresno
7.0%
69.6%
Zip Codes with the Highest Poverty Level Among Children Under the Age of 5 in Fresno, CA
| Zip Code | Child Poverty | vs State | vs National | |
| 1. | 93650 | 69.6% | 15.6%(+54.0)#52 | 18.1%(+51.5)#1,165 |
| 2. | 93706 | 54.7% | 15.6%(+39.1)#81 | 18.1%(+36.6)#2,090 |
| 3. | 93703 | 48.7% | 15.6%(+33.1)#103 | 18.1%(+30.7)#2,728 |
| 4. | 93702 | 48.1% | 15.6%(+32.5)#106 | 18.1%(+30.0)#2,797 |
| 5. | 93728 | 47.8% | 15.6%(+32.1)#108 | 18.1%(+29.7)#2,840 |
| 6. | 93701 | 45.3% | 15.6%(+29.7)#117 | 18.1%(+27.2)#3,136 |
| 7. | 93725 | 44.3% | 15.6%(+28.6)#119 | 18.1%(+26.2)#3,303 |
| 8. | 93705 | 38.9% | 15.6%(+23.3)#146 | 18.1%(+20.8)#4,225 |
| 9. | 93710 | 38.2% | 15.6%(+22.6)#152 | 18.1%(+20.2)#4,353 |
| 10. | 93726 | 29.7% | 15.6%(+14.1)#244 | 18.1%(+11.7)#6,442 |
| 11. | 93722 | 27.2% | 15.6%(+11.6)#284 | 18.1%(+9.11)#7,256 |
| 12. | 93704 | 24.3% | 15.6%(+8.69)#345 | 18.1%(+6.24)#8,245 |
| 13. | 93723 | 21.8% | 15.6%(+6.14)#401 | 18.1%(+3.69)#9,281 |
| 14. | 93727 | 19.5% | 15.6%(+3.93)#461 | 18.1%(+1.48)#10,251 |
| 15. | 93721 | 17.6% | 15.6%(+2.01)#523 | 18.1%(-0.446)#11,149 |
| 16. | 93737 | 17.0% | 15.6%(+1.39)#540 | 18.1%(-1.06)#11,420 |
| 17. | 93720 | 8.8% | 15.6%(-6.77)#833 | 18.1%(-9.22)#16,166 |
| 18. | 93711 | 8.3% | 15.6%(-7.34)#866 | 18.1%(-9.79)#16,585 |
| 19. | 93730 | 7.0% | 15.6%(-8.60)#926 | 18.1%(-11.0)#17,373 |
1
Common Questions
What are the Top 10 Zip Codes with the Highest Poverty Level Among Children Under the Age of 5 in Fresno, CA?
Top 10 Zip Codes with the Highest Poverty Level Among Children Under the Age of 5 in Fresno, CA are:
What zip code has the Highest Poverty Level Among Children Under the Age of 5 in Fresno, CA?
93650 has the Highest Poverty Level Among Children Under the Age of 5 in Fresno, CA with 69.6%.
What is the Poverty Level Among Children Under the Age of 5 in Fresno, CA?
Poverty Level Among Children Under the Age of 5 in Fresno is 31.4%.
What is the Poverty Level Among Children Under the Age of 5 in California?
Poverty Level Among Children Under the Age of 5 in California is 15.6%.
What is the Poverty Level Among Children Under the Age of 5 in the United States?
Poverty Level Among Children Under the Age of 5 in the United States is 18.1%.