Zip Codes with the Largest Bangladeshi Community in Fresno, CA

RELATED REPORTS & OPTIONS

Bangladeshi
Population
Families and Households
Female Fertility
Female Fertility (Unmarried)
Race (Community Size)
Race (Percentage)
Ancestry (Community Size)
AfghanAfricanAmericanApacheArabArapahoArgentineanArmenianAustralianAustrianBangladeshiBasqueBelgianBelizeanBhutaneseBlackfeetBolivianBrazilianBritishBulgarianBurmeseCanadianCelticCentral AmericanCentral American IndianCherokeeChickasawChileanChineseChippewaChoctawColombianComancheCosta RicanCreekCroatianCrowCubanCzechCzechoslovakianDanishDelawareDominicanDutchDutch West IndianEastern EuropeanEcuadorianEgyptianEnglishEstonianEthiopianEuropeanFilipinoFinnishFrenchFrench American IndianFrench CanadianGermanGerman RussianGreekGuamanian / ChamorroGuatemalanGuyaneseHaitianHonduranHopiHungarianIndian (Asian)IndonesianIranianIraqiIrishIroquoisIsraeliItalianJamaicanJapaneseJordanianKenyanKoreanLaotianLatvianLebaneseLithuanianMalaysianMexicanMexican American IndianMongolianMoroccanNative HawaiianNavajoNepaleseNew ZealanderNicaraguanNigerianNorthern EuropeanNorwegianOsagePakistaniPalestinianPanamanianPennsylvania GermanPeruvianPolishPortuguesePotawatomiPuebloPuerto RicanRomanianRussianSalvadoranSamoanScandinavianScotch-IrishScottishSeminoleSerbianSiouxSlavicSloveneSouth AmericanSouth American IndianSpaniardSpanishSpanish AmericanSpanish American IndianSri LankanSubsaharan AfricanSwedishSwissSyrianThaiTohono O'OdhamTonganTurkishUkrainianVenezuelanVietnameseWelshWest IndianYaquiYugoslavian
Ancestry (Percentage)
AfghanAfricanAmericanApacheArabArapahoArgentineanArmenianAustralianAustrianBangladeshiBasqueBelgianBelizeanBhutaneseBlackfeetBolivianBrazilianBritishBulgarianBurmeseCanadianCelticCentral AmericanCentral American IndianCherokeeChickasawChileanChineseChippewaChoctawColombianComancheCosta RicanCreekCroatianCrowCubanCzechCzechoslovakianDanishDelawareDominicanDutchDutch West IndianEastern EuropeanEcuadorianEgyptianEnglishEstonianEthiopianEuropeanFilipinoFinnishFrenchFrench American IndianFrench CanadianGermanGerman RussianGreekGuamanian / ChamorroGuatemalanGuyaneseHaitianHonduranHopiHungarianIndian (Asian)IndonesianIranianIraqiIrishIroquoisIsraeliItalianJamaicanJapaneseJordanianKenyanKoreanLaotianLatvianLebaneseLithuanianMalaysianMexicanMexican American IndianMongolianMoroccanNative HawaiianNavajoNepaleseNew ZealanderNicaraguanNigerianNorthern EuropeanNorwegianOsagePakistaniPalestinianPanamanianPennsylvania GermanPeruvianPolishPortuguesePotawatomiPuebloPuerto RicanRomanianRussianSalvadoranSamoanScandinavianScotch-IrishScottishSeminoleSerbianSiouxSlavicSloveneSouth AmericanSouth American IndianSpaniardSpanishSpanish AmericanSpanish American IndianSri LankanSubsaharan AfricanSwedishSwissSyrianThaiTohono O'OdhamTonganTurkishUkrainianVenezuelanVietnameseWelshWest IndianYaquiYugoslavian
Immigrant Origin (Total)
AfghanistanAfricaArgentinaArmeniaAsiaAustraliaAustriaAzoresBangladeshBelgiumBoliviaBrazilBurma / MyanmarCambodiaCanadaCaribbeanCentral AmericaChileChinaColombiaCroatiaCubaCzechoslovakiaDenmarkEastern AfricaEastern AsiaEastern EuropeEcuadorEgyptEl SalvadorEnglandEritreaEthiopiaEuropeFijiFranceGermanyGhanaGreeceGuatemalaHondurasHong KongIndiaIndonesiaIranIraqIrelandIsraelItalyJamaicaJapanJordanKenyaKoreaKuwaitLaosLatin AmericaLatviaLebanonLiberiaMalaysiaMexicoMiddle AfricaMoldovaMoroccoNepalNetherlandsNicaraguaNigeriaNorthern AfricaNorthern EuropeNorwayOceaniaPakistanPanamaPeruPhilippinesPolandPortugalRomaniaRussiaSaudi ArabiaScotlandSouth AmericaSouth Central AsiaSouth Eastern AsiaSouthern EuropeSpainSri LankaSwedenSwitzerlandSyriaTaiwanThailandTrinidad and TobagoUgandaUkraineVenezuelaVietnamWestern AfricaWestern AsiaWestern EuropeYemen
Immigrant Origin (Percentage)
AfghanistanAfricaArgentinaArmeniaAsiaAustraliaAustriaAzoresBangladeshBelgiumBoliviaBrazilBurma / MyanmarCambodiaCanadaCaribbeanCentral AmericaChileChinaColombiaCroatiaCubaCzechoslovakiaDenmarkEastern AfricaEastern AsiaEastern EuropeEcuadorEgyptEl SalvadorEnglandEritreaEthiopiaEuropeFijiFranceGermanyGhanaGreeceGuatemalaHondurasHong KongIndiaIndonesiaIranIraqIrelandIsraelItalyJamaicaJapanJordanKenyaKoreaKuwaitLaosLatin AmericaLatviaLebanonLiberiaMalaysiaMexicoMiddle AfricaMoldovaMoroccoNepalNetherlandsNicaraguaNigeriaNorthern AfricaNorthern EuropeNorwayOceaniaPakistanPanamaPeruPhilippinesPolandPortugalRomaniaRussiaSaudi ArabiaScotlandSouth AmericaSouth Central AsiaSouth Eastern AsiaSouthern EuropeSpainSri LankaSwedenSwitzerlandSyriaTaiwanThailandTrinidad and TobagoUgandaUkraineVenezuelaVietnamWestern AfricaWestern AsiaWestern EuropeYemen
Income
Income (Families)
Income (Households)
Poverty
Poverty (Families)
Unemployment
Employment Occupations
Employment Industries
Employer Class
Commute Time
Commute Means
School Enrollment
Education by Degree Field
Occupancy
Finances
Physical Characteristics
Fresno
Compare Zip Codes
Comparison Subject

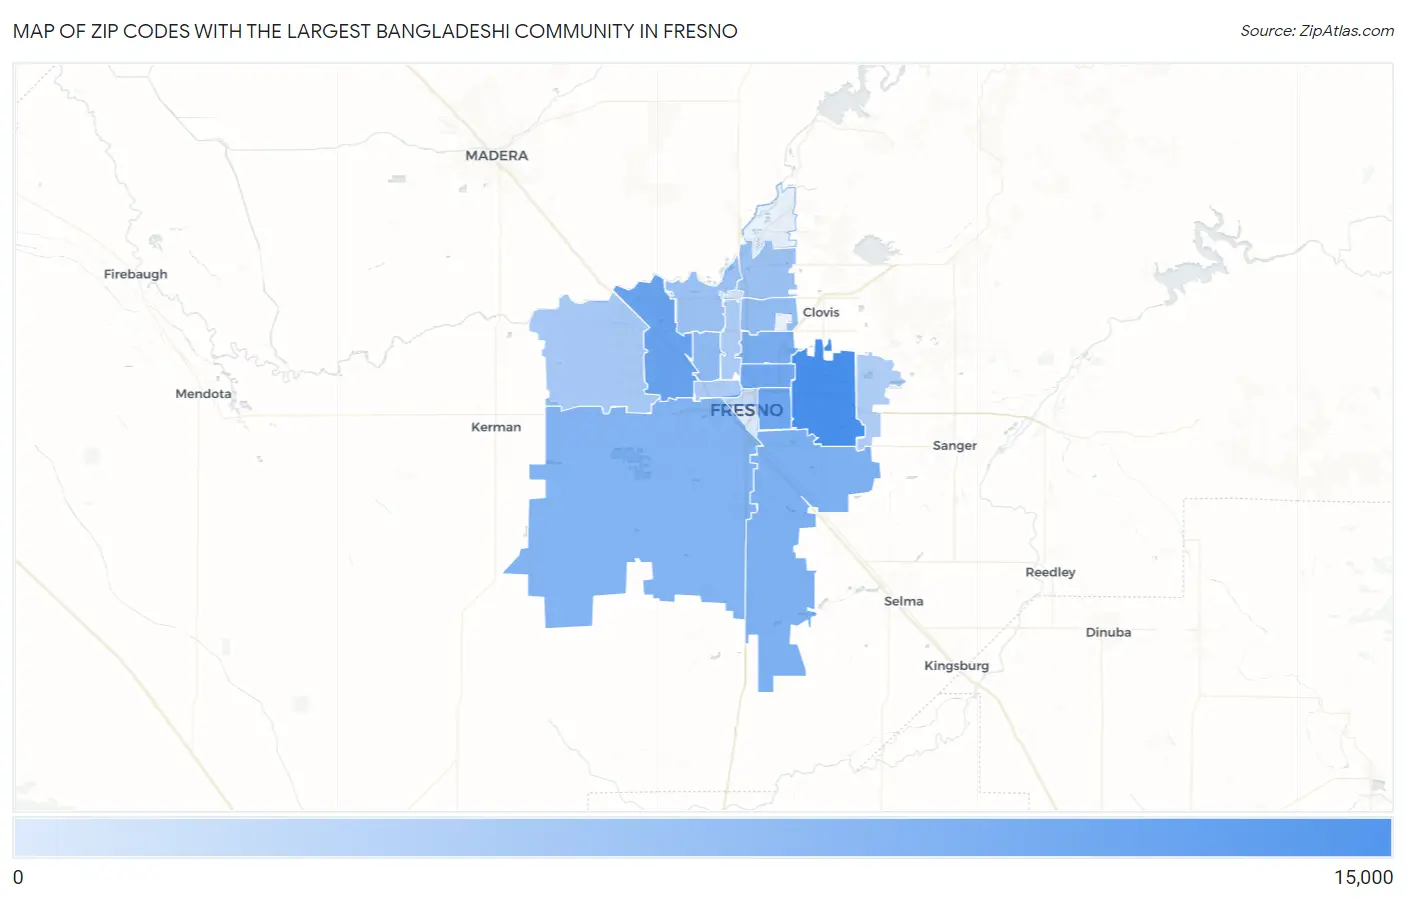
Map of Zip Codes with the Largest Bangladeshi Community in Fresno

0
15,000
Zip Codes with the Largest Bangladeshi Community in Fresno Map

Zip Codes with the Largest Bangladeshi Community in Fresno, CA

Zip Code Bangladeshi vs State vs National
1.9372711,400112,008(10.18%)#1348,407(3.27%)#2
2.937223,644112,008(3.25%)#5348,407(1.05%)#12
3.937023,018112,008(2.69%)#7348,407(0.87%)#16
4.937032,662112,008(2.38%)#9348,407(0.76%)#19
5.937262,033112,008(1.82%)#13348,407(0.58%)#32
6.937251,881112,008(1.68%)#17348,407(0.54%)#38
7.937061,520112,008(1.36%)#20348,407(0.44%)#48
8.93705985112,008(0.88%)#27348,407(0.28%)#77
9.93710845112,008(0.75%)#31348,407(0.24%)#87
10.93720590112,008(0.53%)#45348,407(0.17%)#126
11.93711584112,008(0.52%)#46348,407(0.17%)#128
12.93723429112,008(0.38%)#54348,407(0.12%)#153
13.93728372112,008(0.33%)#56348,407(0.11%)#170
14.93704357112,008(0.32%)#58348,407(0.10%)#178
15.93737316112,008(0.28%)#64348,407(0.09%)#202
16.93701147112,008(0.13%)#99348,407(0.04%)#372
17.93650100112,008(0.09%)#129348,407(0.03%)#477
18.9372165112,008(0.06%)#164348,407(0.02%)#660

Common Questions

What are the Top 10 Zip Codes with the Largest Bangladeshi Community in Fresno, CA?
Top 10 Zip Codes with the Largest Bangladeshi Community in Fresno, CA are:
#1
11,400
#2
3,644
#3
3,018
#4
2,662
#5
2,033
#6
1,881
#7
1,520
#8
985
#9
845
#10
590
What zip code has the Largest Bangladeshi Community in Fresno, CA?
93727 has the Largest Bangladeshi Community in Fresno, CA with 11,400.
What is the Total Bangladeshi Population in Fresno, CA?
Total Bangladeshi Population in Fresno is 26,899.
What is the Total Bangladeshi Population in California?
Total Bangladeshi Population in California is 112,008.
What is the Total Bangladeshi Population in the United States?
Total Bangladeshi Population in the United States is 348,407.