Zip Codes with the Highest Percentage of Population Employed in Farming, Fishing & Forestry in El Monte, CA
RELATED REPORTS & OPTIONS
Farming, Fishing & Forestry
El Monte
Compare Zip Codes
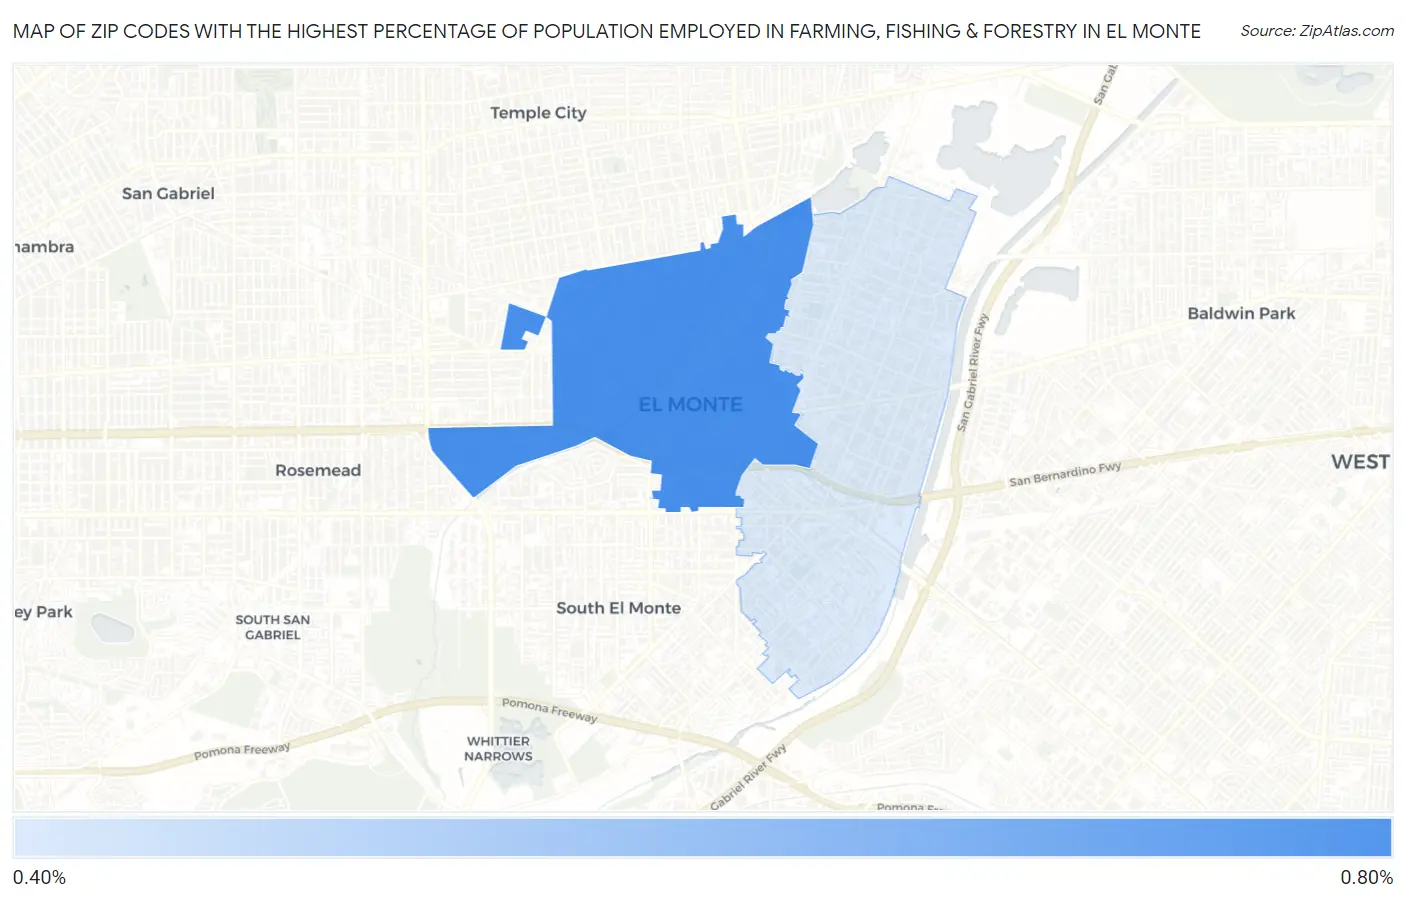
Map of Zip Codes with the Highest Percentage of Population Employed in Farming, Fishing & Forestry in El Monte
0.0%
0.80%
Zip Codes with the Highest Percentage of Population Employed in Farming, Fishing & Forestry in El Monte, CA
| Zip Code | % Employed | vs State | vs National | |
| 1. | 91731 | 0.74% | 1.4%(-0.670)#575 | 0.61%(+0.135)#11,134 |
| 2. | 91732 | 0.46% | 1.4%(-0.946)#707 | 0.61%(-0.142)#13,151 |
1
Common Questions
What are the Top Zip Codes with the Highest Percentage of Population Employed in Farming, Fishing & Forestry in El Monte, CA?
Top Zip Codes with the Highest Percentage of Population Employed in Farming, Fishing & Forestry in El Monte, CA are:
What zip code has the Highest Percentage of Population Employed in Farming, Fishing & Forestry in El Monte, CA?
91731 has the Highest Percentage of Population Employed in Farming, Fishing & Forestry in El Monte, CA with 0.74%.
What is the Percentage of Population Employed in Farming, Fishing & Forestry in El Monte, CA?
Percentage of Population Employed in Farming, Fishing & Forestry in El Monte is 0.51%.
What is the Percentage of Population Employed in Farming, Fishing & Forestry in California?
Percentage of Population Employed in Farming, Fishing & Forestry in California is 1.4%.
What is the Percentage of Population Employed in Farming, Fishing & Forestry in the United States?
Percentage of Population Employed in Farming, Fishing & Forestry in the United States is 0.61%.