Zip Codes with the Highest Percentage of Population Employed in Agriculture, Fishing & Hunting in Compton, CA
RELATED REPORTS & OPTIONS
Agriculture, Fishing & Hunting
Compton
Compare Zip Codes
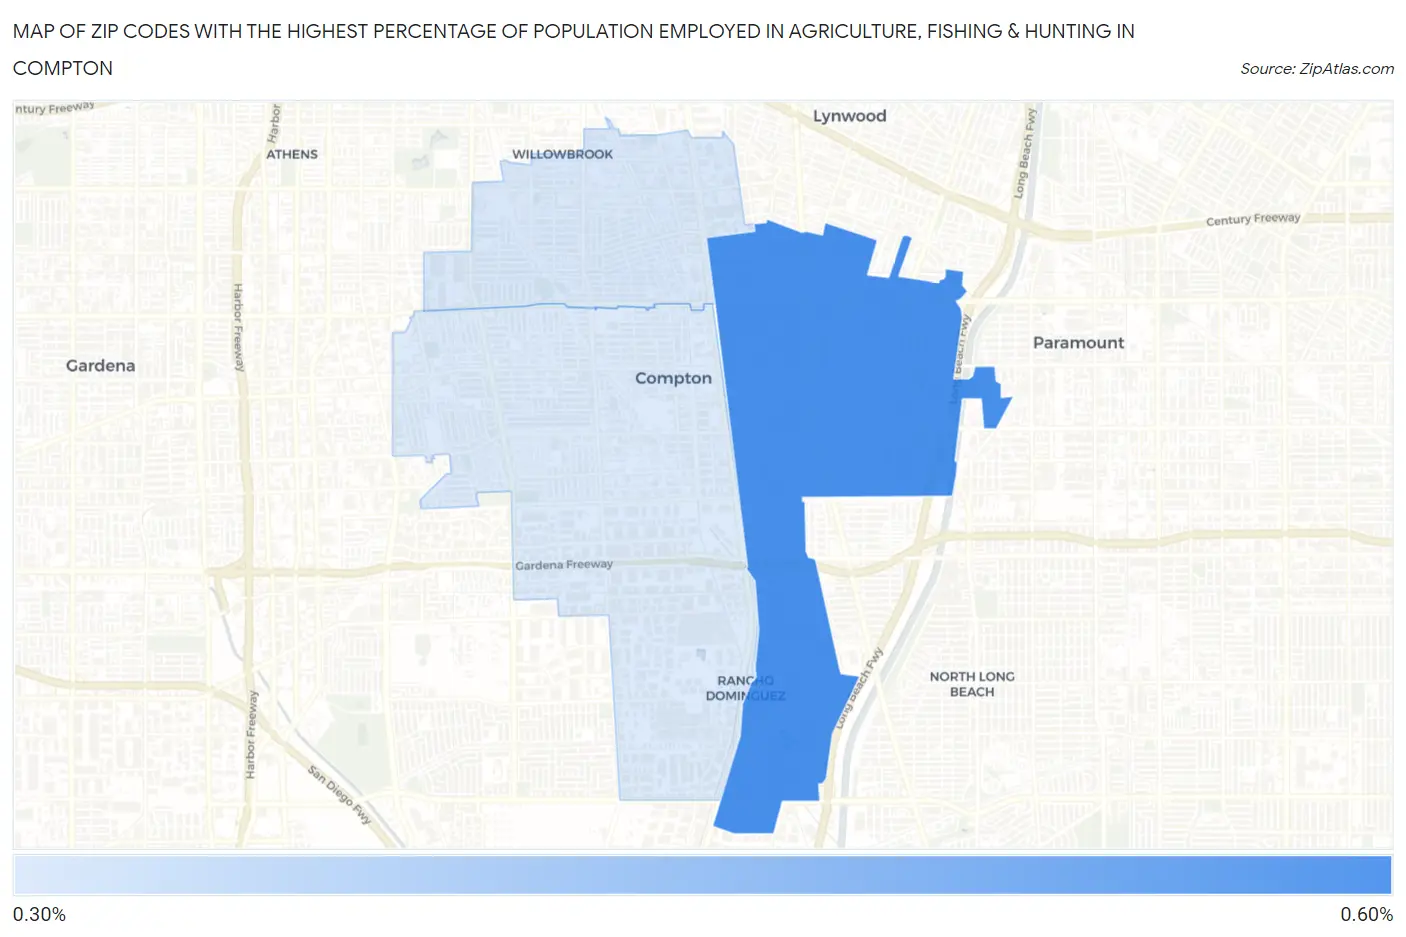
Map of Zip Codes with the Highest Percentage of Population Employed in Agriculture, Fishing & Hunting in Compton
0.39%
0.55%
Zip Codes with the Highest Percentage of Population Employed in Agriculture, Fishing & Hunting in Compton, CA
| Zip Code | % Employed | vs State | vs National | |
| 1. | 90221 | 0.55% | 2.0%(-1.44)#928 | 1.2%(-0.650)#18,856 |
| 2. | 90222 | 0.39% | 2.0%(-1.59)#1,041 | 1.2%(-0.804)#20,212 |
| 3. | 90220 | 0.39% | 2.0%(-1.60)#1,046 | 1.2%(-0.809)#20,240 |
1
Common Questions
What are the Top Zip Codes with the Highest Percentage of Population Employed in Agriculture, Fishing & Hunting in Compton, CA?
Top Zip Codes with the Highest Percentage of Population Employed in Agriculture, Fishing & Hunting in Compton, CA are:
What zip code has the Highest Percentage of Population Employed in Agriculture, Fishing & Hunting in Compton, CA?
90221 has the Highest Percentage of Population Employed in Agriculture, Fishing & Hunting in Compton, CA with 0.55%.
What is the Percentage of Population Employed in Agriculture, Fishing & Hunting in Compton, CA?
Percentage of Population Employed in Agriculture, Fishing & Hunting in Compton is 0.59%.
What is the Percentage of Population Employed in Agriculture, Fishing & Hunting in California?
Percentage of Population Employed in Agriculture, Fishing & Hunting in California is 2.0%.
What is the Percentage of Population Employed in Agriculture, Fishing & Hunting in the United States?
Percentage of Population Employed in Agriculture, Fishing & Hunting in the United States is 1.2%.