Colton, CA Map & Demographics
Colton Map
Colton Overview
$24,998
PER CAPITA INCOME
$71,283
AVG FAMILY INCOME
$66,725
AVG HOUSEHOLD INCOME
29.4%
WAGE / INCOME GAP [ % ]
70.6¢/ $1
WAGE / INCOME GAP [ $ ]
$13,556
FAMILY INCOME DEFICIT
0.39
INEQUALITY / GINI INDEX
53,959
TOTAL POPULATION
26,825
MALE POPULATION
27,134
FEMALE POPULATION
98.86
MALES / 100 FEMALES
101.15
FEMALES / 100 MALES
33.2
MEDIAN AGE
3.6
AVG FAMILY SIZE
3.2
AVG HOUSEHOLD SIZE
26,685
LABOR FORCE [ PEOPLE ]
62.9%
PERCENT IN LABOR FORCE
7.4%
UNEMPLOYMENT RATE
Colton Zip Codes
Income in Colton
Income Overview in Colton
Per Capita Income in Colton is $24,998, while median incomes of families and households are $71,283 and $66,725 respectively.
| Characteristic | Number | Measure |
| Per Capita Income | 53,959 | $24,998 |
| Median Family Income | 12,948 | $71,283 |
| Mean Family Income | 12,948 | $82,371 |
| Median Household Income | 16,740 | $66,725 |
| Mean Household Income | 16,740 | $78,007 |
| Income Deficit | 12,948 | $13,556 |
| Wage / Income Gap (%) | 53,959 | 29.35% |
| Wage / Income Gap ($) | 53,959 | 70.65¢ per $1 |
| Gini / Inequality Index | 53,959 | 0.39 |
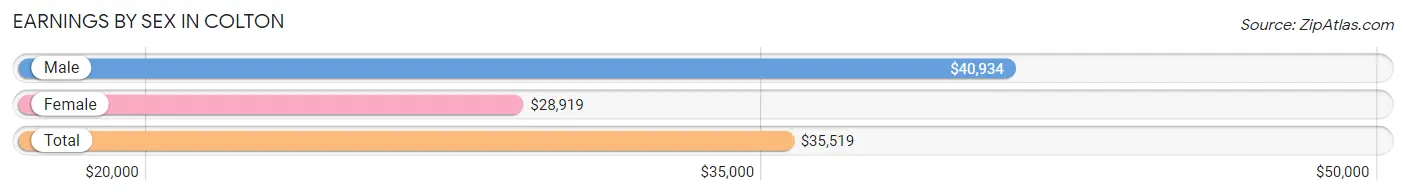
Earnings by Sex in Colton
Average Earnings in Colton are $35,519, $40,934 for men and $28,919 for women, a difference of 29.3%.
| Sex | Number | Average Earnings |
| Male | 14,837 (55.6%) | $40,934 |
| Female | 11,861 (44.4%) | $28,919 |
| Total | 26,698 (100.0%) | $35,519 |
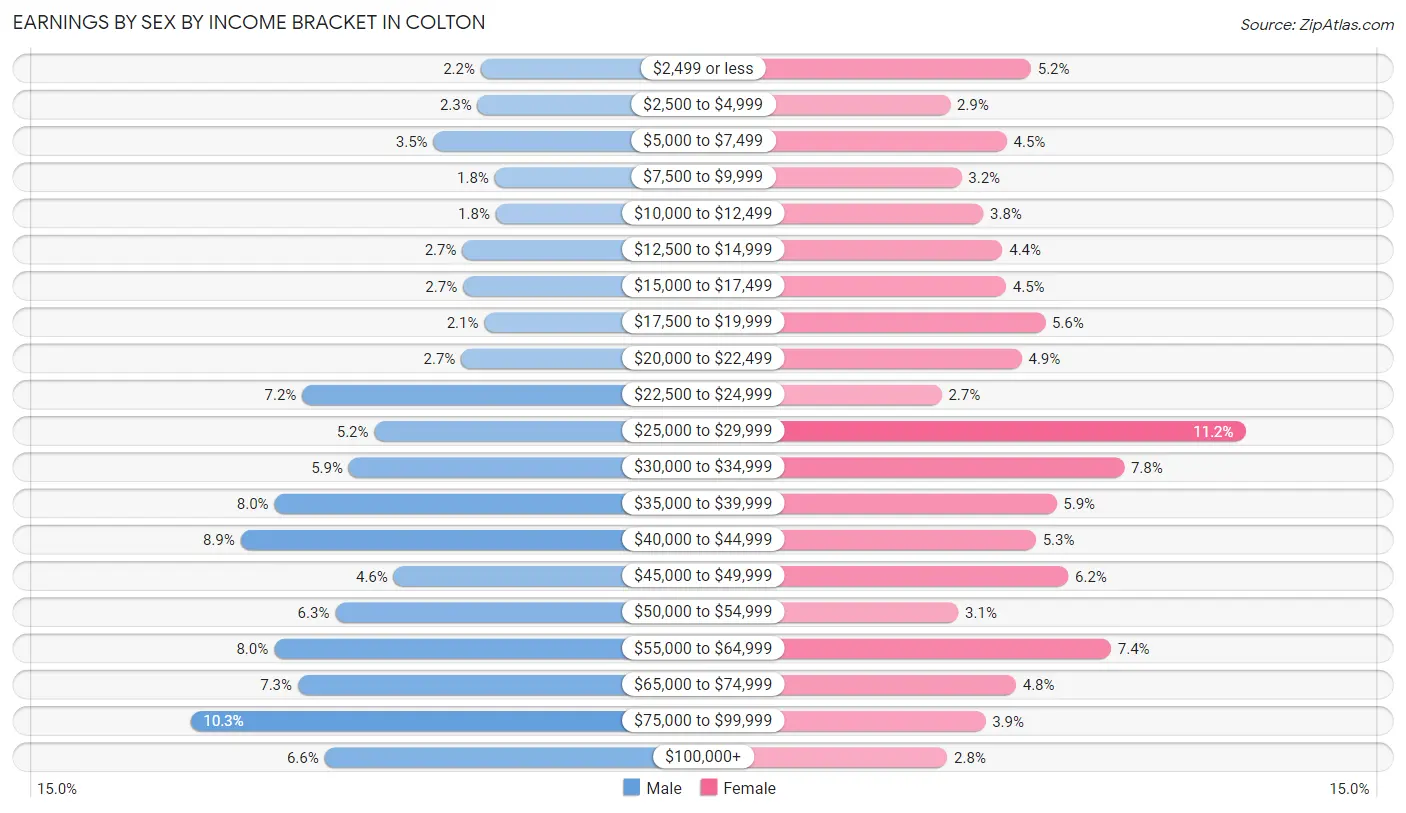
Earnings by Sex by Income Bracket in Colton
The most common earnings brackets in Colton are $75,000 to $99,999 for men (1,534 | 10.3%) and $25,000 to $29,999 for women (1,329 | 11.2%).
| Income | Male | Female |
| $2,499 or less | 324 (2.2%) | 613 (5.2%) |
| $2,500 to $4,999 | 337 (2.3%) | 344 (2.9%) |
| $5,000 to $7,499 | 521 (3.5%) | 532 (4.5%) |
| $7,500 to $9,999 | 265 (1.8%) | 382 (3.2%) |
| $10,000 to $12,499 | 261 (1.8%) | 454 (3.8%) |
| $12,500 to $14,999 | 401 (2.7%) | 518 (4.4%) |
| $15,000 to $17,499 | 398 (2.7%) | 530 (4.5%) |
| $17,500 to $19,999 | 308 (2.1%) | 661 (5.6%) |
| $20,000 to $22,499 | 405 (2.7%) | 582 (4.9%) |
| $22,500 to $24,999 | 1,068 (7.2%) | 315 (2.7%) |
| $25,000 to $29,999 | 767 (5.2%) | 1,329 (11.2%) |
| $30,000 to $34,999 | 874 (5.9%) | 924 (7.8%) |
| $35,000 to $39,999 | 1,184 (8.0%) | 699 (5.9%) |
| $40,000 to $44,999 | 1,325 (8.9%) | 630 (5.3%) |
| $45,000 to $49,999 | 687 (4.6%) | 738 (6.2%) |
| $50,000 to $54,999 | 931 (6.3%) | 371 (3.1%) |
| $55,000 to $64,999 | 1,186 (8.0%) | 880 (7.4%) |
| $65,000 to $74,999 | 1,086 (7.3%) | 563 (4.8%) |
| $75,000 to $99,999 | 1,534 (10.3%) | 461 (3.9%) |
| $100,000+ | 975 (6.6%) | 335 (2.8%) |
| Total | 14,837 (100.0%) | 11,861 (100.0%) |
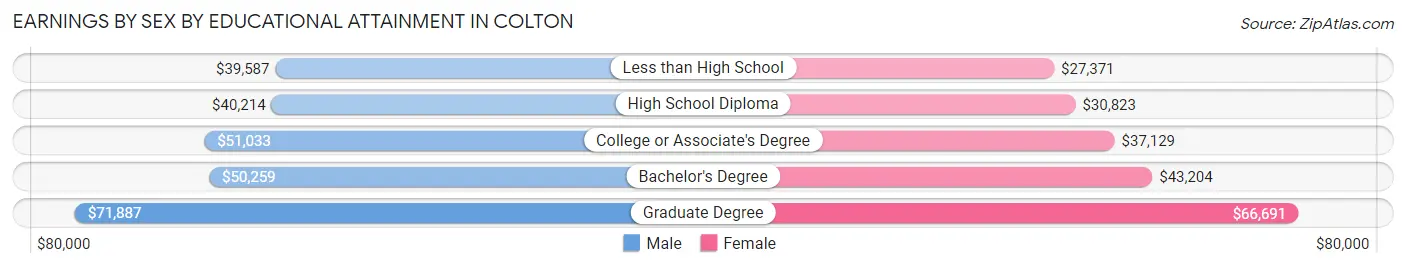
Earnings by Sex by Educational Attainment in Colton
Average earnings in Colton are $43,151 for men and $34,019 for women, a difference of 21.2%. Men with an educational attainment of graduate degree enjoy the highest average annual earnings of $71,887, while those with less than high school education earn the least with $39,587. Women with an educational attainment of graduate degree earn the most with the average annual earnings of $66,691, while those with less than high school education have the smallest earnings of $27,371.
| Educational Attainment | Male Income | Female Income |
| Less than High School | $39,587 | $27,371 |
| High School Diploma | $40,214 | $30,823 |
| College or Associate's Degree | $51,033 | $37,129 |
| Bachelor's Degree | $50,259 | $43,204 |
| Graduate Degree | $71,887 | $66,691 |
| Total | $43,151 | $34,019 |
Family Income in Colton
Family Income Brackets in Colton
According to the Colton family income data, there are 3,056 families falling into the $50,000 to $74,999 income range, which is the most common income bracket and makes up 23.6% of all families. Conversely, the $10,000 to $14,999 income bracket is the least frequent group with only 453 families (3.5%) belonging to this category.
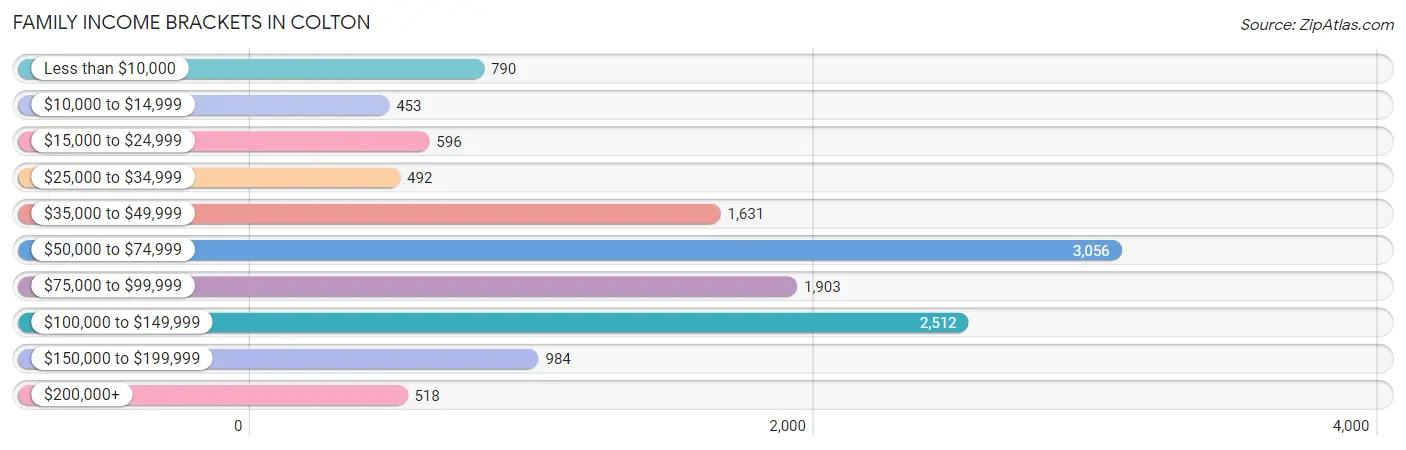
| Income Bracket | # Families | % Families |
| Less than $10,000 | 790 | 6.1% |
| $10,000 to $14,999 | 453 | 3.5% |
| $15,000 to $24,999 | 596 | 4.6% |
| $25,000 to $34,999 | 492 | 3.8% |
| $35,000 to $49,999 | 1,631 | 12.6% |
| $50,000 to $74,999 | 3,056 | 23.6% |
| $75,000 to $99,999 | 1,903 | 14.7% |
| $100,000 to $149,999 | 2,512 | 19.4% |
| $150,000 to $199,999 | 984 | 7.6% |
| $200,000+ | 518 | 4.0% |
Family Income by Famaliy Size in Colton
7+ person families (397 | 3.1%) account for the highest median family income in Colton with $126,563 per family, while 2-person families (4,384 | 33.9%) have the highest median income of $30,308 per family member.
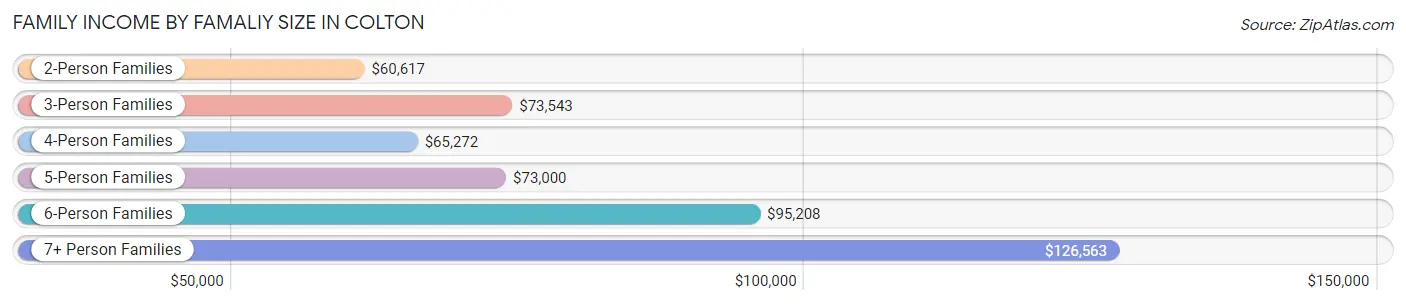
| Income Bracket | # Families | Median Income |
| 2-Person Families | 4,384 (33.9%) | $60,617 |
| 3-Person Families | 3,077 (23.8%) | $73,543 |
| 4-Person Families | 2,741 (21.2%) | $65,272 |
| 5-Person Families | 1,486 (11.5%) | $73,000 |
| 6-Person Families | 863 (6.7%) | $95,208 |
| 7+ Person Families | 397 (3.1%) | $126,563 |
| Total | 12,948 (100.0%) | $71,283 |
Family Income by Number of Earners in Colton
The median family income in Colton is $71,283, with families comprising 3+ earners (2,119) having the highest median family income of $120,690, while families with no earners (1,386) have the lowest median family income of $24,797, accounting for 16.4% and 10.7% of families, respectively.
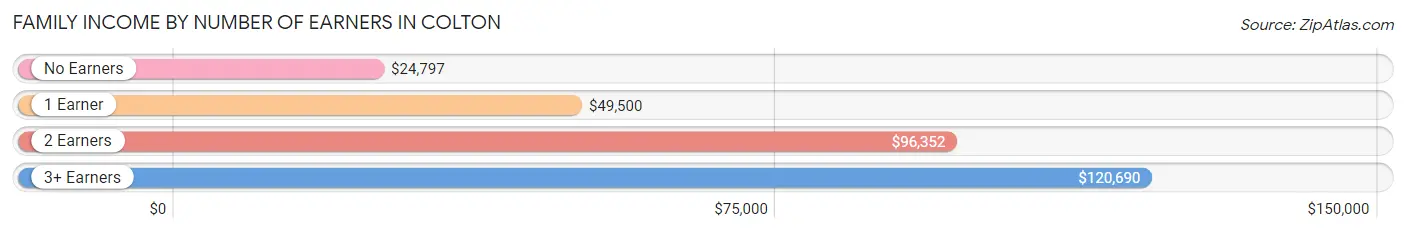
| Number of Earners | # Families | Median Income |
| No Earners | 1,386 (10.7%) | $24,797 |
| 1 Earner | 5,028 (38.8%) | $49,500 |
| 2 Earners | 4,415 (34.1%) | $96,352 |
| 3+ Earners | 2,119 (16.4%) | $120,690 |
| Total | 12,948 (100.0%) | $71,283 |
Household Income in Colton
Household Income Brackets in Colton
With 3,800 households falling in the category, the $50,000 to $74,999 income range is the most frequent in Colton, accounting for 22.7% of all households. In contrast, only 586 households (3.5%) fall into the $200,000+ income bracket, making it the least populous group.
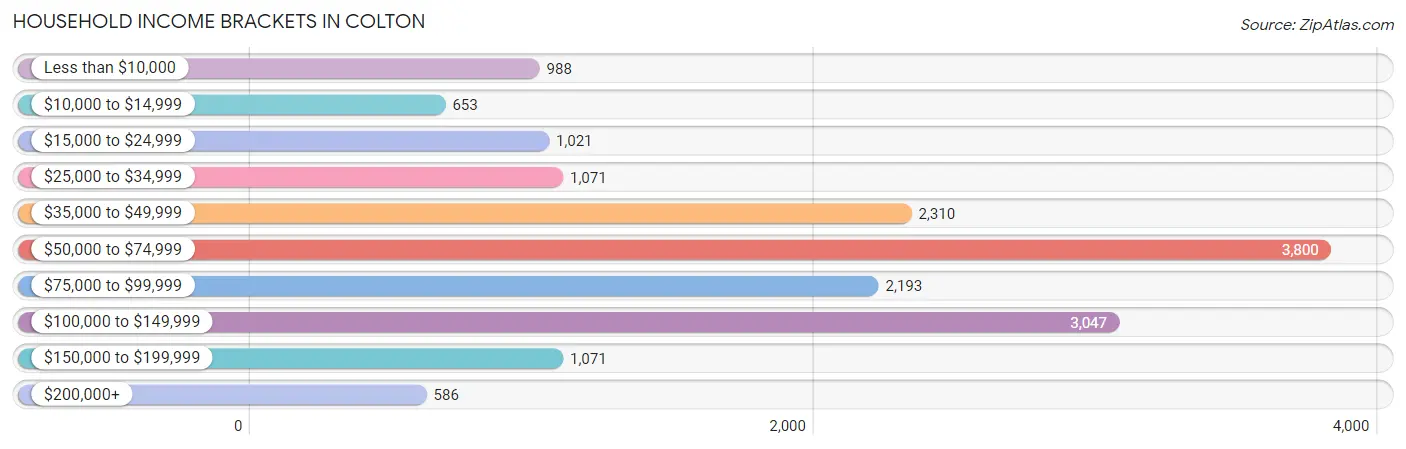
| Income Bracket | # Households | % Households |
| Less than $10,000 | 988 | 5.9% |
| $10,000 to $14,999 | 653 | 3.9% |
| $15,000 to $24,999 | 1,021 | 6.1% |
| $25,000 to $34,999 | 1,071 | 6.4% |
| $35,000 to $49,999 | 2,310 | 13.8% |
| $50,000 to $74,999 | 3,800 | 22.7% |
| $75,000 to $99,999 | 2,193 | 13.1% |
| $100,000 to $149,999 | 3,047 | 18.2% |
| $150,000 to $199,999 | 1,071 | 6.4% |
| $200,000+ | 586 | 3.5% |
Household Income by Householder Age in Colton
The median household income in Colton is $66,725, with the highest median household income of $74,104 found in the 45 to 64 years age bracket for the primary householder. A total of 5,912 households (35.3%) fall into this category. Meanwhile, the 65+ years age bracket for the primary householder has the lowest median household income of $48,538, with 3,199 households (19.1%) in this group.
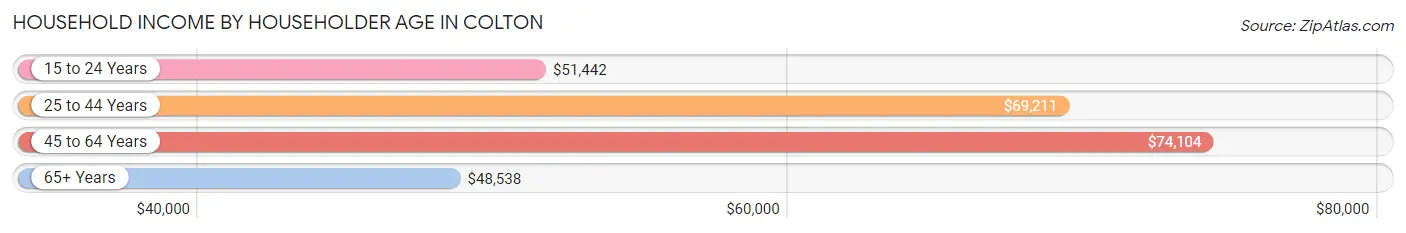
| Income Bracket | # Households | Median Income |
| 15 to 24 Years | 676 (4.0%) | $51,442 |
| 25 to 44 Years | 6,953 (41.5%) | $69,211 |
| 45 to 64 Years | 5,912 (35.3%) | $74,104 |
| 65+ Years | 3,199 (19.1%) | $48,538 |
| Total | 16,740 (100.0%) | $66,725 |
Poverty in Colton
Income Below Poverty by Sex and Age in Colton
With 12.6% poverty level for males and 18.2% for females among the residents of Colton, 15 year old males and 5 year old females are the most vulnerable to poverty, with 113 males (29.5%) and 155 females (33.4%) in their respective age groups living below the poverty level.
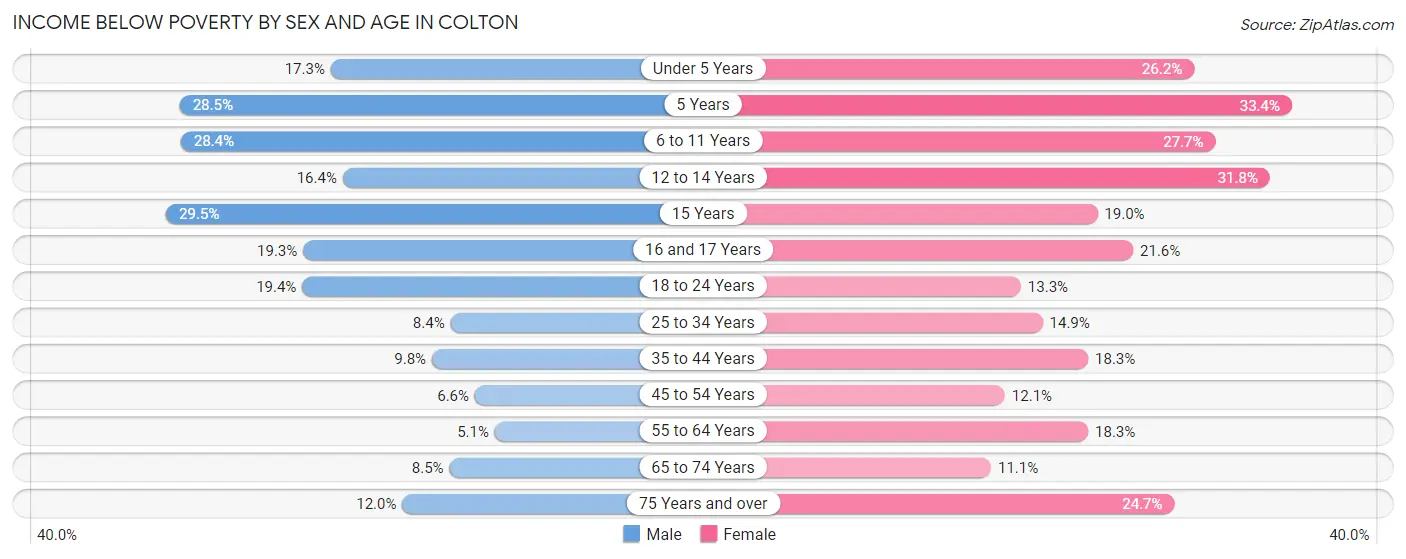
| Age Bracket | Male | Female |
| Under 5 Years | 281 (17.3%) | 399 (26.2%) |
| 5 Years | 90 (28.5%) | 155 (33.4%) |
| 6 to 11 Years | 580 (28.4%) | 573 (27.7%) |
| 12 to 14 Years | 218 (16.4%) | 373 (31.8%) |
| 15 Years | 113 (29.5%) | 97 (19.0%) |
| 16 and 17 Years | 136 (19.3%) | 210 (21.6%) |
| 18 to 24 Years | 564 (19.4%) | 441 (13.3%) |
| 25 to 34 Years | 395 (8.4%) | 655 (14.9%) |
| 35 to 44 Years | 375 (9.8%) | 632 (18.3%) |
| 45 to 54 Years | 195 (6.6%) | 422 (12.1%) |
| 55 to 64 Years | 152 (5.1%) | 436 (18.3%) |
| 65 to 74 Years | 169 (8.5%) | 226 (11.1%) |
| 75 Years and over | 102 (12.0%) | 280 (24.7%) |
| Total | 3,370 (12.6%) | 4,899 (18.2%) |
Income Above Poverty by Sex and Age in Colton
According to the poverty statistics in Colton, males aged 55 to 64 years and females aged 65 to 74 years are the age groups that are most secure financially, with 94.9% of males and 88.9% of females in these age groups living above the poverty line.
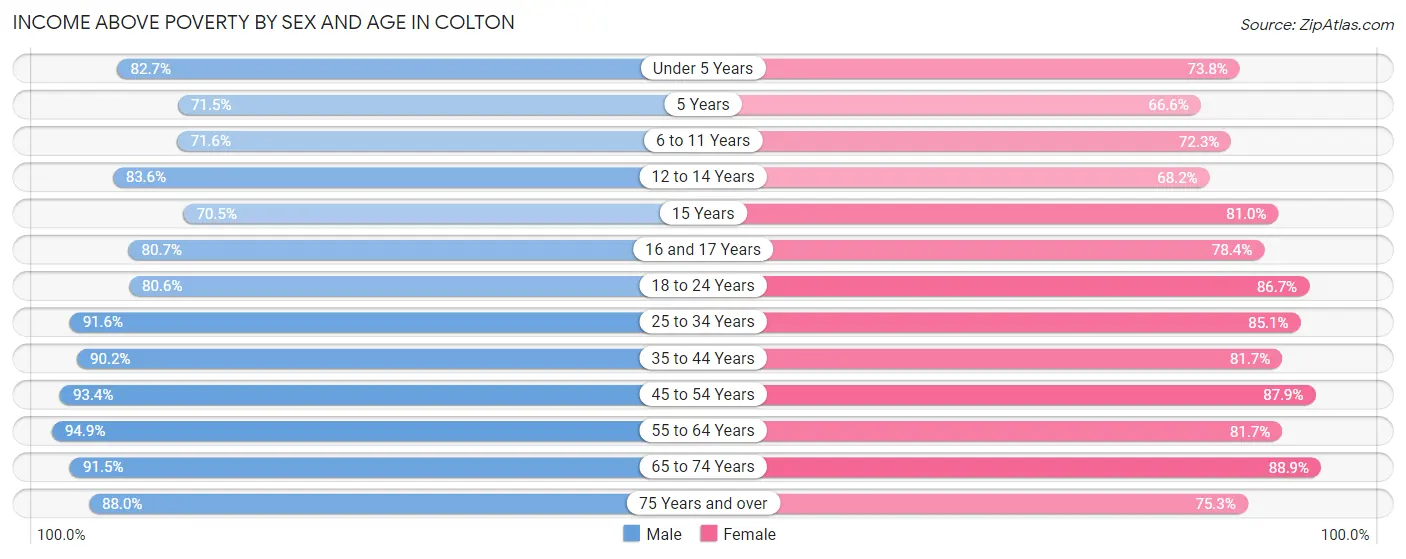
| Age Bracket | Male | Female |
| Under 5 Years | 1,346 (82.7%) | 1,126 (73.8%) |
| 5 Years | 226 (71.5%) | 309 (66.6%) |
| 6 to 11 Years | 1,462 (71.6%) | 1,493 (72.3%) |
| 12 to 14 Years | 1,113 (83.6%) | 801 (68.2%) |
| 15 Years | 270 (70.5%) | 414 (81.0%) |
| 16 and 17 Years | 568 (80.7%) | 761 (78.4%) |
| 18 to 24 Years | 2,345 (80.6%) | 2,875 (86.7%) |
| 25 to 34 Years | 4,320 (91.6%) | 3,738 (85.1%) |
| 35 to 44 Years | 3,467 (90.2%) | 2,824 (81.7%) |
| 45 to 54 Years | 2,772 (93.4%) | 3,062 (87.9%) |
| 55 to 64 Years | 2,833 (94.9%) | 1,948 (81.7%) |
| 65 to 74 Years | 1,829 (91.5%) | 1,813 (88.9%) |
| 75 Years and over | 751 (88.0%) | 854 (75.3%) |
| Total | 23,302 (87.4%) | 22,018 (81.8%) |
Income Below Poverty Among Married-Couple Families in Colton
The poverty statistics for married-couple families in Colton show that 5.7% or 446 of the total 7,834 families live below the poverty line. Families with 3 or 4 children have the highest poverty rate of 15.7%, comprising of 97 families. On the other hand, families with 5 or more children have the lowest poverty rate of 0.0%, which includes 0 families.
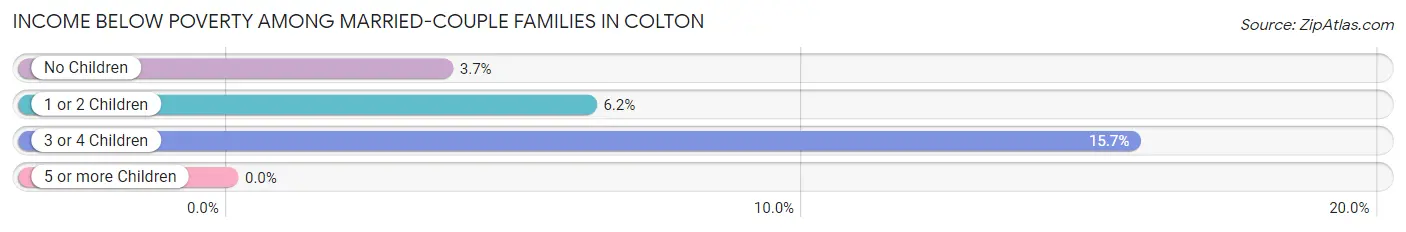
| Children | Above Poverty | Below Poverty |
| No Children | 3,659 (96.3%) | 142 (3.7%) |
| 1 or 2 Children | 3,108 (93.8%) | 207 (6.2%) |
| 3 or 4 Children | 520 (84.3%) | 97 (15.7%) |
| 5 or more Children | 101 (100.0%) | 0 (0.0%) |
| Total | 7,388 (94.3%) | 446 (5.7%) |
Income Below Poverty Among Single-Parent Households in Colton
According to the poverty data in Colton, 8.0% or 136 single-father households and 34.8% or 1,183 single-mother households are living below the poverty line. Among single-father households, those with 1 or 2 children have the highest poverty rate, with 79 households (16.5%) experiencing poverty. Likewise, among single-mother households, those with 3 or 4 children have the highest poverty rate, with 352 households (73.3%) falling below the poverty line.
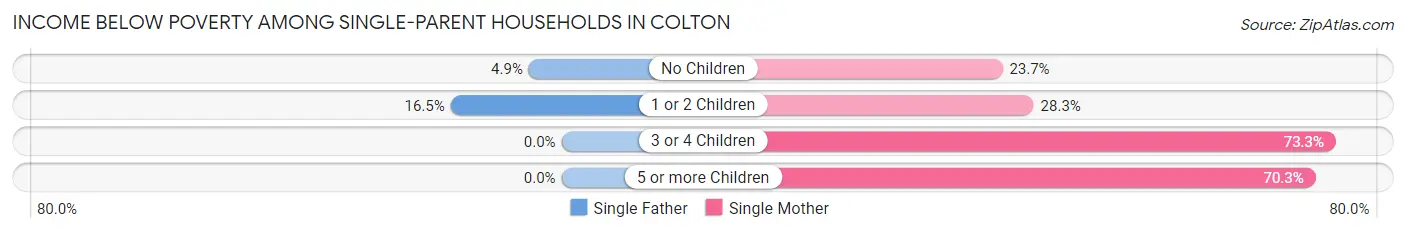
| Children | Single Father | Single Mother |
| No Children | 57 (4.9%) | 256 (23.7%) |
| 1 or 2 Children | 79 (16.5%) | 485 (28.3%) |
| 3 or 4 Children | 0 (0.0%) | 352 (73.3%) |
| 5 or more Children | 0 (0.0%) | 90 (70.3%) |
| Total | 136 (8.0%) | 1,183 (34.8%) |
Income Below Poverty Among Married-Couple vs Single-Parent Households in Colton
The poverty data for Colton shows that 446 of the married-couple family households (5.7%) and 1,319 of the single-parent households (25.8%) are living below the poverty level. Within the married-couple family households, those with 3 or 4 children have the highest poverty rate, with 97 households (15.7%) falling below the poverty line. Among the single-parent households, those with 5 or more children have the highest poverty rate, with 90 household (70.3%) living below poverty.
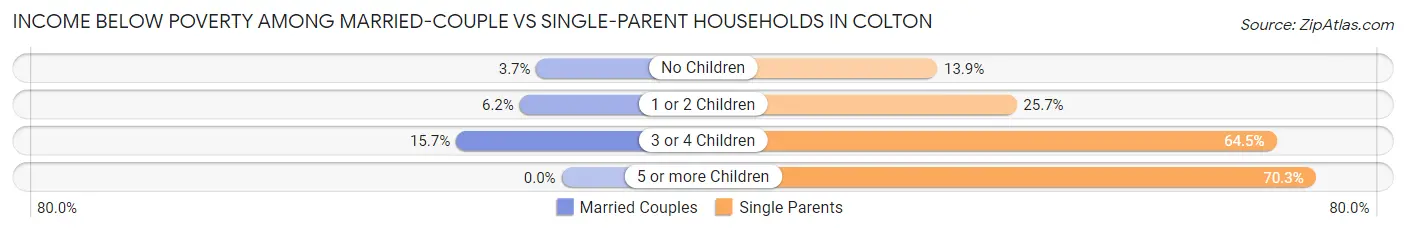
| Children | Married-Couple Families | Single-Parent Households |
| No Children | 142 (3.7%) | 313 (13.9%) |
| 1 or 2 Children | 207 (6.2%) | 564 (25.7%) |
| 3 or 4 Children | 97 (15.7%) | 352 (64.5%) |
| 5 or more Children | 0 (0.0%) | 90 (70.3%) |
| Total | 446 (5.7%) | 1,319 (25.8%) |
Race in Colton
The most populous races in Colton are Hispanic or Latino (39,270 | 72.8%), White / Caucasian (19,471 | 36.1%), and Some other Race (17,527 | 32.5%).
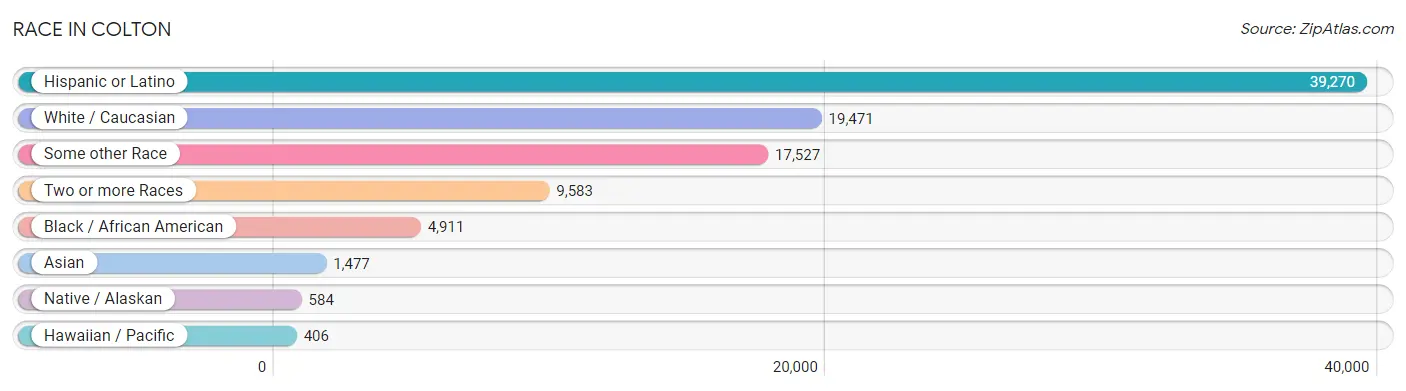
| Race | # Population | % Population |
| Asian | 1,477 | 2.7% |
| Black / African American | 4,911 | 9.1% |
| Hawaiian / Pacific | 406 | 0.7% |
| Hispanic or Latino | 39,270 | 72.8% |
| Native / Alaskan | 584 | 1.1% |
| White / Caucasian | 19,471 | 36.1% |
| Two or more Races | 9,583 | 17.8% |
| Some other Race | 17,527 | 32.5% |
| Total | 53,959 | 100.0% |
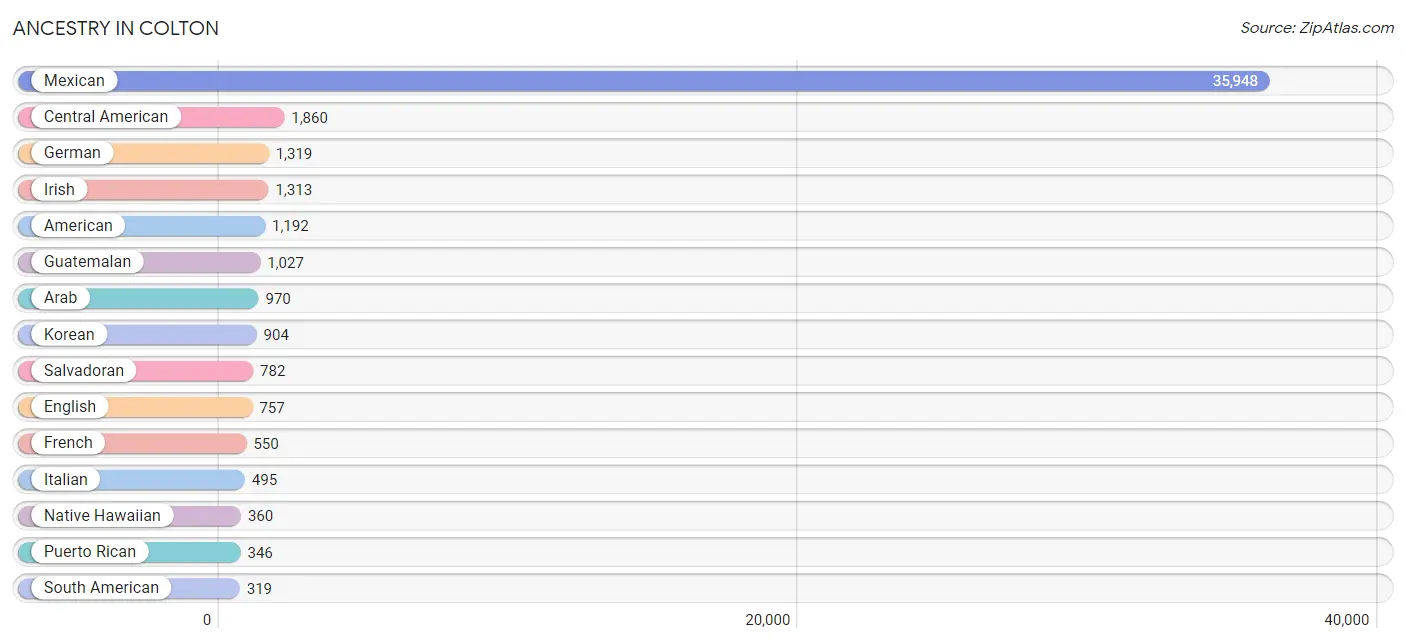
Ancestry in Colton
The most populous ancestries reported in Colton are Mexican (35,948 | 66.6%), Central American (1,860 | 3.5%), German (1,319 | 2.4%), Irish (1,313 | 2.4%), and American (1,192 | 2.2%), together accounting for 77.1% of all Colton residents.
| Ancestry | # Population | % Population |
| African | 134 | 0.3% |
| American | 1,192 | 2.2% |
| Arab | 970 | 1.8% |
| Argentinean | 79 | 0.2% |
| Armenian | 103 | 0.2% |
| Austrian | 15 | 0.0% |
| Bhutanese | 97 | 0.2% |
| Brazilian | 19 | 0.0% |
| British | 7 | 0.0% |
| British West Indian | 2 | 0.0% |
| Burmese | 131 | 0.2% |
| Central American | 1,860 | 3.5% |
| Central American Indian | 70 | 0.1% |
| Cherokee | 79 | 0.2% |
| Chippewa | 17 | 0.0% |
| Colombian | 23 | 0.0% |
| Costa Rican | 14 | 0.0% |
| Creek | 3 | 0.0% |
| Cuban | 21 | 0.0% |
| Czech | 10 | 0.0% |
| Czechoslovakian | 9 | 0.0% |
| Danish | 51 | 0.1% |
| Dutch | 93 | 0.2% |
| Eastern European | 70 | 0.1% |
| Ecuadorian | 192 | 0.4% |
| Egyptian | 41 | 0.1% |
| English | 757 | 1.4% |
| European | 123 | 0.2% |
| Finnish | 34 | 0.1% |
| French | 550 | 1.0% |
| French Canadian | 23 | 0.0% |
| German | 1,319 | 2.4% |
| Ghanaian | 16 | 0.0% |
| Greek | 46 | 0.1% |
| Guamanian / Chamorro | 23 | 0.0% |
| Guatemalan | 1,027 | 1.9% |
| Guyanese | 2 | 0.0% |
| Hopi | 20 | 0.0% |
| Hungarian | 7 | 0.0% |
| Indian (Asian) | 212 | 0.4% |
| Irish | 1,313 | 2.4% |
| Italian | 495 | 0.9% |
| Jamaican | 118 | 0.2% |
| Jordanian | 103 | 0.2% |
| Korean | 904 | 1.7% |
| Laotian | 103 | 0.2% |
| Latvian | 2 | 0.0% |
| Lebanese | 113 | 0.2% |
| Lithuanian | 14 | 0.0% |
| Malaysian | 46 | 0.1% |
| Mexican | 35,948 | 66.6% |
| Mexican American Indian | 257 | 0.5% |
| Native Hawaiian | 360 | 0.7% |
| Navajo | 62 | 0.1% |
| Nicaraguan | 37 | 0.1% |
| Nigerian | 62 | 0.1% |
| Northern European | 29 | 0.1% |
| Norwegian | 220 | 0.4% |
| Pakistani | 35 | 0.1% |
| Palestinian | 149 | 0.3% |
| Peruvian | 10 | 0.0% |
| Pima | 18 | 0.0% |
| Polish | 156 | 0.3% |
| Portuguese | 139 | 0.3% |
| Puerto Rican | 346 | 0.6% |
| Romanian | 39 | 0.1% |
| Russian | 75 | 0.1% |
| Salvadoran | 782 | 1.5% |
| Scandinavian | 44 | 0.1% |
| Scotch-Irish | 19 | 0.0% |
| Scottish | 193 | 0.4% |
| Seminole | 10 | 0.0% |
| South American | 319 | 0.6% |
| Spaniard | 114 | 0.2% |
| Spanish | 94 | 0.2% |
| Sri Lankan | 222 | 0.4% |
| Subsaharan African | 232 | 0.4% |
| Swedish | 211 | 0.4% |
| Swiss | 18 | 0.0% |
| Syrian | 6 | 0.0% |
| Thai | 233 | 0.4% |
| Tongan | 79 | 0.2% |
| Ukrainian | 20 | 0.0% |
| Venezuelan | 15 | 0.0% |
| Welsh | 77 | 0.1% |
| West Indian | 20 | 0.0% | View All 86 Rows |
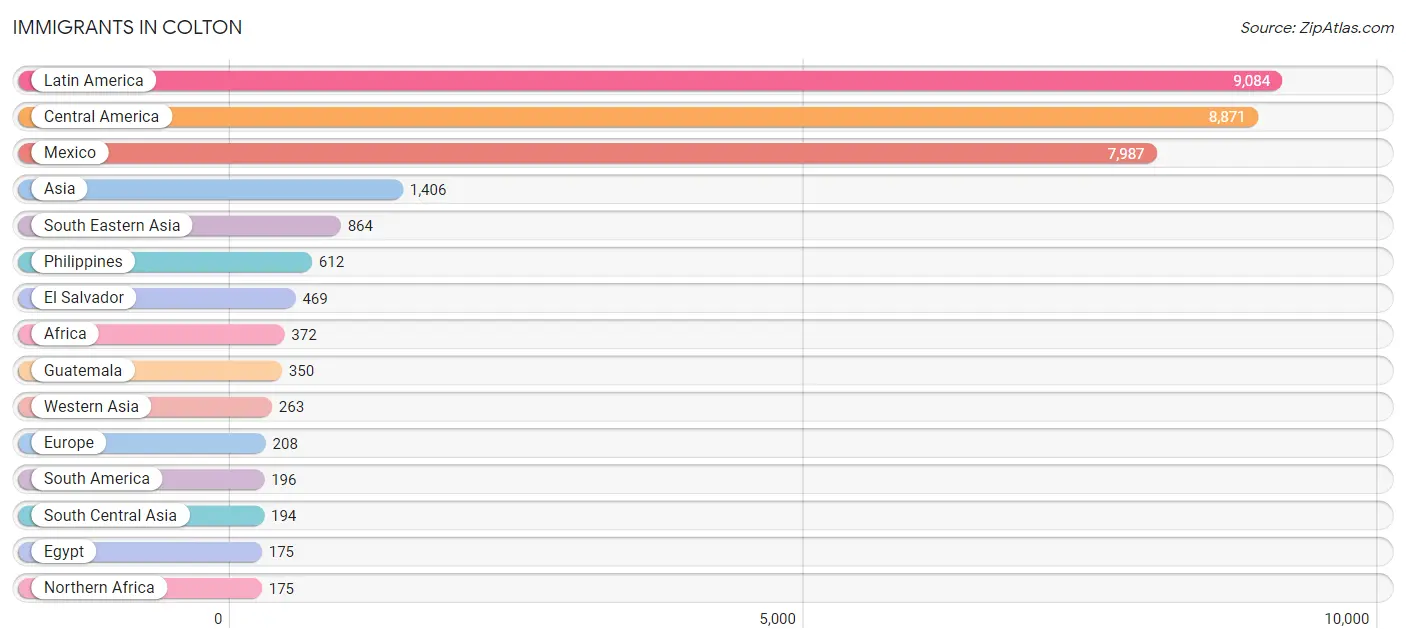
Immigrants in Colton
The most numerous immigrant groups reported in Colton came from Latin America (9,084 | 16.8%), Central America (8,871 | 16.4%), Mexico (7,987 | 14.8%), Asia (1,406 | 2.6%), and South Eastern Asia (864 | 1.6%), together accounting for 52.3% of all Colton residents.
| Immigration Origin | # Population | % Population |
| Africa | 372 | 0.7% |
| Albania | 14 | 0.0% |
| Argentina | 58 | 0.1% |
| Armenia | 24 | 0.0% |
| Asia | 1,406 | 2.6% |
| Australia | 27 | 0.1% |
| Bangladesh | 19 | 0.0% |
| Belize | 6 | 0.0% |
| Cambodia | 8 | 0.0% |
| Cameroon | 10 | 0.0% |
| Canada | 13 | 0.0% |
| Caribbean | 17 | 0.0% |
| Central America | 8,871 | 16.4% |
| China | 66 | 0.1% |
| Colombia | 7 | 0.0% |
| Costa Rica | 7 | 0.0% |
| Denmark | 21 | 0.0% |
| Eastern Africa | 18 | 0.0% |
| Eastern Asia | 85 | 0.2% |
| Eastern Europe | 128 | 0.2% |
| Ecuador | 85 | 0.2% |
| Egypt | 175 | 0.3% |
| El Salvador | 469 | 0.9% |
| Ethiopia | 8 | 0.0% |
| Europe | 208 | 0.4% |
| Germany | 24 | 0.0% |
| Ghana | 27 | 0.1% |
| Guatemala | 350 | 0.6% |
| Guyana | 31 | 0.1% |
| India | 94 | 0.2% |
| Indonesia | 84 | 0.2% |
| Iran | 71 | 0.1% |
| Italy | 5 | 0.0% |
| Jamaica | 17 | 0.0% |
| Jordan | 79 | 0.2% |
| Korea | 19 | 0.0% |
| Kuwait | 11 | 0.0% |
| Latin America | 9,084 | 16.8% |
| Lebanon | 56 | 0.1% |
| Mexico | 7,987 | 14.8% |
| Middle Africa | 10 | 0.0% |
| Nicaragua | 41 | 0.1% |
| Nigeria | 134 | 0.3% |
| Northern Africa | 175 | 0.3% |
| Northern Europe | 37 | 0.1% |
| Norway | 16 | 0.0% |
| Oceania | 50 | 0.1% |
| Panama | 11 | 0.0% |
| Philippines | 612 | 1.1% |
| Poland | 70 | 0.1% |
| Romania | 35 | 0.1% |
| Russia | 9 | 0.0% |
| South America | 196 | 0.4% |
| South Central Asia | 194 | 0.4% |
| South Eastern Asia | 864 | 1.6% |
| Southern Europe | 19 | 0.0% |
| Spain | 14 | 0.0% |
| Sri Lanka | 10 | 0.0% |
| Syria | 93 | 0.2% |
| Thailand | 34 | 0.1% |
| Venezuela | 15 | 0.0% |
| Vietnam | 126 | 0.2% |
| Western Africa | 161 | 0.3% |
| Western Asia | 263 | 0.5% |
| Western Europe | 24 | 0.0% | View All 65 Rows |
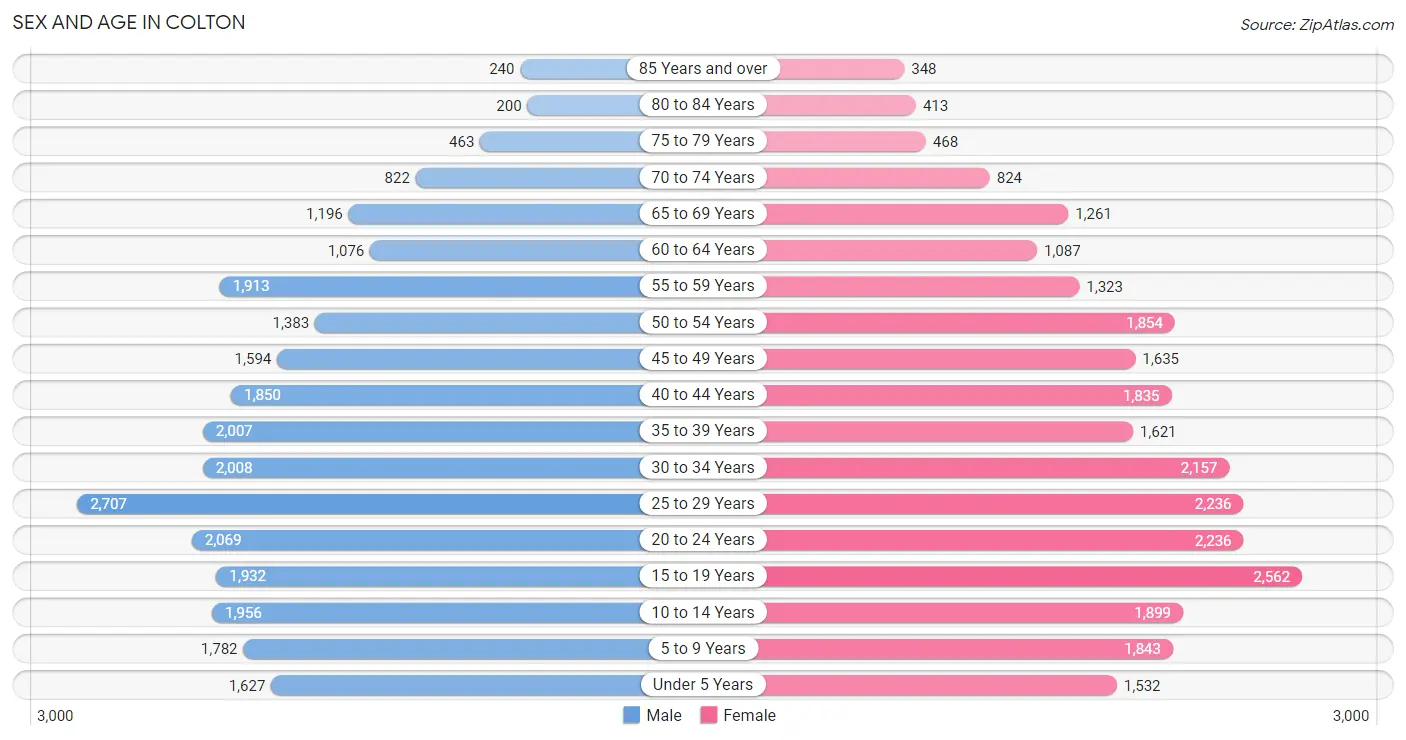
Sex and Age in Colton
Sex and Age in Colton
The most populous age groups in Colton are 25 to 29 Years (2,707 | 10.1%) for men and 15 to 19 Years (2,562 | 9.4%) for women.
| Age Bracket | Male | Female |
| Under 5 Years | 1,627 (6.1%) | 1,532 (5.7%) |
| 5 to 9 Years | 1,782 (6.6%) | 1,843 (6.8%) |
| 10 to 14 Years | 1,956 (7.3%) | 1,899 (7.0%) |
| 15 to 19 Years | 1,932 (7.2%) | 2,562 (9.4%) |
| 20 to 24 Years | 2,069 (7.7%) | 2,236 (8.2%) |
| 25 to 29 Years | 2,707 (10.1%) | 2,236 (8.2%) |
| 30 to 34 Years | 2,008 (7.5%) | 2,157 (8.0%) |
| 35 to 39 Years | 2,007 (7.5%) | 1,621 (6.0%) |
| 40 to 44 Years | 1,850 (6.9%) | 1,835 (6.8%) |
| 45 to 49 Years | 1,594 (5.9%) | 1,635 (6.0%) |
| 50 to 54 Years | 1,383 (5.2%) | 1,854 (6.8%) |
| 55 to 59 Years | 1,913 (7.1%) | 1,323 (4.9%) |
| 60 to 64 Years | 1,076 (4.0%) | 1,087 (4.0%) |
| 65 to 69 Years | 1,196 (4.5%) | 1,261 (4.6%) |
| 70 to 74 Years | 822 (3.1%) | 824 (3.0%) |
| 75 to 79 Years | 463 (1.7%) | 468 (1.7%) |
| 80 to 84 Years | 200 (0.7%) | 413 (1.5%) |
| 85 Years and over | 240 (0.9%) | 348 (1.3%) |
| Total | 26,825 (100.0%) | 27,134 (100.0%) |
Families and Households in Colton
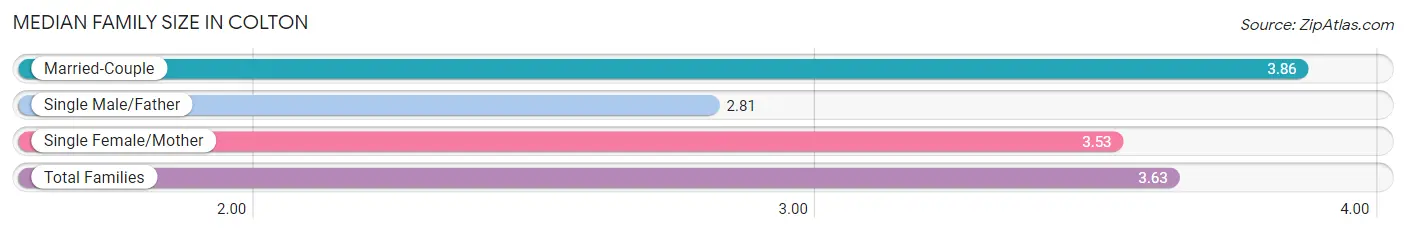
Median Family Size in Colton
The median family size in Colton is 3.63 persons per family, with married-couple families (7,834 | 60.5%) accounting for the largest median family size of 3.86 persons per family. On the other hand, single male/father families (1,711 | 13.2%) represent the smallest median family size with 2.81 persons per family.
| Family Type | # Families | Family Size |
| Married-Couple | 7,834 (60.5%) | 3.86 |
| Single Male/Father | 1,711 (13.2%) | 2.81 |
| Single Female/Mother | 3,403 (26.3%) | 3.53 |
| Total Families | 12,948 (100.0%) | 3.63 |
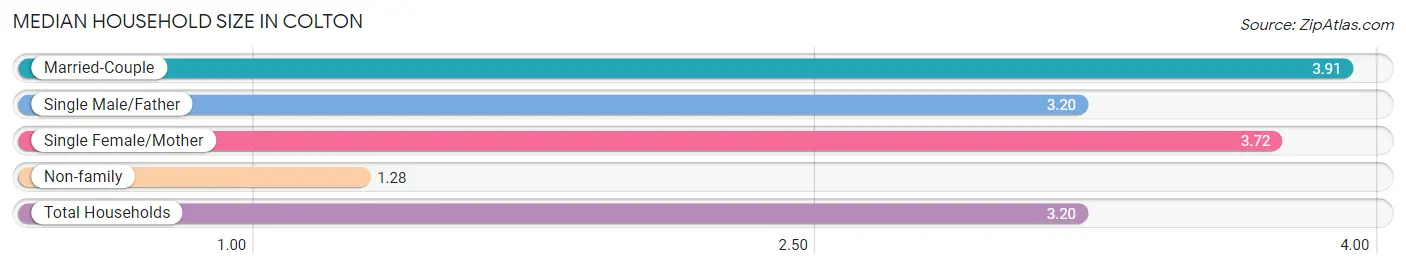
Median Household Size in Colton
The median household size in Colton is 3.20 persons per household, with married-couple households (7,834 | 46.8%) accounting for the largest median household size of 3.91 persons per household. non-family households (3,792 | 22.7%) represent the smallest median household size with 1.28 persons per household.
| Household Type | # Households | Household Size |
| Married-Couple | 7,834 (46.8%) | 3.91 |
| Single Male/Father | 1,711 (10.2%) | 3.20 |
| Single Female/Mother | 3,403 (20.3%) | 3.72 |
| Non-family | 3,792 (22.7%) | 1.28 |
| Total Households | 16,740 (100.0%) | 3.20 |
Household Size by Marriage Status in Colton
Out of a total of 16,740 households in Colton, 12,948 (77.3%) are family households, while 3,792 (22.7%) are nonfamily households. The most numerous type of family households are 2-person households, comprising 3,785, and the most common type of nonfamily households are 1-person households, comprising 2,939.
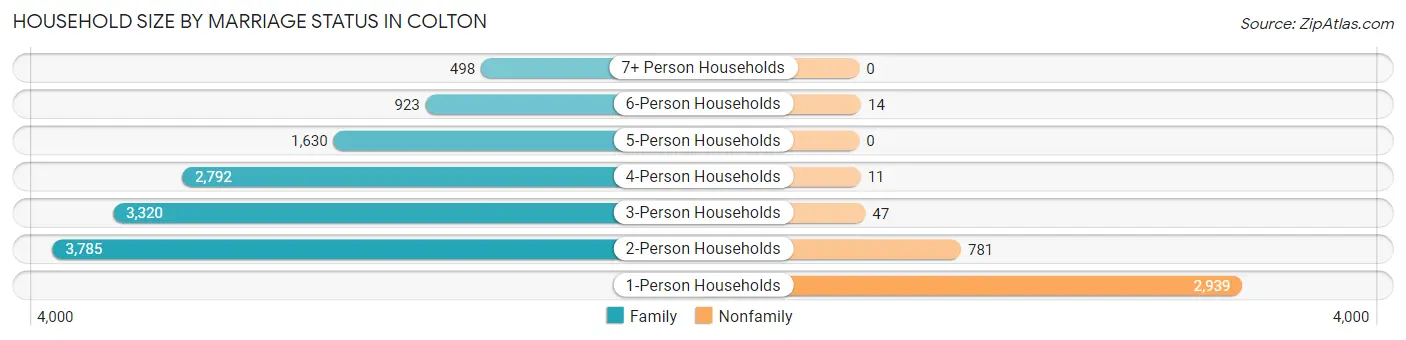
| Household Size | Family Households | Nonfamily Households |
| 1-Person Households | - | 2,939 (17.6%) |
| 2-Person Households | 3,785 (22.6%) | 781 (4.7%) |
| 3-Person Households | 3,320 (19.8%) | 47 (0.3%) |
| 4-Person Households | 2,792 (16.7%) | 11 (0.1%) |
| 5-Person Households | 1,630 (9.7%) | 0 (0.0%) |
| 6-Person Households | 923 (5.5%) | 14 (0.1%) |
| 7+ Person Households | 498 (3.0%) | 0 (0.0%) |
| Total | 12,948 (77.3%) | 3,792 (22.7%) |
Female Fertility in Colton
Fertility by Age in Colton
Average fertility rate in Colton is 44.0 births per 1,000 women. Women in the age bracket of 20 to 34 years have the highest fertility rate with 78.0 births per 1,000 women. Women in the age bracket of 20 to 34 years acount for 79.8% of all women with births.
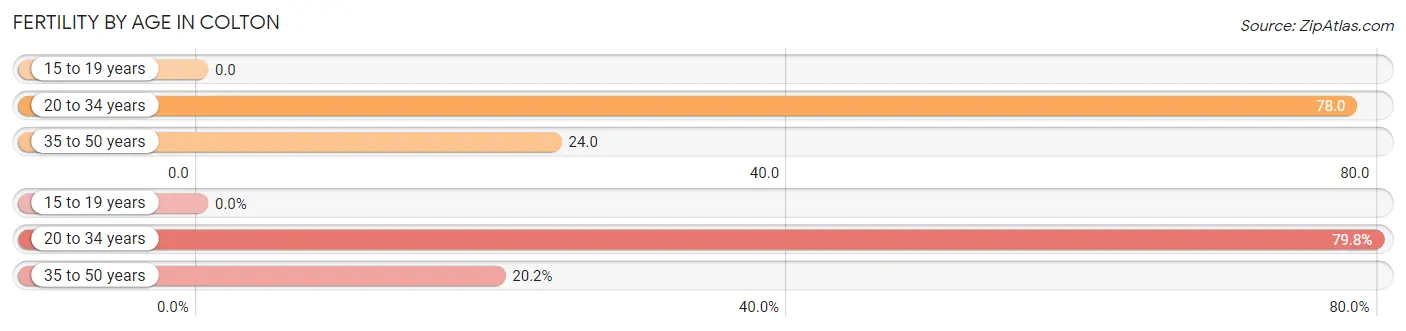
| Age Bracket | Women with Births | Births / 1,000 Women |
| 15 to 19 years | 0 (0.0%) | 0.0 |
| 20 to 34 years | 518 (79.8%) | 78.0 |
| 35 to 50 years | 131 (20.2%) | 24.0 |
| Total | 649 (100.0%) | 44.0 |
Fertility by Age by Marriage Status in Colton
62.6% of women with births (649) in Colton are married. The highest percentage of unmarried women with births falls into 35 to 50 years age bracket with 41.2% of them unmarried at the time of birth, while the lowest percentage of unmarried women with births belong to 20 to 34 years age bracket with 36.5% of them unmarried.
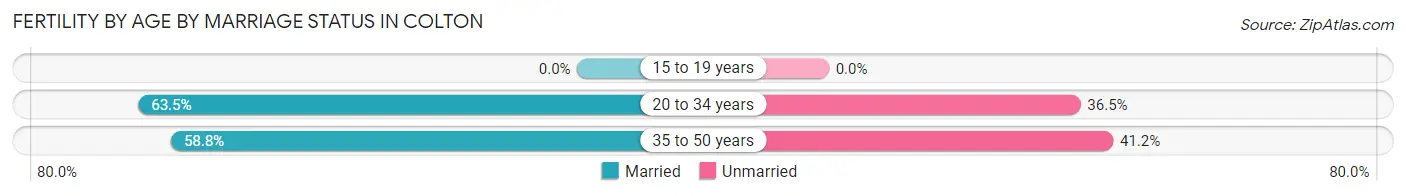
| Age Bracket | Married | Unmarried |
| 15 to 19 years | 0 (0.0%) | 0 (0.0%) |
| 20 to 34 years | 329 (63.5%) | 189 (36.5%) |
| 35 to 50 years | 77 (58.8%) | 54 (41.2%) |
| Total | 406 (62.6%) | 243 (37.4%) |
Fertility by Education in Colton
Average fertility rate in Colton is 44.0 births per 1,000 women. Women with the education attainment of graduate degree have the highest fertility rate of 111.0 births per 1,000 women, while women with the education attainment of high school diploma have the lowest fertility at 34.0 births per 1,000 women. Women with the education attainment of college or associate's degree represent 30.5% of all women with births.
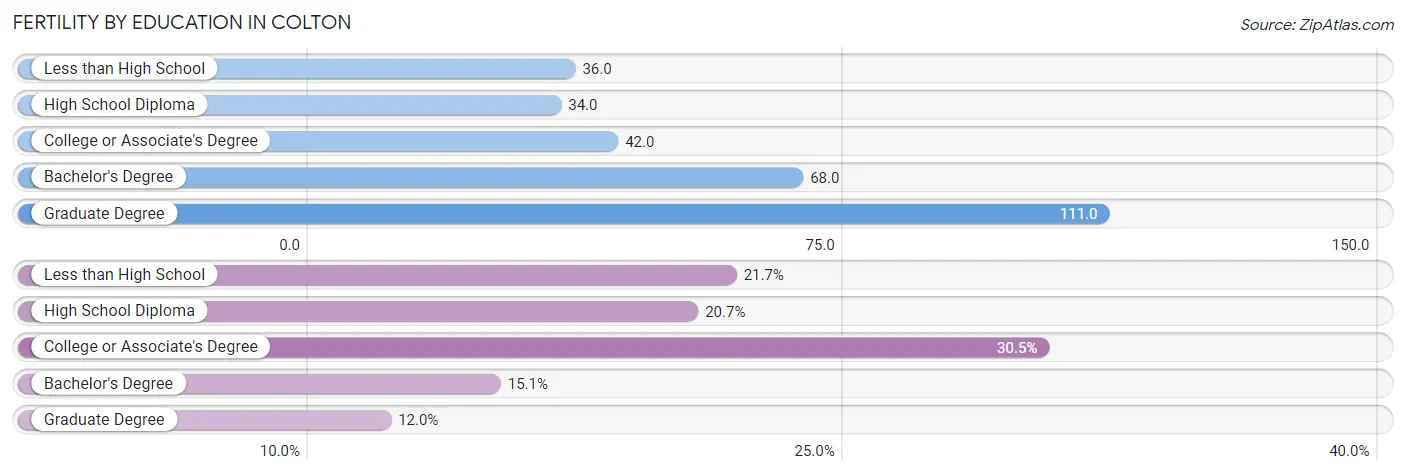
| Educational Attainment | Women with Births | Births / 1,000 Women |
| Less than High School | 141 (21.7%) | 36.0 |
| High School Diploma | 134 (20.6%) | 34.0 |
| College or Associate's Degree | 198 (30.5%) | 42.0 |
| Bachelor's Degree | 98 (15.1%) | 68.0 |
| Graduate Degree | 78 (12.0%) | 111.0 |
| Total | 649 (100.0%) | 44.0 |
Fertility by Education by Marriage Status in Colton
37.4% of women with births in Colton are unmarried. Women with the educational attainment of graduate degree are most likely to be married with 100.0% of them married at childbirth, while women with the educational attainment of less than high school are least likely to be married with 83.0% of them unmarried at childbirth.
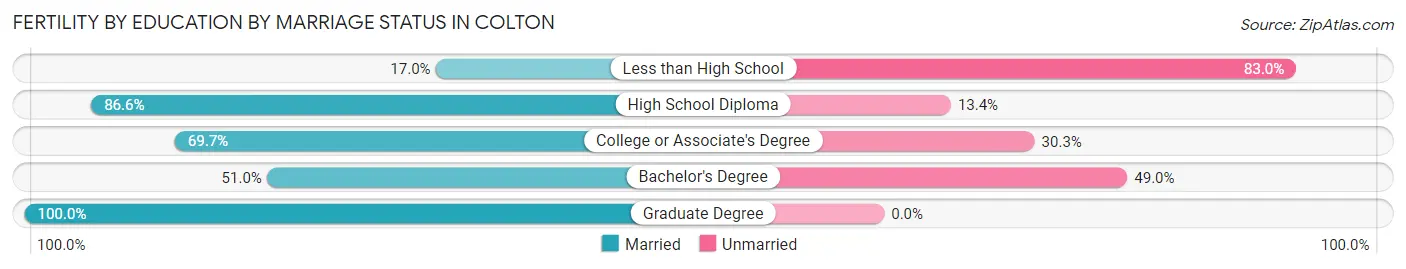
| Educational Attainment | Married | Unmarried |
| Less than High School | 24 (17.0%) | 117 (83.0%) |
| High School Diploma | 116 (86.6%) | 18 (13.4%) |
| College or Associate's Degree | 138 (69.7%) | 60 (30.3%) |
| Bachelor's Degree | 50 (51.0%) | 48 (49.0%) |
| Graduate Degree | 78 (100.0%) | 0 (0.0%) |
| Total | 406 (62.6%) | 243 (37.4%) |
Employment Characteristics in Colton
Employment by Class of Employer in Colton
Among the 24,177 employed individuals in Colton, private company employees (17,098 | 70.7%), local government employees (2,409 | 10.0%), and not-for-profit organizations (1,583 | 6.6%) make up the most common classes of employment.
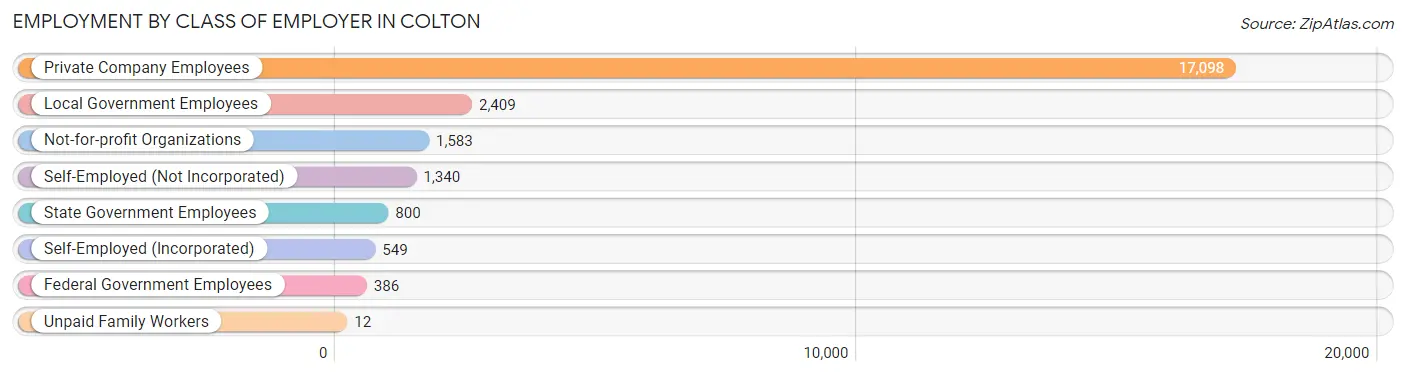
| Employer Class | # Employees | % Employees |
| Private Company Employees | 17,098 | 70.7% |
| Self-Employed (Incorporated) | 549 | 2.3% |
| Self-Employed (Not Incorporated) | 1,340 | 5.5% |
| Not-for-profit Organizations | 1,583 | 6.6% |
| Local Government Employees | 2,409 | 10.0% |
| State Government Employees | 800 | 3.3% |
| Federal Government Employees | 386 | 1.6% |
| Unpaid Family Workers | 12 | 0.1% |
| Total | 24,177 | 100.0% |
Employment Status by Age in Colton
According to the labor force statistics for Colton, out of the total population over 16 years of age (42,425), 62.9% or 26,685 individuals are in the labor force, with 7.4% or 1,975 of them unemployed. The age group with the highest labor force participation rate is 30 to 34 years, with 82.7% or 3,444 individuals in the labor force. Within the labor force, the 65 to 74 years age range has the highest percentage of unemployed individuals, with 10.4% or 86 of them being unemployed.
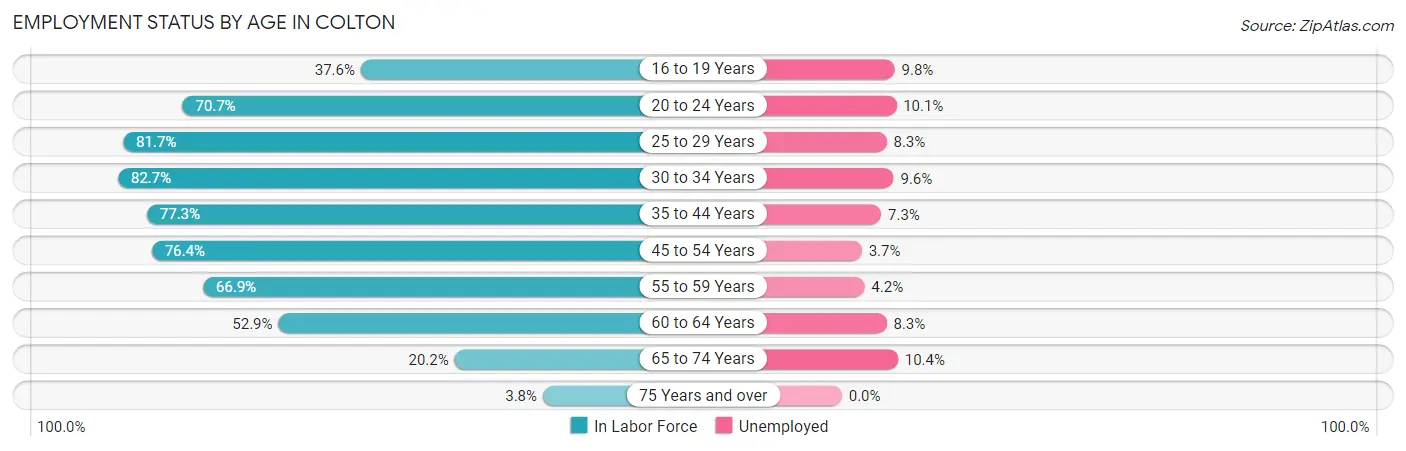
| Age Bracket | In Labor Force | Unemployed |
| 16 to 19 Years | 1,353 (37.6%) | 133 (9.8%) |
| 20 to 24 Years | 3,044 (70.7%) | 307 (10.1%) |
| 25 to 29 Years | 4,038 (81.7%) | 335 (8.3%) |
| 30 to 34 Years | 3,444 (82.7%) | 331 (9.6%) |
| 35 to 44 Years | 5,653 (77.3%) | 413 (7.3%) |
| 45 to 54 Years | 4,940 (76.4%) | 183 (3.7%) |
| 55 to 59 Years | 2,165 (66.9%) | 91 (4.2%) |
| 60 to 64 Years | 1,144 (52.9%) | 95 (8.3%) |
| 65 to 74 Years | 829 (20.2%) | 86 (10.4%) |
| 75 Years and over | 81 (3.8%) | 0 (0.0%) |
| Total | 26,685 (62.9%) | 1,975 (7.4%) |
Employment Status by Educational Attainment in Colton
According to labor force statistics for Colton, 75.6% of individuals (21,384) out of the total population between 25 and 64 years of age (28,286) are in the labor force, with 6.8% or 1,454 of them being unemployed. The group with the highest labor force participation rate are those with the educational attainment of bachelor's degree or higher, with 88.1% or 4,437 individuals in the labor force. Within the labor force, individuals with less than high school education have the highest percentage of unemployment, with 8.4% or 350 of them being unemployed.
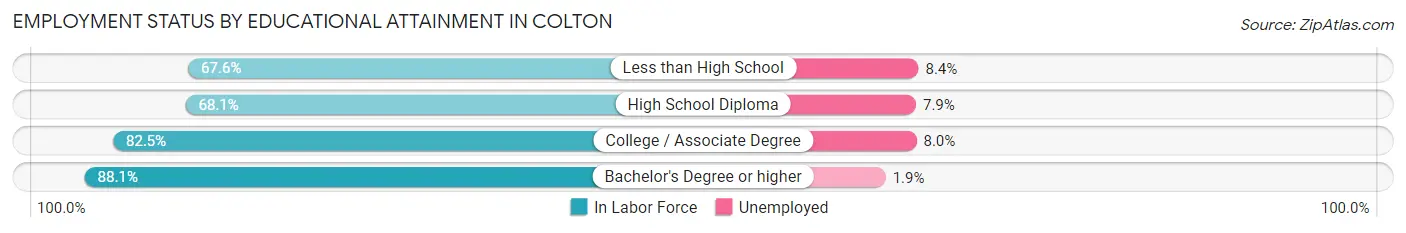
| Educational Attainment | In Labor Force | Unemployed |
| Less than High School | 4,161 (67.6%) | 517 (8.4%) |
| High School Diploma | 6,224 (68.1%) | 722 (7.9%) |
| College / Associate Degree | 6,563 (82.5%) | 636 (8.0%) |
| Bachelor's Degree or higher | 4,437 (88.1%) | 96 (1.9%) |
| Total | 21,384 (75.6%) | 1,923 (6.8%) |
Employment Occupations by Sex in Colton
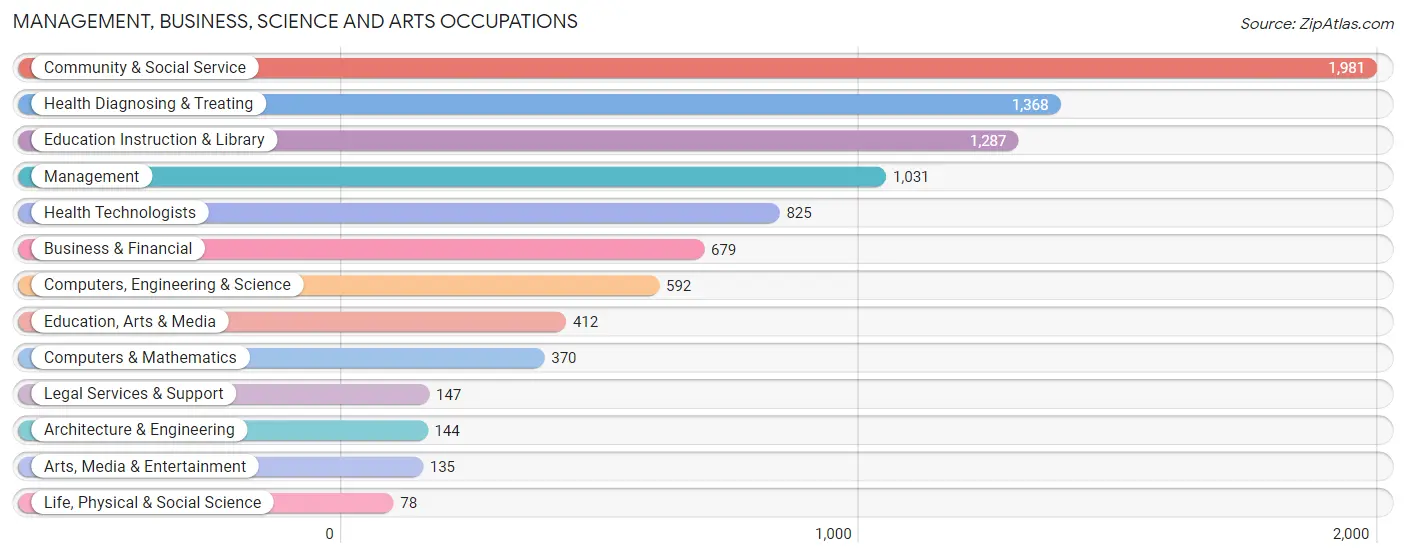
Management, Business, Science and Arts Occupations
The most common Management, Business, Science and Arts occupations in Colton are Community & Social Service (1,981 | 8.0%), Health Diagnosing & Treating (1,368 | 5.5%), Education Instruction & Library (1,287 | 5.2%), Management (1,031 | 4.2%), and Health Technologists (825 | 3.3%).
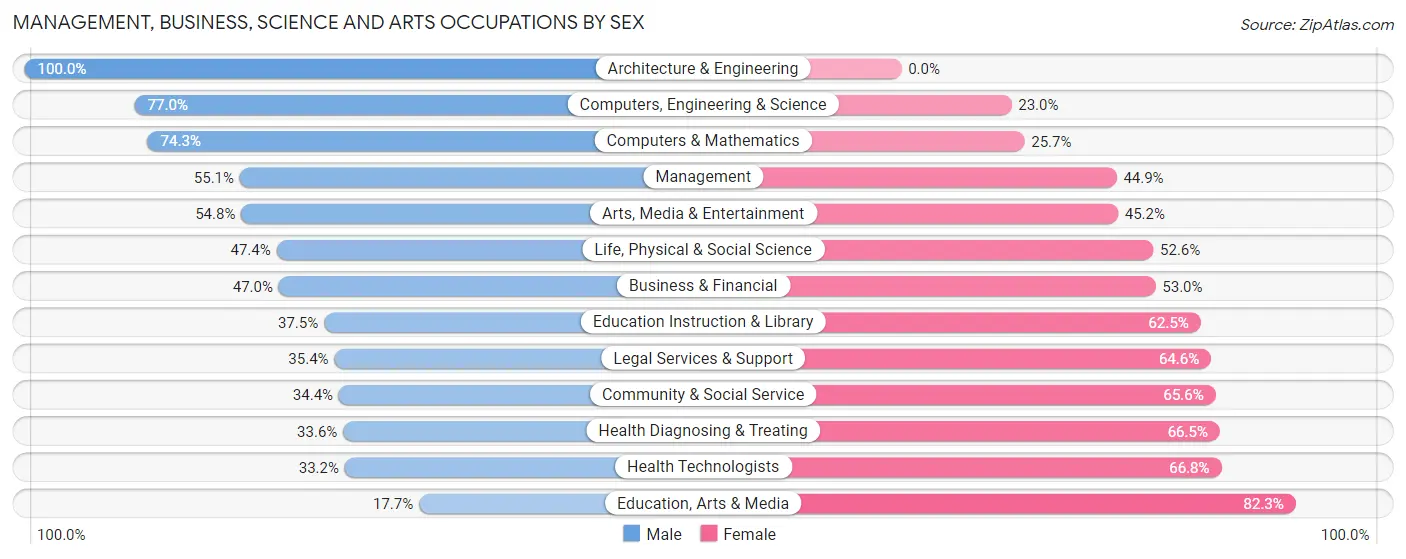
Management, Business, Science and Arts Occupations by Sex
Within the Management, Business, Science and Arts occupations in Colton, the most male-oriented occupations are Architecture & Engineering (100.0%), Computers, Engineering & Science (77.0%), and Computers & Mathematics (74.3%), while the most female-oriented occupations are Education, Arts & Media (82.3%), Health Technologists (66.8%), and Health Diagnosing & Treating (66.4%).
| Occupation | Male | Female |
| Management | 568 (55.1%) | 463 (44.9%) |
| Business & Financial | 319 (47.0%) | 360 (53.0%) |
| Computers, Engineering & Science | 456 (77.0%) | 136 (23.0%) |
| Computers & Mathematics | 275 (74.3%) | 95 (25.7%) |
| Architecture & Engineering | 144 (100.0%) | 0 (0.0%) |
| Life, Physical & Social Science | 37 (47.4%) | 41 (52.6%) |
| Community & Social Service | 682 (34.4%) | 1,299 (65.6%) |
| Education, Arts & Media | 73 (17.7%) | 339 (82.3%) |
| Legal Services & Support | 52 (35.4%) | 95 (64.6%) |
| Education Instruction & Library | 483 (37.5%) | 804 (62.5%) |
| Arts, Media & Entertainment | 74 (54.8%) | 61 (45.2%) |
| Health Diagnosing & Treating | 459 (33.6%) | 909 (66.4%) |
| Health Technologists | 274 (33.2%) | 551 (66.8%) |
| Total (Category) | 2,484 (44.0%) | 3,167 (56.0%) |
| Total (Overall) | 13,630 (55.2%) | 11,071 (44.8%) |
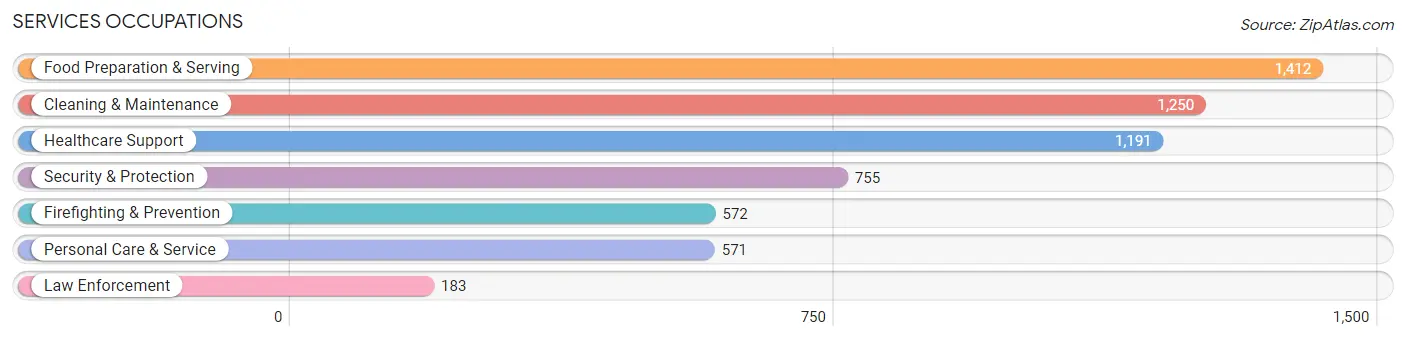
Services Occupations
The most common Services occupations in Colton are Food Preparation & Serving (1,412 | 5.7%), Cleaning & Maintenance (1,250 | 5.1%), Healthcare Support (1,191 | 4.8%), Security & Protection (755 | 3.1%), and Firefighting & Prevention (572 | 2.3%).
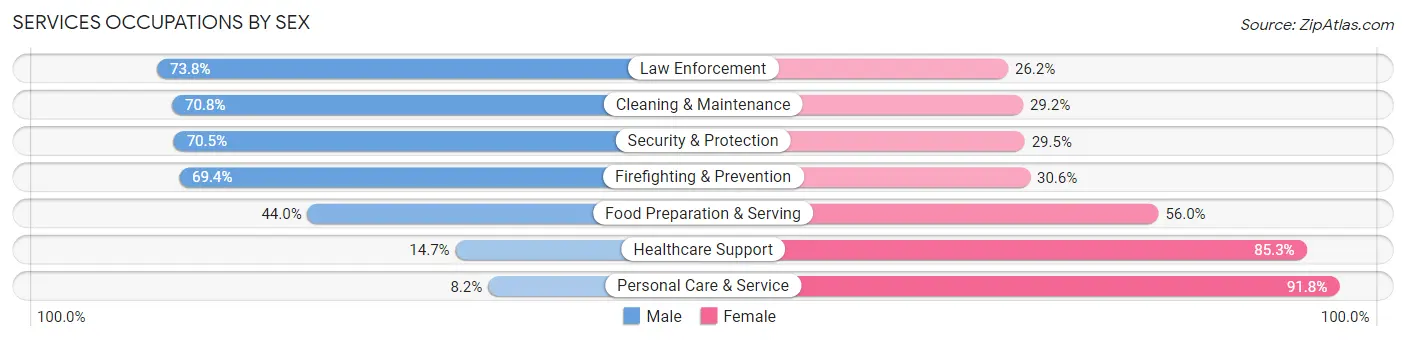
Services Occupations by Sex
Within the Services occupations in Colton, the most male-oriented occupations are Law Enforcement (73.8%), Cleaning & Maintenance (70.8%), and Security & Protection (70.5%), while the most female-oriented occupations are Personal Care & Service (91.8%), Healthcare Support (85.3%), and Food Preparation & Serving (56.0%).
| Occupation | Male | Female |
| Healthcare Support | 175 (14.7%) | 1,016 (85.3%) |
| Security & Protection | 532 (70.5%) | 223 (29.5%) |
| Firefighting & Prevention | 397 (69.4%) | 175 (30.6%) |
| Law Enforcement | 135 (73.8%) | 48 (26.2%) |
| Food Preparation & Serving | 621 (44.0%) | 791 (56.0%) |
| Cleaning & Maintenance | 885 (70.8%) | 365 (29.2%) |
| Personal Care & Service | 47 (8.2%) | 524 (91.8%) |
| Total (Category) | 2,260 (43.6%) | 2,919 (56.4%) |
| Total (Overall) | 13,630 (55.2%) | 11,071 (44.8%) |
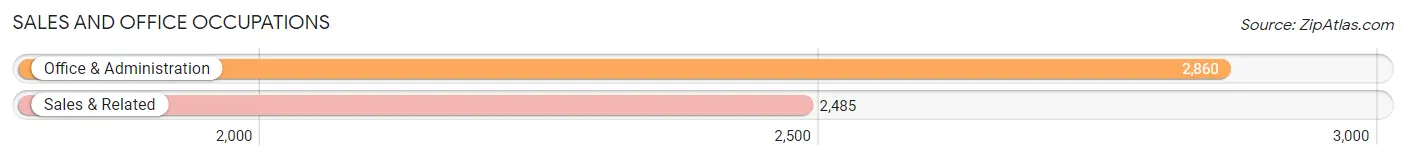
Sales and Office Occupations
The most common Sales and Office occupations in Colton are Office & Administration (2,860 | 11.6%), and Sales & Related (2,485 | 10.1%).
Sales and Office Occupations by Sex
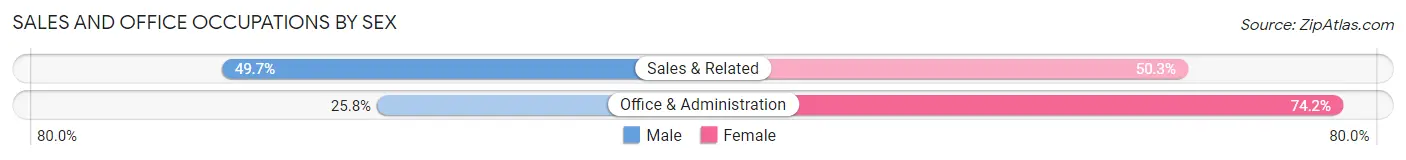
| Occupation | Male | Female |
| Sales & Related | 1,234 (49.7%) | 1,251 (50.3%) |
| Office & Administration | 738 (25.8%) | 2,122 (74.2%) |
| Total (Category) | 1,972 (36.9%) | 3,373 (63.1%) |
| Total (Overall) | 13,630 (55.2%) | 11,071 (44.8%) |
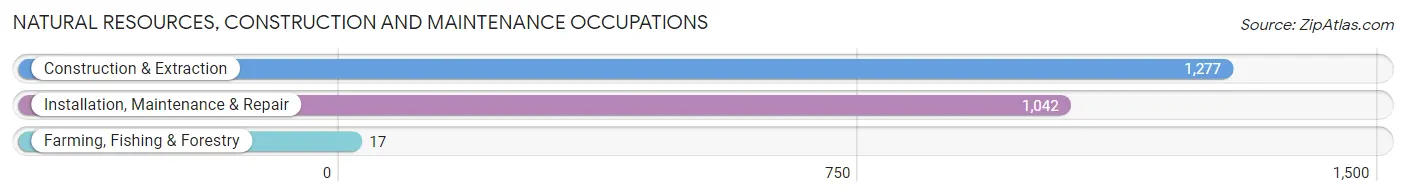
Natural Resources, Construction and Maintenance Occupations
The most common Natural Resources, Construction and Maintenance occupations in Colton are Construction & Extraction (1,277 | 5.2%), Installation, Maintenance & Repair (1,042 | 4.2%), and Farming, Fishing & Forestry (17 | 0.1%).
Natural Resources, Construction and Maintenance Occupations by Sex
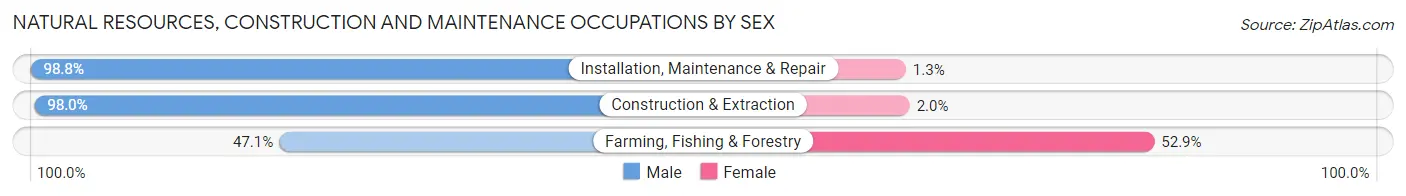
| Occupation | Male | Female |
| Farming, Fishing & Forestry | 8 (47.1%) | 9 (52.9%) |
| Construction & Extraction | 1,251 (98.0%) | 26 (2.0%) |
| Installation, Maintenance & Repair | 1,029 (98.8%) | 13 (1.3%) |
| Total (Category) | 2,288 (98.0%) | 48 (2.1%) |
| Total (Overall) | 13,630 (55.2%) | 11,071 (44.8%) |
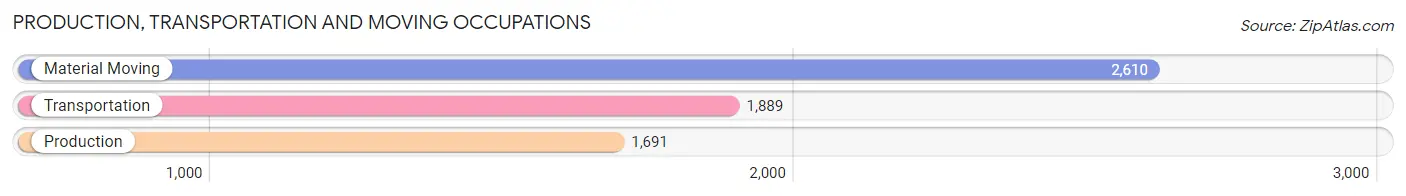
Production, Transportation and Moving Occupations
The most common Production, Transportation and Moving occupations in Colton are Material Moving (2,610 | 10.6%), Transportation (1,889 | 7.6%), and Production (1,691 | 6.9%).
Production, Transportation and Moving Occupations by Sex
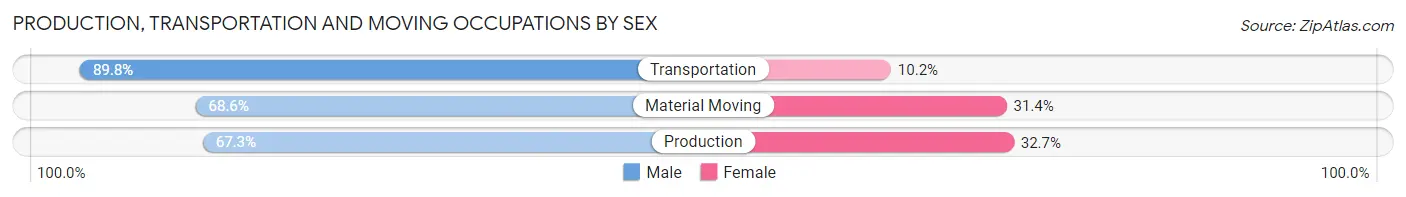
| Occupation | Male | Female |
| Production | 1,138 (67.3%) | 553 (32.7%) |
| Transportation | 1,697 (89.8%) | 192 (10.2%) |
| Material Moving | 1,791 (68.6%) | 819 (31.4%) |
| Total (Category) | 4,626 (74.7%) | 1,564 (25.3%) |
| Total (Overall) | 13,630 (55.2%) | 11,071 (44.8%) |
Employment Industries by Sex in Colton
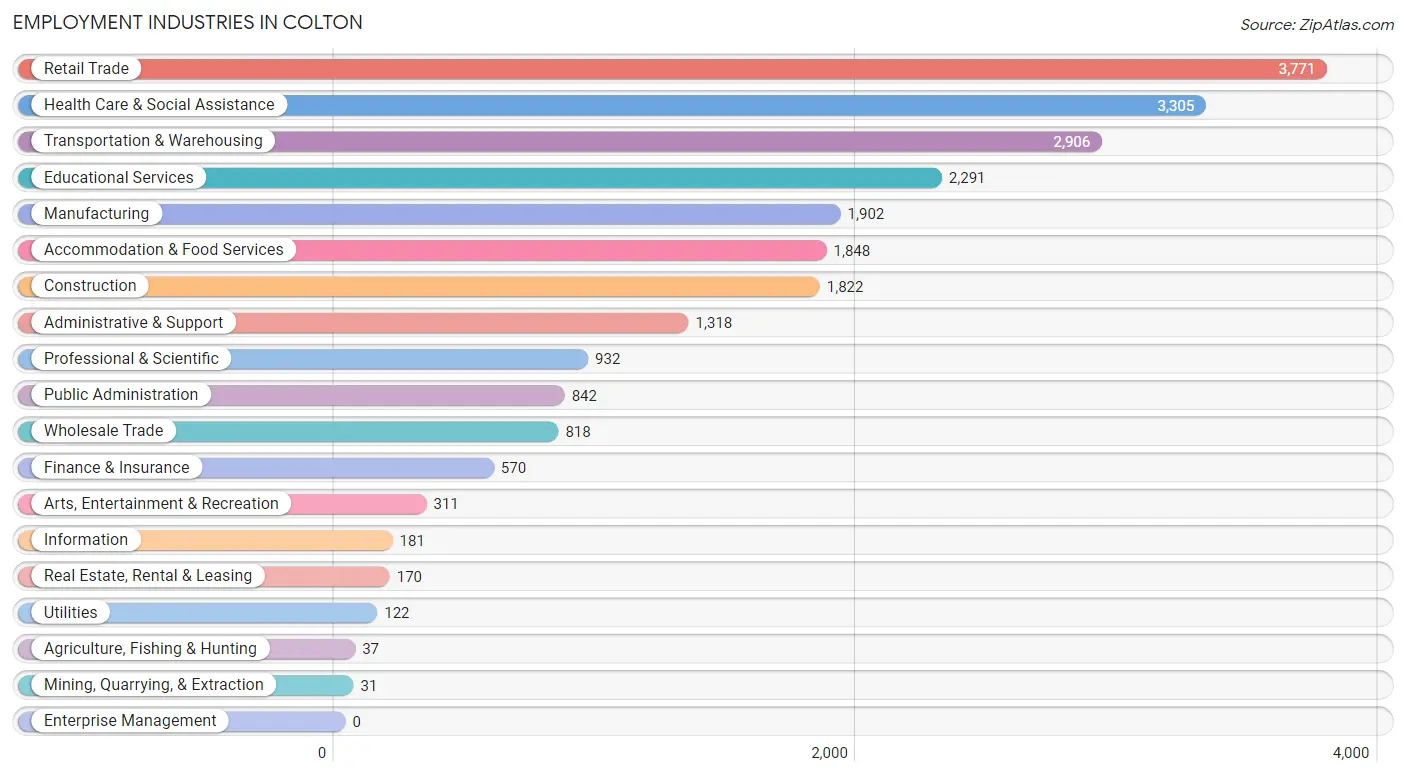
Employment Industries in Colton
The major employment industries in Colton include Retail Trade (3,771 | 15.3%), Health Care & Social Assistance (3,305 | 13.4%), Transportation & Warehousing (2,906 | 11.8%), Educational Services (2,291 | 9.3%), and Manufacturing (1,902 | 7.7%).
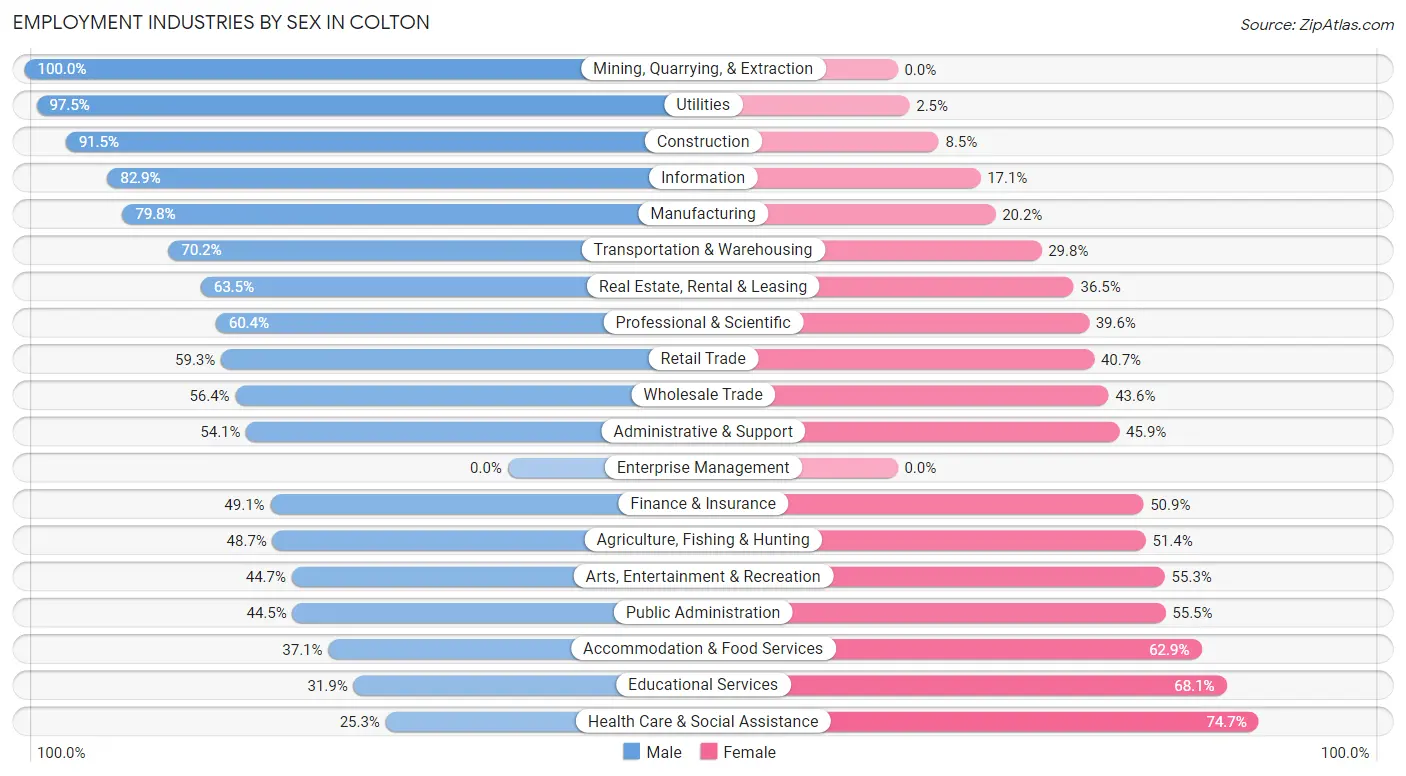
Employment Industries by Sex in Colton
The Colton industries that see more men than women are Mining, Quarrying, & Extraction (100.0%), Utilities (97.5%), and Construction (91.5%), whereas the industries that tend to have a higher number of women are Health Care & Social Assistance (74.7%), Educational Services (68.1%), and Accommodation & Food Services (62.9%).
| Industry | Male | Female |
| Agriculture, Fishing & Hunting | 18 (48.6%) | 19 (51.3%) |
| Mining, Quarrying, & Extraction | 31 (100.0%) | 0 (0.0%) |
| Construction | 1,667 (91.5%) | 155 (8.5%) |
| Manufacturing | 1,517 (79.8%) | 385 (20.2%) |
| Wholesale Trade | 461 (56.4%) | 357 (43.6%) |
| Retail Trade | 2,237 (59.3%) | 1,534 (40.7%) |
| Transportation & Warehousing | 2,041 (70.2%) | 865 (29.8%) |
| Utilities | 119 (97.5%) | 3 (2.5%) |
| Information | 150 (82.9%) | 31 (17.1%) |
| Finance & Insurance | 280 (49.1%) | 290 (50.9%) |
| Real Estate, Rental & Leasing | 108 (63.5%) | 62 (36.5%) |
| Professional & Scientific | 563 (60.4%) | 369 (39.6%) |
| Enterprise Management | 0 (0.0%) | 0 (0.0%) |
| Administrative & Support | 713 (54.1%) | 605 (45.9%) |
| Educational Services | 731 (31.9%) | 1,560 (68.1%) |
| Health Care & Social Assistance | 835 (25.3%) | 2,470 (74.7%) |
| Arts, Entertainment & Recreation | 139 (44.7%) | 172 (55.3%) |
| Accommodation & Food Services | 686 (37.1%) | 1,162 (62.9%) |
| Public Administration | 375 (44.5%) | 467 (55.5%) |
| Total | 13,630 (55.2%) | 11,071 (44.8%) |
Education in Colton
School Enrollment in Colton
The most common levels of schooling among the 14,663 students in Colton are high school (3,668 | 25.0%), college / undergraduate (3,171 | 21.6%), and elementary school (2,818 | 19.2%).
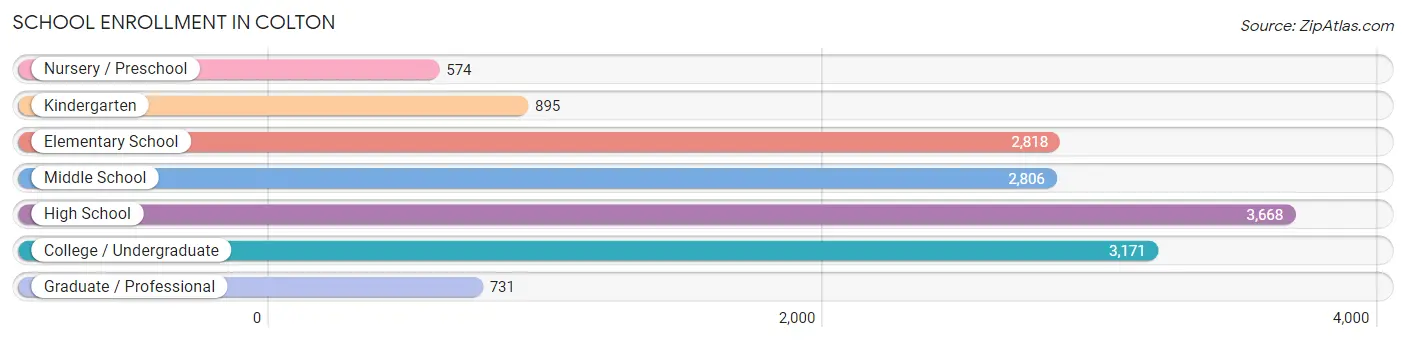
| School Level | # Students | % Students |
| Nursery / Preschool | 574 | 3.9% |
| Kindergarten | 895 | 6.1% |
| Elementary School | 2,818 | 19.2% |
| Middle School | 2,806 | 19.1% |
| High School | 3,668 | 25.0% |
| College / Undergraduate | 3,171 | 21.6% |
| Graduate / Professional | 731 | 5.0% |
| Total | 14,663 | 100.0% |
School Enrollment by Age by Funding Source in Colton
Out of a total of 14,663 students who are enrolled in schools in Colton, 1,305 (8.9%) attend a private institution, while the remaining 13,358 (91.1%) are enrolled in public schools. The age group of 25 to 34 year olds has the highest likelihood of being enrolled in private schools, with 535 (47.5% in the age bracket) enrolled. Conversely, the age group of 10 to 14 year olds has the lowest likelihood of being enrolled in a private school, with 3,655 (98.9% in the age bracket) attending a public institution.
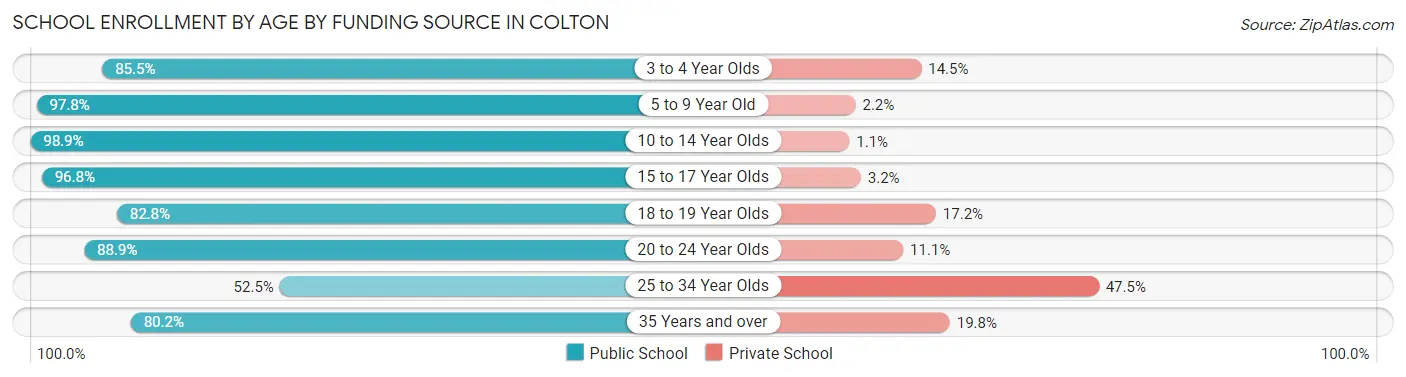
| Age Bracket | Public School | Private School |
| 3 to 4 Year Olds | 479 (85.5%) | 81 (14.5%) |
| 5 to 9 Year Old | 3,360 (97.8%) | 76 (2.2%) |
| 10 to 14 Year Olds | 3,655 (98.9%) | 39 (1.1%) |
| 15 to 17 Year Olds | 2,390 (96.8%) | 79 (3.2%) |
| 18 to 19 Year Olds | 998 (82.8%) | 207 (17.2%) |
| 20 to 24 Year Olds | 1,397 (88.9%) | 174 (11.1%) |
| 25 to 34 Year Olds | 591 (52.5%) | 535 (47.5%) |
| 35 Years and over | 483 (80.2%) | 119 (19.8%) |
| Total | 13,358 (91.1%) | 1,305 (8.9%) |
Educational Attainment by Field of Study in Colton
Business (1,033 | 16.7%), arts & humanities (798 | 12.9%), science & technology (667 | 10.8%), education (616 | 10.0%), and liberal arts & history (452 | 7.3%) are the most common fields of study among 6,172 individuals in Colton who have obtained a bachelor's degree or higher.
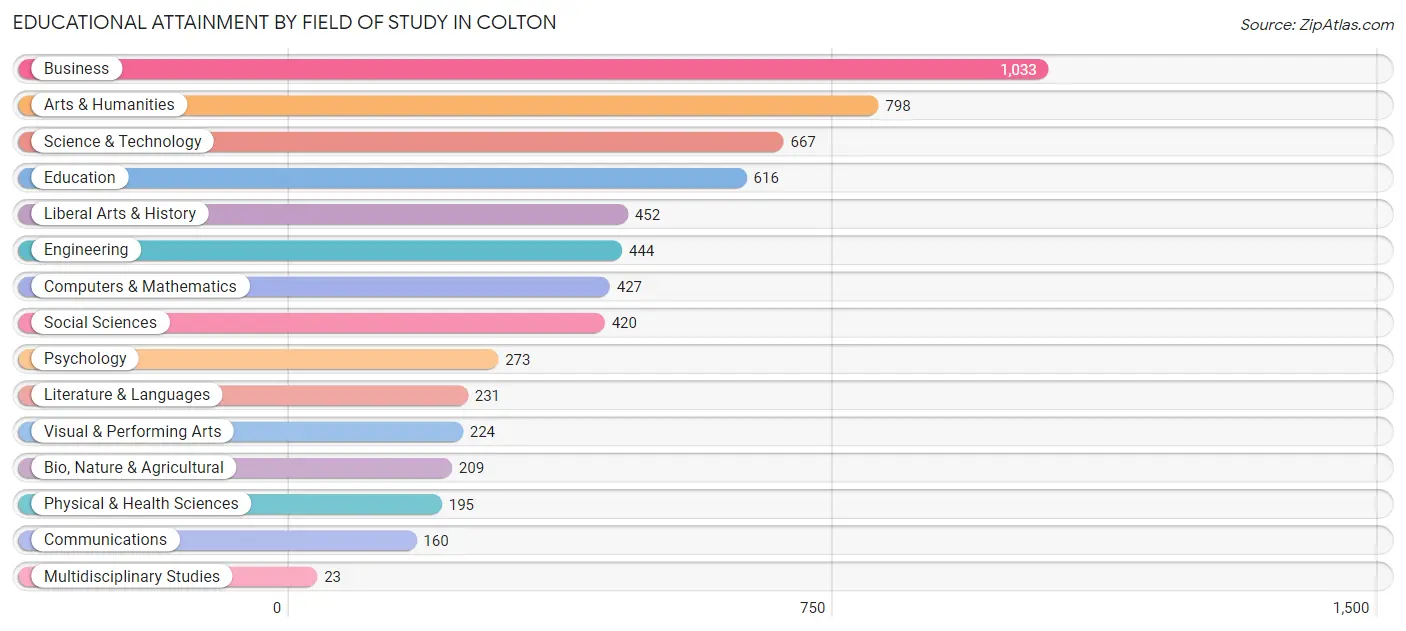
| Field of Study | # Graduates | % Graduates |
| Computers & Mathematics | 427 | 6.9% |
| Bio, Nature & Agricultural | 209 | 3.4% |
| Physical & Health Sciences | 195 | 3.2% |
| Psychology | 273 | 4.4% |
| Social Sciences | 420 | 6.8% |
| Engineering | 444 | 7.2% |
| Multidisciplinary Studies | 23 | 0.4% |
| Science & Technology | 667 | 10.8% |
| Business | 1,033 | 16.7% |
| Education | 616 | 10.0% |
| Literature & Languages | 231 | 3.7% |
| Liberal Arts & History | 452 | 7.3% |
| Visual & Performing Arts | 224 | 3.6% |
| Communications | 160 | 2.6% |
| Arts & Humanities | 798 | 12.9% |
| Total | 6,172 | 100.0% |
Transportation & Commute in Colton
Vehicle Availability by Sex in Colton
The most prevalent vehicle ownership categories in Colton are males with 2 vehicles (4,673, accounting for 34.8%) and females with 2 vehicles (3,955, making up 43.5%).
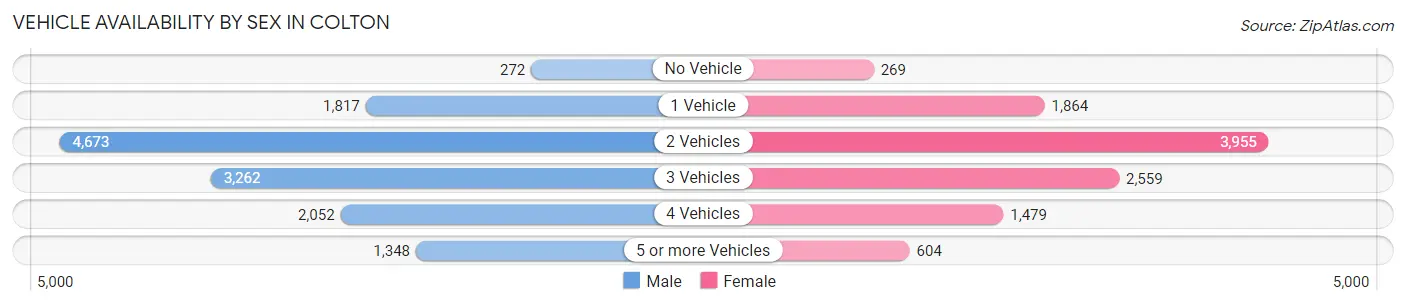
| Vehicles Available | Male | Female |
| No Vehicle | 272 (2.0%) | 269 (2.5%) |
| 1 Vehicle | 1,817 (13.5%) | 1,864 (17.4%) |
| 2 Vehicles | 4,673 (34.8%) | 3,955 (36.9%) |
| 3 Vehicles | 3,262 (24.3%) | 2,559 (23.8%) |
| 4 Vehicles | 2,052 (15.3%) | 1,479 (13.8%) |
| 5 or more Vehicles | 1,348 (10.0%) | 604 (5.6%) |
| Total | 13,424 (100.0%) | 10,730 (100.0%) |
Commute Time in Colton
The most frequently occuring commute durations in Colton are 15 to 19 minutes (4,254 commuters, 19.5%), 20 to 24 minutes (3,527 commuters, 16.2%), and 30 to 34 minutes (3,067 commuters, 14.1%).
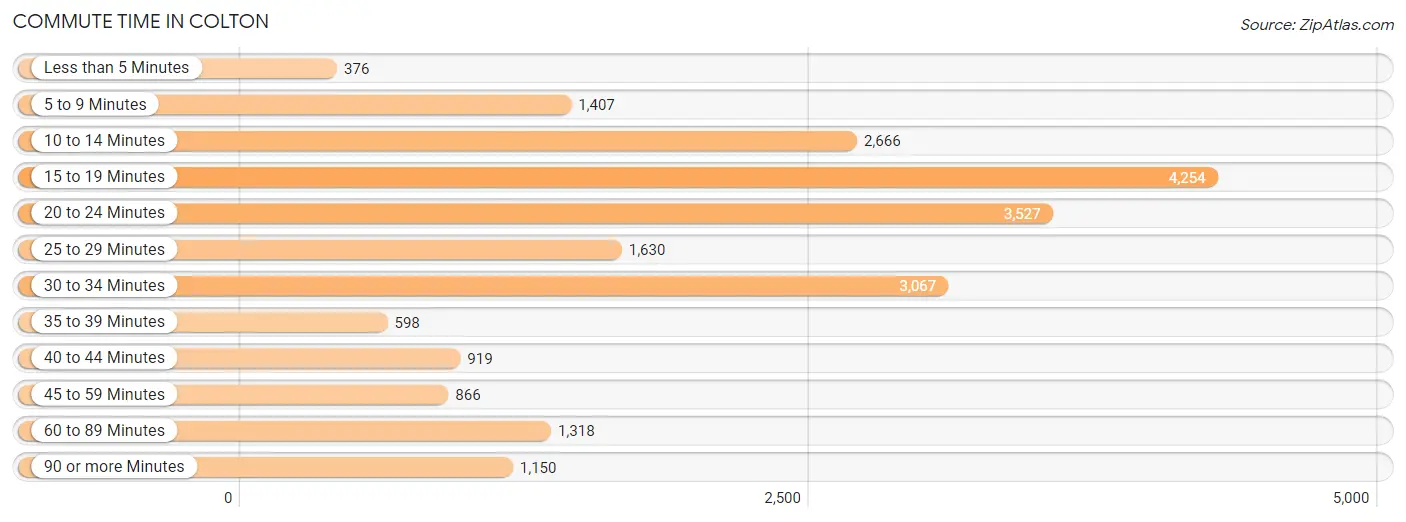
| Commute Time | # Commuters | % Commuters |
| Less than 5 Minutes | 376 | 1.7% |
| 5 to 9 Minutes | 1,407 | 6.5% |
| 10 to 14 Minutes | 2,666 | 12.2% |
| 15 to 19 Minutes | 4,254 | 19.5% |
| 20 to 24 Minutes | 3,527 | 16.2% |
| 25 to 29 Minutes | 1,630 | 7.5% |
| 30 to 34 Minutes | 3,067 | 14.1% |
| 35 to 39 Minutes | 598 | 2.8% |
| 40 to 44 Minutes | 919 | 4.2% |
| 45 to 59 Minutes | 866 | 4.0% |
| 60 to 89 Minutes | 1,318 | 6.0% |
| 90 or more Minutes | 1,150 | 5.3% |
Commute Time by Sex in Colton
The most common commute times in Colton are 15 to 19 minutes (2,348 commuters, 19.4%) for males and 15 to 19 minutes (1,906 commuters, 19.7%) for females.
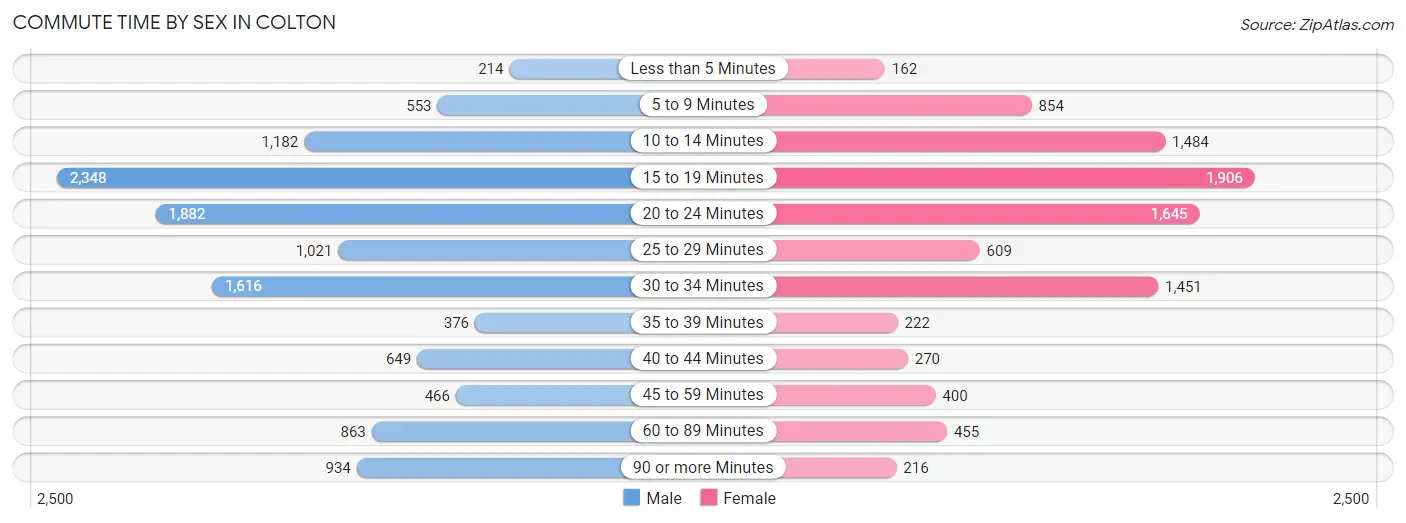
| Commute Time | Male | Female |
| Less than 5 Minutes | 214 (1.8%) | 162 (1.7%) |
| 5 to 9 Minutes | 553 (4.6%) | 854 (8.8%) |
| 10 to 14 Minutes | 1,182 (9.8%) | 1,484 (15.3%) |
| 15 to 19 Minutes | 2,348 (19.4%) | 1,906 (19.7%) |
| 20 to 24 Minutes | 1,882 (15.5%) | 1,645 (17.0%) |
| 25 to 29 Minutes | 1,021 (8.4%) | 609 (6.3%) |
| 30 to 34 Minutes | 1,616 (13.4%) | 1,451 (15.0%) |
| 35 to 39 Minutes | 376 (3.1%) | 222 (2.3%) |
| 40 to 44 Minutes | 649 (5.4%) | 270 (2.8%) |
| 45 to 59 Minutes | 466 (3.8%) | 400 (4.1%) |
| 60 to 89 Minutes | 863 (7.1%) | 455 (4.7%) |
| 90 or more Minutes | 934 (7.7%) | 216 (2.2%) |
Time of Departure to Work by Sex in Colton
The most frequent times of departure to work in Colton are 12:00 AM to 4:59 AM (2,065, 17.1%) for males and 7:00 AM to 7:29 AM (1,631, 16.9%) for females.
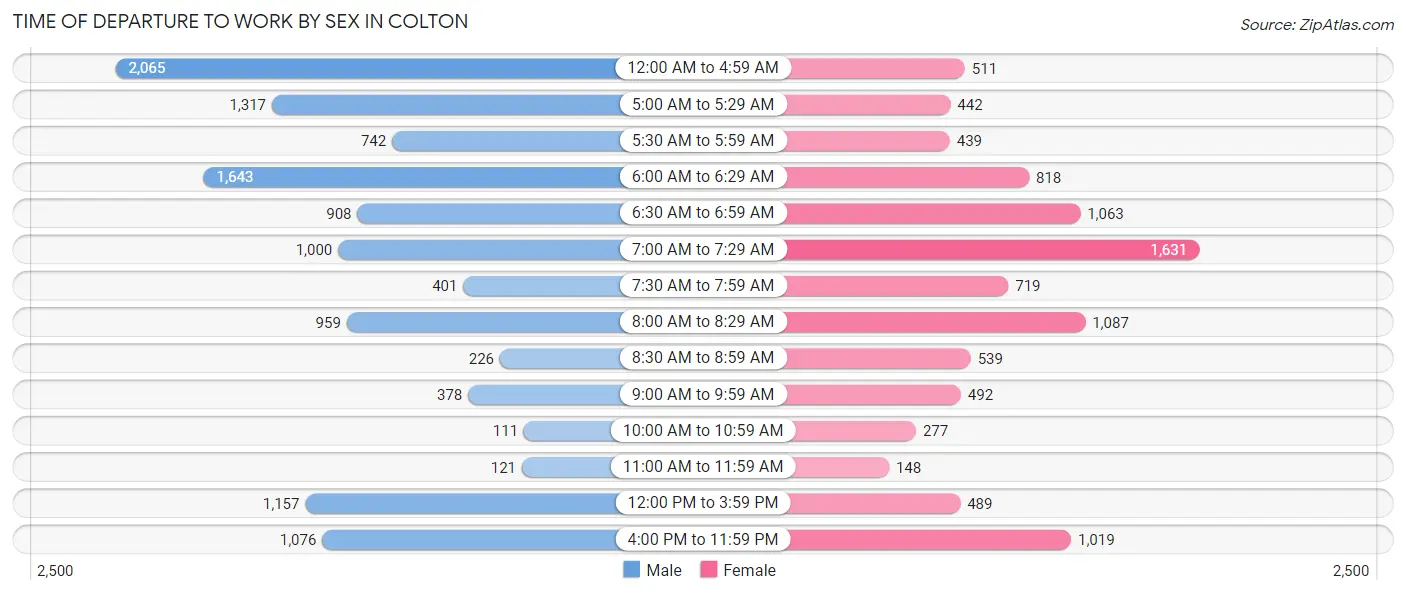
| Time of Departure | Male | Female |
| 12:00 AM to 4:59 AM | 2,065 (17.1%) | 511 (5.3%) |
| 5:00 AM to 5:29 AM | 1,317 (10.9%) | 442 (4.6%) |
| 5:30 AM to 5:59 AM | 742 (6.1%) | 439 (4.5%) |
| 6:00 AM to 6:29 AM | 1,643 (13.6%) | 818 (8.5%) |
| 6:30 AM to 6:59 AM | 908 (7.5%) | 1,063 (11.0%) |
| 7:00 AM to 7:29 AM | 1,000 (8.3%) | 1,631 (16.9%) |
| 7:30 AM to 7:59 AM | 401 (3.3%) | 719 (7.4%) |
| 8:00 AM to 8:29 AM | 959 (7.9%) | 1,087 (11.2%) |
| 8:30 AM to 8:59 AM | 226 (1.9%) | 539 (5.6%) |
| 9:00 AM to 9:59 AM | 378 (3.1%) | 492 (5.1%) |
| 10:00 AM to 10:59 AM | 111 (0.9%) | 277 (2.9%) |
| 11:00 AM to 11:59 AM | 121 (1.0%) | 148 (1.5%) |
| 12:00 PM to 3:59 PM | 1,157 (9.6%) | 489 (5.1%) |
| 4:00 PM to 11:59 PM | 1,076 (8.9%) | 1,019 (10.5%) |
| Total | 12,104 (100.0%) | 9,674 (100.0%) |
Housing Occupancy in Colton
Occupancy by Ownership in Colton
Of the total 16,740 dwellings in Colton, owner-occupied units account for 8,622 (51.5%), while renter-occupied units make up 8,118 (48.5%).
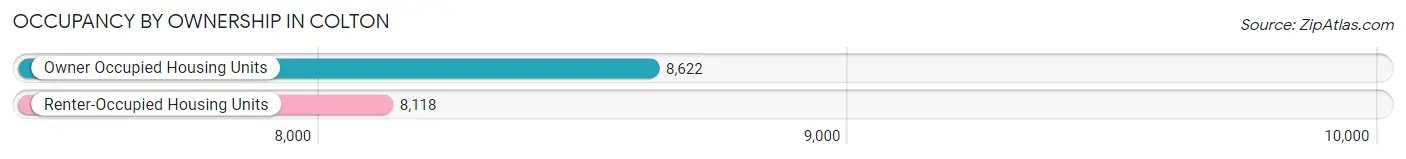
| Occupancy | # Housing Units | % Housing Units |
| Owner Occupied Housing Units | 8,622 | 51.5% |
| Renter-Occupied Housing Units | 8,118 | 48.5% |
| Total Occupied Housing Units | 16,740 | 100.0% |
Occupancy by Household Size in Colton
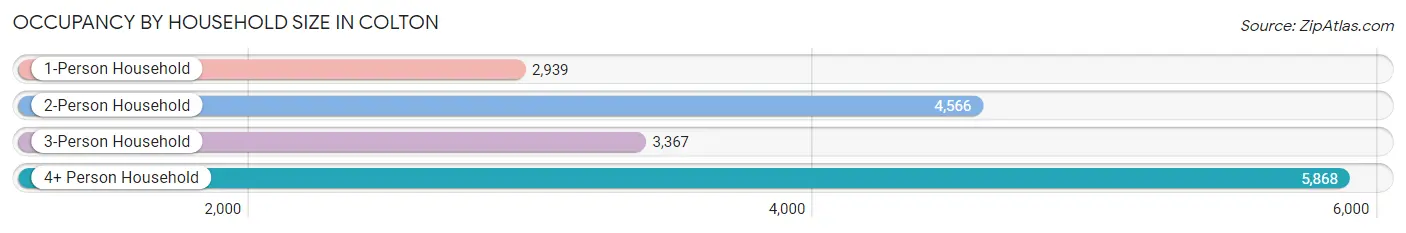
| Household Size | # Housing Units | % Housing Units |
| 1-Person Household | 2,939 | 17.6% |
| 2-Person Household | 4,566 | 27.3% |
| 3-Person Household | 3,367 | 20.1% |
| 4+ Person Household | 5,868 | 35.0% |
| Total Housing Units | 16,740 | 100.0% |
Occupancy by Ownership by Household Size in Colton
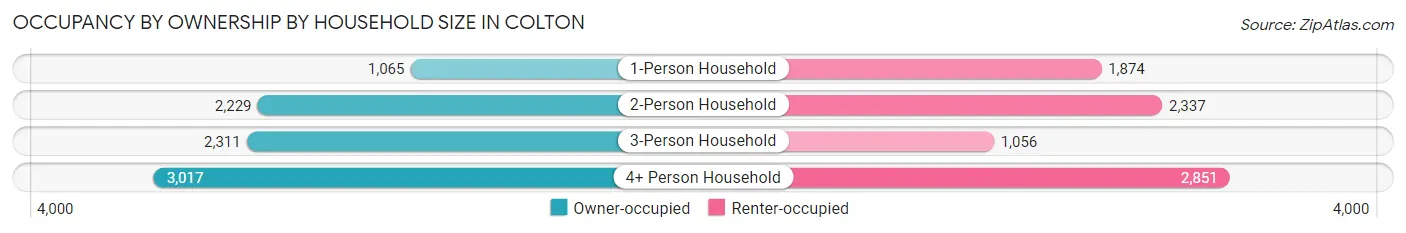
| Household Size | Owner-occupied | Renter-occupied |
| 1-Person Household | 1,065 (36.2%) | 1,874 (63.8%) |
| 2-Person Household | 2,229 (48.8%) | 2,337 (51.2%) |
| 3-Person Household | 2,311 (68.6%) | 1,056 (31.4%) |
| 4+ Person Household | 3,017 (51.4%) | 2,851 (48.6%) |
| Total Housing Units | 8,622 (51.5%) | 8,118 (48.5%) |
Occupancy by Educational Attainment in Colton
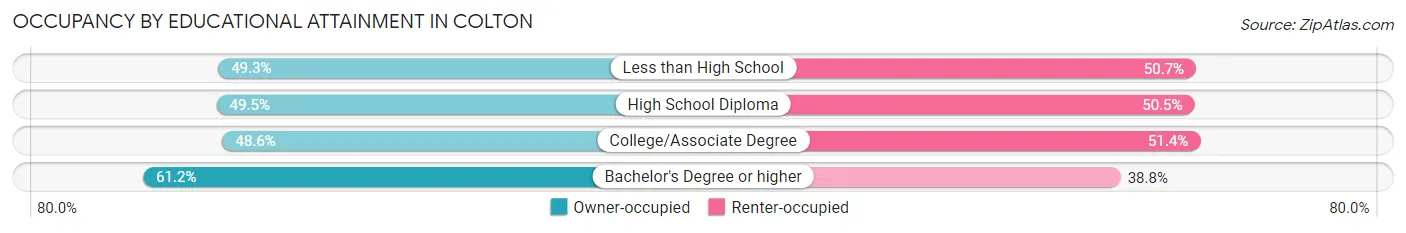
| Household Size | Owner-occupied | Renter-occupied |
| Less than High School | 1,809 (49.3%) | 1,861 (50.7%) |
| High School Diploma | 2,307 (49.5%) | 2,350 (50.5%) |
| College/Associate Degree | 2,486 (48.6%) | 2,627 (51.4%) |
| Bachelor's Degree or higher | 2,020 (61.2%) | 1,280 (38.8%) |
Occupancy by Age of Householder in Colton
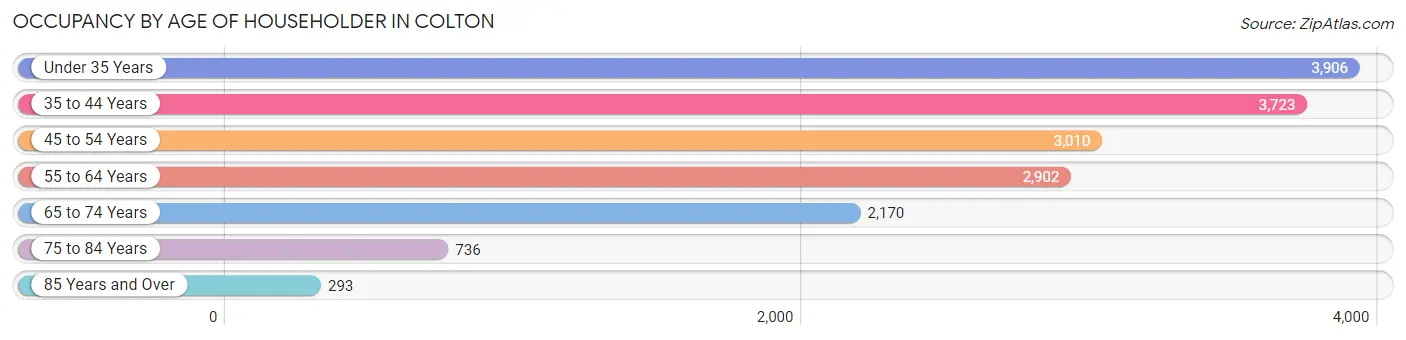
| Age Bracket | # Households | % Households |
| Under 35 Years | 3,906 | 23.3% |
| 35 to 44 Years | 3,723 | 22.2% |
| 45 to 54 Years | 3,010 | 18.0% |
| 55 to 64 Years | 2,902 | 17.3% |
| 65 to 74 Years | 2,170 | 13.0% |
| 75 to 84 Years | 736 | 4.4% |
| 85 Years and Over | 293 | 1.8% |
| Total | 16,740 | 100.0% |
Housing Finances in Colton
Median Income by Occupancy in Colton
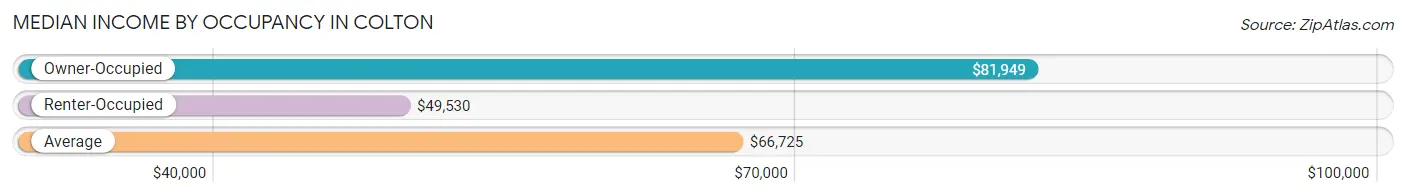
| Occupancy Type | # Households | Median Income |
| Owner-Occupied | 8,622 (51.5%) | $81,949 |
| Renter-Occupied | 8,118 (48.5%) | $49,530 |
| Average | 16,740 (100.0%) | $66,725 |
Occupancy by Householder Income Bracket in Colton
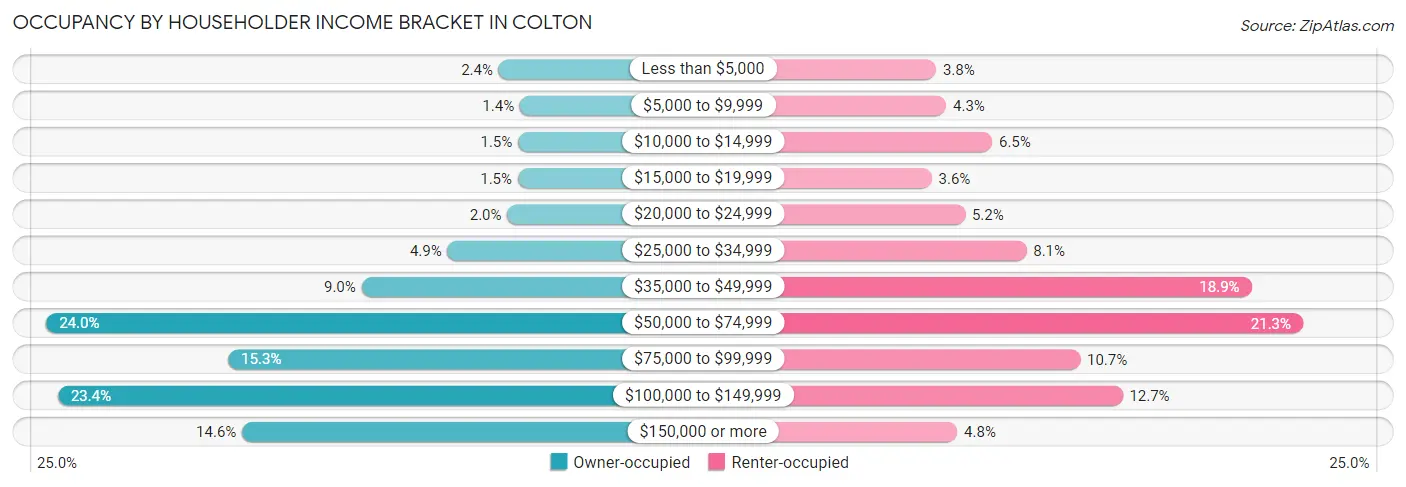
| Income Bracket | Owner-occupied | Renter-occupied |
| Less than $5,000 | 209 (2.4%) | 311 (3.8%) |
| $5,000 to $9,999 | 122 (1.4%) | 350 (4.3%) |
| $10,000 to $14,999 | 129 (1.5%) | 528 (6.5%) |
| $15,000 to $19,999 | 130 (1.5%) | 294 (3.6%) |
| $20,000 to $24,999 | 173 (2.0%) | 423 (5.2%) |
| $25,000 to $34,999 | 419 (4.9%) | 660 (8.1%) |
| $35,000 to $49,999 | 772 (8.9%) | 1,530 (18.9%) |
| $50,000 to $74,999 | 2,067 (24.0%) | 1,729 (21.3%) |
| $75,000 to $99,999 | 1,320 (15.3%) | 868 (10.7%) |
| $100,000 to $149,999 | 2,019 (23.4%) | 1,032 (12.7%) |
| $150,000 or more | 1,262 (14.6%) | 393 (4.8%) |
| Total | 8,622 (100.0%) | 8,118 (100.0%) |
Monthly Housing Cost Tiers in Colton
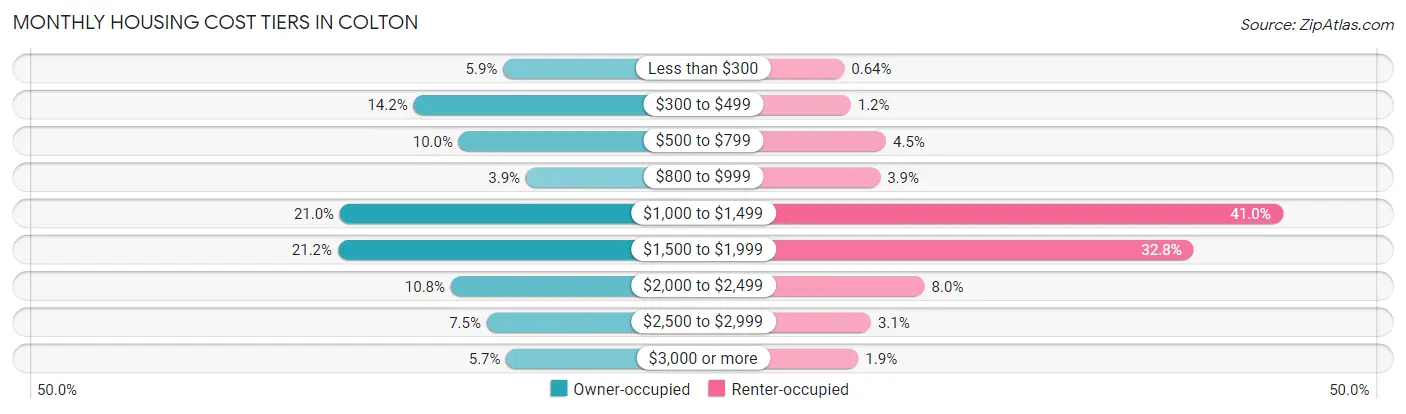
| Monthly Cost | Owner-occupied | Renter-occupied |
| Less than $300 | 512 (5.9%) | 52 (0.6%) |
| $300 to $499 | 1,224 (14.2%) | 100 (1.2%) |
| $500 to $799 | 865 (10.0%) | 364 (4.5%) |
| $800 to $999 | 332 (3.8%) | 320 (3.9%) |
| $1,000 to $1,499 | 1,808 (21.0%) | 3,327 (41.0%) |
| $1,500 to $1,999 | 1,824 (21.2%) | 2,661 (32.8%) |
| $2,000 to $2,499 | 928 (10.8%) | 652 (8.0%) |
| $2,500 to $2,999 | 642 (7.4%) | 251 (3.1%) |
| $3,000 or more | 487 (5.7%) | 157 (1.9%) |
| Total | 8,622 (100.0%) | 8,118 (100.0%) |
Physical Housing Characteristics in Colton
Housing Structures in Colton
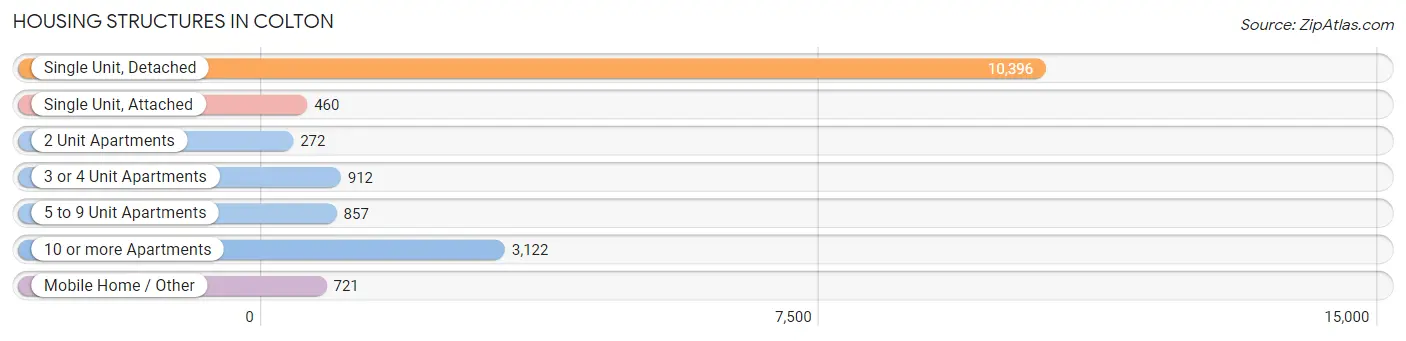
| Structure Type | # Housing Units | % Housing Units |
| Single Unit, Detached | 10,396 | 62.1% |
| Single Unit, Attached | 460 | 2.8% |
| 2 Unit Apartments | 272 | 1.6% |
| 3 or 4 Unit Apartments | 912 | 5.4% |
| 5 to 9 Unit Apartments | 857 | 5.1% |
| 10 or more Apartments | 3,122 | 18.6% |
| Mobile Home / Other | 721 | 4.3% |
| Total | 16,740 | 100.0% |
Housing Structures by Occupancy in Colton
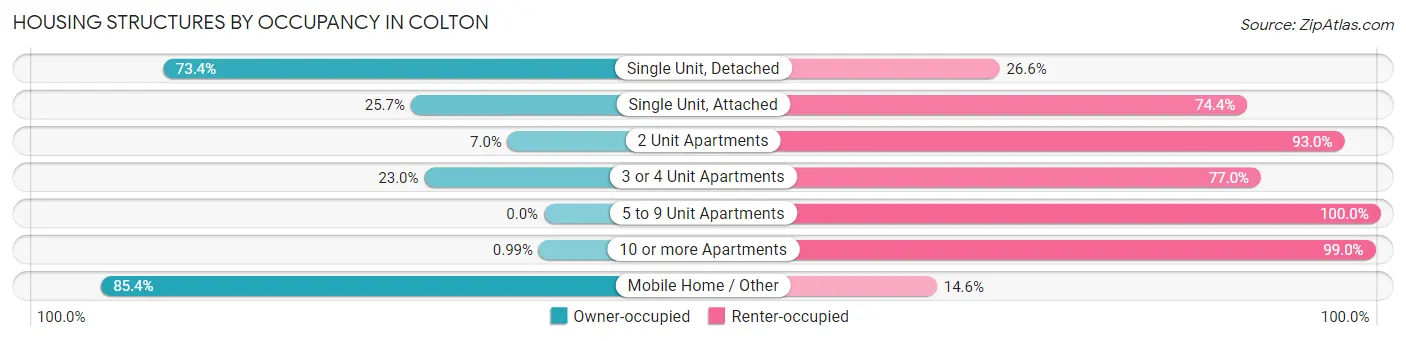
| Structure Type | Owner-occupied | Renter-occupied |
| Single Unit, Detached | 7,628 (73.4%) | 2,768 (26.6%) |
| Single Unit, Attached | 118 (25.7%) | 342 (74.4%) |
| 2 Unit Apartments | 19 (7.0%) | 253 (93.0%) |
| 3 or 4 Unit Apartments | 210 (23.0%) | 702 (77.0%) |
| 5 to 9 Unit Apartments | 0 (0.0%) | 857 (100.0%) |
| 10 or more Apartments | 31 (1.0%) | 3,091 (99.0%) |
| Mobile Home / Other | 616 (85.4%) | 105 (14.6%) |
| Total | 8,622 (51.5%) | 8,118 (48.5%) |
Housing Structures by Number of Rooms in Colton
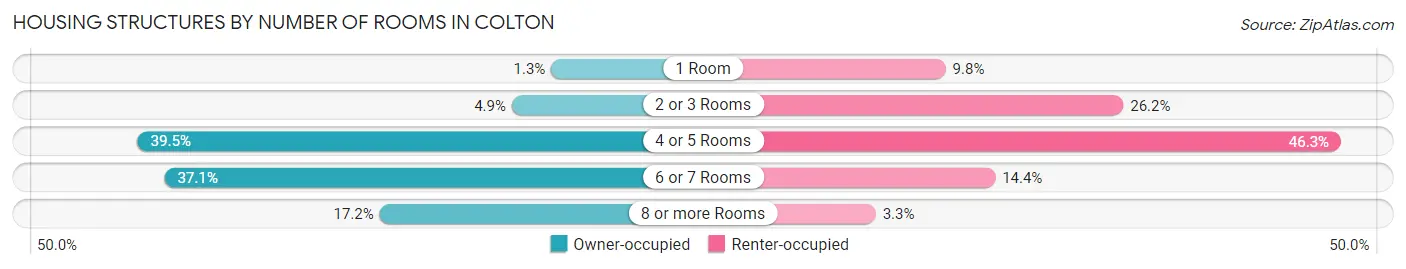
| Number of Rooms | Owner-occupied | Renter-occupied |
| 1 Room | 112 (1.3%) | 794 (9.8%) |
| 2 or 3 Rooms | 426 (4.9%) | 2,128 (26.2%) |
| 4 or 5 Rooms | 3,409 (39.5%) | 3,761 (46.3%) |
| 6 or 7 Rooms | 3,195 (37.1%) | 1,166 (14.4%) |
| 8 or more Rooms | 1,480 (17.2%) | 269 (3.3%) |
| Total | 8,622 (100.0%) | 8,118 (100.0%) |
Housing Structure by Heating Type in Colton
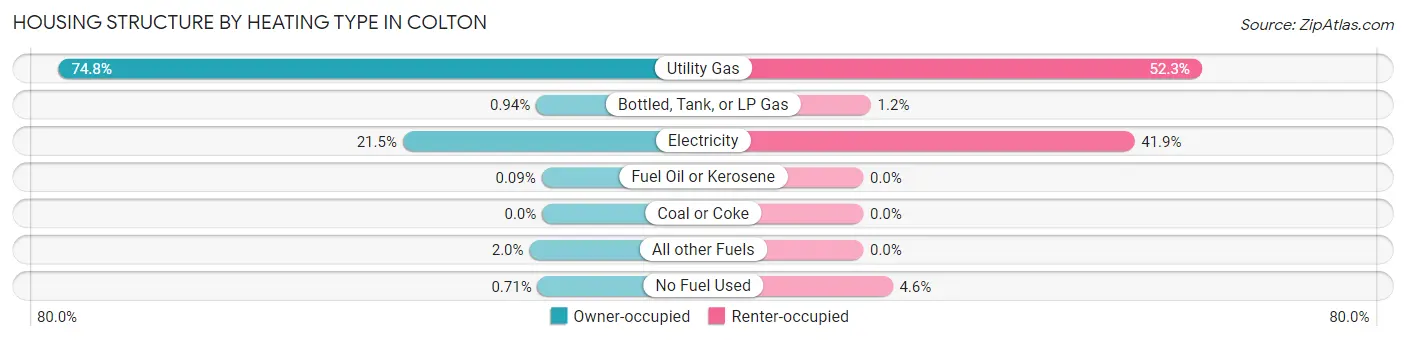
| Heating Type | Owner-occupied | Renter-occupied |
| Utility Gas | 6,445 (74.8%) | 4,249 (52.3%) |
| Bottled, Tank, or LP Gas | 81 (0.9%) | 96 (1.2%) |
| Electricity | 1,857 (21.5%) | 3,404 (41.9%) |
| Fuel Oil or Kerosene | 8 (0.1%) | 0 (0.0%) |
| Coal or Coke | 0 (0.0%) | 0 (0.0%) |
| All other Fuels | 170 (2.0%) | 0 (0.0%) |
| No Fuel Used | 61 (0.7%) | 369 (4.5%) |
| Total | 8,622 (100.0%) | 8,118 (100.0%) |
Household Vehicle Usage in Colton
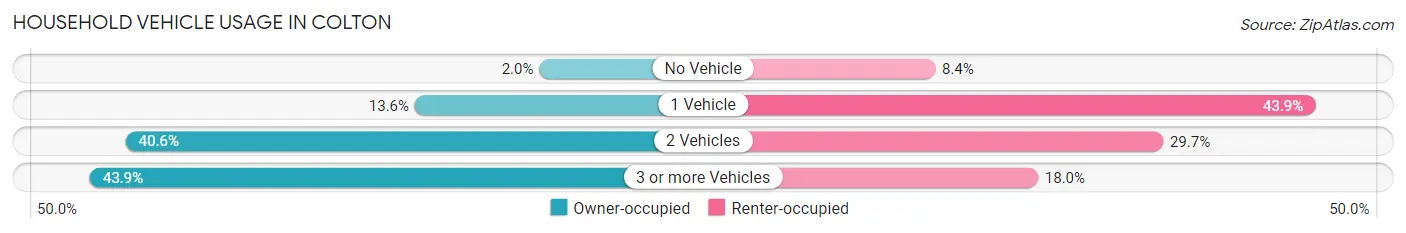
| Vehicles per Household | Owner-occupied | Renter-occupied |
| No Vehicle | 168 (1.9%) | 683 (8.4%) |
| 1 Vehicle | 1,170 (13.6%) | 3,563 (43.9%) |
| 2 Vehicles | 3,498 (40.6%) | 2,410 (29.7%) |
| 3 or more Vehicles | 3,786 (43.9%) | 1,462 (18.0%) |
| Total | 8,622 (100.0%) | 8,118 (100.0%) |
Real Estate & Mortgages in Colton
Real Estate and Mortgage Overview in Colton
| Characteristic | Without Mortgage | With Mortgage |
| Housing Units | 2,914 | 5,708 |
| Median Property Value | $346,400 | $388,300 |
| Median Household Income | $72,923 | $933 |
| Monthly Housing Costs | $468 | $487 |
| Real Estate Taxes | $1,963 | $62 |
Property Value by Mortgage Status in Colton
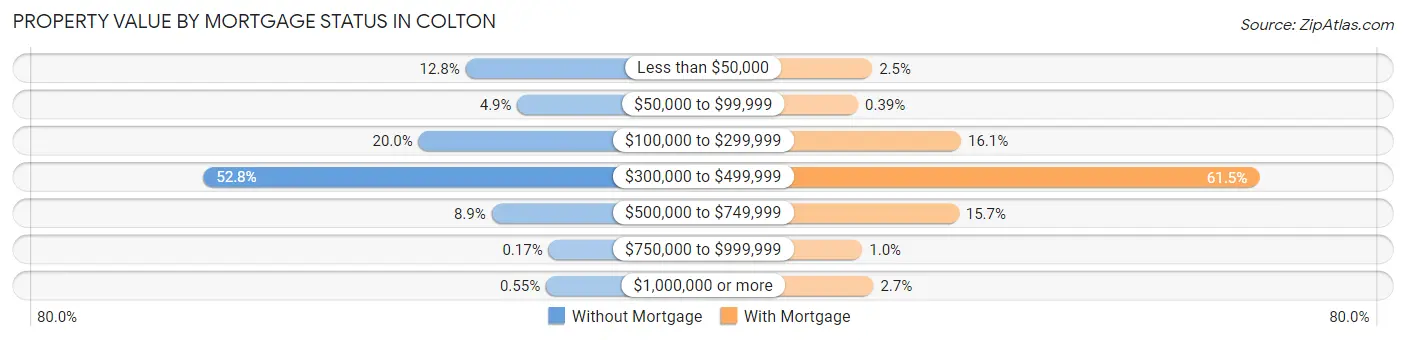
| Property Value | Without Mortgage | With Mortgage |
| Less than $50,000 | 373 (12.8%) | 145 (2.5%) |
| $50,000 to $99,999 | 143 (4.9%) | 22 (0.4%) |
| $100,000 to $299,999 | 582 (20.0%) | 918 (16.1%) |
| $300,000 to $499,999 | 1,537 (52.7%) | 3,510 (61.5%) |
| $500,000 to $749,999 | 258 (8.8%) | 898 (15.7%) |
| $750,000 to $999,999 | 5 (0.2%) | 59 (1.0%) |
| $1,000,000 or more | 16 (0.5%) | 156 (2.7%) |
| Total | 2,914 (100.0%) | 5,708 (100.0%) |
Household Income by Mortgage Status in Colton
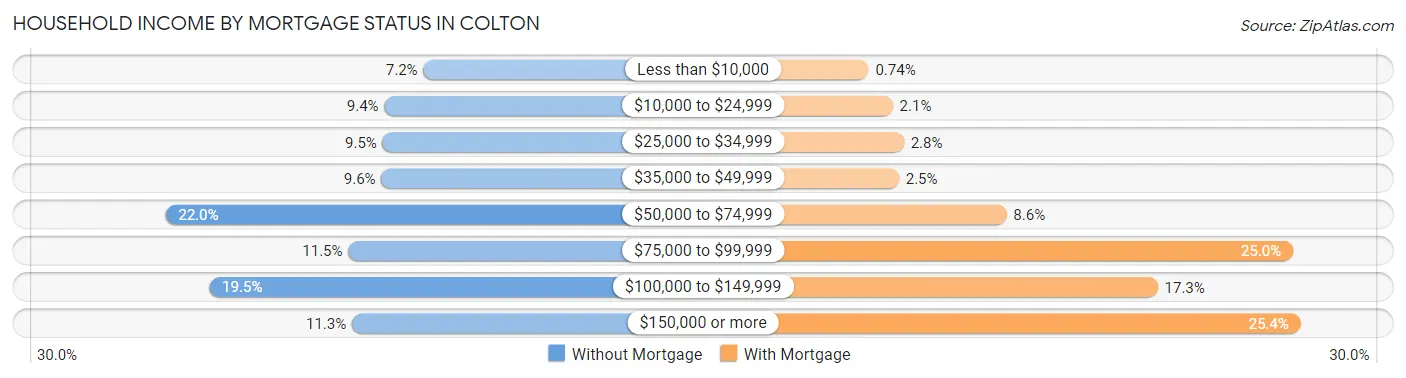
| Household Income | Without Mortgage | With Mortgage |
| Less than $10,000 | 210 (7.2%) | 42 (0.7%) |
| $10,000 to $24,999 | 275 (9.4%) | 121 (2.1%) |
| $25,000 to $34,999 | 278 (9.5%) | 157 (2.8%) |
| $35,000 to $49,999 | 280 (9.6%) | 141 (2.5%) |
| $50,000 to $74,999 | 640 (22.0%) | 492 (8.6%) |
| $75,000 to $99,999 | 335 (11.5%) | 1,427 (25.0%) |
| $100,000 to $149,999 | 567 (19.5%) | 985 (17.3%) |
| $150,000 or more | 329 (11.3%) | 1,452 (25.4%) |
| Total | 2,914 (100.0%) | 5,708 (100.0%) |
Property Value to Household Income Ratio in Colton
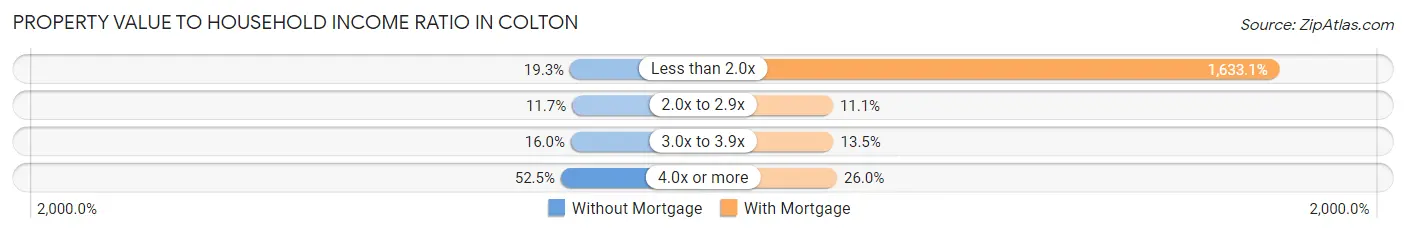
| Value-to-Income Ratio | Without Mortgage | With Mortgage |
| Less than 2.0x | 563 (19.3%) | 93,216 (1,633.1%) |
| 2.0x to 2.9x | 342 (11.7%) | 631 (11.1%) |
| 3.0x to 3.9x | 467 (16.0%) | 768 (13.5%) |
| 4.0x or more | 1,529 (52.5%) | 1,481 (26.0%) |
| Total | 2,914 (100.0%) | 5,708 (100.0%) |
Real Estate Taxes by Mortgage Status in Colton
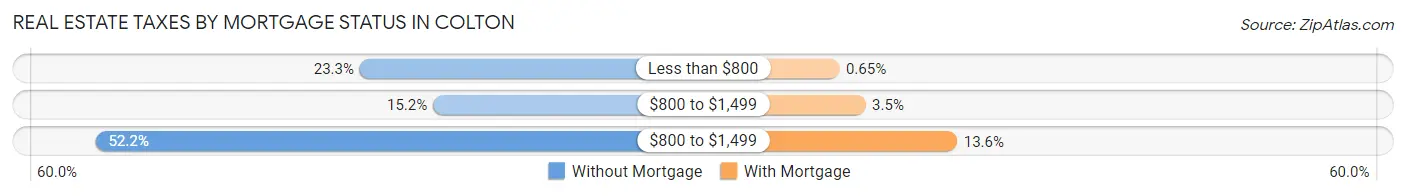
| Property Taxes | Without Mortgage | With Mortgage |
| Less than $800 | 678 (23.3%) | 37 (0.6%) |
| $800 to $1,499 | 444 (15.2%) | 201 (3.5%) |
| $800 to $1,499 | 1,522 (52.2%) | 774 (13.6%) |
| Total | 2,914 (100.0%) | 5,708 (100.0%) |
Health & Disability in Colton
Health Insurance Coverage by Age in Colton
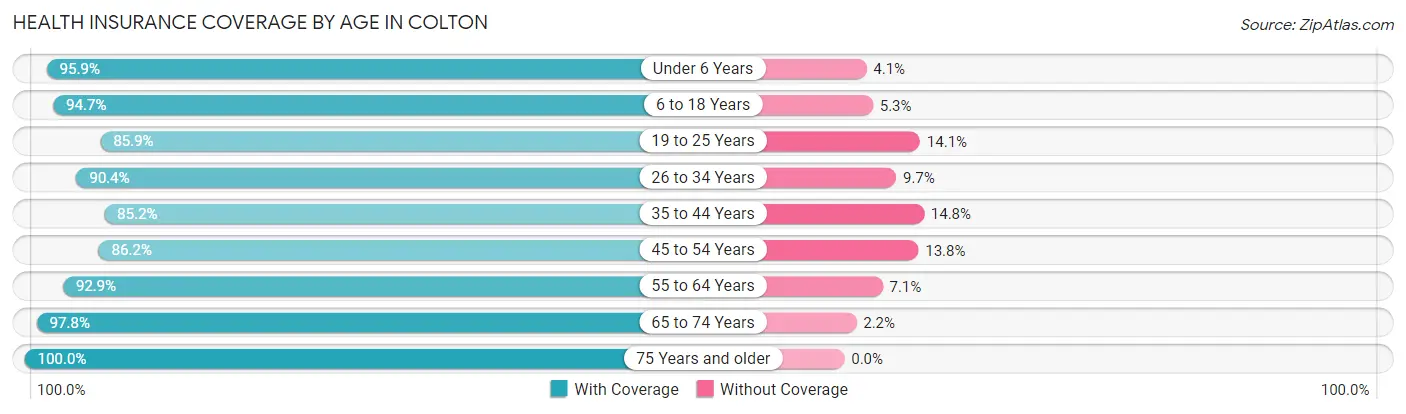
| Age Bracket | With Coverage | Without Coverage |
| Under 6 Years | 3,781 (95.9%) | 162 (4.1%) |
| 6 to 18 Years | 9,558 (94.7%) | 536 (5.3%) |
| 19 to 25 Years | 5,659 (85.9%) | 929 (14.1%) |
| 26 to 34 Years | 7,136 (90.3%) | 762 (9.7%) |
| 35 to 44 Years | 6,215 (85.2%) | 1,083 (14.8%) |
| 45 to 54 Years | 5,561 (86.2%) | 890 (13.8%) |
| 55 to 64 Years | 4,986 (92.9%) | 383 (7.1%) |
| 65 to 74 Years | 3,947 (97.8%) | 90 (2.2%) |
| 75 Years and older | 1,987 (100.0%) | 0 (0.0%) |
| Total | 48,830 (91.0%) | 4,835 (9.0%) |
Health Insurance Coverage by Citizenship Status in Colton
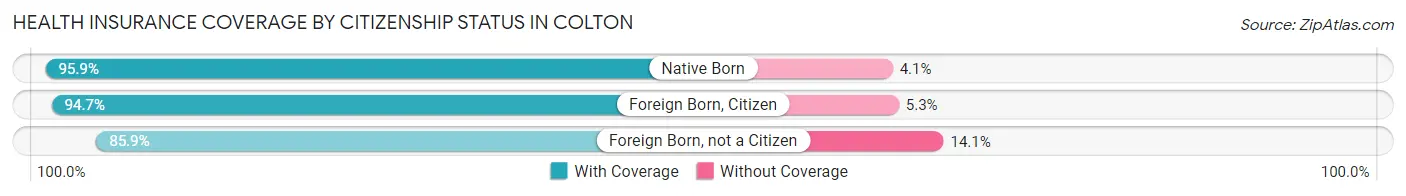
| Citizenship Status | With Coverage | Without Coverage |
| Native Born | 3,781 (95.9%) | 162 (4.1%) |
| Foreign Born, Citizen | 9,558 (94.7%) | 536 (5.3%) |
| Foreign Born, not a Citizen | 5,659 (85.9%) | 929 (14.1%) |
Health Insurance Coverage by Household Income in Colton
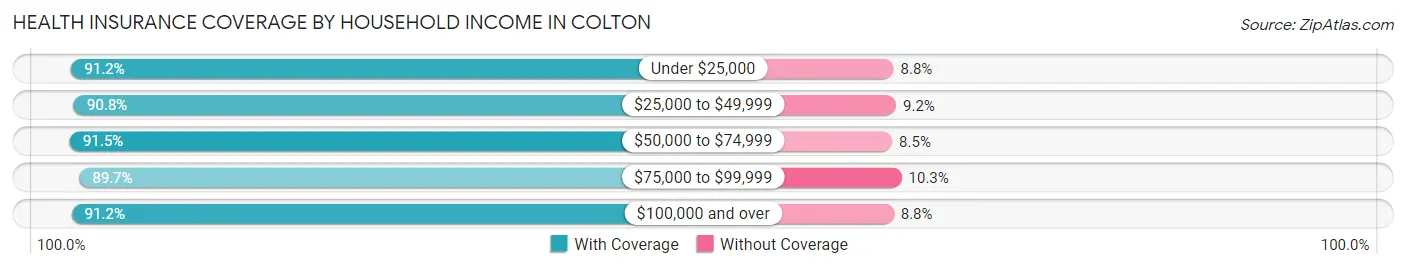
| Household Income | With Coverage | Without Coverage |
| Under $25,000 | 6,044 (91.2%) | 581 (8.8%) |
| $25,000 to $49,999 | 8,501 (90.8%) | 865 (9.2%) |
| $50,000 to $74,999 | 10,432 (91.5%) | 969 (8.5%) |
| $75,000 to $99,999 | 6,823 (89.7%) | 781 (10.3%) |
| $100,000 and over | 16,936 (91.2%) | 1,635 (8.8%) |
Public vs Private Health Insurance Coverage by Age in Colton
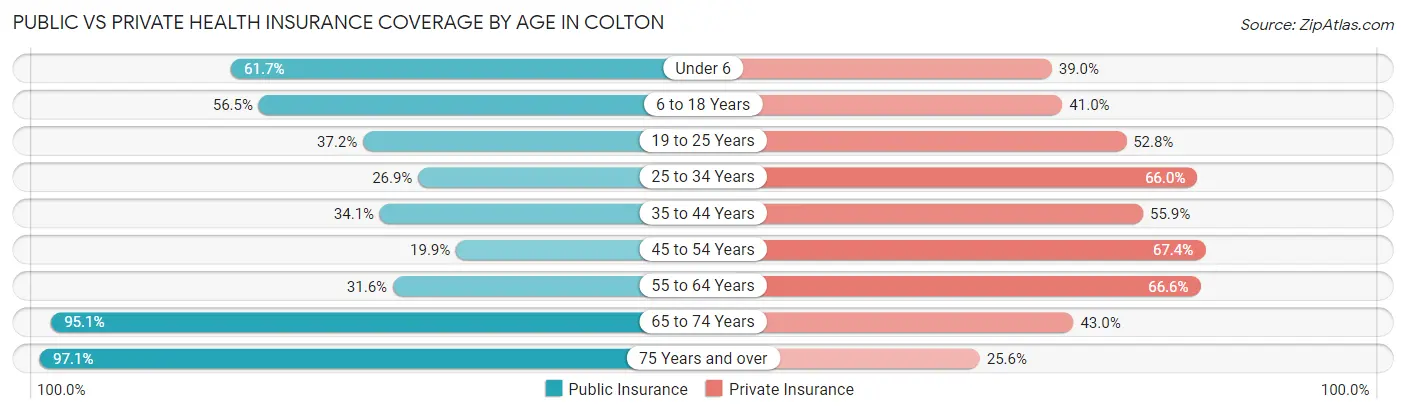
| Age Bracket | Public Insurance | Private Insurance |
| Under 6 | 2,431 (61.7%) | 1,537 (39.0%) |
| 6 to 18 Years | 5,706 (56.5%) | 4,133 (40.9%) |
| 19 to 25 Years | 2,449 (37.2%) | 3,478 (52.8%) |
| 25 to 34 Years | 2,128 (26.9%) | 5,210 (66.0%) |
| 35 to 44 Years | 2,485 (34.1%) | 4,081 (55.9%) |
| 45 to 54 Years | 1,284 (19.9%) | 4,349 (67.4%) |
| 55 to 64 Years | 1,699 (31.6%) | 3,573 (66.5%) |
| 65 to 74 Years | 3,837 (95.1%) | 1,736 (43.0%) |
| 75 Years and over | 1,930 (97.1%) | 509 (25.6%) |
| Total | 23,949 (44.6%) | 28,606 (53.3%) |
Disability Status by Sex by Age in Colton
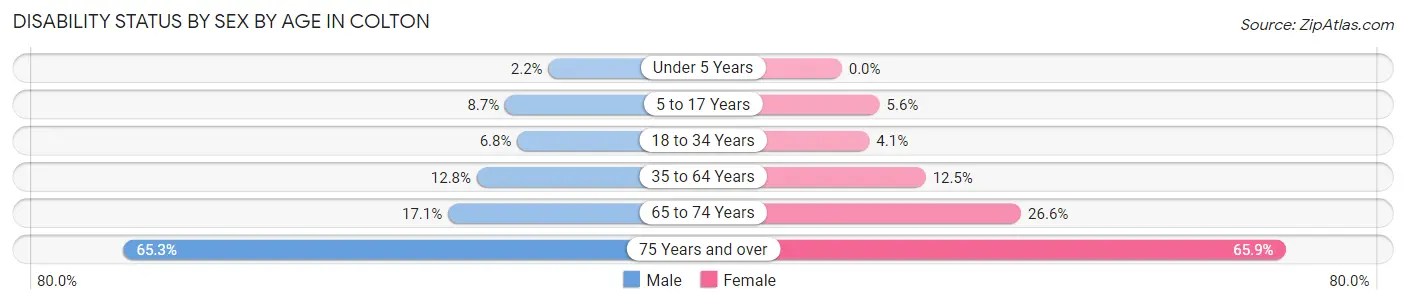
| Age Bracket | Male | Female |
| Under 5 Years | 36 (2.2%) | 0 (0.0%) |
| 5 to 17 Years | 418 (8.7%) | 293 (5.6%) |
| 18 to 34 Years | 520 (6.8%) | 316 (4.1%) |
| 35 to 64 Years | 1,258 (12.8%) | 1,162 (12.5%) |
| 65 to 74 Years | 342 (17.1%) | 543 (26.6%) |
| 75 Years and over | 557 (65.3%) | 747 (65.9%) |
Disability Class by Sex by Age in Colton
Disability Class: Hearing Difficulty
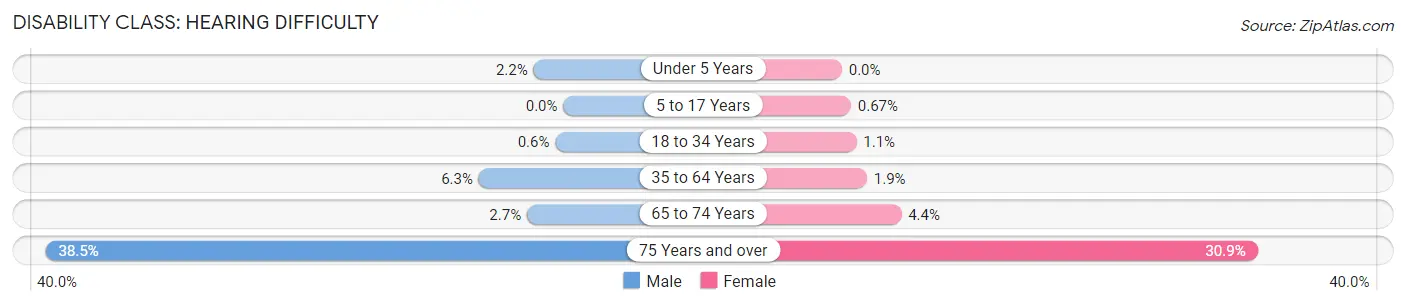
| Age Bracket | Male | Female |
| Under 5 Years | 36 (2.2%) | 0 (0.0%) |
| 5 to 17 Years | 0 (0.0%) | 35 (0.7%) |
| 18 to 34 Years | 46 (0.6%) | 83 (1.1%) |
| 35 to 64 Years | 615 (6.3%) | 173 (1.9%) |
| 65 to 74 Years | 54 (2.7%) | 90 (4.4%) |
| 75 Years and over | 328 (38.5%) | 350 (30.9%) |
Disability Class: Vision Difficulty
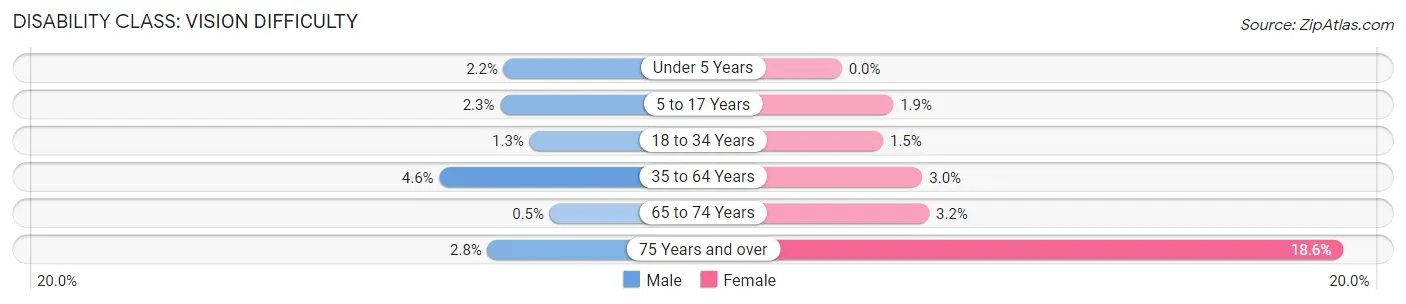
| Age Bracket | Male | Female |
| Under 5 Years | 36 (2.2%) | 0 (0.0%) |
| 5 to 17 Years | 113 (2.3%) | 100 (1.9%) |
| 18 to 34 Years | 95 (1.3%) | 118 (1.5%) |
| 35 to 64 Years | 451 (4.6%) | 279 (3.0%) |
| 65 to 74 Years | 10 (0.5%) | 66 (3.2%) |
| 75 Years and over | 24 (2.8%) | 211 (18.6%) |
Disability Class: Cognitive Difficulty
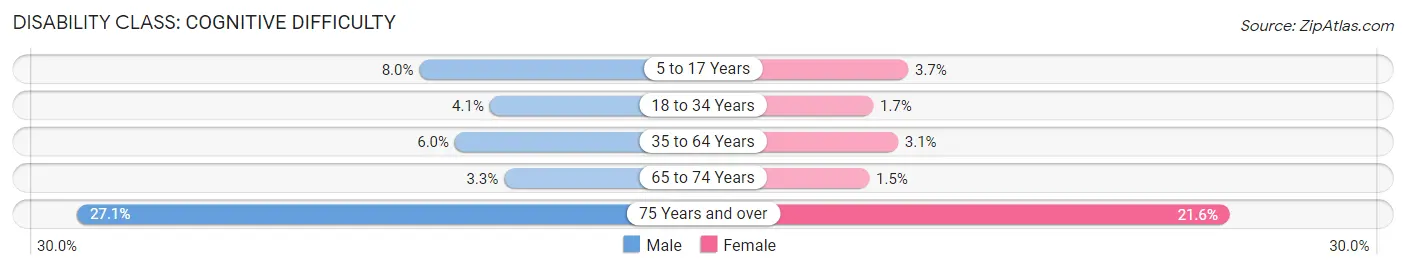
| Age Bracket | Male | Female |
| 5 to 17 Years | 387 (8.0%) | 193 (3.7%) |
| 18 to 34 Years | 312 (4.1%) | 134 (1.7%) |
| 35 to 64 Years | 592 (6.0%) | 291 (3.1%) |
| 65 to 74 Years | 66 (3.3%) | 31 (1.5%) |
| 75 Years and over | 231 (27.1%) | 245 (21.6%) |
Disability Class: Ambulatory Difficulty
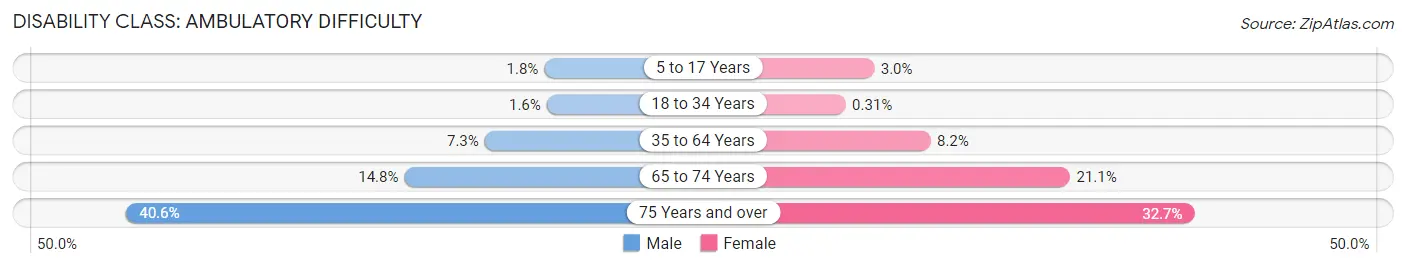
| Age Bracket | Male | Female |
| 5 to 17 Years | 86 (1.8%) | 155 (3.0%) |
| 18 to 34 Years | 118 (1.5%) | 24 (0.3%) |
| 35 to 64 Years | 716 (7.3%) | 764 (8.2%) |
| 65 to 74 Years | 295 (14.8%) | 431 (21.1%) |
| 75 Years and over | 346 (40.6%) | 371 (32.7%) |
Disability Class: Self-Care Difficulty
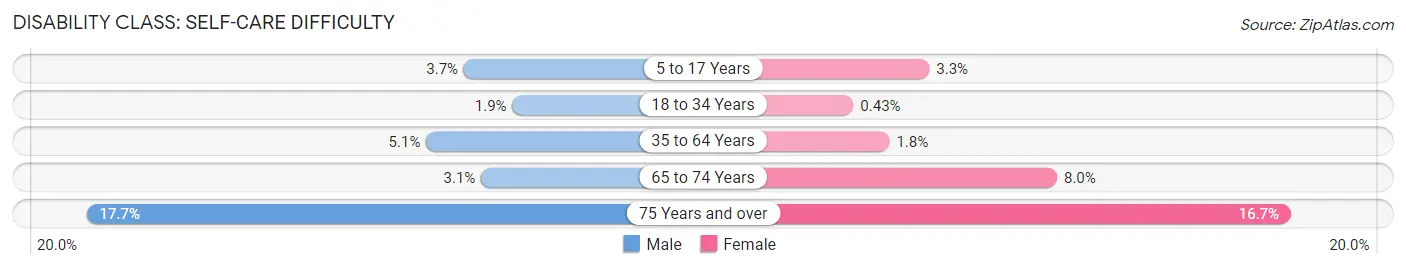
| Age Bracket | Male | Female |
| 5 to 17 Years | 178 (3.7%) | 170 (3.3%) |
| 18 to 34 Years | 144 (1.9%) | 33 (0.4%) |
| 35 to 64 Years | 499 (5.1%) | 165 (1.8%) |
| 65 to 74 Years | 61 (3.0%) | 163 (8.0%) |
| 75 Years and over | 151 (17.7%) | 189 (16.7%) |
Technology Access in Colton
Computing Device Access in Colton
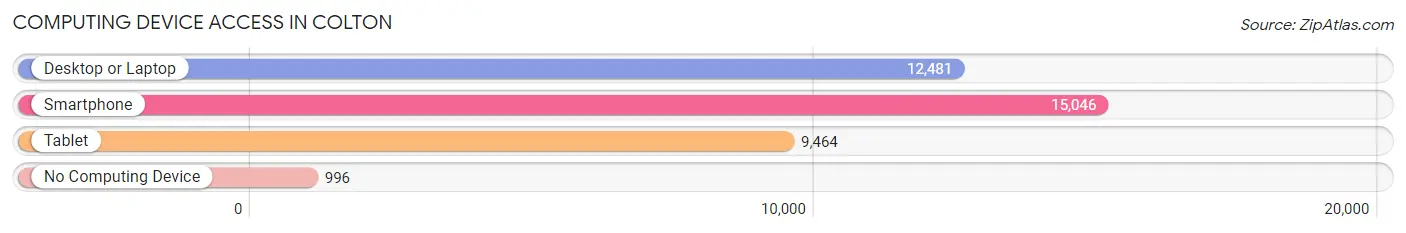
| Device Type | # Households | % Households |
| Desktop or Laptop | 12,481 | 74.6% |
| Smartphone | 15,046 | 89.9% |
| Tablet | 9,464 | 56.5% |
| No Computing Device | 996 | 5.9% |
| Total | 16,740 | 100.0% |
Internet Access in Colton
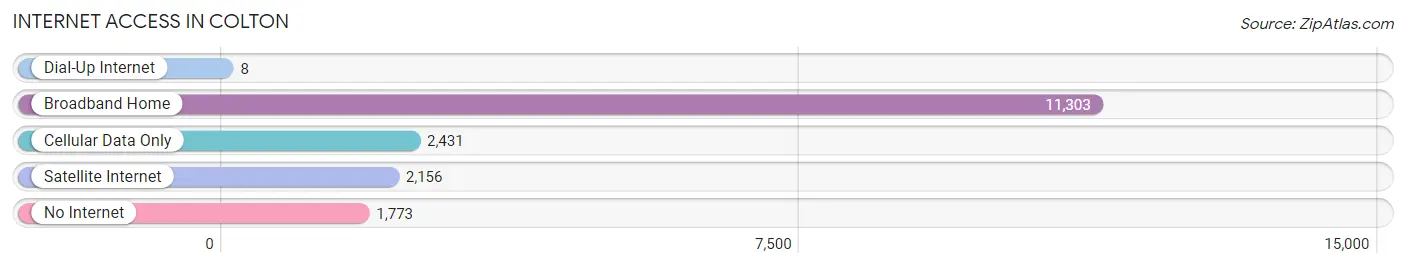
| Internet Type | # Households | % Households |
| Dial-Up Internet | 8 | 0.1% |
| Broadband Home | 11,303 | 67.5% |
| Cellular Data Only | 2,431 | 14.5% |
| Satellite Internet | 2,156 | 12.9% |
| No Internet | 1,773 | 10.6% |
| Total | 16,740 | 100.0% |
Colton Summary
Colton, California is a city located in San Bernardino County, California. It is situated in the Inland Empire region of the state, and is located just east of the city of San Bernardino. The city has a population of approximately 53,000 people, and is the home of the Colton Joint Unified School District.
History
Colton was founded in 1875 by brothers George and William Chaffey, who were originally from Canada. The brothers purchased the land from the San Bernardino County Land Company, and named the area after their father, Hiram Clay Colton. The brothers began to develop the area, and soon established a post office, a school, and a general store.
In 1883, the Santa Fe Railroad arrived in Colton, and the city began to grow rapidly. The railroad provided a connection to the rest of the country, and allowed for the transportation of goods and services. The city soon became a hub for the citrus industry, and many of the local farmers began to grow oranges, lemons, and other citrus fruits.
In the early 1900s, the city began to experience a period of growth and development. The population increased, and the city began to expand. In the 1920s, the city was incorporated, and the city government was established.
Geography
Colton is located in the Inland Empire region of California, and is situated in the San Bernardino Valley. The city is located just east of the city of San Bernardino, and is bordered by the cities of Grand Terrace, Rialto, and Fontana. The city is situated at an elevation of 1,072 feet, and covers an area of approximately 10.5 square miles.
The city is located in a semi-arid climate, and experiences hot summers and mild winters. The average temperature in the summer is around 90 degrees Fahrenheit, and the average temperature in the winter is around 50 degrees Fahrenheit. The city receives an average of 10 inches of rain per year.
Economy
Colton’s economy is largely based on the service industry, and the city is home to a variety of businesses, including restaurants, retail stores, and medical facilities. The city is also home to a number of manufacturing companies, including a steel mill and a paper mill.
The city is also home to a number of educational institutions, including the University of Redlands, Crafton Hills College, and San Bernardino Valley College. The city is also home to a number of government offices, including the San Bernardino County Courthouse and the San Bernardino County Sheriff’s Office.
Demographics
As of the 2010 census, Colton had a population of 53,155 people. The racial makeup of the city was 44.3% White, 4.2% African American, 1.2% Native American, 2.3% Asian, 0.2% Pacific Islander, and 45.7% from other races. The median household income in the city was $41,945, and the median family income was $45,945.
Colton is a diverse city, and is home to a variety of cultures and ethnicities. The city is home to a large Hispanic population, and is also home to a large number of immigrants from Mexico, El Salvador, and Guatemala. The city is also home to a large number of Asian Americans, and is home to a large number of Chinese, Filipino, and Vietnamese immigrants.
Common Questions
What is Per Capita Income in Colton?
Per Capita income in Colton is $24,998.
What is the Median Family Income in Colton?
Median Family Income in Colton is $71,283.
What is the Median Household income in Colton?
Median Household Income in Colton is $66,725.
What is Income or Wage Gap in Colton?
Income or Wage Gap in Colton is 29.4%.
Women in Colton earn 70.6 cents for every dollar earned by a man.
What is Family Income Deficit in Colton?
Family Income Deficit in Colton is $13,556.
Families that are below poverty line in Colton earn $13,556 less on average than the poverty threshold level.
What is Inequality or Gini Index in Colton?
Inequality or Gini Index in Colton is 0.39.
What is the Total Population of Colton?
Total Population of Colton is 53,959.
What is the Total Male Population of Colton?
Total Male Population of Colton is 26,825.
What is the Total Female Population of Colton?
Total Female Population of Colton is 27,134.
What is the Ratio of Males per 100 Females in Colton?
There are 98.86 Males per 100 Females in Colton.
What is the Ratio of Females per 100 Males in Colton?
There are 101.15 Females per 100 Males in Colton.
What is the Median Population Age in Colton?
Median Population Age in Colton is 33.2 Years.
What is the Average Family Size in Colton
Average Family Size in Colton is 3.6 People.
What is the Average Household Size in Colton
Average Household Size in Colton is 3.2 People.
How Large is the Labor Force in Colton?
There are 26,685 People in the Labor Forcein in Colton.
What is the Percentage of People in the Labor Force in Colton?
62.9% of People are in the Labor Force in Colton.
What is the Unemployment Rate in Colton?
Unemployment Rate in Colton is 7.4%.