Zip Codes with the Highest Percentage of Population Employed in Farming, Fishing & Forestry in Arizona
RELATED REPORTS & OPTIONS
Farming, Fishing & Forestry
Arizona
Compare Zip Codes
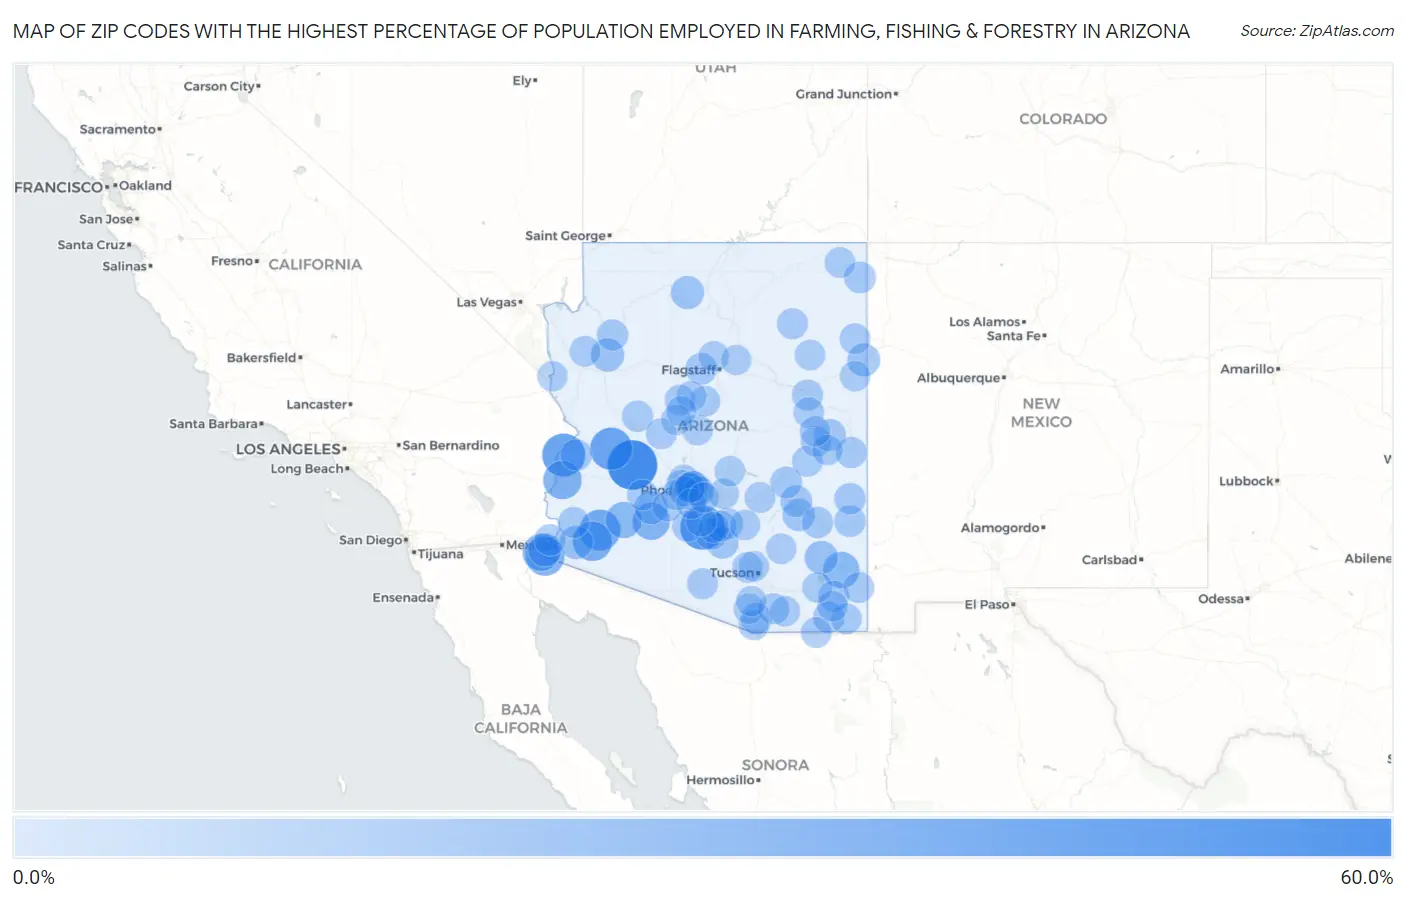
Map of Zip Codes with the Highest Percentage of Population Employed in Farming, Fishing & Forestry in Arizona
0.0%
60.0%
Zip Codes with the Highest Percentage of Population Employed in Farming, Fishing & Forestry in Arizona
| Zip Code | % Employed | vs State | vs National | |
| 1. | 85320 | 54.6% | 0.51%(+54.1)#1 | 0.61%(+54.0)#42 |
| 2. | 85172 | 40.2% | 0.51%(+39.7)#2 | 0.61%(+39.6)#99 |
| 3. | 85371 | 36.0% | 0.51%(+35.4)#3 | 0.61%(+35.3)#135 |
| 4. | 85357 | 33.7% | 0.51%(+33.2)#4 | 0.61%(+33.1)#158 |
| 5. | 85347 | 29.9% | 0.51%(+29.4)#5 | 0.61%(+29.3)#196 |
| 6. | 85352 | 25.9% | 0.51%(+25.4)#6 | 0.61%(+25.3)#270 |
| 7. | 85349 | 24.1% | 0.51%(+23.6)#7 | 0.61%(+23.5)#300 |
| 8. | 85334 | 23.0% | 0.51%(+22.5)#8 | 0.61%(+22.4)#315 |
| 9. | 85336 | 19.6% | 0.51%(+19.1)#9 | 0.61%(+19.0)#419 |
| 10. | 85337 | 19.6% | 0.51%(+19.1)#10 | 0.61%(+19.0)#420 |
| 11. | 85605 | 17.3% | 0.51%(+16.8)#11 | 0.61%(+16.7)#516 |
| 12. | 85333 | 16.7% | 0.51%(+16.2)#12 | 0.61%(+16.1)#547 |
| 13. | 85356 | 9.3% | 0.51%(+8.81)#13 | 0.61%(+8.71)#1,337 |
| 14. | 85322 | 9.2% | 0.51%(+8.72)#14 | 0.61%(+8.63)#1,355 |
| 15. | 85643 | 8.7% | 0.51%(+8.22)#15 | 0.61%(+8.12)#1,475 |
| 16. | 86437 | 8.7% | 0.51%(+8.19)#16 | 0.61%(+8.09)#1,481 |
| 17. | 85350 | 8.3% | 0.51%(+7.77)#17 | 0.61%(+7.67)#1,584 |
| 18. | 86052 | 8.1% | 0.51%(+7.58)#18 | 0.61%(+7.48)#1,640 |
| 19. | 86508 | 7.4% | 0.51%(+6.90)#19 | 0.61%(+6.80)#1,855 |
| 20. | 85530 | 6.2% | 0.51%(+5.68)#20 | 0.61%(+5.58)#2,295 |
| 21. | 85131 | 5.8% | 0.51%(+5.33)#21 | 0.61%(+5.23)#2,478 |
| 22. | 85193 | 5.1% | 0.51%(+4.56)#22 | 0.61%(+4.47)#2,880 |
| 23. | 85940 | 4.7% | 0.51%(+4.20)#23 | 0.61%(+4.10)#3,149 |
| 24. | 85542 | 4.5% | 0.51%(+3.96)#24 | 0.61%(+3.86)#3,328 |
| 25. | 85550 | 4.2% | 0.51%(+3.74)#25 | 0.61%(+3.64)#3,499 |
| 26. | 86544 | 4.0% | 0.51%(+3.48)#26 | 0.61%(+3.38)#3,722 |
| 27. | 86018 | 3.9% | 0.51%(+3.42)#27 | 0.61%(+3.32)#3,783 |
| 28. | 85540 | 3.8% | 0.51%(+3.26)#28 | 0.61%(+3.16)#3,931 |
| 29. | 85364 | 3.5% | 0.51%(+2.99)#29 | 0.61%(+2.89)#4,207 |
| 30. | 85128 | 3.4% | 0.51%(+2.93)#30 | 0.61%(+2.83)#4,272 |
| 31. | 85344 | 3.4% | 0.51%(+2.88)#31 | 0.61%(+2.78)#4,346 |
| 32. | 85533 | 3.3% | 0.51%(+2.78)#32 | 0.61%(+2.68)#4,459 |
| 33. | 85543 | 3.0% | 0.51%(+2.47)#33 | 0.61%(+2.37)#4,851 |
| 34. | 85617 | 3.0% | 0.51%(+2.46)#34 | 0.61%(+2.36)#4,867 |
| 35. | 86434 | 2.9% | 0.51%(+2.42)#35 | 0.61%(+2.32)#4,921 |
| 36. | 85925 | 2.7% | 0.51%(+2.24)#36 | 0.61%(+2.14)#5,178 |
| 37. | 85648 | 2.7% | 0.51%(+2.23)#37 | 0.61%(+2.13)#5,193 |
| 38. | 86321 | 2.6% | 0.51%(+2.12)#38 | 0.61%(+2.03)#5,340 |
| 39. | 86025 | 2.5% | 0.51%(+2.01)#39 | 0.61%(+1.92)#5,513 |
| 40. | 85625 | 2.5% | 0.51%(+1.96)#40 | 0.61%(+1.86)#5,606 |
| 41. | 85365 | 2.4% | 0.51%(+1.90)#41 | 0.61%(+1.80)#5,722 |
| 42. | 86042 | 2.2% | 0.51%(+1.66)#42 | 0.61%(+1.56)#6,196 |
| 43. | 85607 | 2.1% | 0.51%(+1.61)#43 | 0.61%(+1.51)#6,297 |
| 44. | 85634 | 2.1% | 0.51%(+1.60)#44 | 0.61%(+1.50)#6,322 |
| 45. | 85632 | 2.1% | 0.51%(+1.59)#45 | 0.61%(+1.49)#6,344 |
| 46. | 85354 | 2.1% | 0.51%(+1.56)#46 | 0.61%(+1.46)#6,379 |
| 47. | 85637 | 2.0% | 0.51%(+1.51)#47 | 0.61%(+1.41)#6,524 |
| 48. | 85019 | 2.0% | 0.51%(+1.49)#48 | 0.61%(+1.39)#6,576 |
| 49. | 85941 | 1.9% | 0.51%(+1.35)#49 | 0.61%(+1.26)#6,867 |
| 50. | 86332 | 1.8% | 0.51%(+1.33)#50 | 0.61%(+1.23)#6,920 |
| 51. | 86511 | 1.8% | 0.51%(+1.32)#51 | 0.61%(+1.22)#6,967 |
| 52. | 85139 | 1.7% | 0.51%(+1.16)#52 | 0.61%(+1.06)#7,374 |
| 53. | 85194 | 1.6% | 0.51%(+1.08)#53 | 0.61%(+0.985)#7,607 |
| 54. | 85539 | 1.5% | 0.51%(+1.04)#54 | 0.61%(+0.938)#7,759 |
| 55. | 85004 | 1.5% | 0.51%(+1.02)#55 | 0.61%(+0.924)#7,801 |
| 56. | 85015 | 1.5% | 0.51%(+0.967)#56 | 0.61%(+0.869)#7,960 |
| 57. | 85929 | 1.4% | 0.51%(+0.941)#57 | 0.61%(+0.842)#8,042 |
| 58. | 85122 | 1.4% | 0.51%(+0.923)#58 | 0.61%(+0.824)#8,104 |
| 59. | 86545 | 1.4% | 0.51%(+0.872)#59 | 0.61%(+0.774)#8,278 |
| 60. | 85937 | 1.3% | 0.51%(+0.818)#60 | 0.61%(+0.719)#8,475 |
| 61. | 85610 | 1.3% | 0.51%(+0.781)#61 | 0.61%(+0.682)#8,614 |
| 62. | 86409 | 1.3% | 0.51%(+0.746)#62 | 0.61%(+0.648)#8,747 |
| 63. | 85351 | 1.2% | 0.51%(+0.733)#63 | 0.61%(+0.634)#8,797 |
| 64. | 86333 | 1.2% | 0.51%(+0.699)#64 | 0.61%(+0.600)#8,905 |
| 65. | 85930 | 1.2% | 0.51%(+0.692)#65 | 0.61%(+0.593)#8,928 |
| 66. | 86323 | 1.2% | 0.51%(+0.685)#66 | 0.61%(+0.586)#8,962 |
| 67. | 85307 | 1.2% | 0.51%(+0.656)#67 | 0.61%(+0.557)#9,069 |
| 68. | 85743 | 1.1% | 0.51%(+0.635)#68 | 0.61%(+0.536)#9,152 |
| 69. | 86325 | 1.1% | 0.51%(+0.629)#69 | 0.61%(+0.530)#9,179 |
| 70. | 85620 | 1.1% | 0.51%(+0.626)#70 | 0.61%(+0.528)#9,192 |
| 71. | 85901 | 1.1% | 0.51%(+0.621)#71 | 0.61%(+0.522)#9,211 |
| 72. | 85120 | 1.0% | 0.51%(+0.540)#72 | 0.61%(+0.442)#9,529 |
| 73. | 85326 | 1.0% | 0.51%(+0.499)#73 | 0.61%(+0.401)#9,715 |
| 74. | 85041 | 1.0% | 0.51%(+0.499)#74 | 0.61%(+0.400)#9,719 |
| 75. | 85741 | 0.99% | 0.51%(+0.486)#75 | 0.61%(+0.388)#9,780 |
| 76. | 85264 | 0.99% | 0.51%(+0.483)#76 | 0.61%(+0.385)#9,798 |
| 77. | 86031 | 0.98% | 0.51%(+0.474)#77 | 0.61%(+0.375)#9,833 |
| 78. | 85621 | 0.95% | 0.51%(+0.442)#78 | 0.61%(+0.344)#9,984 |
| 79. | 86324 | 0.95% | 0.51%(+0.441)#79 | 0.61%(+0.342)#9,997 |
| 80. | 85338 | 0.86% | 0.51%(+0.351)#80 | 0.61%(+0.252)#10,468 |
| 81. | 85035 | 0.82% | 0.51%(+0.318)#81 | 0.61%(+0.219)#10,637 |
| 82. | 86512 | 0.80% | 0.51%(+0.295)#82 | 0.61%(+0.197)#10,770 |
| 83. | 85611 | 0.80% | 0.51%(+0.289)#83 | 0.61%(+0.190)#10,809 |
| 84. | 85017 | 0.79% | 0.51%(+0.283)#84 | 0.61%(+0.185)#10,841 |
| 85. | 85631 | 0.78% | 0.51%(+0.268)#85 | 0.61%(+0.170)#10,930 |
| 86. | 86303 | 0.75% | 0.51%(+0.243)#86 | 0.61%(+0.144)#11,078 |
| 87. | 86314 | 0.71% | 0.51%(+0.206)#87 | 0.61%(+0.107)#11,295 |
| 88. | 85138 | 0.70% | 0.51%(+0.192)#88 | 0.61%(+0.094)#11,387 |
| 89. | 85606 | 0.68% | 0.51%(+0.176)#89 | 0.61%(+0.077)#11,500 |
| 90. | 86442 | 0.68% | 0.51%(+0.174)#90 | 0.61%(+0.075)#11,512 |
| 91. | 85034 | 0.67% | 0.51%(+0.162)#91 | 0.61%(+0.063)#11,591 |
| 92. | 85645 | 0.66% | 0.51%(+0.155)#92 | 0.61%(+0.057)#11,625 |
| 93. | 85353 | 0.65% | 0.51%(+0.147)#93 | 0.61%(+0.048)#11,670 |
| 94. | 85132 | 0.61% | 0.51%(+0.102)#94 | 0.61%(+0.004)#11,971 |
| 95. | 85339 | 0.60% | 0.51%(+0.092)#95 | 0.61%(-0.007)#12,047 |
| 96. | 86001 | 0.59% | 0.51%(+0.088)#96 | 0.61%(-0.011)#12,076 |
| 97. | 85031 | 0.59% | 0.51%(+0.087)#97 | 0.61%(-0.012)#12,078 |
| 98. | 85284 | 0.59% | 0.51%(+0.081)#98 | 0.61%(-0.018)#12,135 |
| 99. | 86004 | 0.58% | 0.51%(+0.069)#99 | 0.61%(-0.029)#12,234 |
| 100. | 85622 | 0.58% | 0.51%(+0.069)#100 | 0.61%(-0.030)#12,241 |
Common Questions
What are the Top 10 Zip Codes with the Highest Percentage of Population Employed in Farming, Fishing & Forestry in Arizona?
Top 10 Zip Codes with the Highest Percentage of Population Employed in Farming, Fishing & Forestry in Arizona are:
What zip code has the Highest Percentage of Population Employed in Farming, Fishing & Forestry in Arizona?
85320 has the Highest Percentage of Population Employed in Farming, Fishing & Forestry in Arizona with 54.6%.
What is the Percentage of Population Employed in Farming, Fishing & Forestry in the State of Arizona?
Percentage of Population Employed in Farming, Fishing & Forestry in Arizona is 0.51%.
What is the Percentage of Population Employed in Farming, Fishing & Forestry in the United States?
Percentage of Population Employed in Farming, Fishing & Forestry in the United States is 0.61%.