Superior, AZ Map & Demographics
Superior Map
Superior Overview
$27,509
PER CAPITA INCOME
$69,474
AVG FAMILY INCOME
$39,600
AVG HOUSEHOLD INCOME
23.4%
WAGE / INCOME GAP [ % ]
76.6¢/ $1
WAGE / INCOME GAP [ $ ]
0.45
INEQUALITY / GINI INDEX
2,639
TOTAL POPULATION
1,303
MALE POPULATION
1,336
FEMALE POPULATION
97.53
MALES / 100 FEMALES
102.53
FEMALES / 100 MALES
53.9
MEDIAN AGE
2.9
AVG FAMILY SIZE
2.0
AVG HOUSEHOLD SIZE
1,176
LABOR FORCE [ PEOPLE ]
48.8%
PERCENT IN LABOR FORCE
6.9%
UNEMPLOYMENT RATE
Superior Zip Codes
Income in Superior
Income Overview in Superior
Per Capita Income in Superior is $27,509, while median incomes of families and households are $69,474 and $39,600 respectively.
| Characteristic | Number | Measure |
| Per Capita Income | 2,639 | $27,509 |
| Median Family Income | 646 | $69,474 |
| Mean Family Income | 646 | $76,611 |
| Median Household Income | 1,324 | $39,600 |
| Mean Household Income | 1,324 | $52,666 |
| Income Deficit | 646 | $0 |
| Wage / Income Gap (%) | 2,639 | 23.36% |
| Wage / Income Gap ($) | 2,639 | 76.64¢ per $1 |
| Gini / Inequality Index | 2,639 | 0.45 |
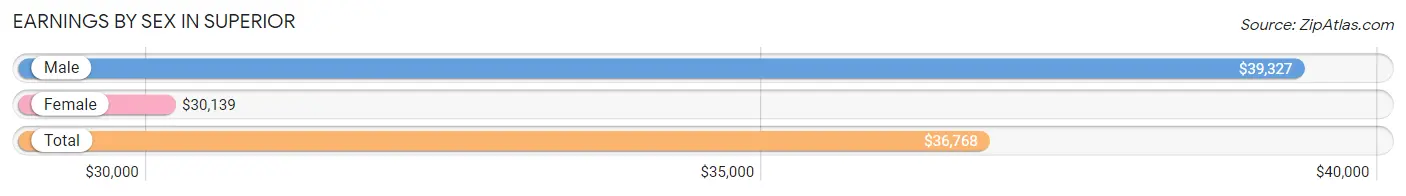
Earnings by Sex in Superior
Average Earnings in Superior are $36,768, $39,327 for men and $30,139 for women, a difference of 23.4%.
| Sex | Number | Average Earnings |
| Male | 637 (51.1%) | $39,327 |
| Female | 610 (48.9%) | $30,139 |
| Total | 1,247 (100.0%) | $36,768 |
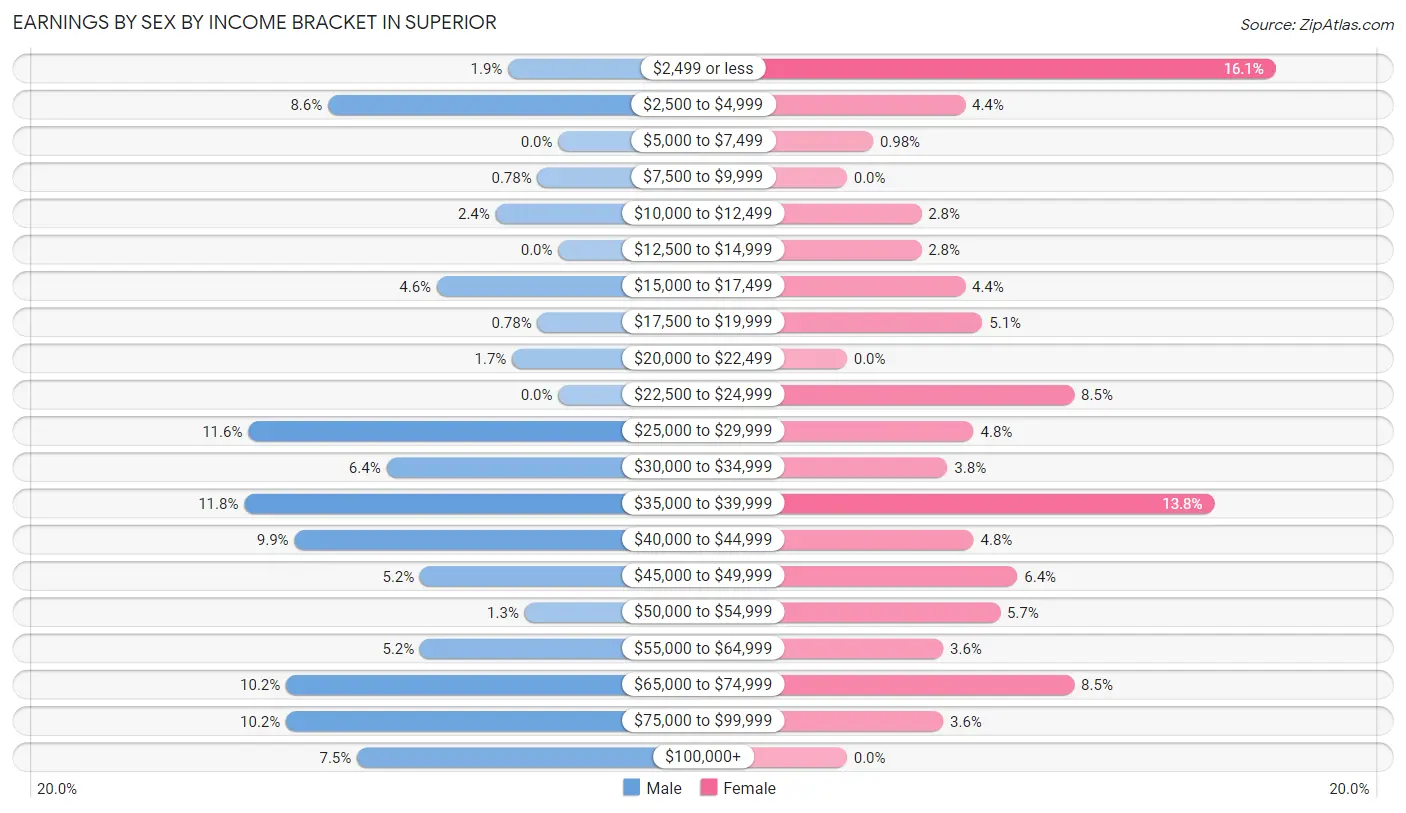
Earnings by Sex by Income Bracket in Superior
The most common earnings brackets in Superior are $35,000 to $39,999 for men (75 | 11.8%) and $2,499 or less for women (98 | 16.1%).
| Income | Male | Female |
| $2,499 or less | 12 (1.9%) | 98 (16.1%) |
| $2,500 to $4,999 | 55 (8.6%) | 27 (4.4%) |
| $5,000 to $7,499 | 0 (0.0%) | 6 (1.0%) |
| $7,500 to $9,999 | 5 (0.8%) | 0 (0.0%) |
| $10,000 to $12,499 | 15 (2.4%) | 17 (2.8%) |
| $12,500 to $14,999 | 0 (0.0%) | 17 (2.8%) |
| $15,000 to $17,499 | 29 (4.5%) | 27 (4.4%) |
| $17,500 to $19,999 | 5 (0.8%) | 31 (5.1%) |
| $20,000 to $22,499 | 11 (1.7%) | 0 (0.0%) |
| $22,500 to $24,999 | 0 (0.0%) | 52 (8.5%) |
| $25,000 to $29,999 | 74 (11.6%) | 29 (4.8%) |
| $30,000 to $34,999 | 41 (6.4%) | 23 (3.8%) |
| $35,000 to $39,999 | 75 (11.8%) | 84 (13.8%) |
| $40,000 to $44,999 | 63 (9.9%) | 29 (4.8%) |
| $45,000 to $49,999 | 33 (5.2%) | 39 (6.4%) |
| $50,000 to $54,999 | 8 (1.3%) | 35 (5.7%) |
| $55,000 to $64,999 | 33 (5.2%) | 22 (3.6%) |
| $65,000 to $74,999 | 65 (10.2%) | 52 (8.5%) |
| $75,000 to $99,999 | 65 (10.2%) | 22 (3.6%) |
| $100,000+ | 48 (7.5%) | 0 (0.0%) |
| Total | 637 (100.0%) | 610 (100.0%) |
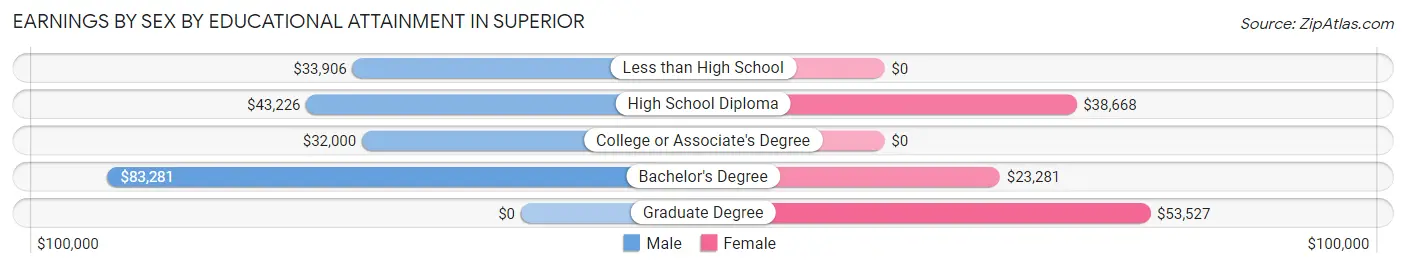
Earnings by Sex by Educational Attainment in Superior
Average earnings in Superior are $41,579 for men and $38,141 for women, a difference of 8.3%. Men with an educational attainment of bachelor's degree enjoy the highest average annual earnings of $83,281, while those with college or associate's degree education earn the least with $32,000. Women with an educational attainment of graduate degree earn the most with the average annual earnings of $53,527, while those with bachelor's degree education have the smallest earnings of $23,281.
| Educational Attainment | Male Income | Female Income |
| Less than High School | $33,906 | $0 |
| High School Diploma | $43,226 | $38,668 |
| College or Associate's Degree | $32,000 | $0 |
| Bachelor's Degree | $83,281 | $23,281 |
| Graduate Degree | - | - |
| Total | $41,579 | $38,141 |
Family Income in Superior
Family Income Brackets in Superior
According to the Superior family income data, there are 150 families falling into the $100,000 to $149,999 income range, which is the most common income bracket and makes up 23.2% of all families.
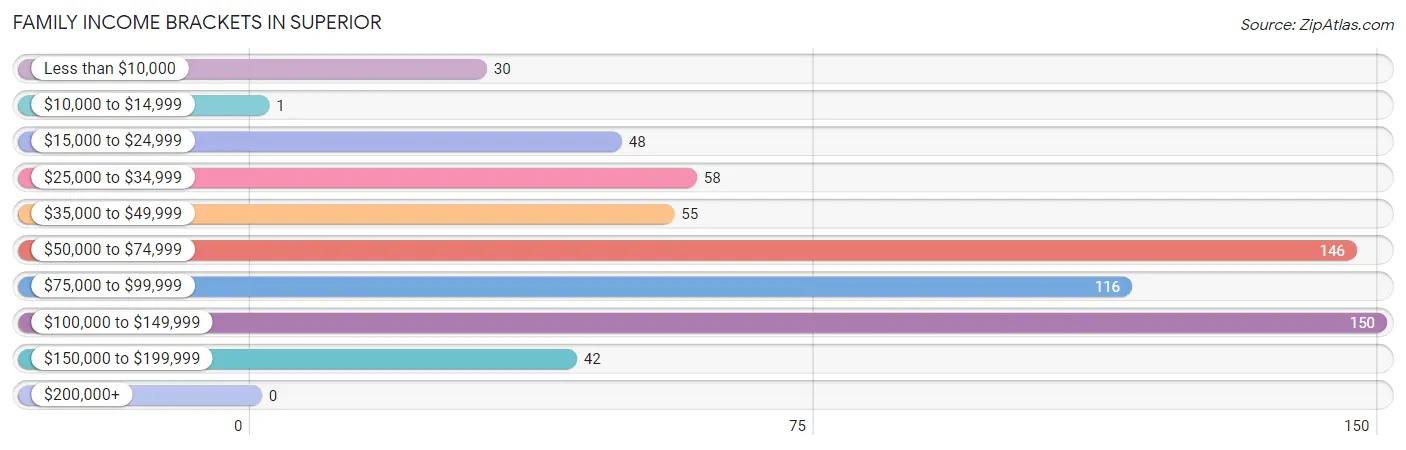
| Income Bracket | # Families | % Families |
| Less than $10,000 | 30 | 4.6% |
| $10,000 to $14,999 | 1 | 0.2% |
| $15,000 to $24,999 | 48 | 7.4% |
| $25,000 to $34,999 | 58 | 9.0% |
| $35,000 to $49,999 | 55 | 8.5% |
| $50,000 to $74,999 | 146 | 22.6% |
| $75,000 to $99,999 | 116 | 18.0% |
| $100,000 to $149,999 | 150 | 23.2% |
| $150,000 to $199,999 | 42 | 6.5% |
| $200,000+ | 0 | 0.0% |
Family Income by Famaliy Size in Superior
4-person families (105 | 16.3%) account for the highest median family income in Superior with $98,393 per family, while 2-person families (380 | 58.8%) have the highest median income of $30,625 per family member.
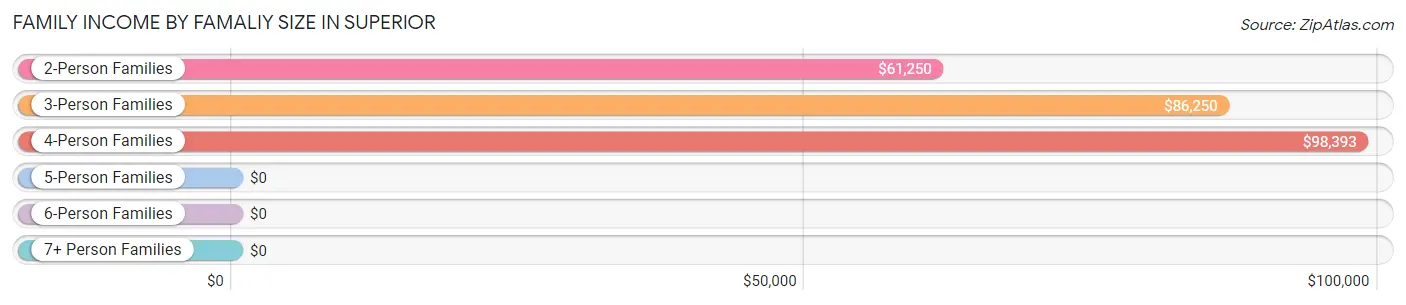
| Income Bracket | # Families | Median Income |
| 2-Person Families | 380 (58.8%) | $61,250 |
| 3-Person Families | 116 (18.0%) | $86,250 |
| 4-Person Families | 105 (16.3%) | $98,393 |
| 5-Person Families | 30 (4.6%) | $0 |
| 6-Person Families | 8 (1.2%) | $0 |
| 7+ Person Families | 7 (1.1%) | $0 |
| Total | 646 (100.0%) | $69,474 |
Family Income by Number of Earners in Superior
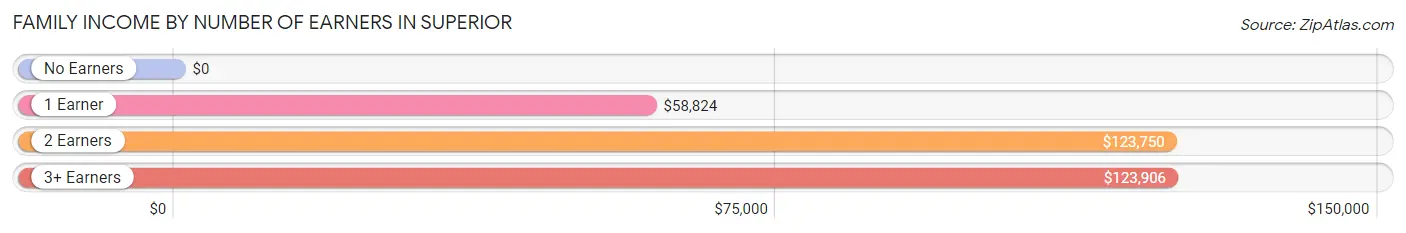
| Number of Earners | # Families | Median Income |
| No Earners | 117 (18.1%) | $0 |
| 1 Earner | 294 (45.5%) | $58,824 |
| 2 Earners | 162 (25.1%) | $123,750 |
| 3+ Earners | 73 (11.3%) | $123,906 |
| Total | 646 (100.0%) | $69,474 |
Household Income in Superior
Household Income Brackets in Superior
With 220 households falling in the category, the $50,000 to $74,999 income range is the most frequent in Superior, accounting for 16.6% of all households.
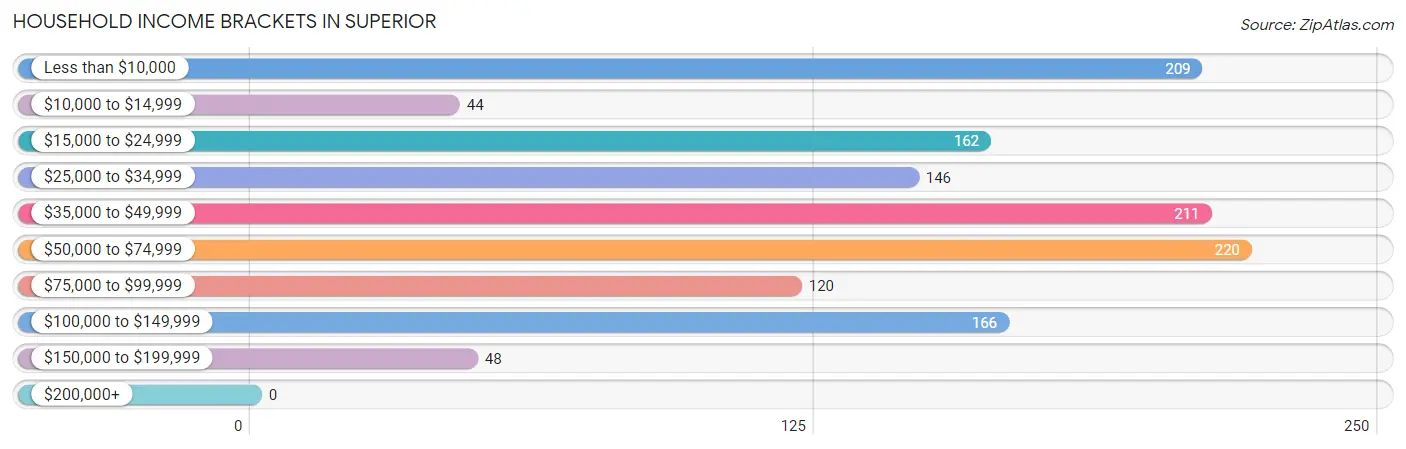
| Income Bracket | # Households | % Households |
| Less than $10,000 | 209 | 15.8% |
| $10,000 to $14,999 | 44 | 3.3% |
| $15,000 to $24,999 | 162 | 12.2% |
| $25,000 to $34,999 | 146 | 11.0% |
| $35,000 to $49,999 | 211 | 15.9% |
| $50,000 to $74,999 | 220 | 16.6% |
| $75,000 to $99,999 | 120 | 9.1% |
| $100,000 to $149,999 | 166 | 12.5% |
| $150,000 to $199,999 | 48 | 3.6% |
| $200,000+ | 0 | 0.0% |
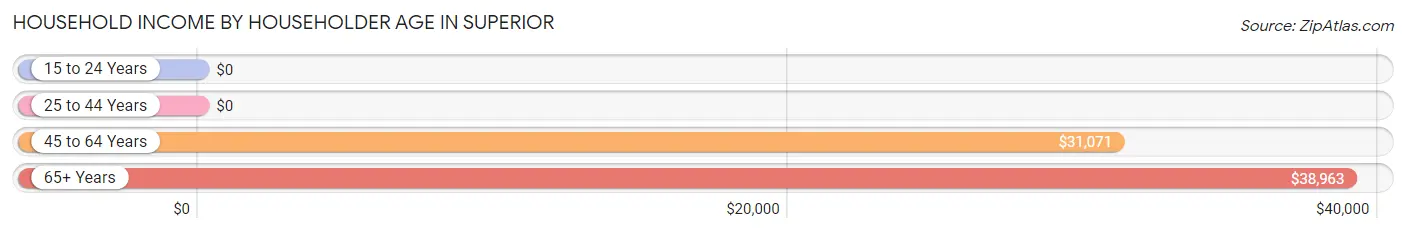
Household Income by Householder Age in Superior
The median household income in Superior is $39,600, with the highest median household income of $38,963 found in the 65+ years age bracket for the primary householder. A total of 641 households (48.4%) fall into this category. Meanwhile, the 15 to 24 years age bracket for the primary householder has the lowest median household income of $0, with 25 households (1.9%) in this group.
| Income Bracket | # Households | Median Income |
| 15 to 24 Years | 25 (1.9%) | $0 |
| 25 to 44 Years | 244 (18.4%) | $0 |
| 45 to 64 Years | 414 (31.3%) | $31,071 |
| 65+ Years | 641 (48.4%) | $38,963 |
| Total | 1,324 (100.0%) | $39,600 |
Poverty in Superior
Income Below Poverty by Sex and Age in Superior
With 20.4% poverty level for males and 14.2% for females among the residents of Superior, 45 to 54 year old males and 6 to 11 year old females are the most vulnerable to poverty, with 115 males (49.8%) and 29 females (52.7%) in their respective age groups living below the poverty level.
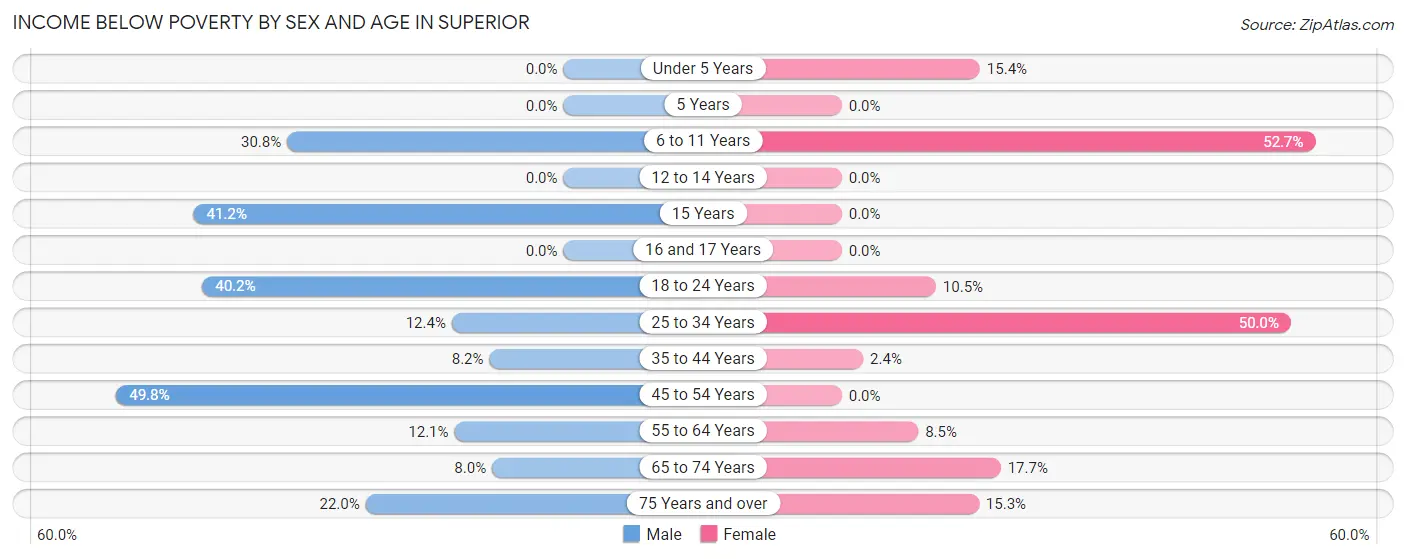
| Age Bracket | Male | Female |
| Under 5 Years | 0 (0.0%) | 4 (15.4%) |
| 5 Years | 0 (0.0%) | 0 (0.0%) |
| 6 to 11 Years | 16 (30.8%) | 29 (52.7%) |
| 12 to 14 Years | 0 (0.0%) | 0 (0.0%) |
| 15 Years | 7 (41.2%) | 0 (0.0%) |
| 16 and 17 Years | 0 (0.0%) | 0 (0.0%) |
| 18 to 24 Years | 39 (40.2%) | 11 (10.5%) |
| 25 to 34 Years | 21 (12.4%) | 32 (50.0%) |
| 35 to 44 Years | 14 (8.2%) | 4 (2.4%) |
| 45 to 54 Years | 115 (49.8%) | 0 (0.0%) |
| 55 to 64 Years | 17 (12.1%) | 16 (8.5%) |
| 65 to 74 Years | 24 (8.0%) | 54 (17.7%) |
| 75 Years and over | 13 (22.0%) | 40 (15.3%) |
| Total | 266 (20.4%) | 190 (14.2%) |
Income Above Poverty by Sex and Age in Superior
According to the poverty statistics in Superior, males aged under 5 years and females aged 5 years are the age groups that are most secure financially, with 100.0% of males and 100.0% of females in these age groups living above the poverty line.
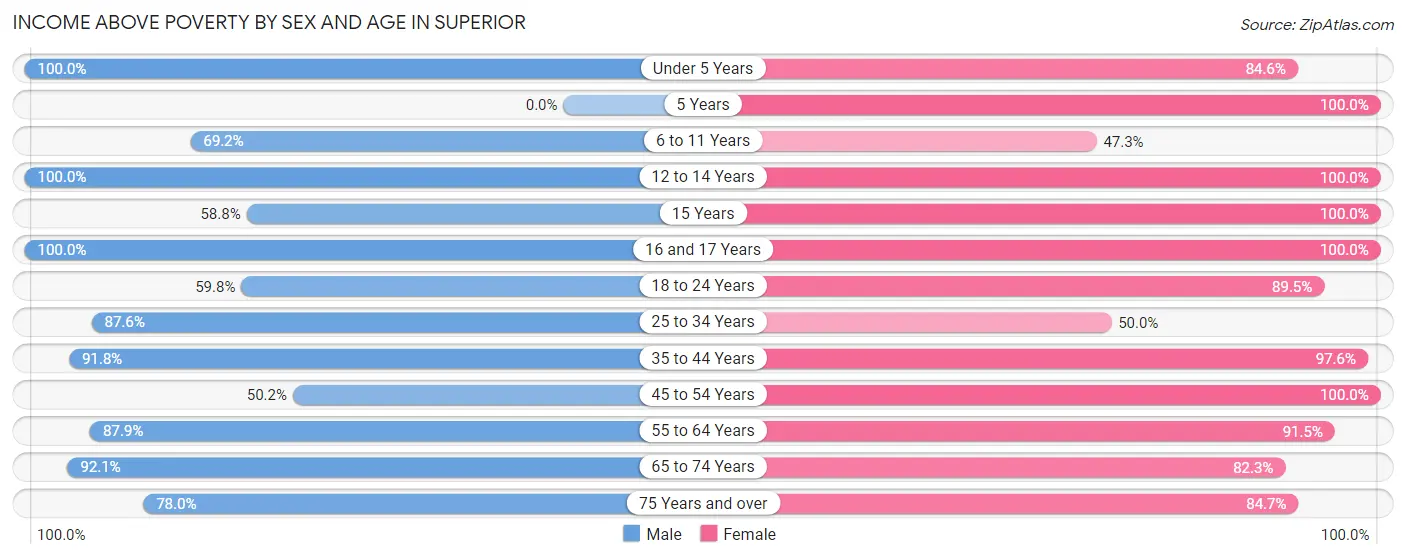
| Age Bracket | Male | Female |
| Under 5 Years | 31 (100.0%) | 22 (84.6%) |
| 5 Years | 0 (0.0%) | 7 (100.0%) |
| 6 to 11 Years | 36 (69.2%) | 26 (47.3%) |
| 12 to 14 Years | 8 (100.0%) | 13 (100.0%) |
| 15 Years | 10 (58.8%) | 20 (100.0%) |
| 16 and 17 Years | 27 (100.0%) | 25 (100.0%) |
| 18 to 24 Years | 58 (59.8%) | 94 (89.5%) |
| 25 to 34 Years | 148 (87.6%) | 32 (50.0%) |
| 35 to 44 Years | 156 (91.8%) | 164 (97.6%) |
| 45 to 54 Years | 116 (50.2%) | 98 (100.0%) |
| 55 to 64 Years | 123 (87.9%) | 172 (91.5%) |
| 65 to 74 Years | 278 (92.0%) | 251 (82.3%) |
| 75 Years and over | 46 (78.0%) | 222 (84.7%) |
| Total | 1,037 (79.6%) | 1,146 (85.8%) |
Income Below Poverty Among Married-Couple Families in Superior
The poverty statistics for married-couple families in Superior show that 3.1% or 14 of the total 455 families live below the poverty line. Families with 3 or 4 children have the highest poverty rate of 24.3%, comprising of 9 families. On the other hand, families with 1 or 2 children have the lowest poverty rate of 0.0%, which includes 0 families.
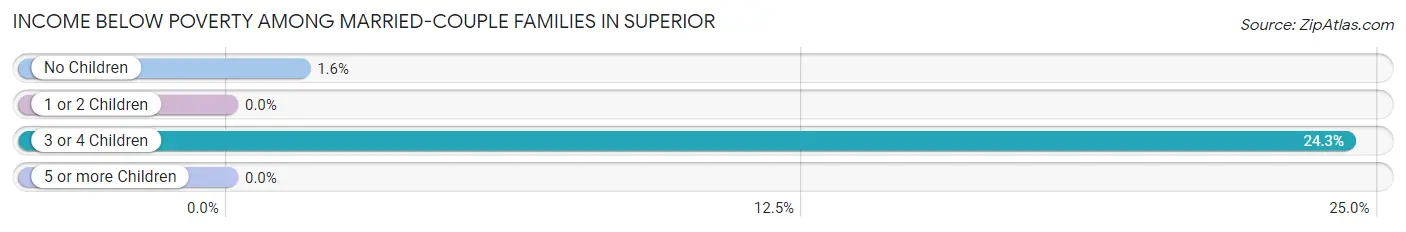
| Children | Above Poverty | Below Poverty |
| No Children | 314 (98.4%) | 5 (1.6%) |
| 1 or 2 Children | 99 (100.0%) | 0 (0.0%) |
| 3 or 4 Children | 28 (75.7%) | 9 (24.3%) |
| 5 or more Children | 0 (0.0%) | 0 (0.0%) |
| Total | 441 (96.9%) | 14 (3.1%) |
Income Below Poverty Among Single-Parent Households in Superior
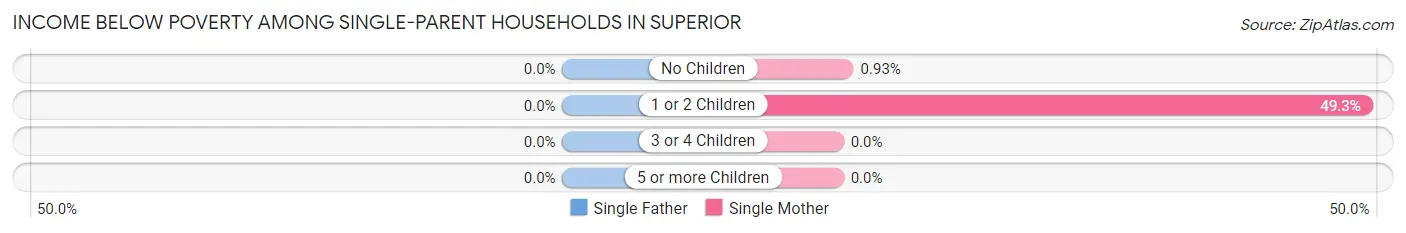
| Children | Single Father | Single Mother |
| No Children | 0 (0.0%) | 1 (0.9%) |
| 1 or 2 Children | 0 (0.0%) | 33 (49.2%) |
| 3 or 4 Children | 0 (0.0%) | 0 (0.0%) |
| 5 or more Children | 0 (0.0%) | 0 (0.0%) |
| Total | 0 (0.0%) | 34 (19.4%) |
Income Below Poverty Among Married-Couple vs Single-Parent Households in Superior
The poverty data for Superior shows that 14 of the married-couple family households (3.1%) and 34 of the single-parent households (17.8%) are living below the poverty level. Within the married-couple family households, those with 3 or 4 children have the highest poverty rate, with 9 households (24.3%) falling below the poverty line. Among the single-parent households, those with 1 or 2 children have the highest poverty rate, with 33 household (49.2%) living below poverty.
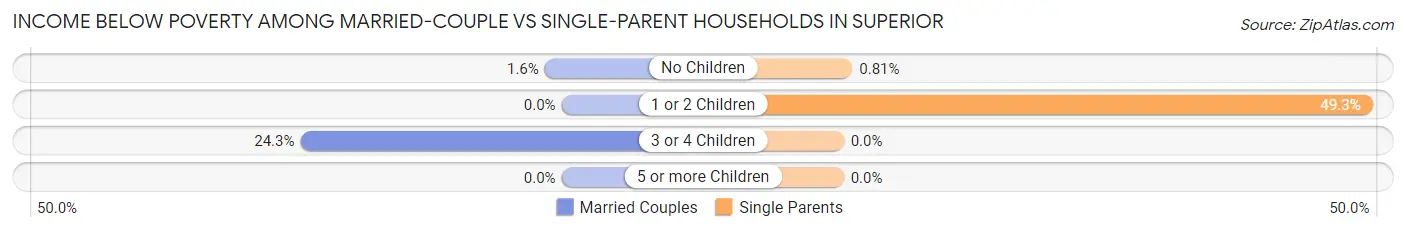
| Children | Married-Couple Families | Single-Parent Households |
| No Children | 5 (1.6%) | 1 (0.8%) |
| 1 or 2 Children | 0 (0.0%) | 33 (49.2%) |
| 3 or 4 Children | 9 (24.3%) | 0 (0.0%) |
| 5 or more Children | 0 (0.0%) | 0 (0.0%) |
| Total | 14 (3.1%) | 34 (17.8%) |
Race in Superior
The most populous races in Superior are White / Caucasian (1,608 | 60.9%), Hispanic or Latino (1,584 | 60.0%), and Two or more Races (563 | 21.3%).
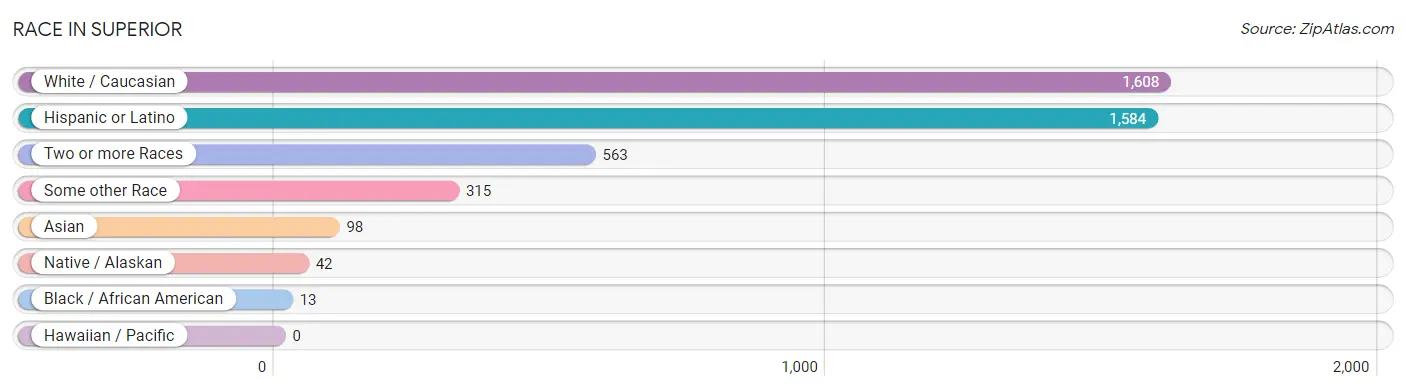
| Race | # Population | % Population |
| Asian | 98 | 3.7% |
| Black / African American | 13 | 0.5% |
| Hawaiian / Pacific | 0 | 0.0% |
| Hispanic or Latino | 1,584 | 60.0% |
| Native / Alaskan | 42 | 1.6% |
| White / Caucasian | 1,608 | 60.9% |
| Two or more Races | 563 | 21.3% |
| Some other Race | 315 | 11.9% |
| Total | 2,639 | 100.0% |
Ancestry in Superior
The most populous ancestries reported in Superior are Mexican (1,418 | 53.7%), American (192 | 7.3%), German (95 | 3.6%), English (94 | 3.6%), and Irish (87 | 3.3%), together accounting for 71.5% of all Superior residents.
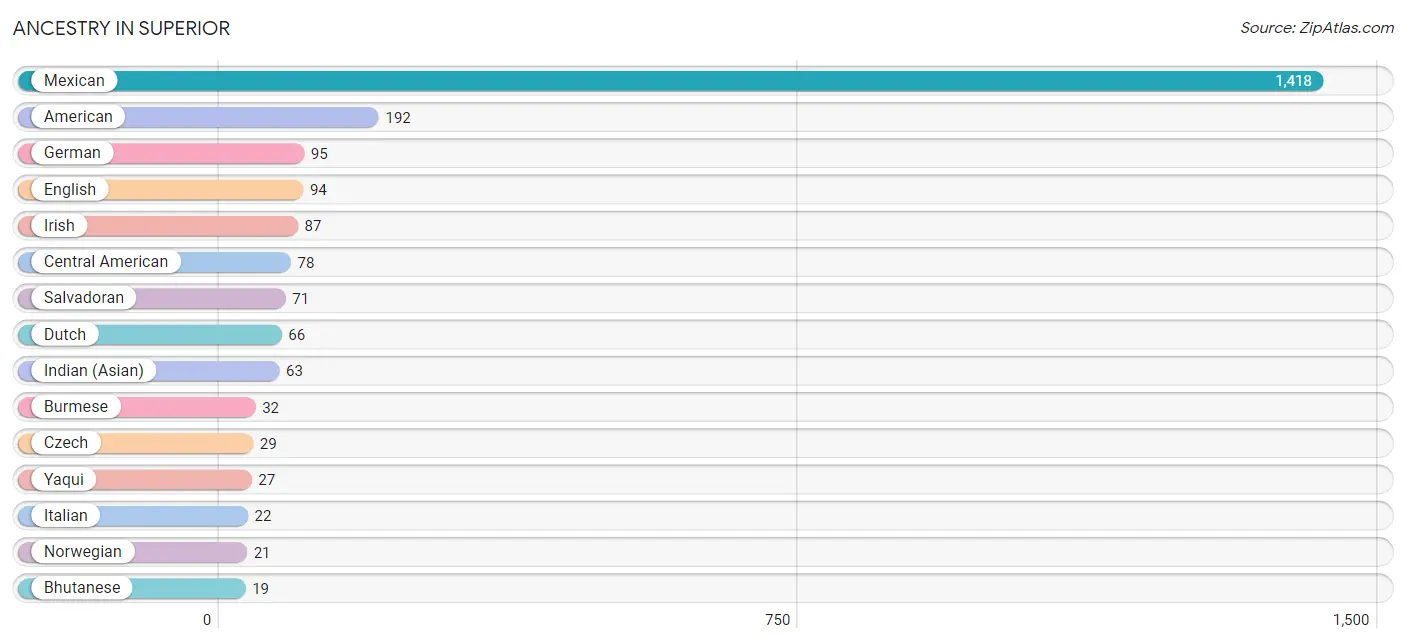
| Ancestry | # Population | % Population |
| American | 192 | 7.3% |
| Austrian | 14 | 0.5% |
| Bhutanese | 19 | 0.7% |
| Burmese | 32 | 1.2% |
| Central American | 78 | 3.0% |
| Central American Indian | 7 | 0.3% |
| Cherokee | 8 | 0.3% |
| Czech | 29 | 1.1% |
| Dominican | 15 | 0.6% |
| Dutch | 66 | 2.5% |
| Eastern European | 8 | 0.3% |
| English | 94 | 3.6% |
| Finnish | 6 | 0.2% |
| French | 9 | 0.3% |
| French Canadian | 14 | 0.5% |
| German | 95 | 3.6% |
| Greek | 9 | 0.3% |
| Guatemalan | 7 | 0.3% |
| Indian (Asian) | 63 | 2.4% |
| Irish | 87 | 3.3% |
| Italian | 22 | 0.8% |
| Laotian | 6 | 0.2% |
| Mexican | 1,418 | 53.7% |
| Nigerian | 13 | 0.5% |
| Norwegian | 21 | 0.8% |
| Polish | 9 | 0.3% |
| Russian | 7 | 0.3% |
| Salvadoran | 71 | 2.7% |
| Scandinavian | 6 | 0.2% |
| Scotch-Irish | 17 | 0.6% |
| Serbian | 8 | 0.3% |
| Subsaharan African | 13 | 0.5% |
| Swedish | 5 | 0.2% |
| Swiss | 5 | 0.2% |
| Thai | 3 | 0.1% |
| Welsh | 16 | 0.6% |
| Yaqui | 27 | 1.0% | View All 37 Rows |
Immigrants in Superior
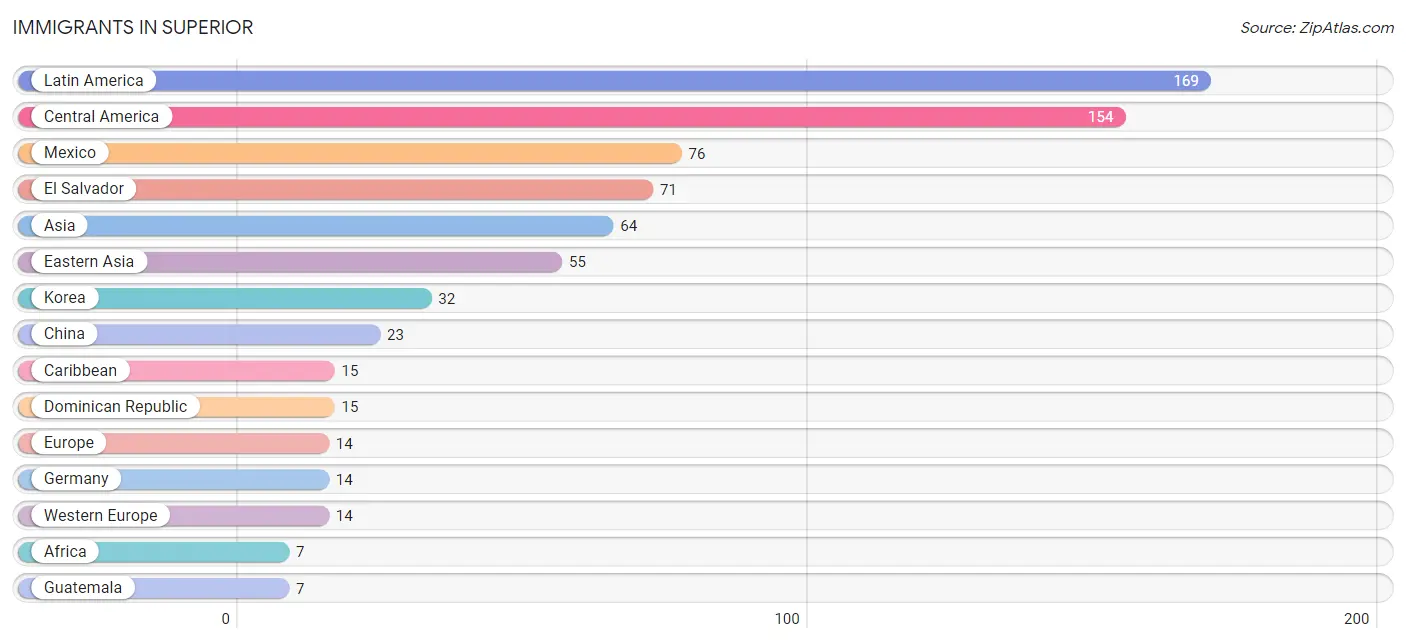
The most numerous immigrant groups reported in Superior came from Latin America (169 | 6.4%), Central America (154 | 5.8%), Mexico (76 | 2.9%), El Salvador (71 | 2.7%), and Asia (64 | 2.4%), together accounting for 20.2% of all Superior residents.
| Immigration Origin | # Population | % Population |
| Africa | 7 | 0.3% |
| Asia | 64 | 2.4% |
| Caribbean | 15 | 0.6% |
| Central America | 154 | 5.8% |
| China | 23 | 0.9% |
| Dominican Republic | 15 | 0.6% |
| Eastern Asia | 55 | 2.1% |
| El Salvador | 71 | 2.7% |
| Europe | 14 | 0.5% |
| Germany | 14 | 0.5% |
| Guatemala | 7 | 0.3% |
| India | 3 | 0.1% |
| Indonesia | 6 | 0.2% |
| Korea | 32 | 1.2% |
| Latin America | 169 | 6.4% |
| Mexico | 76 | 2.9% |
| Nigeria | 7 | 0.3% |
| South Central Asia | 3 | 0.1% |
| South Eastern Asia | 6 | 0.2% |
| Western Africa | 7 | 0.3% |
| Western Europe | 14 | 0.5% | View All 21 Rows |
Sex and Age in Superior
Sex and Age in Superior
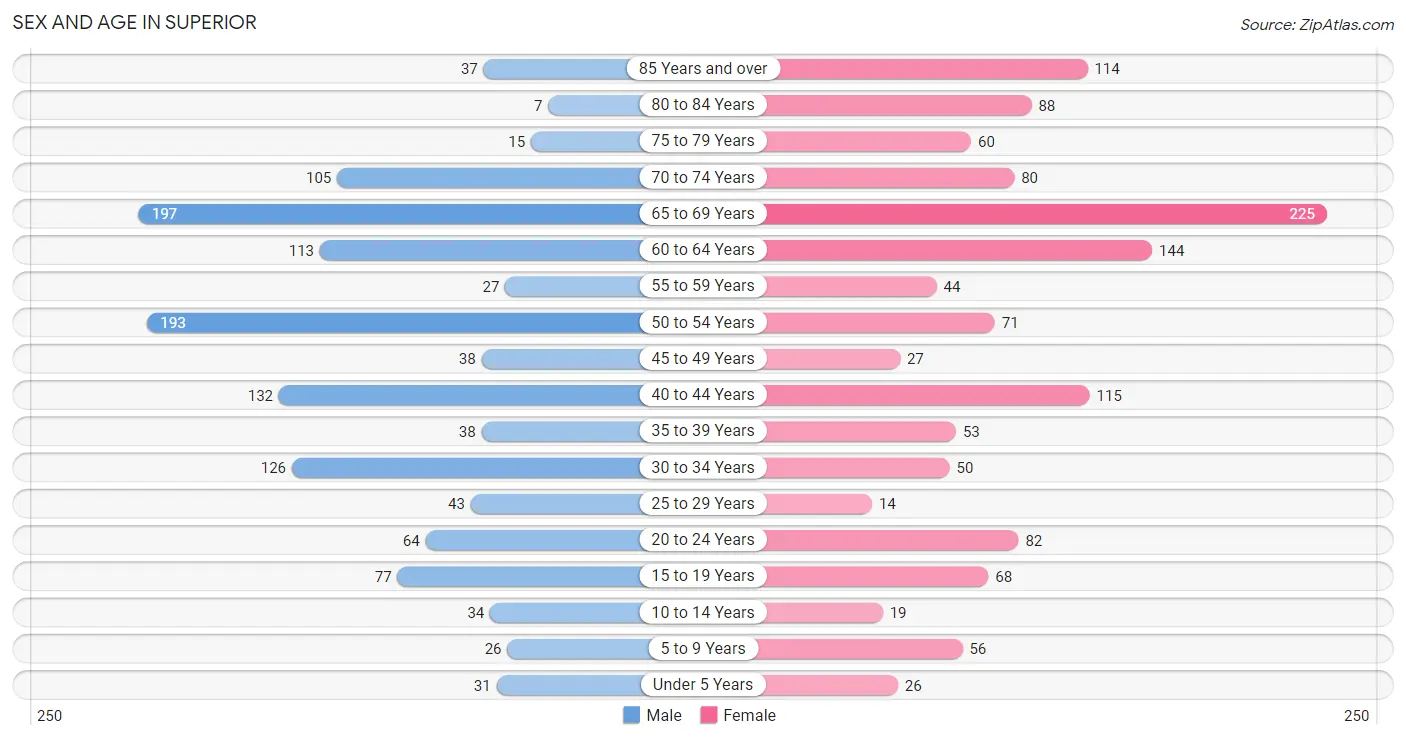
The most populous age groups in Superior are 65 to 69 Years (197 | 15.1%) for men and 65 to 69 Years (225 | 16.8%) for women.
| Age Bracket | Male | Female |
| Under 5 Years | 31 (2.4%) | 26 (1.9%) |
| 5 to 9 Years | 26 (2.0%) | 56 (4.2%) |
| 10 to 14 Years | 34 (2.6%) | 19 (1.4%) |
| 15 to 19 Years | 77 (5.9%) | 68 (5.1%) |
| 20 to 24 Years | 64 (4.9%) | 82 (6.1%) |
| 25 to 29 Years | 43 (3.3%) | 14 (1.1%) |
| 30 to 34 Years | 126 (9.7%) | 50 (3.7%) |
| 35 to 39 Years | 38 (2.9%) | 53 (4.0%) |
| 40 to 44 Years | 132 (10.1%) | 115 (8.6%) |
| 45 to 49 Years | 38 (2.9%) | 27 (2.0%) |
| 50 to 54 Years | 193 (14.8%) | 71 (5.3%) |
| 55 to 59 Years | 27 (2.1%) | 44 (3.3%) |
| 60 to 64 Years | 113 (8.7%) | 144 (10.8%) |
| 65 to 69 Years | 197 (15.1%) | 225 (16.8%) |
| 70 to 74 Years | 105 (8.1%) | 80 (6.0%) |
| 75 to 79 Years | 15 (1.1%) | 60 (4.5%) |
| 80 to 84 Years | 7 (0.5%) | 88 (6.6%) |
| 85 Years and over | 37 (2.8%) | 114 (8.5%) |
| Total | 1,303 (100.0%) | 1,336 (100.0%) |
Families and Households in Superior
Median Family Size in Superior
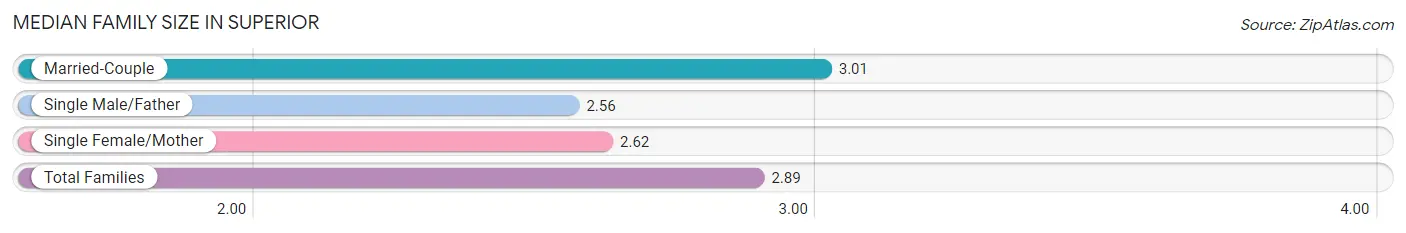
The median family size in Superior is 2.89 persons per family, with married-couple families (455 | 70.4%) accounting for the largest median family size of 3.01 persons per family. On the other hand, single male/father families (16 | 2.5%) represent the smallest median family size with 2.56 persons per family.
| Family Type | # Families | Family Size |
| Married-Couple | 455 (70.4%) | 3.01 |
| Single Male/Father | 16 (2.5%) | 2.56 |
| Single Female/Mother | 175 (27.1%) | 2.62 |
| Total Families | 646 (100.0%) | 2.89 |
Median Household Size in Superior
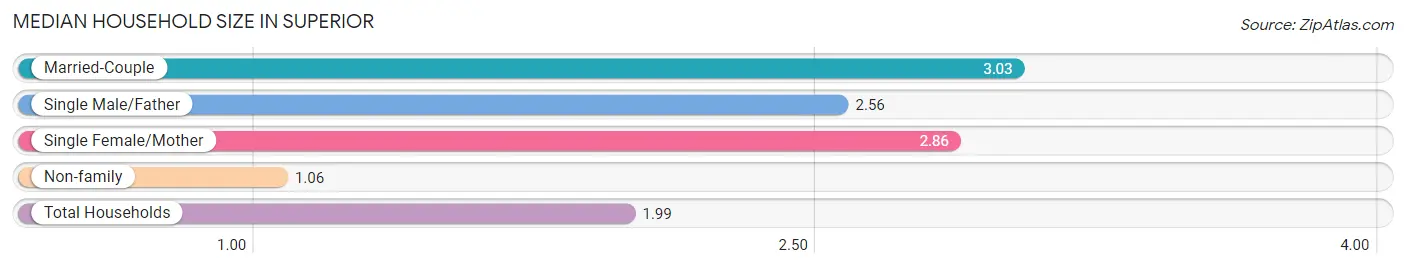
The median household size in Superior is 1.99 persons per household, with married-couple households (455 | 34.4%) accounting for the largest median household size of 3.03 persons per household. non-family households (678 | 51.2%) represent the smallest median household size with 1.06 persons per household.
| Household Type | # Households | Household Size |
| Married-Couple | 455 (34.4%) | 3.03 |
| Single Male/Father | 16 (1.2%) | 2.56 |
| Single Female/Mother | 175 (13.2%) | 2.86 |
| Non-family | 678 (51.2%) | 1.06 |
| Total Households | 1,324 (100.0%) | 1.99 |
Household Size by Marriage Status in Superior
Out of a total of 1,324 households in Superior, 646 (48.8%) are family households, while 678 (51.2%) are nonfamily households. The most numerous type of family households are 2-person households, comprising 345, and the most common type of nonfamily households are 1-person households, comprising 637.
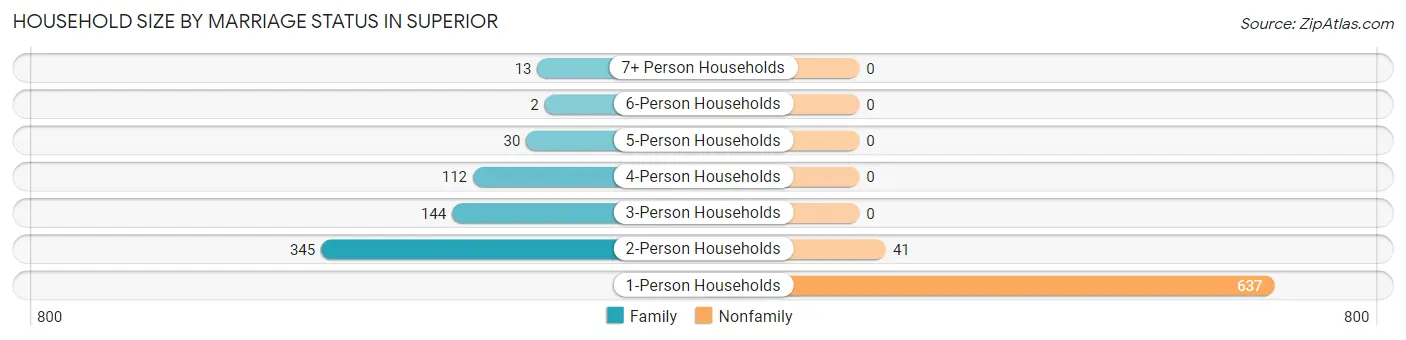
| Household Size | Family Households | Nonfamily Households |
| 1-Person Households | - | 637 (48.1%) |
| 2-Person Households | 345 (26.1%) | 41 (3.1%) |
| 3-Person Households | 144 (10.9%) | 0 (0.0%) |
| 4-Person Households | 112 (8.5%) | 0 (0.0%) |
| 5-Person Households | 30 (2.3%) | 0 (0.0%) |
| 6-Person Households | 2 (0.2%) | 0 (0.0%) |
| 7+ Person Households | 13 (1.0%) | 0 (0.0%) |
| Total | 646 (48.8%) | 678 (51.2%) |
Female Fertility in Superior
Fertility by Age in Superior
Average fertility rate in Superior is 27.0 births per 1,000 women. Women in the age bracket of 15 to 19 years have the highest fertility rate with 74.0 births per 1,000 women. Women in the age bracket of 20 to 34 years acount for 54.5% of all women with births.
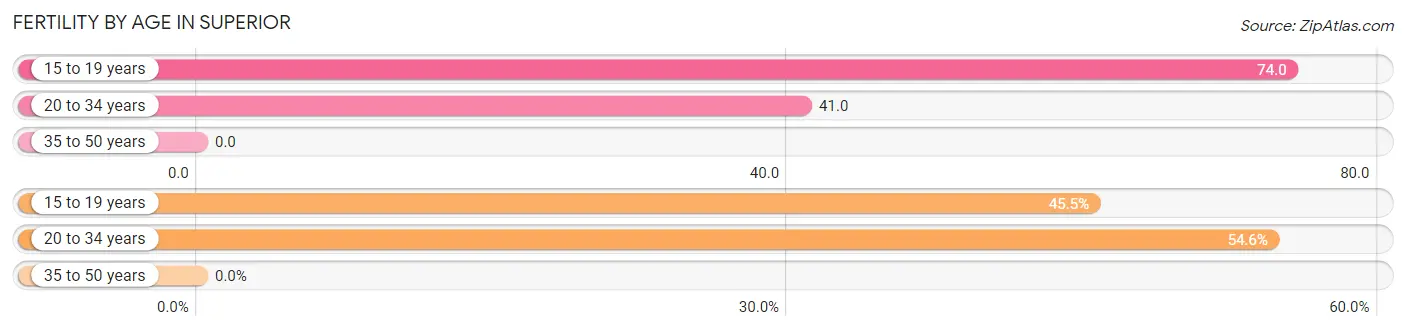
| Age Bracket | Women with Births | Births / 1,000 Women |
| 15 to 19 years | 5 (45.5%) | 74.0 |
| 20 to 34 years | 6 (54.5%) | 41.0 |
| 35 to 50 years | 0 (0.0%) | 0.0 |
| Total | 11 (100.0%) | 27.0 |
Fertility by Age by Marriage Status in Superior
54.5% of women with births (11) in Superior are married. The highest percentage of unmarried women with births falls into 15 to 19 years age bracket with 100.0% of them unmarried at the time of birth, while the lowest percentage of unmarried women with births belong to 20 to 34 years age bracket with 0.0% of them unmarried.
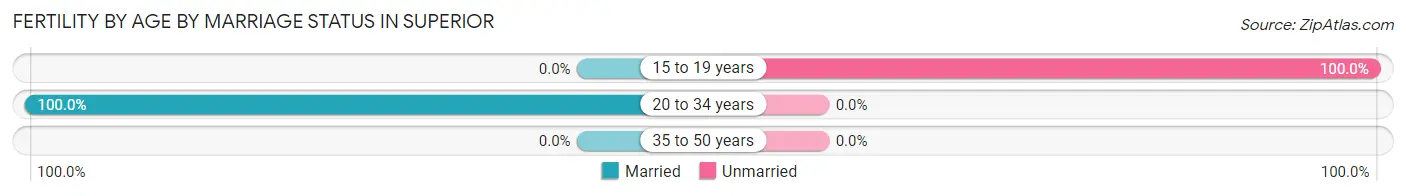
| Age Bracket | Married | Unmarried |
| 15 to 19 years | 0 (0.0%) | 5 (100.0%) |
| 20 to 34 years | 6 (100.0%) | 0 (0.0%) |
| 35 to 50 years | 0 (0.0%) | 0 (0.0%) |
| Total | 6 (54.5%) | 5 (45.5%) |
Fertility by Education in Superior
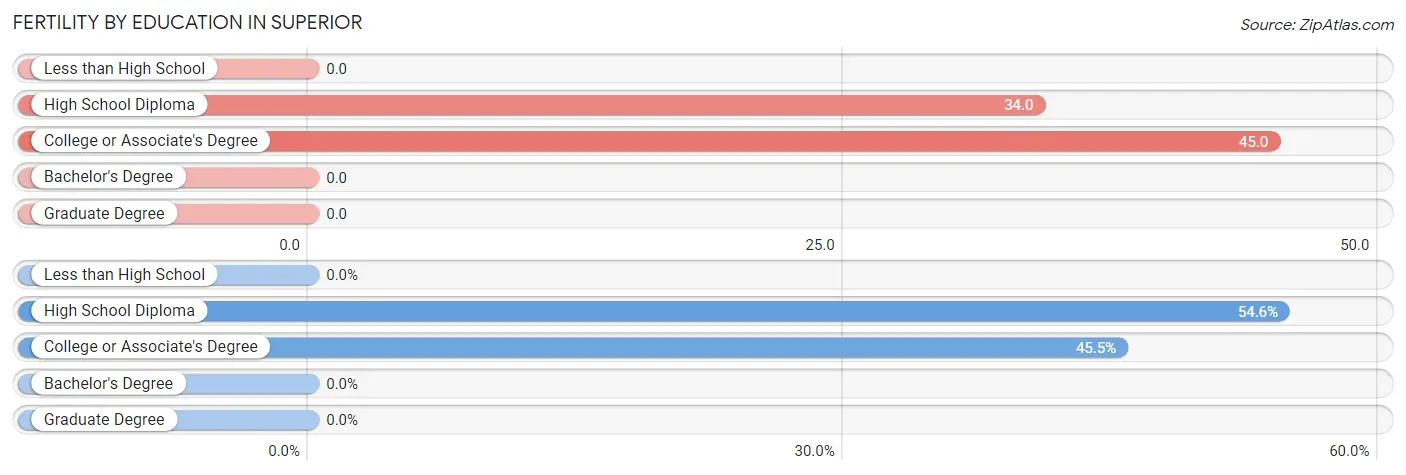
| Educational Attainment | Women with Births | Births / 1,000 Women |
| Less than High School | 0 (0.0%) | 0.0 |
| High School Diploma | 6 (54.5%) | 34.0 |
| College or Associate's Degree | 5 (45.5%) | 45.0 |
| Bachelor's Degree | 0 (0.0%) | 0.0 |
| Graduate Degree | 0 (0.0%) | 0.0 |
| Total | 11 (100.0%) | 27.0 |
Fertility by Education by Marriage Status in Superior
45.5% of women with births in Superior are unmarried. Women with the educational attainment of high school diploma are most likely to be married with 100.0% of them married at childbirth, while women with the educational attainment of college or associate's degree are least likely to be married with 100.0% of them unmarried at childbirth.
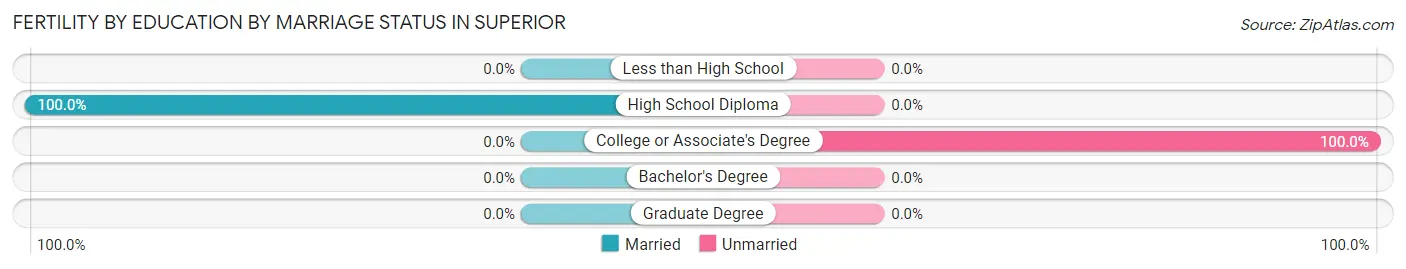
| Educational Attainment | Married | Unmarried |
| Less than High School | 0 (0.0%) | 0 (0.0%) |
| High School Diploma | 6 (100.0%) | 0 (0.0%) |
| College or Associate's Degree | 0 (0.0%) | 5 (100.0%) |
| Bachelor's Degree | 0 (0.0%) | 0 (0.0%) |
| Graduate Degree | 0 (0.0%) | 0 (0.0%) |
| Total | 6 (54.5%) | 5 (45.5%) |
Employment Characteristics in Superior
Employment by Class of Employer in Superior
Among the 1,094 employed individuals in Superior, private company employees (506 | 46.3%), local government employees (227 | 20.7%), and state government employees (124 | 11.3%) make up the most common classes of employment.
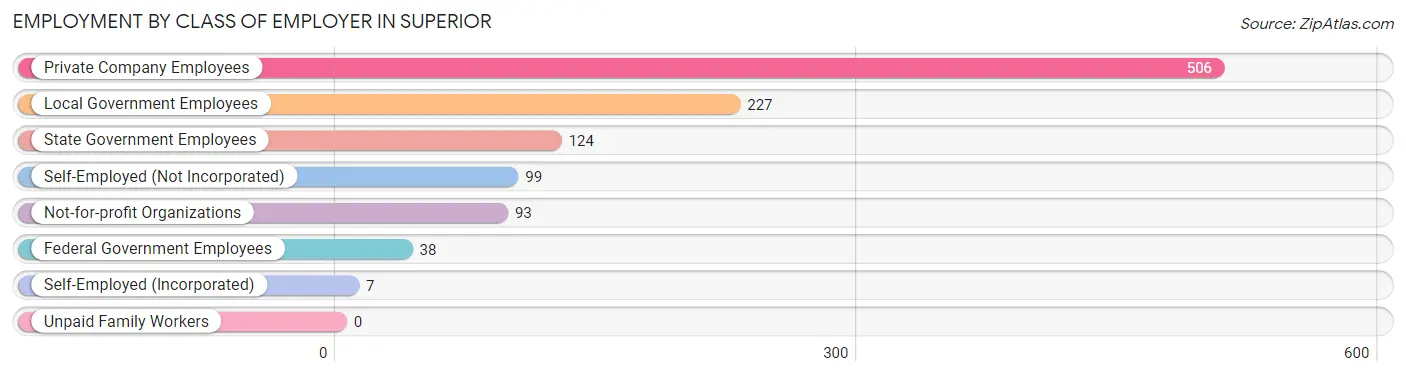
| Employer Class | # Employees | % Employees |
| Private Company Employees | 506 | 46.3% |
| Self-Employed (Incorporated) | 7 | 0.6% |
| Self-Employed (Not Incorporated) | 99 | 9.0% |
| Not-for-profit Organizations | 93 | 8.5% |
| Local Government Employees | 227 | 20.7% |
| State Government Employees | 124 | 11.3% |
| Federal Government Employees | 38 | 3.5% |
| Unpaid Family Workers | 0 | 0.0% |
| Total | 1,094 | 100.0% |
Employment Status by Age in Superior
According to the labor force statistics for Superior, out of the total population over 16 years of age (2,410), 48.8% or 1,176 individuals are in the labor force, with 6.9% or 81 of them unemployed. The age group with the highest labor force participation rate is 30 to 34 years, with 94.3% or 166 individuals in the labor force. Within the labor force, the 25 to 29 years age range has the highest percentage of unemployed individuals, with 41.7% or 10 of them being unemployed.
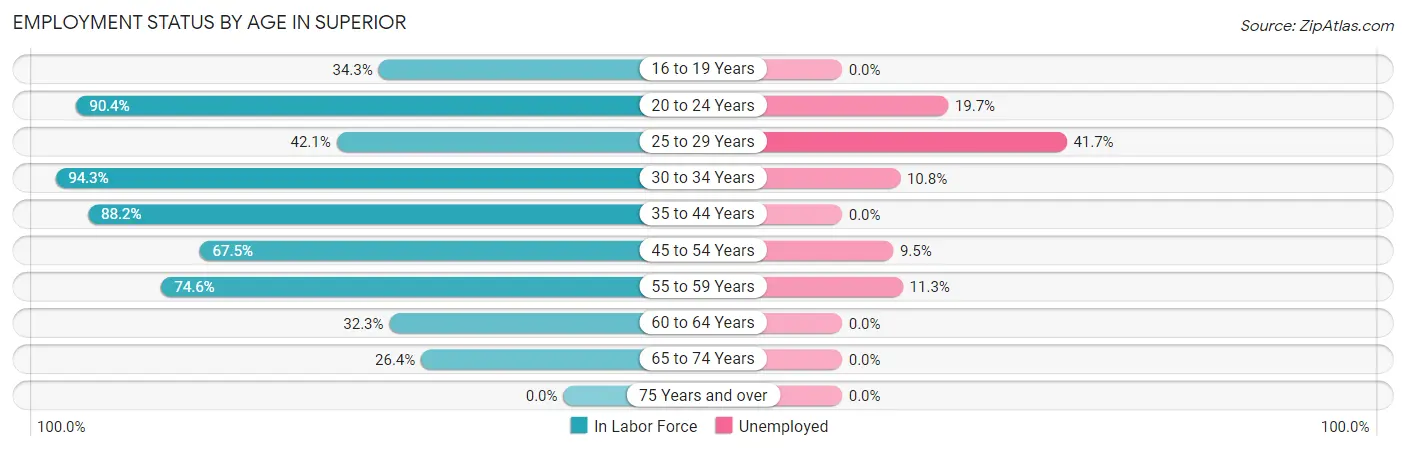
| Age Bracket | In Labor Force | Unemployed |
| 16 to 19 Years | 37 (34.3%) | 0 (0.0%) |
| 20 to 24 Years | 132 (90.4%) | 26 (19.7%) |
| 25 to 29 Years | 24 (42.1%) | 10 (41.7%) |
| 30 to 34 Years | 166 (94.3%) | 18 (10.8%) |
| 35 to 44 Years | 298 (88.2%) | 0 (0.0%) |
| 45 to 54 Years | 222 (67.5%) | 21 (9.5%) |
| 55 to 59 Years | 53 (74.6%) | 6 (11.3%) |
| 60 to 64 Years | 83 (32.3%) | 0 (0.0%) |
| 65 to 74 Years | 160 (26.4%) | 0 (0.0%) |
| 75 Years and over | 0 (0.0%) | 0 (0.0%) |
| Total | 1,176 (48.8%) | 81 (6.9%) |
Employment Status by Educational Attainment in Superior
According to labor force statistics for Superior, 68.9% of individuals (846) out of the total population between 25 and 64 years of age (1,228) are in the labor force, with 6.5% or 55 of them being unemployed. The group with the highest labor force participation rate are those with the educational attainment of college / associate degree, with 87.3% or 302 individuals in the labor force. Within the labor force, individuals with college / associate degree education have the highest percentage of unemployment, with 12.9% or 39 of them being unemployed.
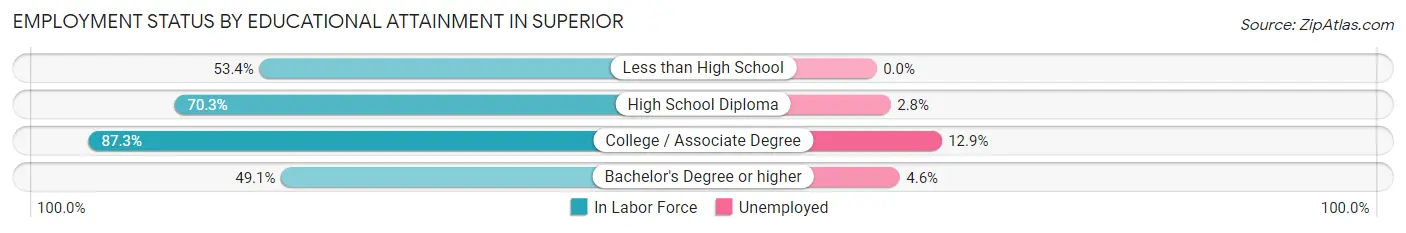
| Educational Attainment | In Labor Force | Unemployed |
| Less than High School | 63 (53.4%) | 0 (0.0%) |
| High School Diploma | 351 (70.3%) | 14 (2.8%) |
| College / Associate Degree | 302 (87.3%) | 45 (12.9%) |
| Bachelor's Degree or higher | 130 (49.1%) | 12 (4.6%) |
| Total | 846 (68.9%) | 80 (6.5%) |
Employment Occupations by Sex in Superior
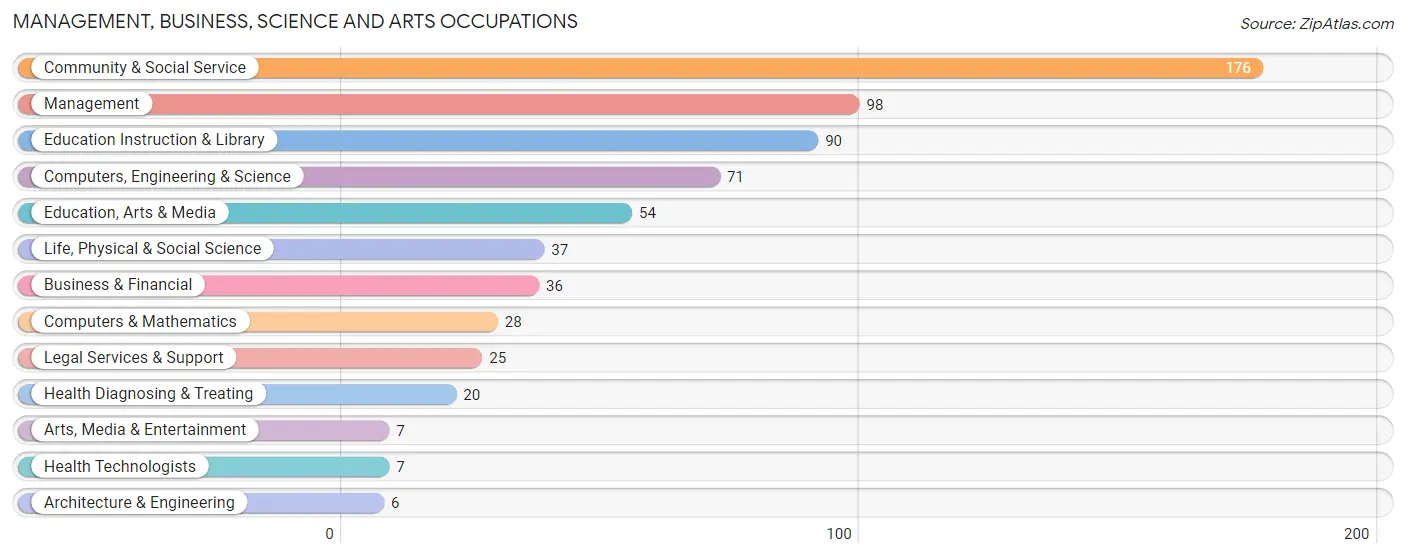
Management, Business, Science and Arts Occupations
The most common Management, Business, Science and Arts occupations in Superior are Community & Social Service (176 | 16.1%), Management (98 | 9.0%), Education Instruction & Library (90 | 8.2%), Computers, Engineering & Science (71 | 6.5%), and Education, Arts & Media (54 | 4.9%).
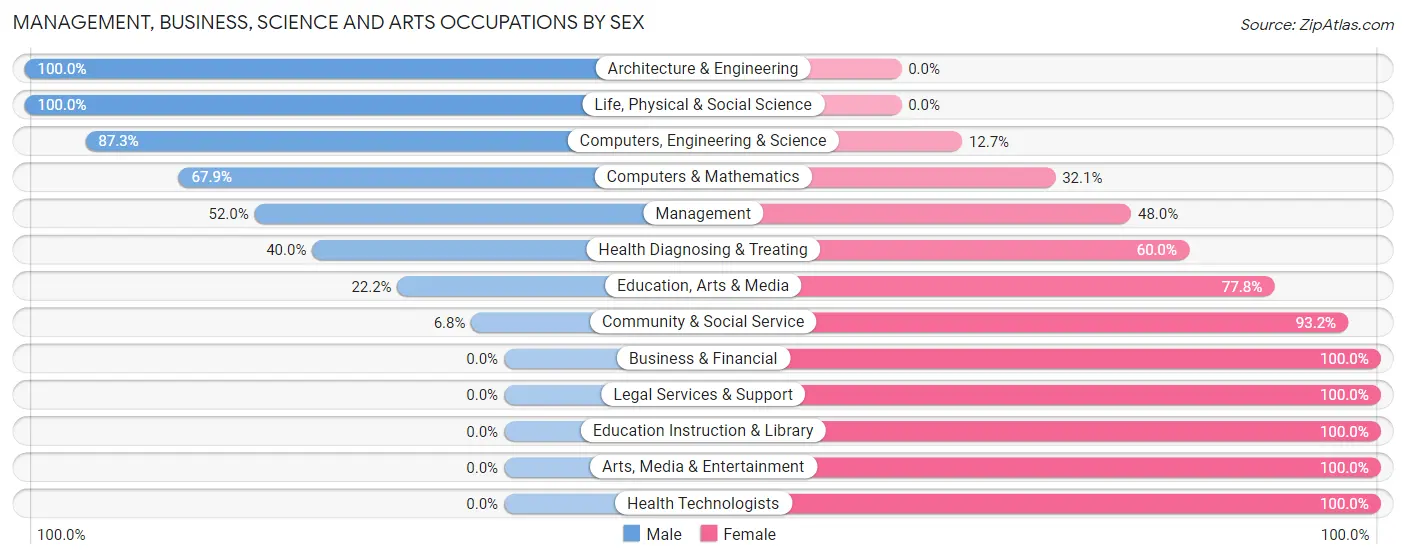
Management, Business, Science and Arts Occupations by Sex
Within the Management, Business, Science and Arts occupations in Superior, the most male-oriented occupations are Architecture & Engineering (100.0%), Life, Physical & Social Science (100.0%), and Computers, Engineering & Science (87.3%), while the most female-oriented occupations are Business & Financial (100.0%), Legal Services & Support (100.0%), and Education Instruction & Library (100.0%).
| Occupation | Male | Female |
| Management | 51 (52.0%) | 47 (48.0%) |
| Business & Financial | 0 (0.0%) | 36 (100.0%) |
| Computers, Engineering & Science | 62 (87.3%) | 9 (12.7%) |
| Computers & Mathematics | 19 (67.9%) | 9 (32.1%) |
| Architecture & Engineering | 6 (100.0%) | 0 (0.0%) |
| Life, Physical & Social Science | 37 (100.0%) | 0 (0.0%) |
| Community & Social Service | 12 (6.8%) | 164 (93.2%) |
| Education, Arts & Media | 12 (22.2%) | 42 (77.8%) |
| Legal Services & Support | 0 (0.0%) | 25 (100.0%) |
| Education Instruction & Library | 0 (0.0%) | 90 (100.0%) |
| Arts, Media & Entertainment | 0 (0.0%) | 7 (100.0%) |
| Health Diagnosing & Treating | 8 (40.0%) | 12 (60.0%) |
| Health Technologists | 0 (0.0%) | 7 (100.0%) |
| Total (Category) | 133 (33.2%) | 268 (66.8%) |
| Total (Overall) | 616 (56.3%) | 478 (43.7%) |
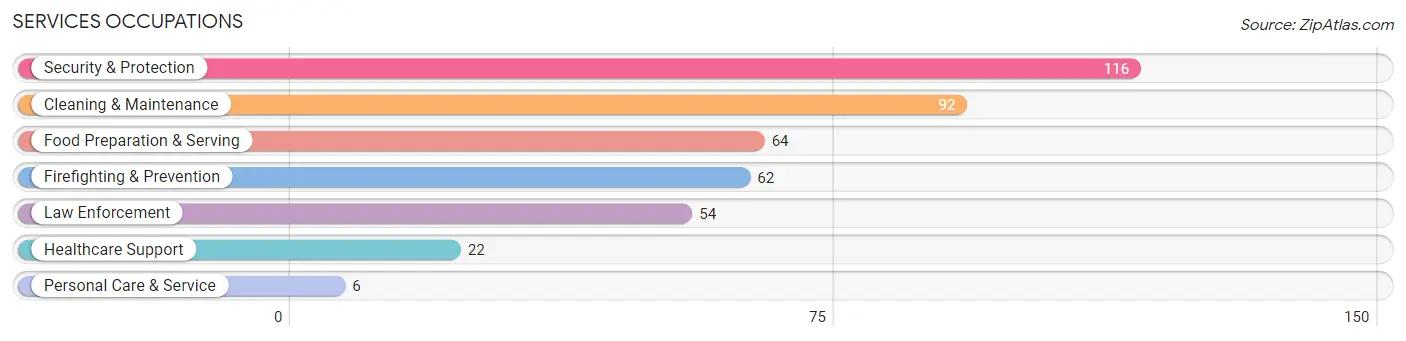
Services Occupations
The most common Services occupations in Superior are Security & Protection (116 | 10.6%), Cleaning & Maintenance (92 | 8.4%), Food Preparation & Serving (64 | 5.9%), Firefighting & Prevention (62 | 5.7%), and Law Enforcement (54 | 4.9%).
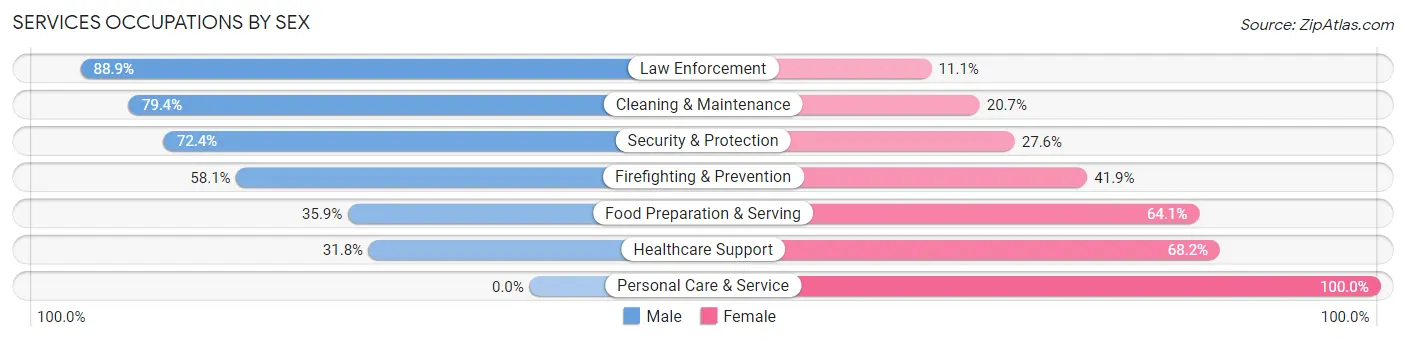
Services Occupations by Sex
Within the Services occupations in Superior, the most male-oriented occupations are Law Enforcement (88.9%), Cleaning & Maintenance (79.3%), and Security & Protection (72.4%), while the most female-oriented occupations are Personal Care & Service (100.0%), Healthcare Support (68.2%), and Food Preparation & Serving (64.1%).
| Occupation | Male | Female |
| Healthcare Support | 7 (31.8%) | 15 (68.2%) |
| Security & Protection | 84 (72.4%) | 32 (27.6%) |
| Firefighting & Prevention | 36 (58.1%) | 26 (41.9%) |
| Law Enforcement | 48 (88.9%) | 6 (11.1%) |
| Food Preparation & Serving | 23 (35.9%) | 41 (64.1%) |
| Cleaning & Maintenance | 73 (79.3%) | 19 (20.6%) |
| Personal Care & Service | 0 (0.0%) | 6 (100.0%) |
| Total (Category) | 187 (62.3%) | 113 (37.7%) |
| Total (Overall) | 616 (56.3%) | 478 (43.7%) |
Sales and Office Occupations
The most common Sales and Office occupations in Superior are Sales & Related (72 | 6.6%), and Office & Administration (52 | 4.8%).
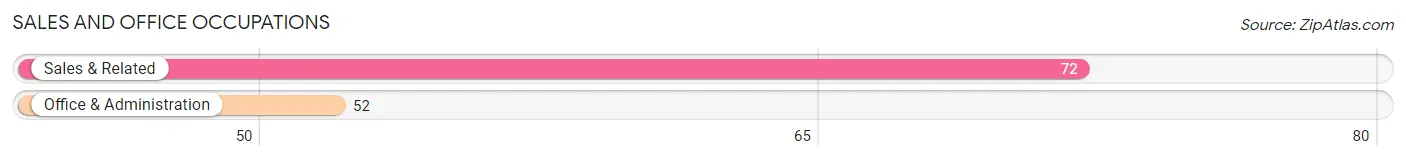
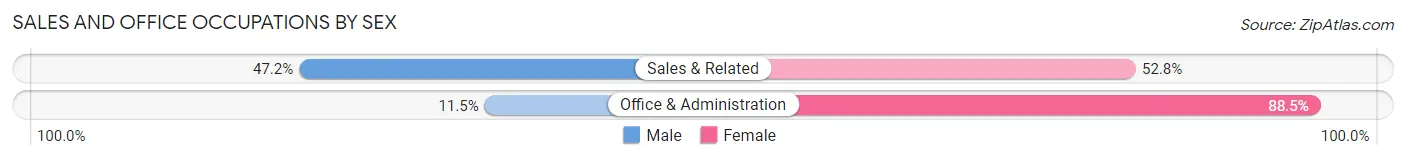
Sales and Office Occupations by Sex
| Occupation | Male | Female |
| Sales & Related | 34 (47.2%) | 38 (52.8%) |
| Office & Administration | 6 (11.5%) | 46 (88.5%) |
| Total (Category) | 40 (32.3%) | 84 (67.7%) |
| Total (Overall) | 616 (56.3%) | 478 (43.7%) |
Natural Resources, Construction and Maintenance Occupations
The most common Natural Resources, Construction and Maintenance occupations in Superior are Construction & Extraction (121 | 11.1%), and Installation, Maintenance & Repair (20 | 1.8%).
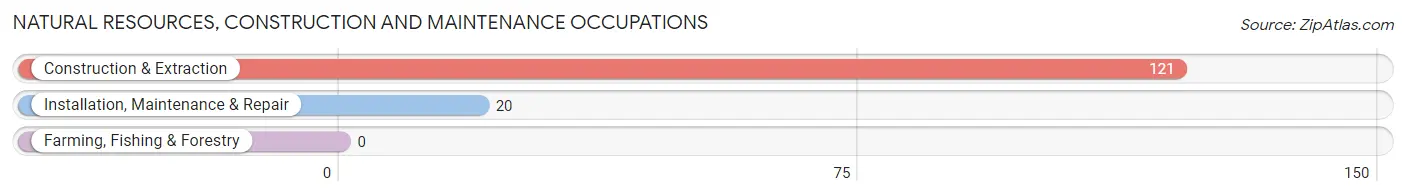
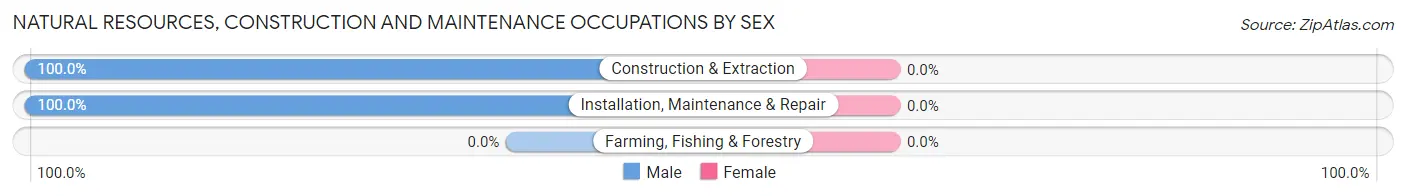
Natural Resources, Construction and Maintenance Occupations by Sex
| Occupation | Male | Female |
| Farming, Fishing & Forestry | 0 (0.0%) | 0 (0.0%) |
| Construction & Extraction | 121 (100.0%) | 0 (0.0%) |
| Installation, Maintenance & Repair | 20 (100.0%) | 0 (0.0%) |
| Total (Category) | 141 (100.0%) | 0 (0.0%) |
| Total (Overall) | 616 (56.3%) | 478 (43.7%) |
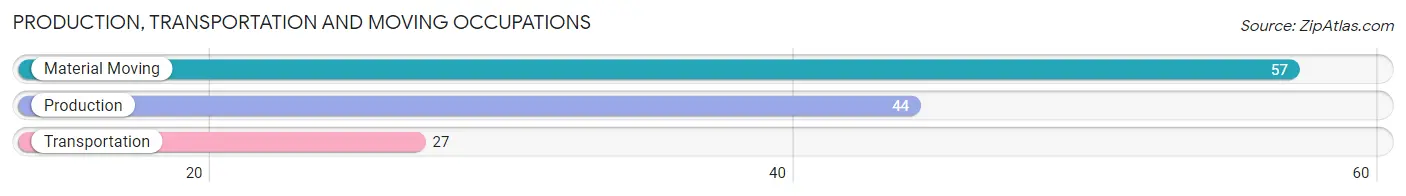
Production, Transportation and Moving Occupations
The most common Production, Transportation and Moving occupations in Superior are Material Moving (57 | 5.2%), Production (44 | 4.0%), and Transportation (27 | 2.5%).
Production, Transportation and Moving Occupations by Sex
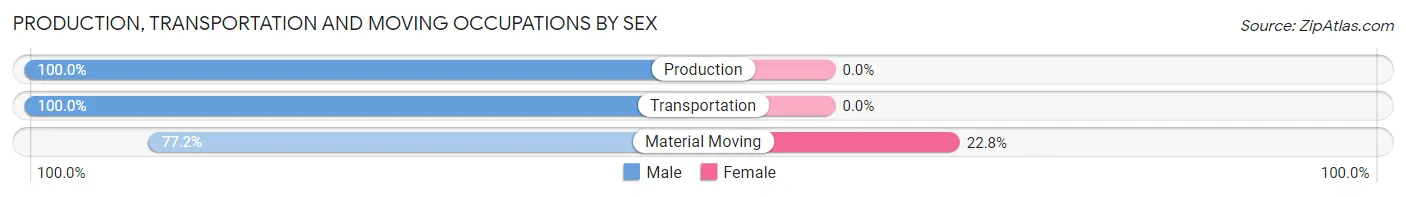
| Occupation | Male | Female |
| Production | 44 (100.0%) | 0 (0.0%) |
| Transportation | 27 (100.0%) | 0 (0.0%) |
| Material Moving | 44 (77.2%) | 13 (22.8%) |
| Total (Category) | 115 (89.8%) | 13 (10.2%) |
| Total (Overall) | 616 (56.3%) | 478 (43.7%) |
Employment Industries by Sex in Superior
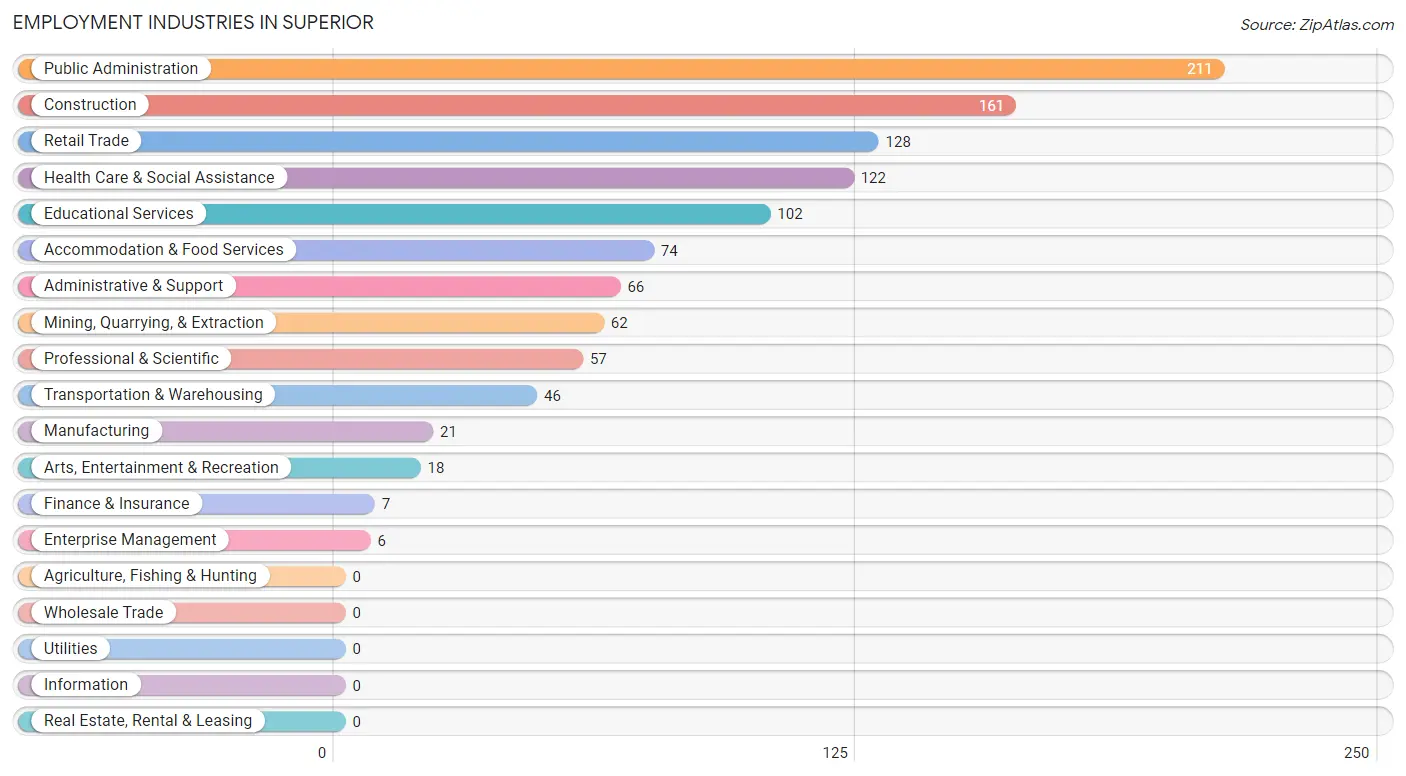
Employment Industries in Superior
The major employment industries in Superior include Public Administration (211 | 19.3%), Construction (161 | 14.7%), Retail Trade (128 | 11.7%), Health Care & Social Assistance (122 | 11.2%), and Educational Services (102 | 9.3%).
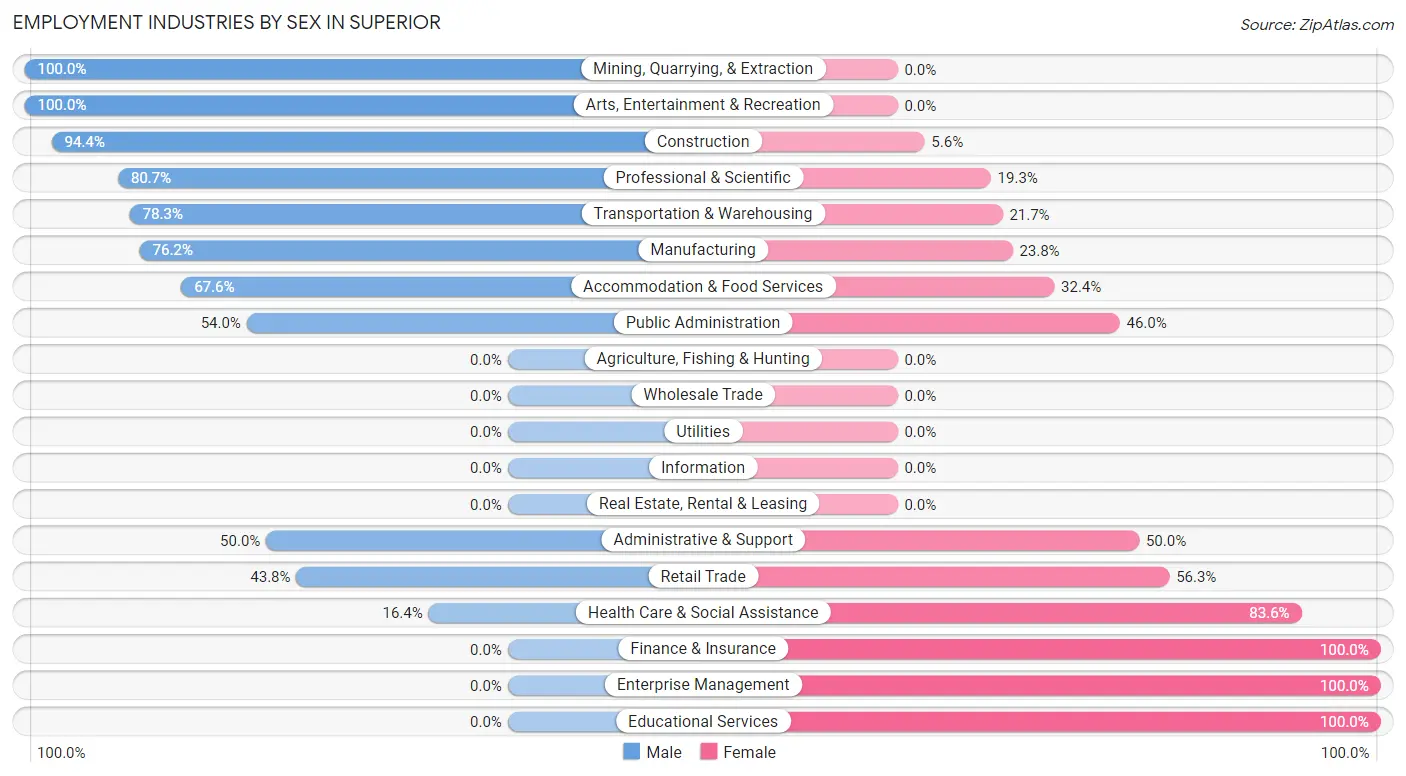
Employment Industries by Sex in Superior
The Superior industries that see more men than women are Mining, Quarrying, & Extraction (100.0%), Arts, Entertainment & Recreation (100.0%), and Construction (94.4%), whereas the industries that tend to have a higher number of women are Finance & Insurance (100.0%), Enterprise Management (100.0%), and Educational Services (100.0%).
| Industry | Male | Female |
| Agriculture, Fishing & Hunting | 0 (0.0%) | 0 (0.0%) |
| Mining, Quarrying, & Extraction | 62 (100.0%) | 0 (0.0%) |
| Construction | 152 (94.4%) | 9 (5.6%) |
| Manufacturing | 16 (76.2%) | 5 (23.8%) |
| Wholesale Trade | 0 (0.0%) | 0 (0.0%) |
| Retail Trade | 56 (43.8%) | 72 (56.2%) |
| Transportation & Warehousing | 36 (78.3%) | 10 (21.7%) |
| Utilities | 0 (0.0%) | 0 (0.0%) |
| Information | 0 (0.0%) | 0 (0.0%) |
| Finance & Insurance | 0 (0.0%) | 7 (100.0%) |
| Real Estate, Rental & Leasing | 0 (0.0%) | 0 (0.0%) |
| Professional & Scientific | 46 (80.7%) | 11 (19.3%) |
| Enterprise Management | 0 (0.0%) | 6 (100.0%) |
| Administrative & Support | 33 (50.0%) | 33 (50.0%) |
| Educational Services | 0 (0.0%) | 102 (100.0%) |
| Health Care & Social Assistance | 20 (16.4%) | 102 (83.6%) |
| Arts, Entertainment & Recreation | 18 (100.0%) | 0 (0.0%) |
| Accommodation & Food Services | 50 (67.6%) | 24 (32.4%) |
| Public Administration | 114 (54.0%) | 97 (46.0%) |
| Total | 616 (56.3%) | 478 (43.7%) |
Education in Superior
School Enrollment in Superior
The most common levels of schooling among the 277 students in Superior are high school (92 | 33.2%), elementary school (69 | 24.9%), and middle school (60 | 21.7%).
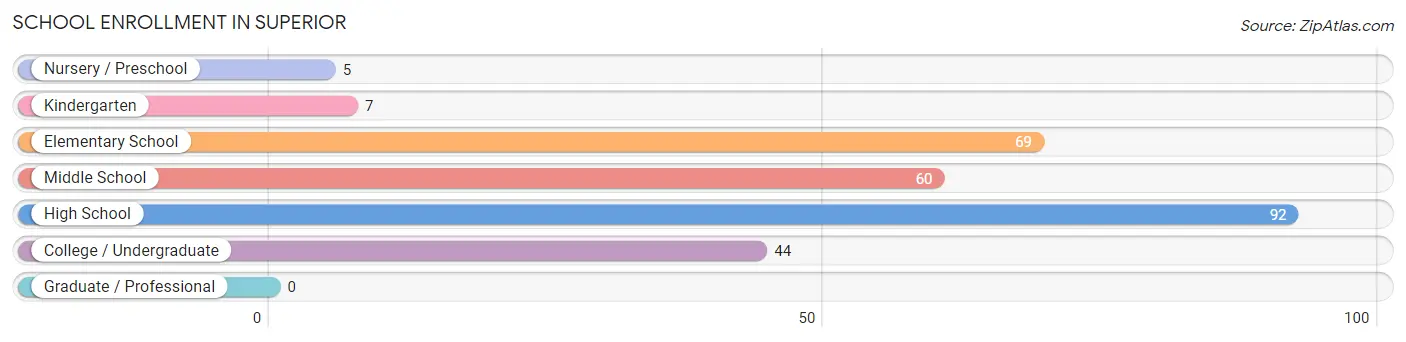
| School Level | # Students | % Students |
| Nursery / Preschool | 5 | 1.8% |
| Kindergarten | 7 | 2.5% |
| Elementary School | 69 | 24.9% |
| Middle School | 60 | 21.7% |
| High School | 92 | 33.2% |
| College / Undergraduate | 44 | 15.9% |
| Graduate / Professional | 0 | 0.0% |
| Total | 277 | 100.0% |
School Enrollment by Age by Funding Source in Superior
Out of a total of 277 students who are enrolled in schools in Superior, 52 (18.8%) attend a private institution, while the remaining 225 (81.2%) are enrolled in public schools. The age group of 35 years and over has the highest likelihood of being enrolled in private schools, with 8 (53.3% in the age bracket) enrolled. Conversely, the age group of 3 to 4 year olds has the lowest likelihood of being enrolled in a private school, with 5 (100.0% in the age bracket) attending a public institution.
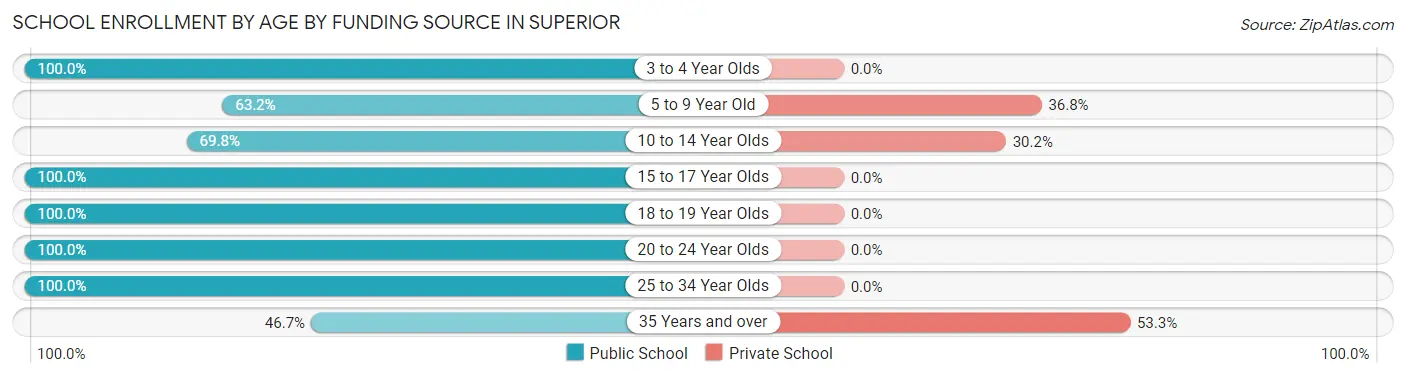
| Age Bracket | Public School | Private School |
| 3 to 4 Year Olds | 5 (100.0%) | 0 (0.0%) |
| 5 to 9 Year Old | 48 (63.2%) | 28 (36.8%) |
| 10 to 14 Year Olds | 37 (69.8%) | 16 (30.2%) |
| 15 to 17 Year Olds | 89 (100.0%) | 0 (0.0%) |
| 18 to 19 Year Olds | 25 (100.0%) | 0 (0.0%) |
| 20 to 24 Year Olds | 5 (100.0%) | 0 (0.0%) |
| 25 to 34 Year Olds | 9 (100.0%) | 0 (0.0%) |
| 35 Years and over | 7 (46.7%) | 8 (53.3%) |
| Total | 225 (81.2%) | 52 (18.8%) |
Educational Attainment by Field of Study in Superior
Liberal arts & history (119 | 25.9%), education (99 | 21.6%), bio, nature & agricultural (54 | 11.8%), engineering (40 | 8.7%), and social sciences (37 | 8.1%) are the most common fields of study among 459 individuals in Superior who have obtained a bachelor's degree or higher.

| Field of Study | # Graduates | % Graduates |
| Computers & Mathematics | 14 | 3.0% |
| Bio, Nature & Agricultural | 54 | 11.8% |
| Physical & Health Sciences | 3 | 0.6% |
| Psychology | 0 | 0.0% |
| Social Sciences | 37 | 8.1% |
| Engineering | 40 | 8.7% |
| Multidisciplinary Studies | 0 | 0.0% |
| Science & Technology | 6 | 1.3% |
| Business | 23 | 5.0% |
| Education | 99 | 21.6% |
| Literature & Languages | 16 | 3.5% |
| Liberal Arts & History | 119 | 25.9% |
| Visual & Performing Arts | 0 | 0.0% |
| Communications | 23 | 5.0% |
| Arts & Humanities | 25 | 5.4% |
| Total | 459 | 100.0% |
Transportation & Commute in Superior
Vehicle Availability by Sex in Superior
The most prevalent vehicle ownership categories in Superior are males with 2 vehicles (283, accounting for 45.9%) and females with 2 vehicles (122, making up 59.2%).
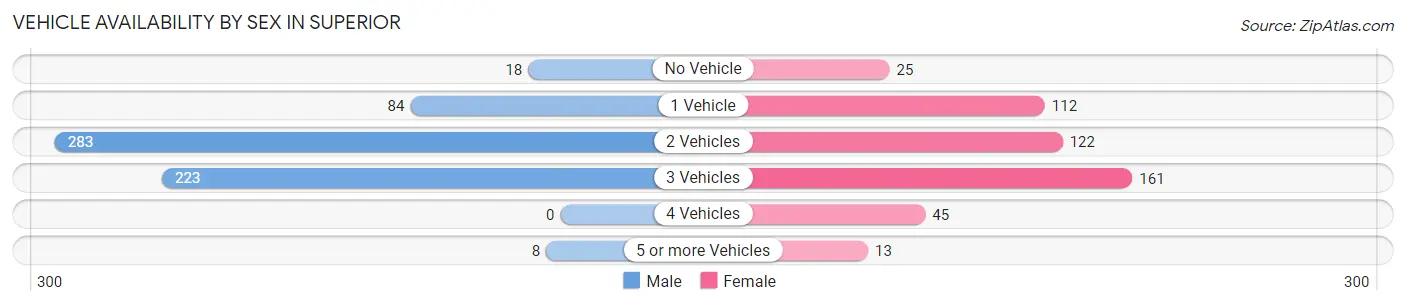
| Vehicles Available | Male | Female |
| No Vehicle | 18 (2.9%) | 25 (5.2%) |
| 1 Vehicle | 84 (13.6%) | 112 (23.4%) |
| 2 Vehicles | 283 (45.9%) | 122 (25.5%) |
| 3 Vehicles | 223 (36.2%) | 161 (33.7%) |
| 4 Vehicles | 0 (0.0%) | 45 (9.4%) |
| 5 or more Vehicles | 8 (1.3%) | 13 (2.7%) |
| Total | 616 (100.0%) | 478 (100.0%) |
Commute Time in Superior
The most frequently occuring commute durations in Superior are 30 to 34 minutes (159 commuters, 16.0%), 5 to 9 minutes (150 commuters, 15.1%), and 45 to 59 minutes (148 commuters, 14.9%).
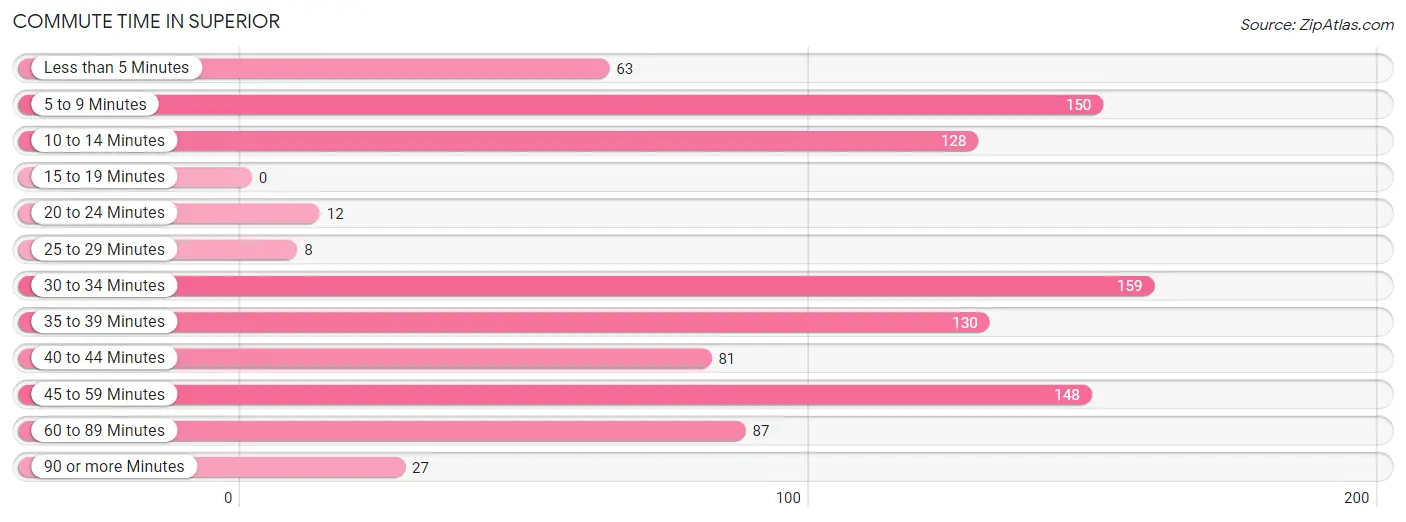
| Commute Time | # Commuters | % Commuters |
| Less than 5 Minutes | 63 | 6.3% |
| 5 to 9 Minutes | 150 | 15.1% |
| 10 to 14 Minutes | 128 | 12.9% |
| 15 to 19 Minutes | 0 | 0.0% |
| 20 to 24 Minutes | 12 | 1.2% |
| 25 to 29 Minutes | 8 | 0.8% |
| 30 to 34 Minutes | 159 | 16.0% |
| 35 to 39 Minutes | 130 | 13.1% |
| 40 to 44 Minutes | 81 | 8.2% |
| 45 to 59 Minutes | 148 | 14.9% |
| 60 to 89 Minutes | 87 | 8.8% |
| 90 or more Minutes | 27 | 2.7% |
Commute Time by Sex in Superior
The most common commute times in Superior are 30 to 34 minutes (133 commuters, 22.4%) for males and 45 to 59 minutes (89 commuters, 22.4%) for females.
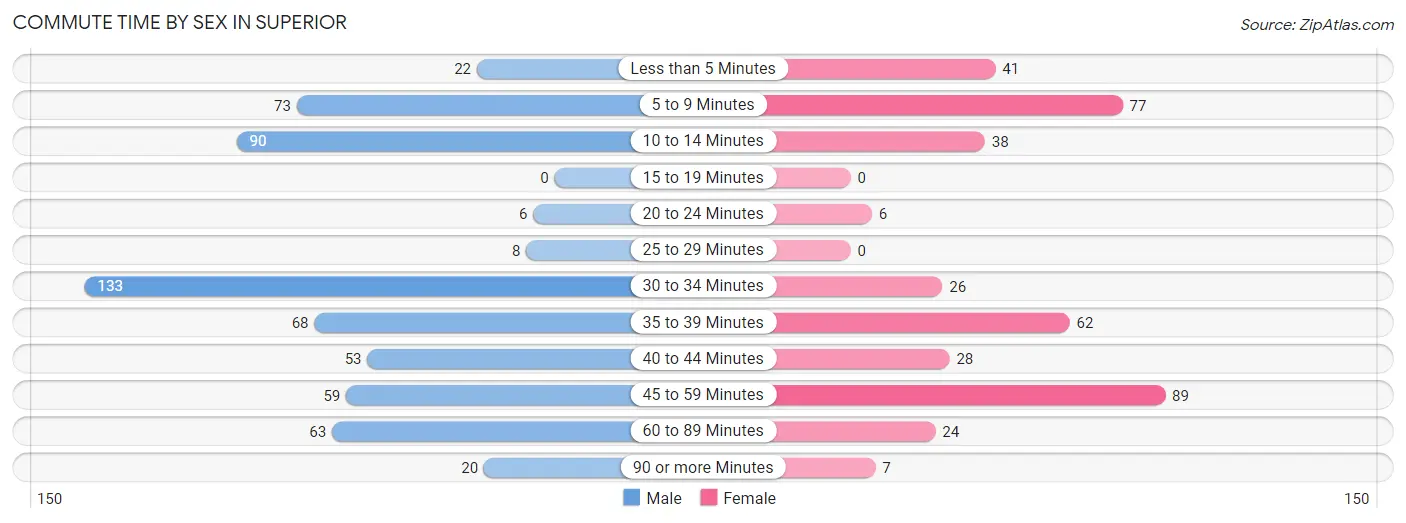
| Commute Time | Male | Female |
| Less than 5 Minutes | 22 (3.7%) | 41 (10.3%) |
| 5 to 9 Minutes | 73 (12.3%) | 77 (19.4%) |
| 10 to 14 Minutes | 90 (15.1%) | 38 (9.6%) |
| 15 to 19 Minutes | 0 (0.0%) | 0 (0.0%) |
| 20 to 24 Minutes | 6 (1.0%) | 6 (1.5%) |
| 25 to 29 Minutes | 8 (1.3%) | 0 (0.0%) |
| 30 to 34 Minutes | 133 (22.4%) | 26 (6.5%) |
| 35 to 39 Minutes | 68 (11.4%) | 62 (15.6%) |
| 40 to 44 Minutes | 53 (8.9%) | 28 (7.0%) |
| 45 to 59 Minutes | 59 (9.9%) | 89 (22.4%) |
| 60 to 89 Minutes | 63 (10.6%) | 24 (6.0%) |
| 90 or more Minutes | 20 (3.4%) | 7 (1.8%) |
Time of Departure to Work by Sex in Superior
The most frequent times of departure to work in Superior are 12:00 AM to 4:59 AM (150, 25.2%) for males and 7:00 AM to 7:29 AM (66, 16.6%) for females.
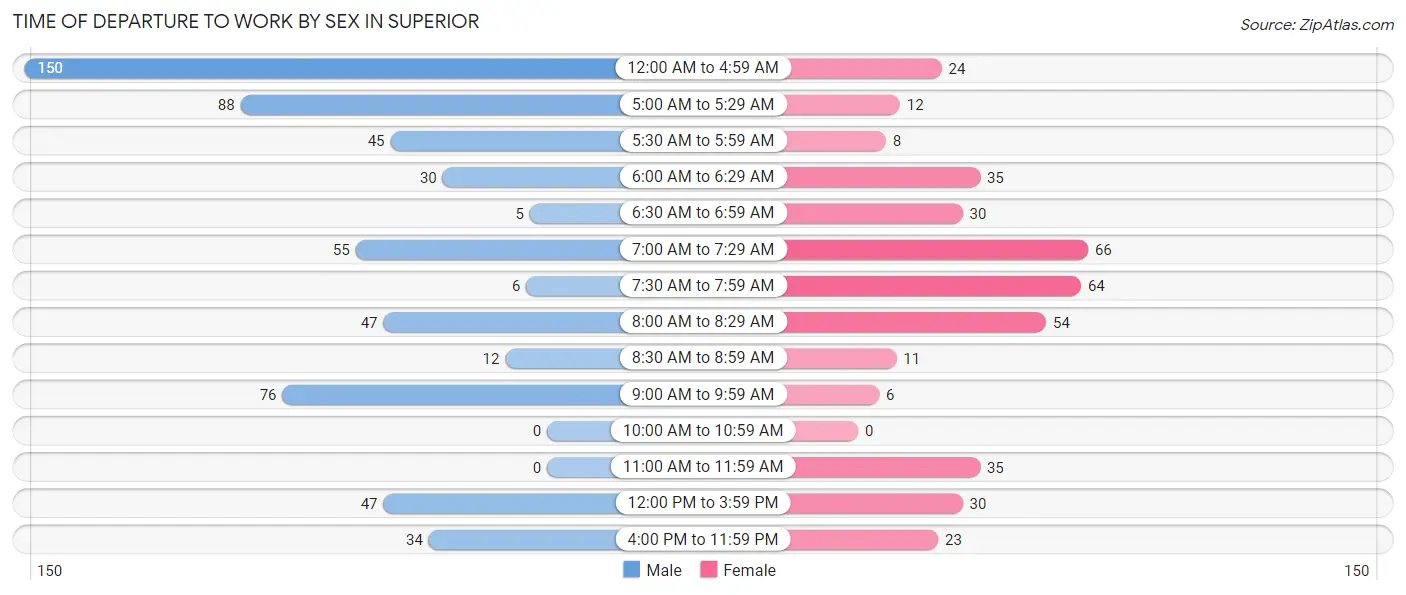
| Time of Departure | Male | Female |
| 12:00 AM to 4:59 AM | 150 (25.2%) | 24 (6.0%) |
| 5:00 AM to 5:29 AM | 88 (14.8%) | 12 (3.0%) |
| 5:30 AM to 5:59 AM | 45 (7.6%) | 8 (2.0%) |
| 6:00 AM to 6:29 AM | 30 (5.0%) | 35 (8.8%) |
| 6:30 AM to 6:59 AM | 5 (0.8%) | 30 (7.5%) |
| 7:00 AM to 7:29 AM | 55 (9.2%) | 66 (16.6%) |
| 7:30 AM to 7:59 AM | 6 (1.0%) | 64 (16.1%) |
| 8:00 AM to 8:29 AM | 47 (7.9%) | 54 (13.6%) |
| 8:30 AM to 8:59 AM | 12 (2.0%) | 11 (2.8%) |
| 9:00 AM to 9:59 AM | 76 (12.8%) | 6 (1.5%) |
| 10:00 AM to 10:59 AM | 0 (0.0%) | 0 (0.0%) |
| 11:00 AM to 11:59 AM | 0 (0.0%) | 35 (8.8%) |
| 12:00 PM to 3:59 PM | 47 (7.9%) | 30 (7.5%) |
| 4:00 PM to 11:59 PM | 34 (5.7%) | 23 (5.8%) |
| Total | 595 (100.0%) | 398 (100.0%) |
Housing Occupancy in Superior
Occupancy by Ownership in Superior
Of the total 1,324 dwellings in Superior, owner-occupied units account for 967 (73.0%), while renter-occupied units make up 357 (27.0%).
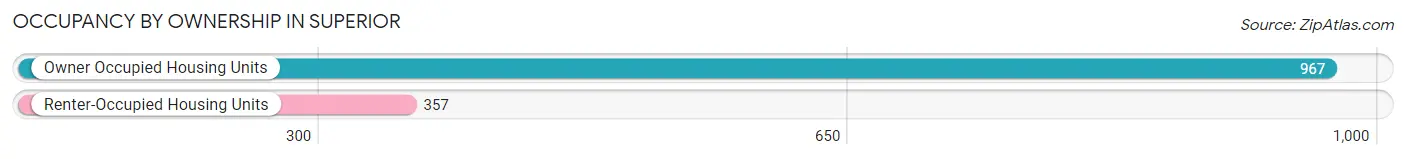
| Occupancy | # Housing Units | % Housing Units |
| Owner Occupied Housing Units | 967 | 73.0% |
| Renter-Occupied Housing Units | 357 | 27.0% |
| Total Occupied Housing Units | 1,324 | 100.0% |
Occupancy by Household Size in Superior
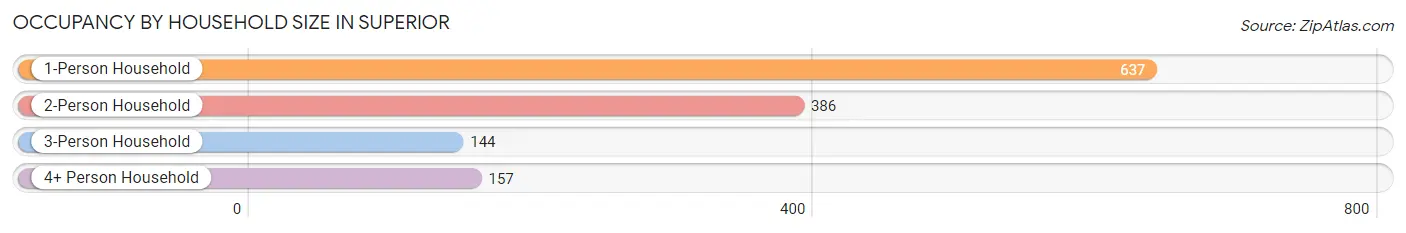
| Household Size | # Housing Units | % Housing Units |
| 1-Person Household | 637 | 48.1% |
| 2-Person Household | 386 | 29.1% |
| 3-Person Household | 144 | 10.9% |
| 4+ Person Household | 157 | 11.9% |
| Total Housing Units | 1,324 | 100.0% |
Occupancy by Ownership by Household Size in Superior
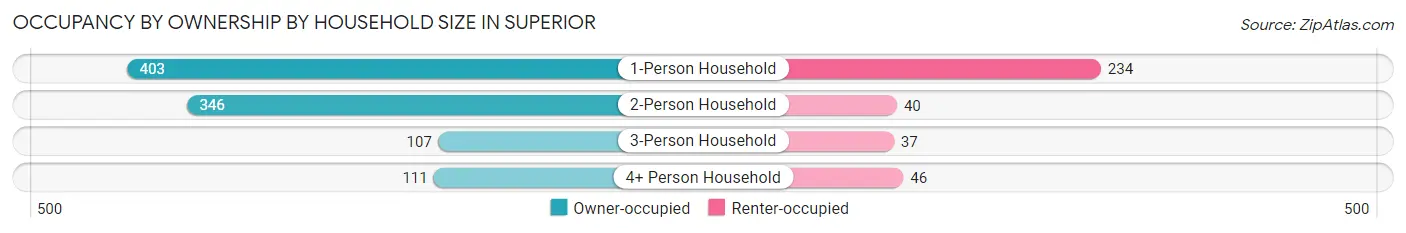
| Household Size | Owner-occupied | Renter-occupied |
| 1-Person Household | 403 (63.3%) | 234 (36.7%) |
| 2-Person Household | 346 (89.6%) | 40 (10.4%) |
| 3-Person Household | 107 (74.3%) | 37 (25.7%) |
| 4+ Person Household | 111 (70.7%) | 46 (29.3%) |
| Total Housing Units | 967 (73.0%) | 357 (27.0%) |
Occupancy by Educational Attainment in Superior
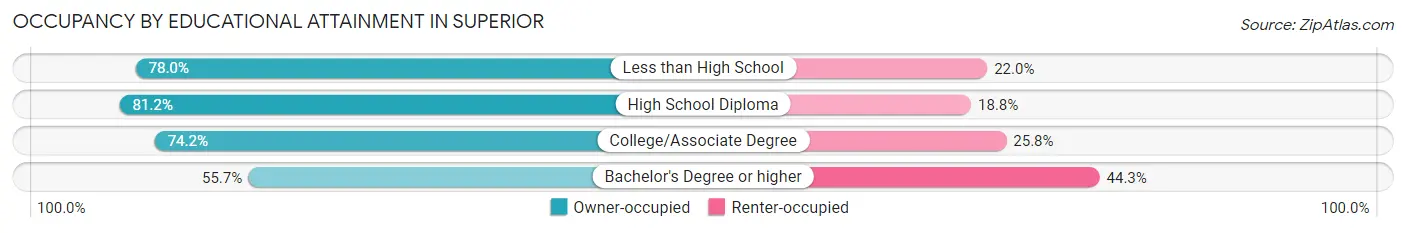
| Household Size | Owner-occupied | Renter-occupied |
| Less than High School | 85 (78.0%) | 24 (22.0%) |
| High School Diploma | 453 (81.2%) | 105 (18.8%) |
| College/Associate Degree | 253 (74.2%) | 88 (25.8%) |
| Bachelor's Degree or higher | 176 (55.7%) | 140 (44.3%) |
Occupancy by Age of Householder in Superior
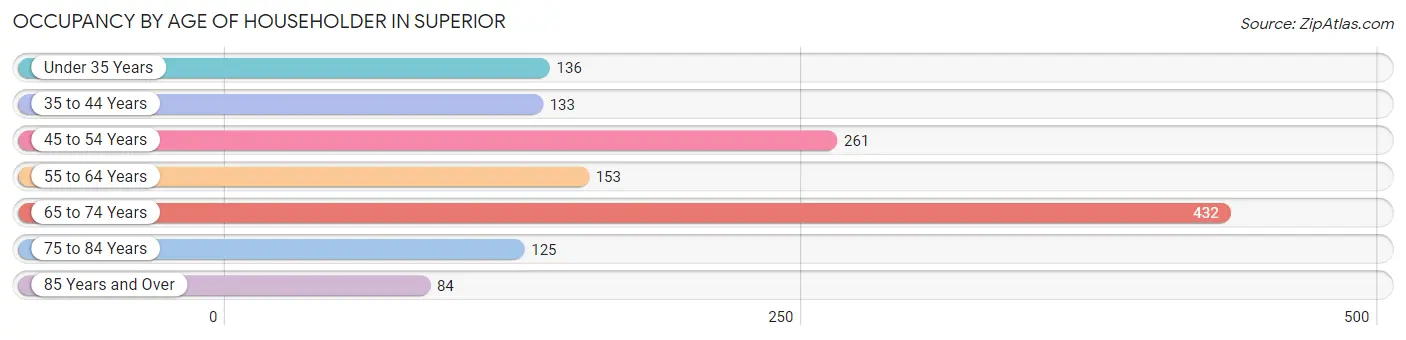
| Age Bracket | # Households | % Households |
| Under 35 Years | 136 | 10.3% |
| 35 to 44 Years | 133 | 10.1% |
| 45 to 54 Years | 261 | 19.7% |
| 55 to 64 Years | 153 | 11.6% |
| 65 to 74 Years | 432 | 32.6% |
| 75 to 84 Years | 125 | 9.4% |
| 85 Years and Over | 84 | 6.3% |
| Total | 1,324 | 100.0% |
Housing Finances in Superior
Median Income by Occupancy in Superior
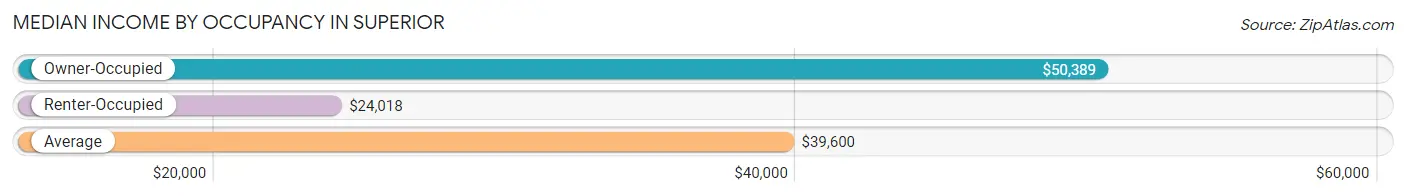
| Occupancy Type | # Households | Median Income |
| Owner-Occupied | 967 (73.0%) | $50,389 |
| Renter-Occupied | 357 (27.0%) | $24,018 |
| Average | 1,324 (100.0%) | $39,600 |
Occupancy by Householder Income Bracket in Superior
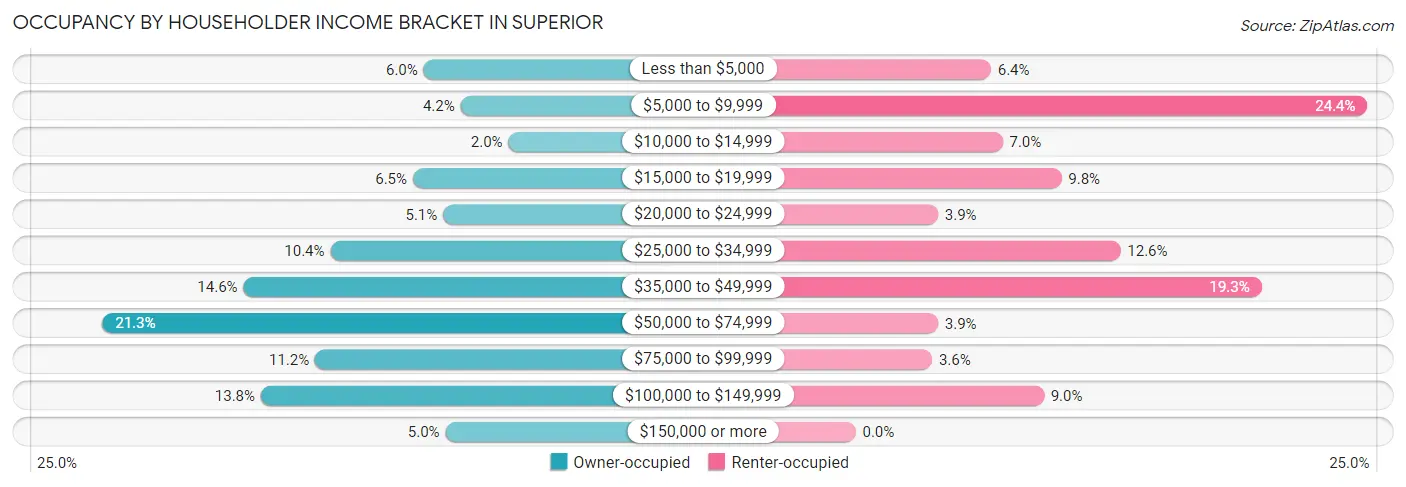
| Income Bracket | Owner-occupied | Renter-occupied |
| Less than $5,000 | 58 (6.0%) | 23 (6.4%) |
| $5,000 to $9,999 | 41 (4.2%) | 87 (24.4%) |
| $10,000 to $14,999 | 19 (2.0%) | 25 (7.0%) |
| $15,000 to $19,999 | 63 (6.5%) | 35 (9.8%) |
| $20,000 to $24,999 | 49 (5.1%) | 14 (3.9%) |
| $25,000 to $34,999 | 101 (10.4%) | 45 (12.6%) |
| $35,000 to $49,999 | 141 (14.6%) | 69 (19.3%) |
| $50,000 to $74,999 | 206 (21.3%) | 14 (3.9%) |
| $75,000 to $99,999 | 108 (11.2%) | 13 (3.6%) |
| $100,000 to $149,999 | 133 (13.8%) | 32 (9.0%) |
| $150,000 or more | 48 (5.0%) | 0 (0.0%) |
| Total | 967 (100.0%) | 357 (100.0%) |
Monthly Housing Cost Tiers in Superior
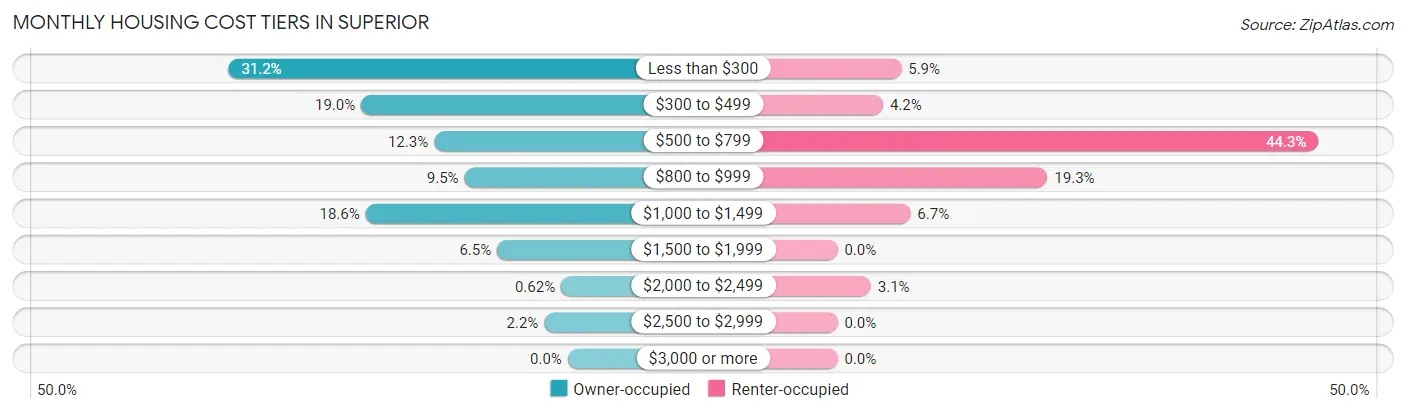
| Monthly Cost | Owner-occupied | Renter-occupied |
| Less than $300 | 302 (31.2%) | 21 (5.9%) |
| $300 to $499 | 184 (19.0%) | 15 (4.2%) |
| $500 to $799 | 119 (12.3%) | 158 (44.3%) |
| $800 to $999 | 92 (9.5%) | 69 (19.3%) |
| $1,000 to $1,499 | 180 (18.6%) | 24 (6.7%) |
| $1,500 to $1,999 | 63 (6.5%) | 0 (0.0%) |
| $2,000 to $2,499 | 6 (0.6%) | 11 (3.1%) |
| $2,500 to $2,999 | 21 (2.2%) | 0 (0.0%) |
| $3,000 or more | 0 (0.0%) | 0 (0.0%) |
| Total | 967 (100.0%) | 357 (100.0%) |
Physical Housing Characteristics in Superior
Housing Structures in Superior
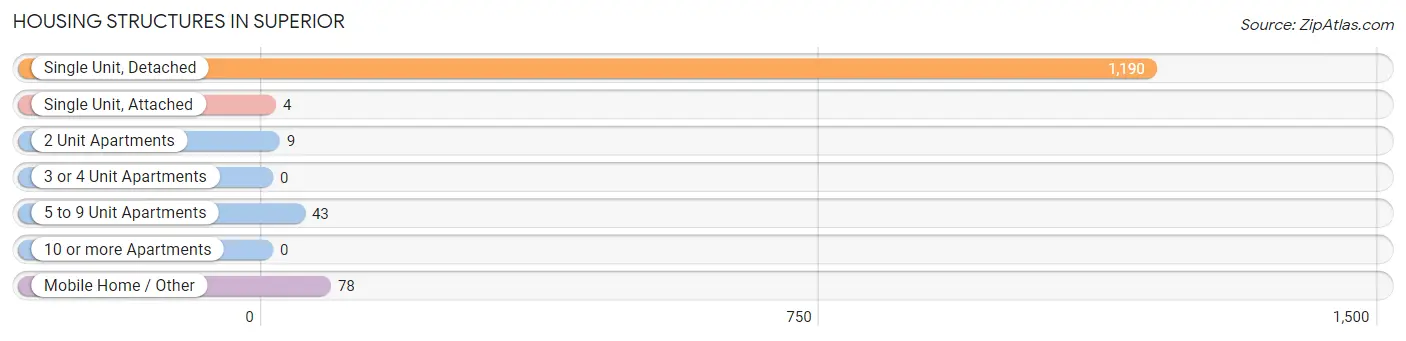
| Structure Type | # Housing Units | % Housing Units |
| Single Unit, Detached | 1,190 | 89.9% |
| Single Unit, Attached | 4 | 0.3% |
| 2 Unit Apartments | 9 | 0.7% |
| 3 or 4 Unit Apartments | 0 | 0.0% |
| 5 to 9 Unit Apartments | 43 | 3.3% |
| 10 or more Apartments | 0 | 0.0% |
| Mobile Home / Other | 78 | 5.9% |
| Total | 1,324 | 100.0% |
Housing Structures by Occupancy in Superior
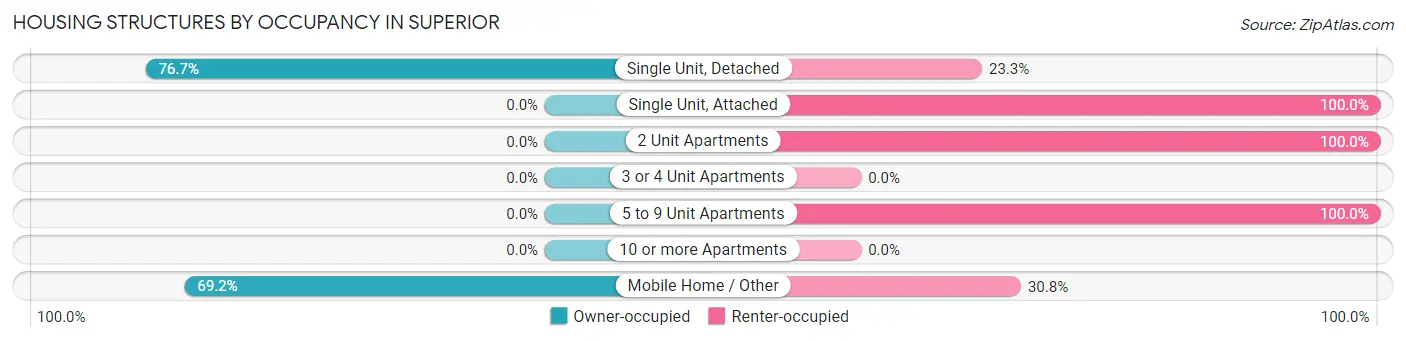
| Structure Type | Owner-occupied | Renter-occupied |
| Single Unit, Detached | 913 (76.7%) | 277 (23.3%) |
| Single Unit, Attached | 0 (0.0%) | 4 (100.0%) |
| 2 Unit Apartments | 0 (0.0%) | 9 (100.0%) |
| 3 or 4 Unit Apartments | 0 (0.0%) | 0 (0.0%) |
| 5 to 9 Unit Apartments | 0 (0.0%) | 43 (100.0%) |
| 10 or more Apartments | 0 (0.0%) | 0 (0.0%) |
| Mobile Home / Other | 54 (69.2%) | 24 (30.8%) |
| Total | 967 (73.0%) | 357 (27.0%) |
Housing Structures by Number of Rooms in Superior

| Number of Rooms | Owner-occupied | Renter-occupied |
| 1 Room | 0 (0.0%) | 0 (0.0%) |
| 2 or 3 Rooms | 67 (6.9%) | 55 (15.4%) |
| 4 or 5 Rooms | 319 (33.0%) | 229 (64.1%) |
| 6 or 7 Rooms | 433 (44.8%) | 59 (16.5%) |
| 8 or more Rooms | 148 (15.3%) | 14 (3.9%) |
| Total | 967 (100.0%) | 357 (100.0%) |
Housing Structure by Heating Type in Superior
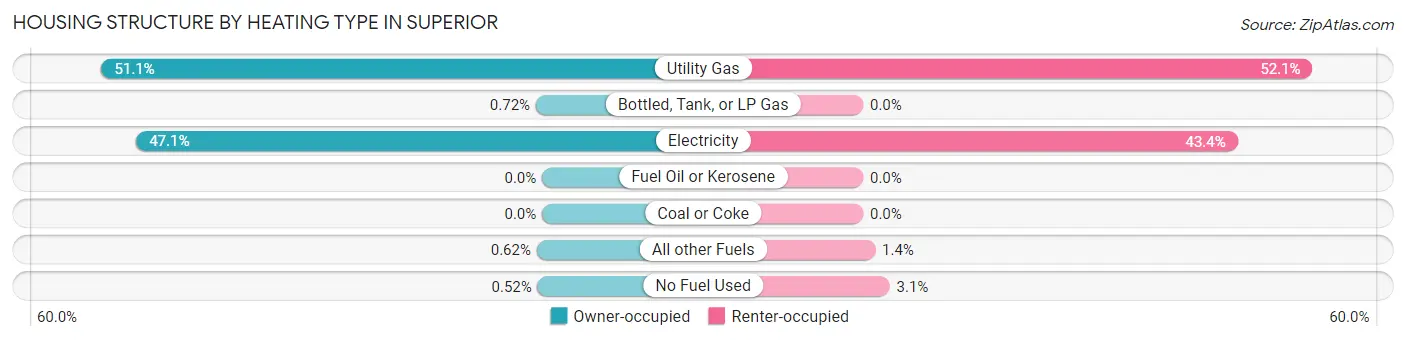
| Heating Type | Owner-occupied | Renter-occupied |
| Utility Gas | 494 (51.1%) | 186 (52.1%) |
| Bottled, Tank, or LP Gas | 7 (0.7%) | 0 (0.0%) |
| Electricity | 455 (47.0%) | 155 (43.4%) |
| Fuel Oil or Kerosene | 0 (0.0%) | 0 (0.0%) |
| Coal or Coke | 0 (0.0%) | 0 (0.0%) |
| All other Fuels | 6 (0.6%) | 5 (1.4%) |
| No Fuel Used | 5 (0.5%) | 11 (3.1%) |
| Total | 967 (100.0%) | 357 (100.0%) |
Household Vehicle Usage in Superior
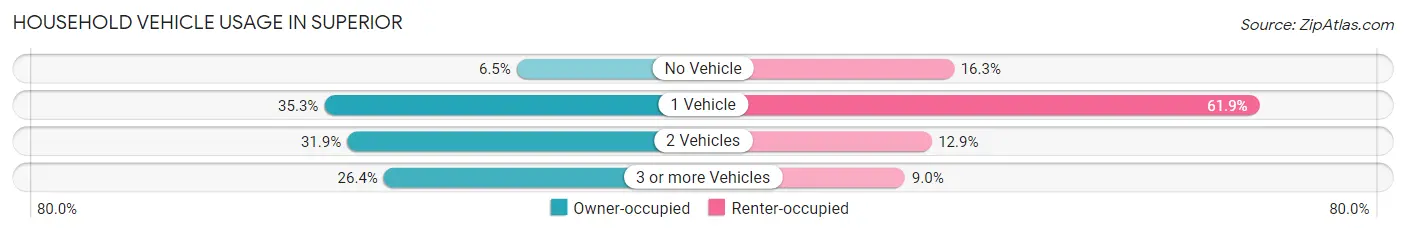
| Vehicles per Household | Owner-occupied | Renter-occupied |
| No Vehicle | 63 (6.5%) | 58 (16.3%) |
| 1 Vehicle | 341 (35.3%) | 221 (61.9%) |
| 2 Vehicles | 308 (31.9%) | 46 (12.9%) |
| 3 or more Vehicles | 255 (26.4%) | 32 (9.0%) |
| Total | 967 (100.0%) | 357 (100.0%) |
Real Estate & Mortgages in Superior
Real Estate and Mortgage Overview in Superior
| Characteristic | Without Mortgage | With Mortgage |
| Housing Units | 552 | 415 |
| Median Property Value | $100,700 | $148,400 |
| Median Household Income | $38,715 | $27 |
| Monthly Housing Costs | $289 | $0 |
| Real Estate Taxes | $471 | $5 |
Property Value by Mortgage Status in Superior
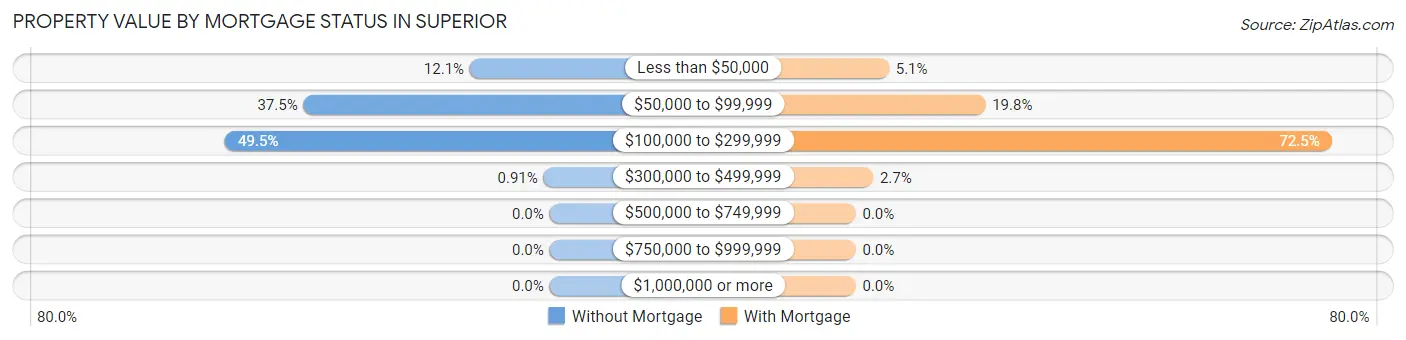
| Property Value | Without Mortgage | With Mortgage |
| Less than $50,000 | 67 (12.1%) | 21 (5.1%) |
| $50,000 to $99,999 | 207 (37.5%) | 82 (19.8%) |
| $100,000 to $299,999 | 273 (49.5%) | 301 (72.5%) |
| $300,000 to $499,999 | 5 (0.9%) | 11 (2.6%) |
| $500,000 to $749,999 | 0 (0.0%) | 0 (0.0%) |
| $750,000 to $999,999 | 0 (0.0%) | 0 (0.0%) |
| $1,000,000 or more | 0 (0.0%) | 0 (0.0%) |
| Total | 552 (100.0%) | 415 (100.0%) |
Household Income by Mortgage Status in Superior
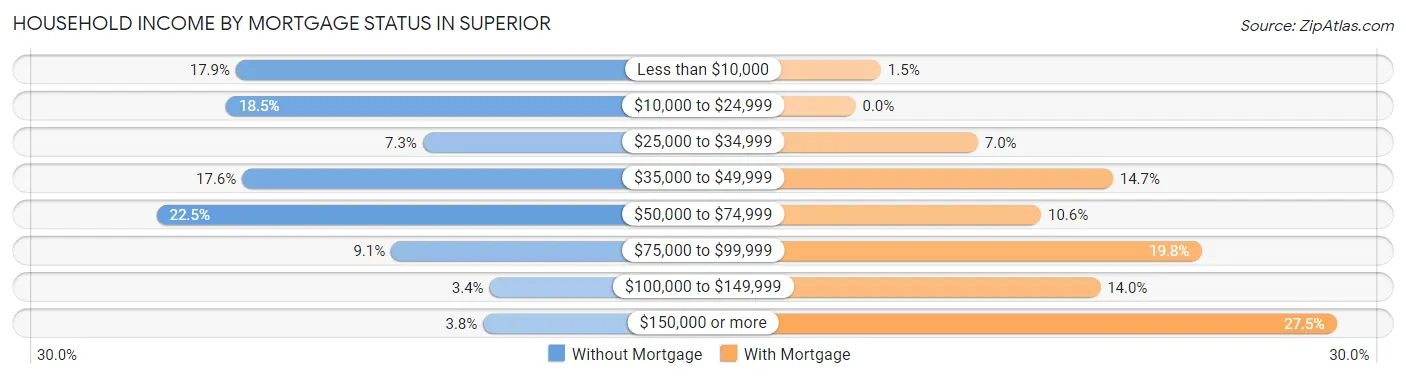
| Household Income | Without Mortgage | With Mortgage |
| Less than $10,000 | 99 (17.9%) | 6 (1.5%) |
| $10,000 to $24,999 | 102 (18.5%) | 0 (0.0%) |
| $25,000 to $34,999 | 40 (7.2%) | 29 (7.0%) |
| $35,000 to $49,999 | 97 (17.6%) | 61 (14.7%) |
| $50,000 to $74,999 | 124 (22.5%) | 44 (10.6%) |
| $75,000 to $99,999 | 50 (9.1%) | 82 (19.8%) |
| $100,000 to $149,999 | 19 (3.4%) | 58 (14.0%) |
| $150,000 or more | 21 (3.8%) | 114 (27.5%) |
| Total | 552 (100.0%) | 415 (100.0%) |
Property Value to Household Income Ratio in Superior
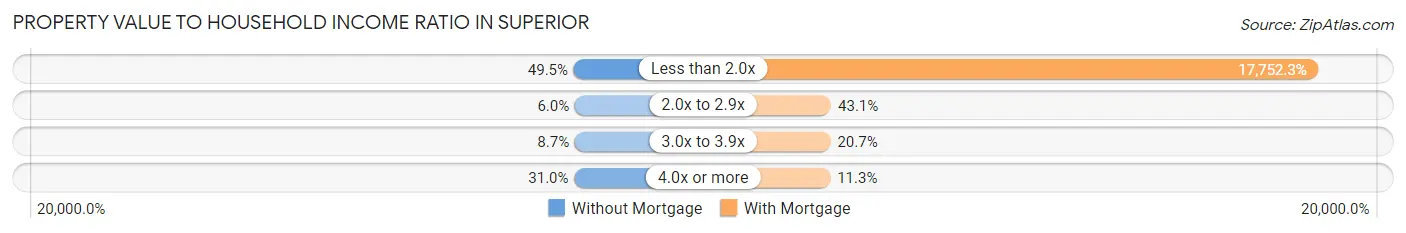
| Value-to-Income Ratio | Without Mortgage | With Mortgage |
| Less than 2.0x | 273 (49.5%) | 73,672 (17,752.3%) |
| 2.0x to 2.9x | 33 (6.0%) | 179 (43.1%) |
| 3.0x to 3.9x | 48 (8.7%) | 86 (20.7%) |
| 4.0x or more | 171 (31.0%) | 47 (11.3%) |
| Total | 552 (100.0%) | 415 (100.0%) |
Real Estate Taxes by Mortgage Status in Superior
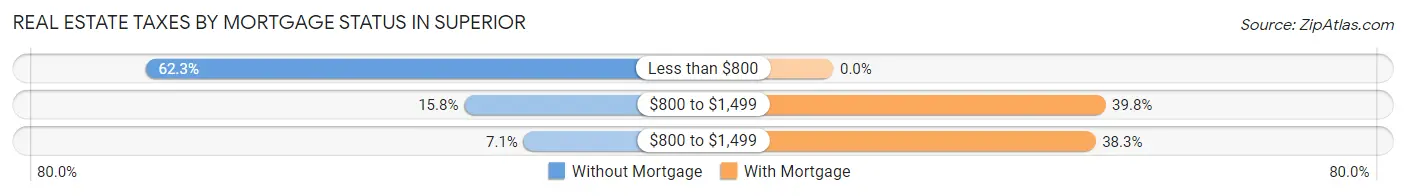
| Property Taxes | Without Mortgage | With Mortgage |
| Less than $800 | 344 (62.3%) | 0 (0.0%) |
| $800 to $1,499 | 87 (15.8%) | 165 (39.8%) |
| $800 to $1,499 | 39 (7.1%) | 159 (38.3%) |
| Total | 552 (100.0%) | 415 (100.0%) |
Health & Disability in Superior
Health Insurance Coverage by Age in Superior
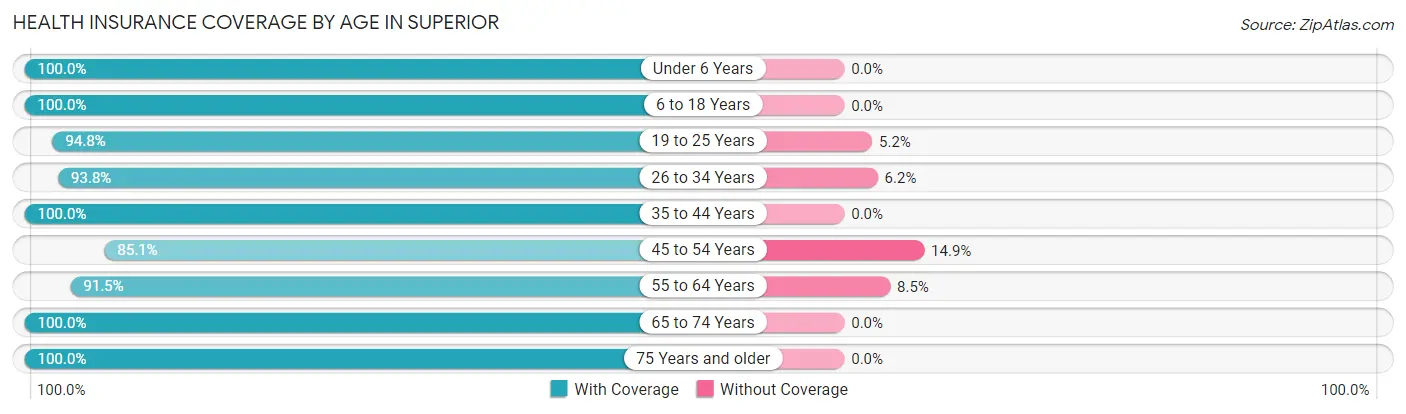
| Age Bracket | With Coverage | Without Coverage |
| Under 6 Years | 64 (100.0%) | 0 (0.0%) |
| 6 to 18 Years | 273 (100.0%) | 0 (0.0%) |
| 19 to 25 Years | 146 (94.8%) | 8 (5.2%) |
| 26 to 34 Years | 211 (93.8%) | 14 (6.2%) |
| 35 to 44 Years | 338 (100.0%) | 0 (0.0%) |
| 45 to 54 Years | 280 (85.1%) | 49 (14.9%) |
| 55 to 64 Years | 300 (91.5%) | 28 (8.5%) |
| 65 to 74 Years | 607 (100.0%) | 0 (0.0%) |
| 75 Years and older | 321 (100.0%) | 0 (0.0%) |
| Total | 2,540 (96.3%) | 99 (3.7%) |
Health Insurance Coverage by Citizenship Status in Superior
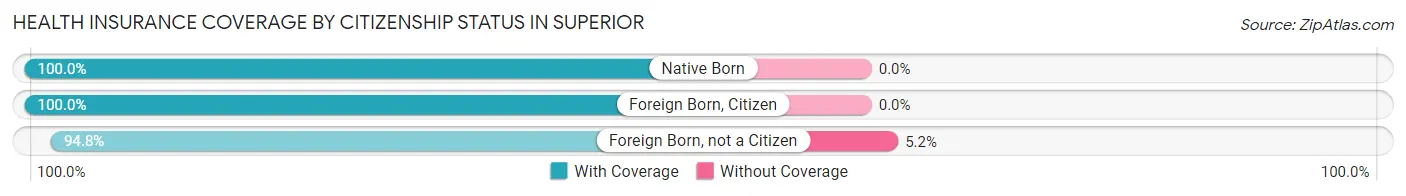
| Citizenship Status | With Coverage | Without Coverage |
| Native Born | 64 (100.0%) | 0 (0.0%) |
| Foreign Born, Citizen | 273 (100.0%) | 0 (0.0%) |
| Foreign Born, not a Citizen | 146 (94.8%) | 8 (5.2%) |
Health Insurance Coverage by Household Income in Superior
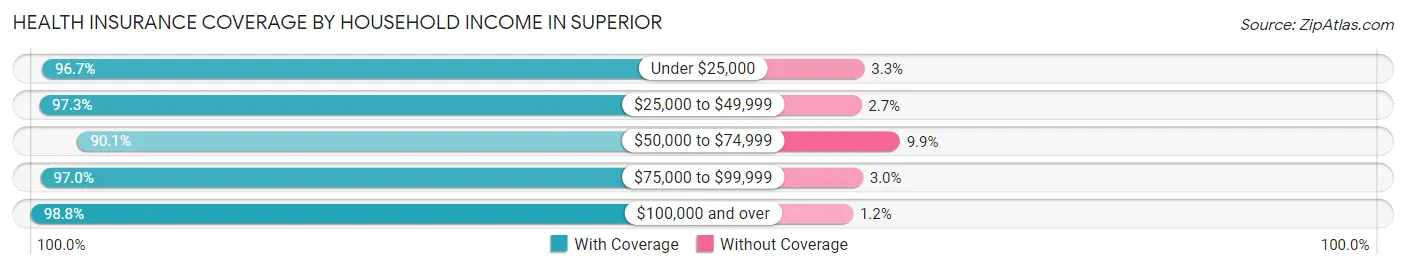
| Household Income | With Coverage | Without Coverage |
| Under $25,000 | 500 (96.7%) | 17 (3.3%) |
| $25,000 to $49,999 | 608 (97.3%) | 17 (2.7%) |
| $50,000 to $74,999 | 427 (90.1%) | 47 (9.9%) |
| $75,000 to $99,999 | 323 (97.0%) | 10 (3.0%) |
| $100,000 and over | 682 (98.8%) | 8 (1.2%) |
Public vs Private Health Insurance Coverage by Age in Superior
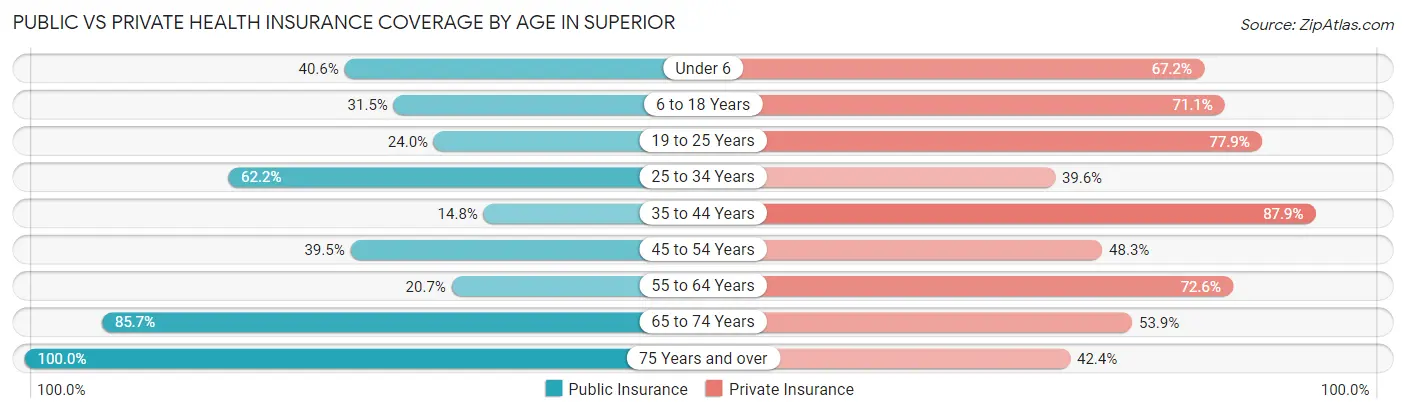
| Age Bracket | Public Insurance | Private Insurance |
| Under 6 | 26 (40.6%) | 43 (67.2%) |
| 6 to 18 Years | 86 (31.5%) | 194 (71.1%) |
| 19 to 25 Years | 37 (24.0%) | 120 (77.9%) |
| 25 to 34 Years | 140 (62.2%) | 89 (39.6%) |
| 35 to 44 Years | 50 (14.8%) | 297 (87.9%) |
| 45 to 54 Years | 130 (39.5%) | 159 (48.3%) |
| 55 to 64 Years | 68 (20.7%) | 238 (72.6%) |
| 65 to 74 Years | 520 (85.7%) | 327 (53.9%) |
| 75 Years and over | 321 (100.0%) | 136 (42.4%) |
| Total | 1,378 (52.2%) | 1,603 (60.7%) |
Disability Status by Sex by Age in Superior
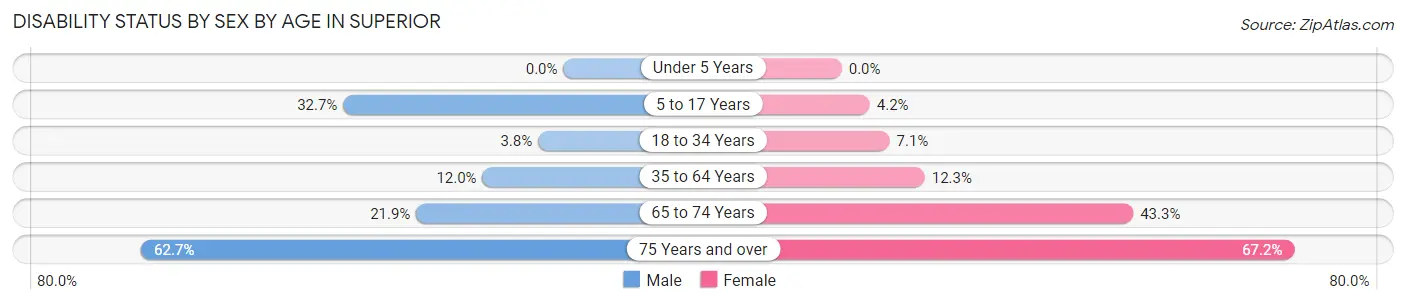
| Age Bracket | Male | Female |
| Under 5 Years | 0 (0.0%) | 0 (0.0%) |
| 5 to 17 Years | 34 (32.7%) | 5 (4.2%) |
| 18 to 34 Years | 10 (3.8%) | 12 (7.1%) |
| 35 to 64 Years | 65 (12.0%) | 56 (12.3%) |
| 65 to 74 Years | 66 (21.8%) | 132 (43.3%) |
| 75 Years and over | 37 (62.7%) | 176 (67.2%) |
Disability Class by Sex by Age in Superior
Disability Class: Hearing Difficulty
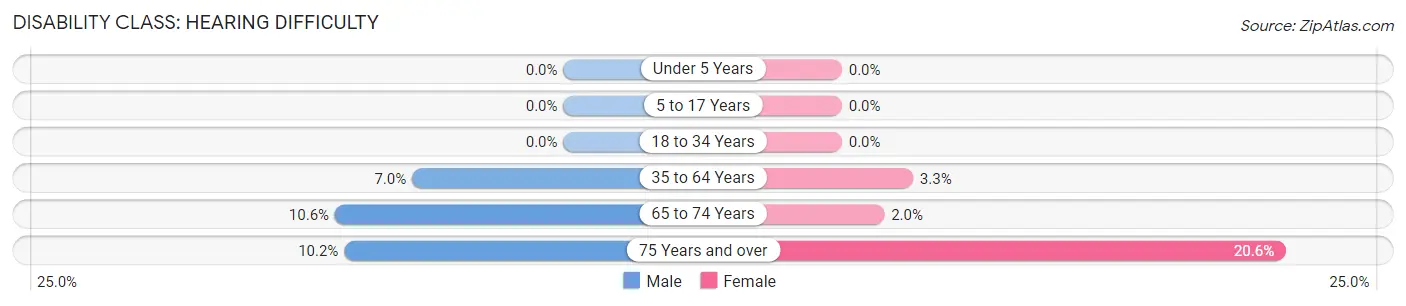
| Age Bracket | Male | Female |
| Under 5 Years | 0 (0.0%) | 0 (0.0%) |
| 5 to 17 Years | 0 (0.0%) | 0 (0.0%) |
| 18 to 34 Years | 0 (0.0%) | 0 (0.0%) |
| 35 to 64 Years | 38 (7.0%) | 15 (3.3%) |
| 65 to 74 Years | 32 (10.6%) | 6 (2.0%) |
| 75 Years and over | 6 (10.2%) | 54 (20.6%) |
Disability Class: Vision Difficulty
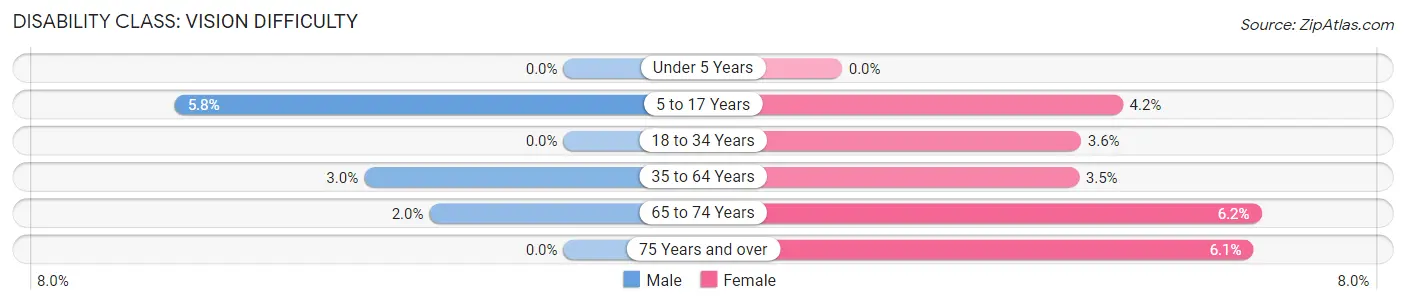
| Age Bracket | Male | Female |
| Under 5 Years | 0 (0.0%) | 0 (0.0%) |
| 5 to 17 Years | 6 (5.8%) | 5 (4.2%) |
| 18 to 34 Years | 0 (0.0%) | 6 (3.5%) |
| 35 to 64 Years | 16 (3.0%) | 16 (3.5%) |
| 65 to 74 Years | 6 (2.0%) | 19 (6.2%) |
| 75 Years and over | 0 (0.0%) | 16 (6.1%) |
Disability Class: Cognitive Difficulty
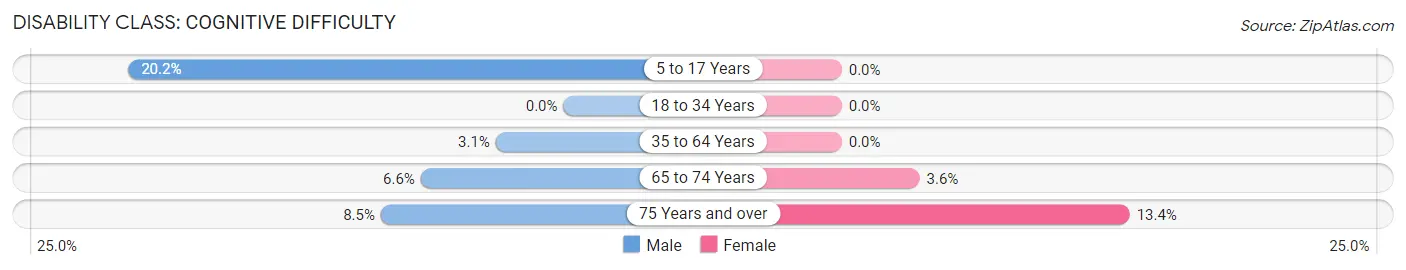
| Age Bracket | Male | Female |
| 5 to 17 Years | 21 (20.2%) | 0 (0.0%) |
| 18 to 34 Years | 0 (0.0%) | 0 (0.0%) |
| 35 to 64 Years | 17 (3.1%) | 0 (0.0%) |
| 65 to 74 Years | 20 (6.6%) | 11 (3.6%) |
| 75 Years and over | 5 (8.5%) | 35 (13.4%) |
Disability Class: Ambulatory Difficulty
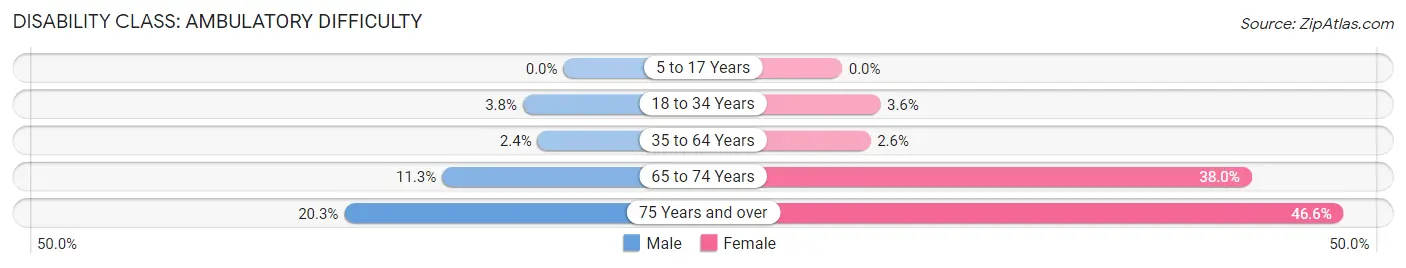
| Age Bracket | Male | Female |
| 5 to 17 Years | 0 (0.0%) | 0 (0.0%) |
| 18 to 34 Years | 10 (3.8%) | 6 (3.5%) |
| 35 to 64 Years | 13 (2.4%) | 12 (2.6%) |
| 65 to 74 Years | 34 (11.3%) | 116 (38.0%) |
| 75 Years and over | 12 (20.3%) | 122 (46.6%) |
Disability Class: Self-Care Difficulty
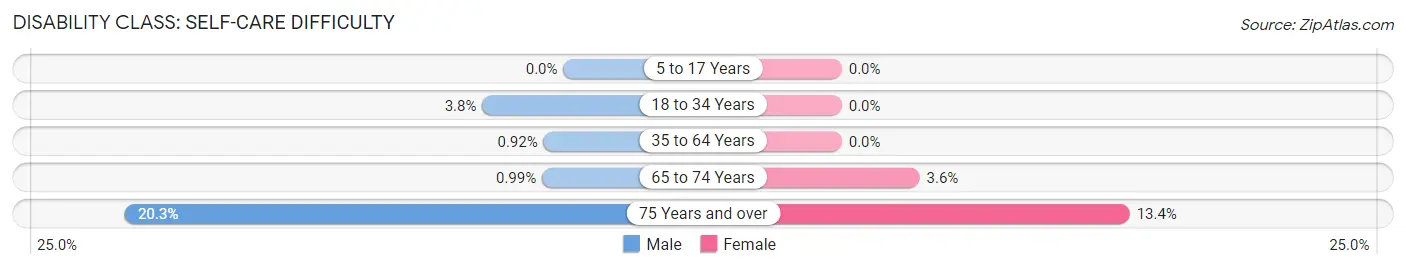
| Age Bracket | Male | Female |
| 5 to 17 Years | 0 (0.0%) | 0 (0.0%) |
| 18 to 34 Years | 10 (3.8%) | 0 (0.0%) |
| 35 to 64 Years | 5 (0.9%) | 0 (0.0%) |
| 65 to 74 Years | 3 (1.0%) | 11 (3.6%) |
| 75 Years and over | 12 (20.3%) | 35 (13.4%) |
Technology Access in Superior
Computing Device Access in Superior
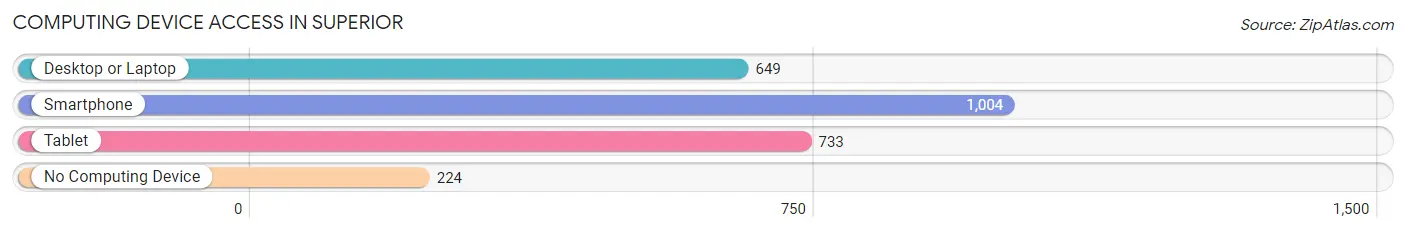
| Device Type | # Households | % Households |
| Desktop or Laptop | 649 | 49.0% |
| Smartphone | 1,004 | 75.8% |
| Tablet | 733 | 55.4% |
| No Computing Device | 224 | 16.9% |
| Total | 1,324 | 100.0% |
Internet Access in Superior
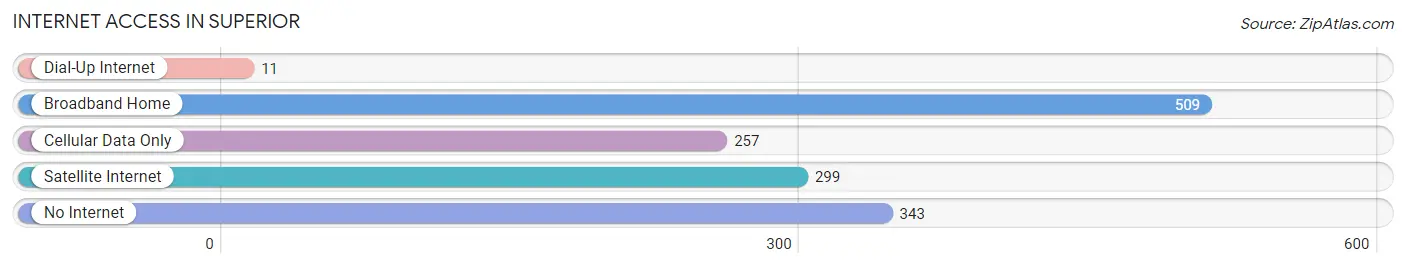
| Internet Type | # Households | % Households |
| Dial-Up Internet | 11 | 0.8% |
| Broadband Home | 509 | 38.4% |
| Cellular Data Only | 257 | 19.4% |
| Satellite Internet | 299 | 22.6% |
| No Internet | 343 | 25.9% |
| Total | 1,324 | 100.0% |
Superior Summary
History
Superior, Arizona is a small town located in the Pinal County of Arizona. It is situated in the Sonoran Desert, approximately 60 miles east of Phoenix. The town was founded in 1875 by a group of miners who were searching for silver and copper. The town was named after the nearby Superior Mine, which was the largest copper mine in the area.
The town was initially a mining camp, but it quickly grew into a small town. The population of Superior grew to over 1,000 people by the early 1900s. The town was home to several businesses, including a hotel, a general store, a saloon, and a post office.
The town experienced a boom in the 1920s, when the Magma Copper Company opened a large copper mine in the area. The mine provided jobs for many of the town’s residents, and the population of Superior grew to over 2,000 people.
The town experienced a decline in the 1950s, when the copper mine closed. The population of Superior dropped to just over 1,000 people. The town experienced a resurgence in the 1970s, when the copper mine reopened. The population of Superior has remained relatively stable since then, and it currently stands at around 2,500 people.
Geography
Superior is located in the Sonoran Desert, at an elevation of 2,400 feet. The town is situated in the foothills of the Superstition Mountains, which are located to the east of the town. The town is located approximately 60 miles east of Phoenix, and it is situated along the Apache Trail, which is a scenic highway that runs through the Superstition Mountains.
The climate in Superior is hot and dry, with temperatures ranging from the mid-90s in the summer to the mid-50s in the winter. The town receives an average of 8 inches of rain per year.
Economy
The economy of Superior is largely based on mining. The town is home to the Magma Copper Company, which operates a large copper mine in the area. The mine provides jobs for many of the town’s residents, and it is the largest employer in the area.
The town is also home to several small businesses, including restaurants, shops, and hotels. The town is also home to a small airport, which serves as a hub for private aircraft.
Demographics
The population of Superior is approximately 2,500 people. The town is predominantly white, with a small Hispanic population. The median household income in Superior is $41,000, and the median home value is $150,000. The town has a low unemployment rate, and the poverty rate is below the national average.
Common Questions
What is Per Capita Income in Superior?
Per Capita income in Superior is $27,509.
What is the Median Family Income in Superior?
Median Family Income in Superior is $69,474.
What is the Median Household income in Superior?
Median Household Income in Superior is $39,600.
What is Income or Wage Gap in Superior?
Income or Wage Gap in Superior is 23.4%.
Women in Superior earn 76.6 cents for every dollar earned by a man.
What is Inequality or Gini Index in Superior?
Inequality or Gini Index in Superior is 0.45.
What is the Total Population of Superior?
Total Population of Superior is 2,639.
What is the Total Male Population of Superior?
Total Male Population of Superior is 1,303.
What is the Total Female Population of Superior?
Total Female Population of Superior is 1,336.
What is the Ratio of Males per 100 Females in Superior?
There are 97.53 Males per 100 Females in Superior.
What is the Ratio of Females per 100 Males in Superior?
There are 102.53 Females per 100 Males in Superior.
What is the Median Population Age in Superior?
Median Population Age in Superior is 53.9 Years.
What is the Average Family Size in Superior
Average Family Size in Superior is 2.9 People.
What is the Average Household Size in Superior
Average Household Size in Superior is 2.0 People.
How Large is the Labor Force in Superior?
There are 1,176 People in the Labor Forcein in Superior.
What is the Percentage of People in the Labor Force in Superior?
48.8% of People are in the Labor Force in Superior.
What is the Unemployment Rate in Superior?
Unemployment Rate in Superior is 6.9%.