San Manuel, AZ Map & Demographics
San Manuel Map
San Manuel Overview
$24,772
PER CAPITA INCOME
$47,188
AVG FAMILY INCOME
$45,625
AVG HOUSEHOLD INCOME
48.2%
WAGE / INCOME GAP [ % ]
51.8¢/ $1
WAGE / INCOME GAP [ $ ]
0.36
INEQUALITY / GINI INDEX
3,535
TOTAL POPULATION
1,967
MALE POPULATION
1,568
FEMALE POPULATION
125.45
MALES / 100 FEMALES
79.72
FEMALES / 100 MALES
52.5
MEDIAN AGE
2.5
AVG FAMILY SIZE
2.2
AVG HOUSEHOLD SIZE
1,418
LABOR FORCE [ PEOPLE ]
46.1%
PERCENT IN LABOR FORCE
9.9%
UNEMPLOYMENT RATE
San Manuel Zip Codes
San Manuel Area Codes
Income in San Manuel
Income Overview in San Manuel
Per Capita Income in San Manuel is $24,772, while median incomes of families and households are $47,188 and $45,625 respectively.
| Characteristic | Number | Measure |
| Per Capita Income | 3,535 | $24,772 |
| Median Family Income | 1,042 | $47,188 |
| Mean Family Income | 1,042 | $51,419 |
| Median Household Income | 1,626 | $45,625 |
| Mean Household Income | 1,626 | $54,354 |
| Income Deficit | 1,042 | $0 |
| Wage / Income Gap (%) | 3,535 | 48.18% |
| Wage / Income Gap ($) | 3,535 | 51.82¢ per $1 |
| Gini / Inequality Index | 3,535 | 0.36 |
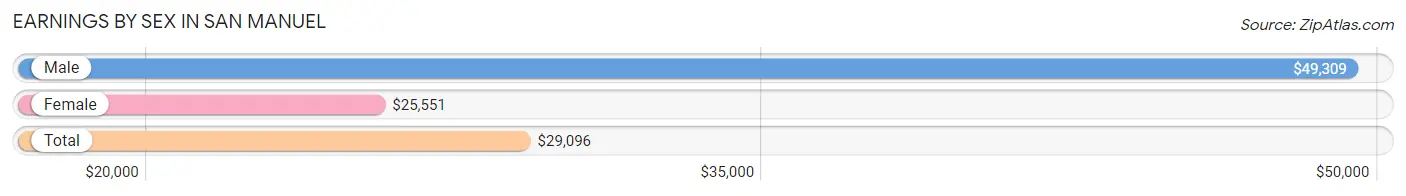
Earnings by Sex in San Manuel
Average Earnings in San Manuel are $29,096, $49,309 for men and $25,551 for women, a difference of 48.2%.
| Sex | Number | Average Earnings |
| Male | 825 (57.7%) | $49,309 |
| Female | 606 (42.3%) | $25,551 |
| Total | 1,431 (100.0%) | $29,096 |
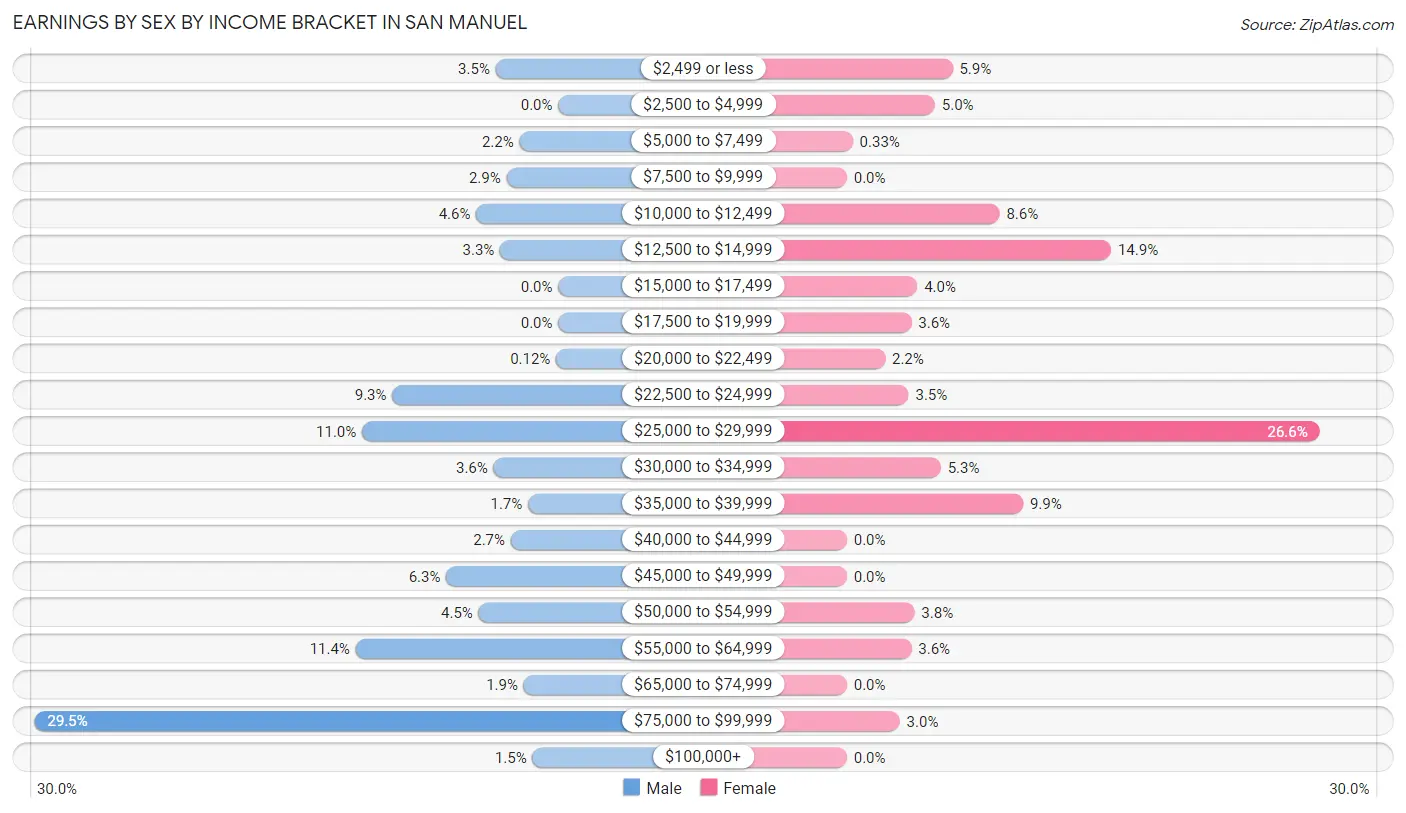
Earnings by Sex by Income Bracket in San Manuel
The most common earnings brackets in San Manuel are $75,000 to $99,999 for men (243 | 29.4%) and $25,000 to $29,999 for women (161 | 26.6%).
| Income | Male | Female |
| $2,499 or less | 29 (3.5%) | 36 (5.9%) |
| $2,500 to $4,999 | 0 (0.0%) | 30 (5.0%) |
| $5,000 to $7,499 | 18 (2.2%) | 2 (0.3%) |
| $7,500 to $9,999 | 24 (2.9%) | 0 (0.0%) |
| $10,000 to $12,499 | 38 (4.6%) | 52 (8.6%) |
| $12,500 to $14,999 | 27 (3.3%) | 90 (14.8%) |
| $15,000 to $17,499 | 0 (0.0%) | 24 (4.0%) |
| $17,500 to $19,999 | 0 (0.0%) | 22 (3.6%) |
| $20,000 to $22,499 | 1 (0.1%) | 13 (2.1%) |
| $22,500 to $24,999 | 77 (9.3%) | 21 (3.5%) |
| $25,000 to $29,999 | 91 (11.0%) | 161 (26.6%) |
| $30,000 to $34,999 | 30 (3.6%) | 32 (5.3%) |
| $35,000 to $39,999 | 14 (1.7%) | 60 (9.9%) |
| $40,000 to $44,999 | 22 (2.7%) | 0 (0.0%) |
| $45,000 to $49,999 | 52 (6.3%) | 0 (0.0%) |
| $50,000 to $54,999 | 37 (4.5%) | 23 (3.8%) |
| $55,000 to $64,999 | 94 (11.4%) | 22 (3.6%) |
| $65,000 to $74,999 | 16 (1.9%) | 0 (0.0%) |
| $75,000 to $99,999 | 243 (29.4%) | 18 (3.0%) |
| $100,000+ | 12 (1.5%) | 0 (0.0%) |
| Total | 825 (100.0%) | 606 (100.0%) |
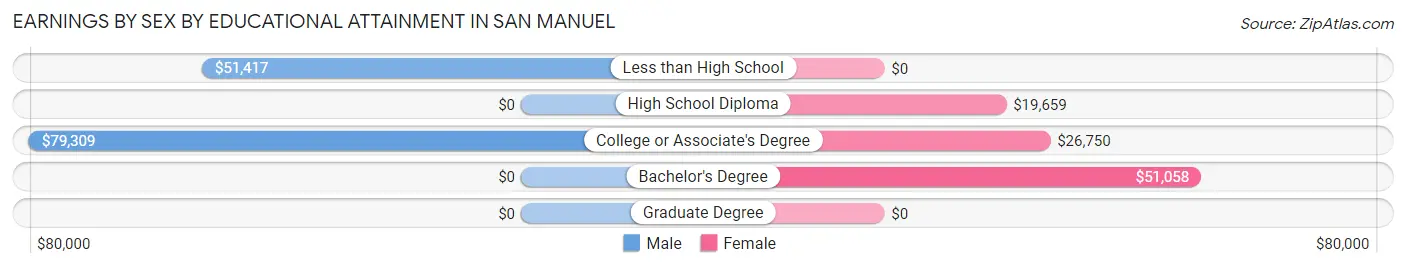
Earnings by Sex by Educational Attainment in San Manuel
Average earnings in San Manuel are $50,676 for men and $26,377 for women, a difference of 47.9%. Men with an educational attainment of college or associate's degree enjoy the highest average annual earnings of $79,309, while those with less than high school education earn the least with $51,417. Women with an educational attainment of bachelor's degree earn the most with the average annual earnings of $51,058, while those with high school diploma education have the smallest earnings of $19,659.
| Educational Attainment | Male Income | Female Income |
| Less than High School | $51,417 | $0 |
| High School Diploma | - | - |
| College or Associate's Degree | $79,309 | $26,750 |
| Bachelor's Degree | - | - |
| Graduate Degree | - | - |
| Total | $50,676 | $26,377 |
Family Income in San Manuel
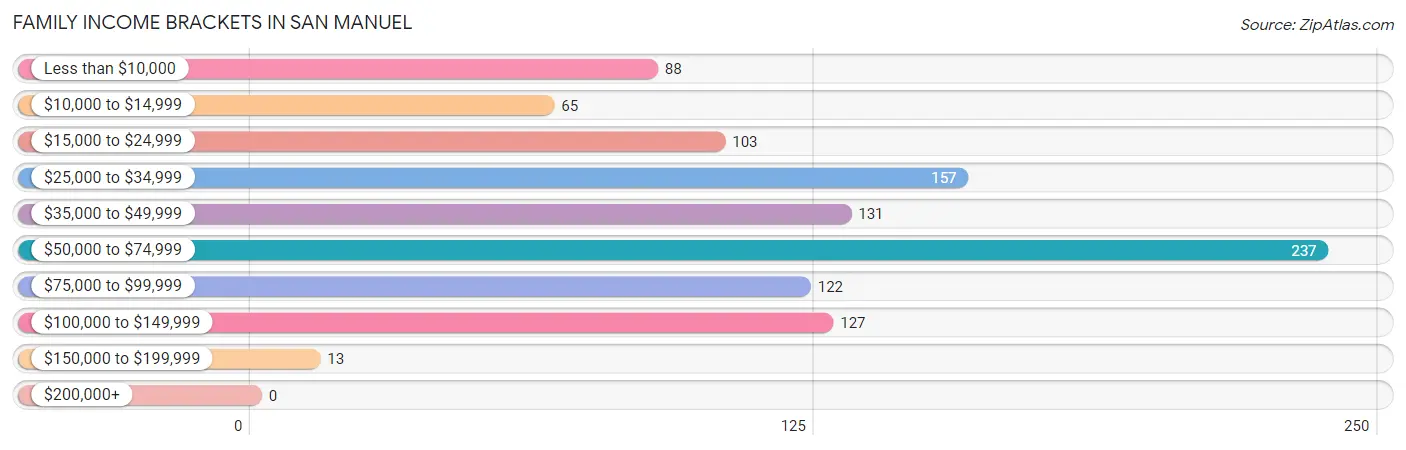
Family Income Brackets in San Manuel
According to the San Manuel family income data, there are 237 families falling into the $50,000 to $74,999 income range, which is the most common income bracket and makes up 22.7% of all families.
| Income Bracket | # Families | % Families |
| Less than $10,000 | 88 | 8.4% |
| $10,000 to $14,999 | 65 | 6.2% |
| $15,000 to $24,999 | 103 | 9.9% |
| $25,000 to $34,999 | 157 | 15.1% |
| $35,000 to $49,999 | 131 | 12.6% |
| $50,000 to $74,999 | 237 | 22.7% |
| $75,000 to $99,999 | 122 | 11.7% |
| $100,000 to $149,999 | 127 | 12.2% |
| $150,000 to $199,999 | 13 | 1.2% |
| $200,000+ | 0 | 0.0% |
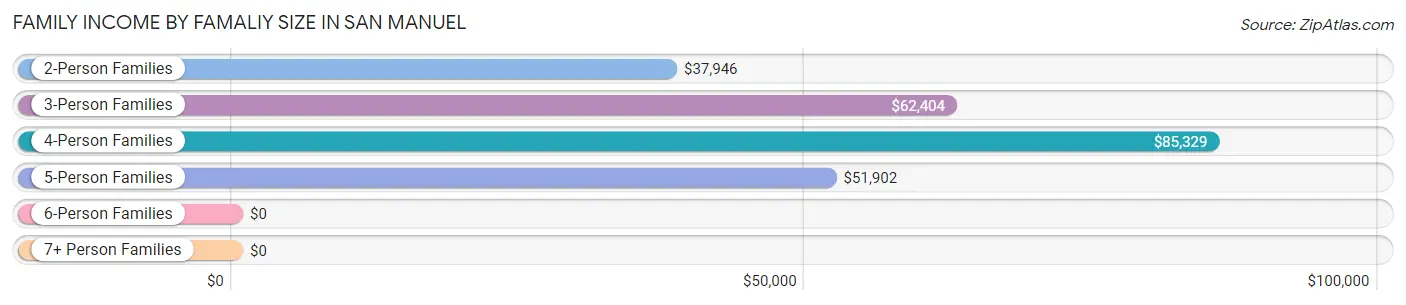
Family Income by Famaliy Size in San Manuel
4-person families (33 | 3.2%) account for the highest median family income in San Manuel with $85,329 per family, while 4-person families (33 | 3.2%) have the highest median income of $21,332 per family member.
| Income Bracket | # Families | Median Income |
| 2-Person Families | 710 (68.1%) | $37,946 |
| 3-Person Families | 203 (19.5%) | $62,404 |
| 4-Person Families | 33 (3.2%) | $85,329 |
| 5-Person Families | 61 (5.9%) | $51,902 |
| 6-Person Families | 33 (3.2%) | $0 |
| 7+ Person Families | 2 (0.2%) | $0 |
| Total | 1,042 (100.0%) | $47,188 |
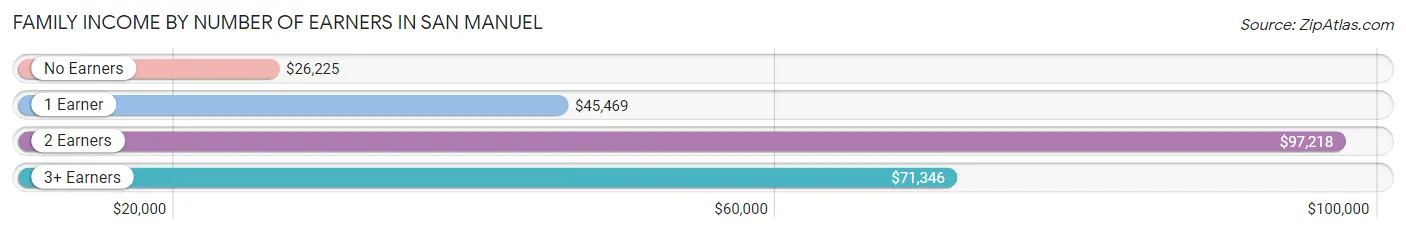
Family Income by Number of Earners in San Manuel
The median family income in San Manuel is $47,188, with families comprising 2 earners (217) having the highest median family income of $97,218, while families with no earners (398) have the lowest median family income of $26,225, accounting for 20.8% and 38.2% of families, respectively.
| Number of Earners | # Families | Median Income |
| No Earners | 398 (38.2%) | $26,225 |
| 1 Earner | 353 (33.9%) | $45,469 |
| 2 Earners | 217 (20.8%) | $97,218 |
| 3+ Earners | 74 (7.1%) | $71,346 |
| Total | 1,042 (100.0%) | $47,188 |
Household Income in San Manuel
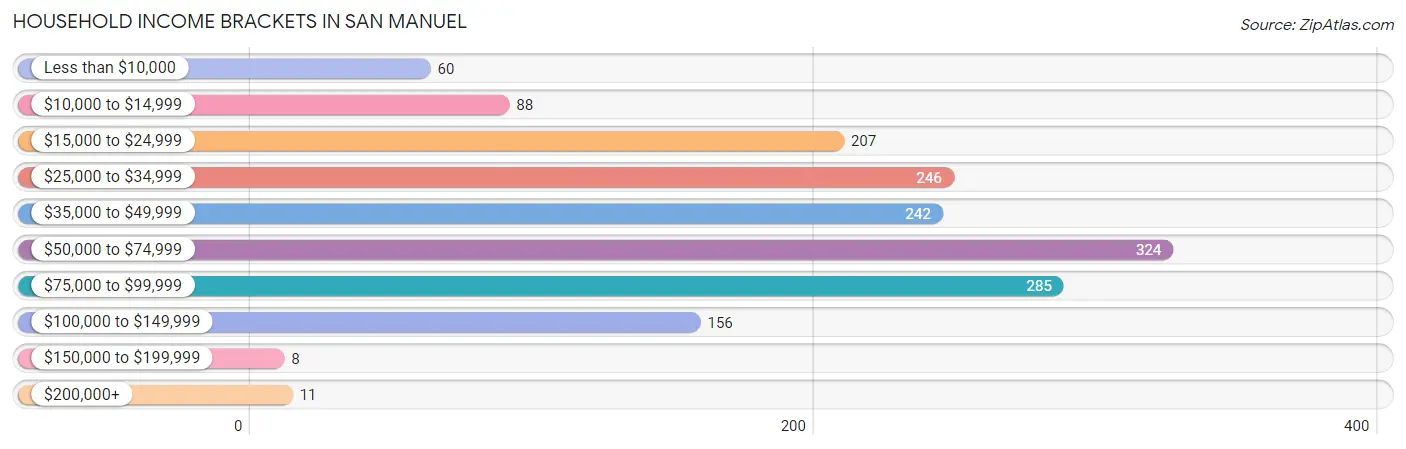
Household Income Brackets in San Manuel
With 324 households falling in the category, the $50,000 to $74,999 income range is the most frequent in San Manuel, accounting for 19.9% of all households. In contrast, only 8 households (0.5%) fall into the $150,000 to $199,999 income bracket, making it the least populous group.
| Income Bracket | # Households | % Households |
| Less than $10,000 | 60 | 3.7% |
| $10,000 to $14,999 | 88 | 5.4% |
| $15,000 to $24,999 | 207 | 12.7% |
| $25,000 to $34,999 | 246 | 15.1% |
| $35,000 to $49,999 | 242 | 14.9% |
| $50,000 to $74,999 | 324 | 19.9% |
| $75,000 to $99,999 | 285 | 17.5% |
| $100,000 to $149,999 | 156 | 9.6% |
| $150,000 to $199,999 | 8 | 0.5% |
| $200,000+ | 11 | 0.7% |
Household Income by Householder Age in San Manuel
The median household income in San Manuel is $45,625, with the highest median household income of $61,627 found in the 45 to 64 years age bracket for the primary householder. A total of 729 households (44.8%) fall into this category. Meanwhile, the 15 to 24 years age bracket for the primary householder has the lowest median household income of $0, with 51 households (3.1%) in this group.
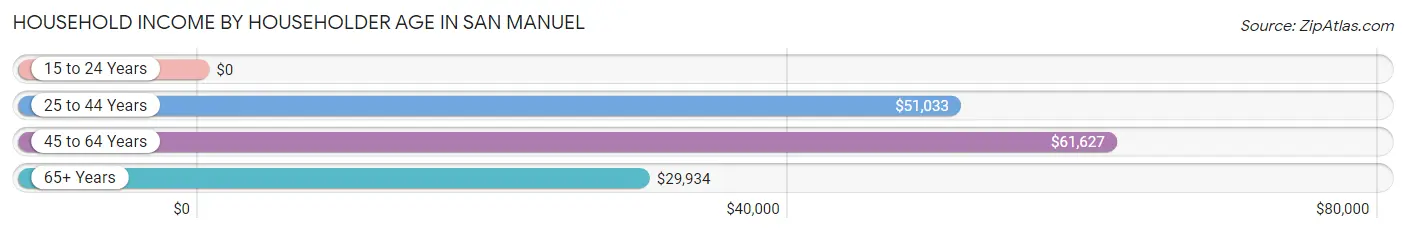
| Income Bracket | # Households | Median Income |
| 15 to 24 Years | 51 (3.1%) | $0 |
| 25 to 44 Years | 201 (12.4%) | $51,033 |
| 45 to 64 Years | 729 (44.8%) | $61,627 |
| 65+ Years | 645 (39.7%) | $29,934 |
| Total | 1,626 (100.0%) | $45,625 |
Poverty in San Manuel
Income Below Poverty by Sex and Age in San Manuel
With 19.7% poverty level for males and 23.4% for females among the residents of San Manuel, 18 to 24 year old males and 45 to 54 year old females are the most vulnerable to poverty, with 86 males (71.1%) and 110 females (67.9%) in their respective age groups living below the poverty level.
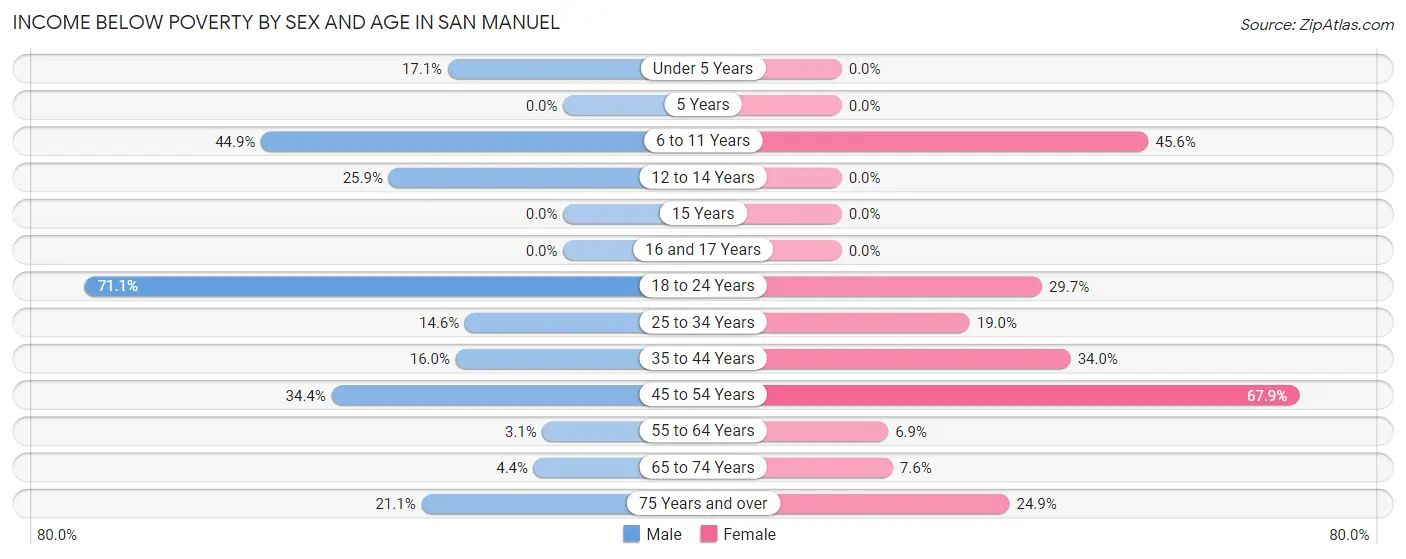
| Age Bracket | Male | Female |
| Under 5 Years | 12 (17.1%) | 0 (0.0%) |
| 5 Years | 0 (0.0%) | 0 (0.0%) |
| 6 to 11 Years | 48 (44.9%) | 41 (45.6%) |
| 12 to 14 Years | 14 (25.9%) | 0 (0.0%) |
| 15 Years | 0 (0.0%) | 0 (0.0%) |
| 16 and 17 Years | 0 (0.0%) | 0 (0.0%) |
| 18 to 24 Years | 86 (71.1%) | 33 (29.7%) |
| 25 to 34 Years | 41 (14.6%) | 27 (19.0%) |
| 35 to 44 Years | 19 (16.0%) | 52 (34.0%) |
| 45 to 54 Years | 85 (34.4%) | 110 (67.9%) |
| 55 to 64 Years | 12 (3.1%) | 25 (6.9%) |
| 65 to 74 Years | 11 (4.4%) | 11 (7.6%) |
| 75 Years and over | 59 (21.1%) | 68 (24.9%) |
| Total | 387 (19.7%) | 367 (23.4%) |
Income Above Poverty by Sex and Age in San Manuel
According to the poverty statistics in San Manuel, males aged 5 years and females aged under 5 years are the age groups that are most secure financially, with 100.0% of males and 100.0% of females in these age groups living above the poverty line.
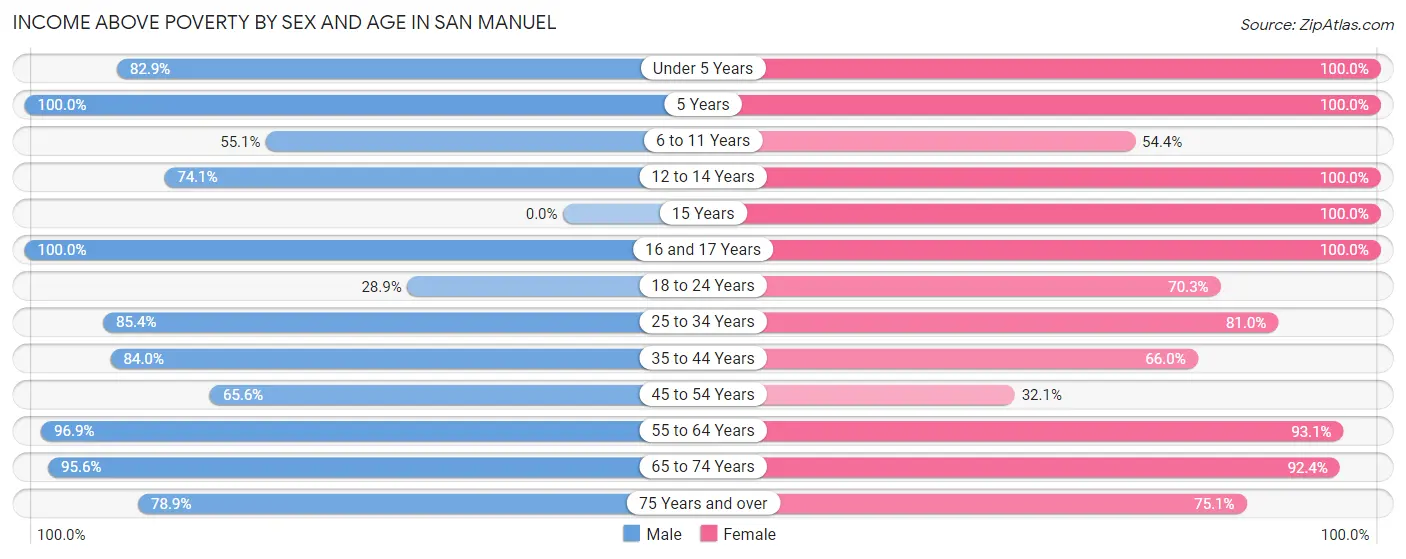
| Age Bracket | Male | Female |
| Under 5 Years | 58 (82.9%) | 50 (100.0%) |
| 5 Years | 19 (100.0%) | 19 (100.0%) |
| 6 to 11 Years | 59 (55.1%) | 49 (54.4%) |
| 12 to 14 Years | 40 (74.1%) | 14 (100.0%) |
| 15 Years | 0 (0.0%) | 35 (100.0%) |
| 16 and 17 Years | 28 (100.0%) | 11 (100.0%) |
| 18 to 24 Years | 35 (28.9%) | 78 (70.3%) |
| 25 to 34 Years | 240 (85.4%) | 115 (81.0%) |
| 35 to 44 Years | 100 (84.0%) | 101 (66.0%) |
| 45 to 54 Years | 162 (65.6%) | 52 (32.1%) |
| 55 to 64 Years | 377 (96.9%) | 338 (93.1%) |
| 65 to 74 Years | 240 (95.6%) | 134 (92.4%) |
| 75 Years and over | 221 (78.9%) | 205 (75.1%) |
| Total | 1,579 (80.3%) | 1,201 (76.6%) |
Income Below Poverty Among Married-Couple Families in San Manuel
The poverty statistics for married-couple families in San Manuel show that 14.8% or 115 of the total 775 families live below the poverty line. Families with 1 or 2 children have the highest poverty rate of 54.0%, comprising of 47 families. On the other hand, families with 5 or more children have the lowest poverty rate of 0.0%, which includes 0 families.
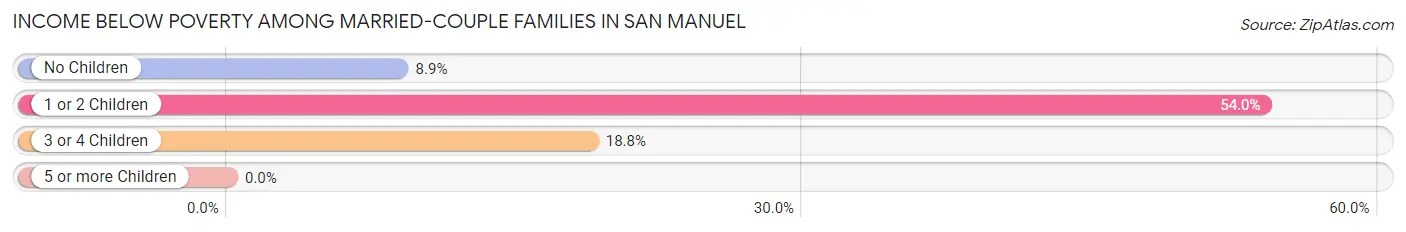
| Children | Above Poverty | Below Poverty |
| No Children | 562 (91.1%) | 55 (8.9%) |
| 1 or 2 Children | 40 (46.0%) | 47 (54.0%) |
| 3 or 4 Children | 56 (81.2%) | 13 (18.8%) |
| 5 or more Children | 2 (100.0%) | 0 (0.0%) |
| Total | 660 (85.2%) | 115 (14.8%) |
Income Below Poverty Among Single-Parent Households in San Manuel
According to the poverty data in San Manuel, 41.9% or 67 single-father households and 6.5% or 7 single-mother households are living below the poverty line. Among single-father households, those with no children have the highest poverty rate, with 56 households (70.0%) experiencing poverty. Likewise, among single-mother households, those with no children have the highest poverty rate, with 7 households (13.5%) falling below the poverty line.
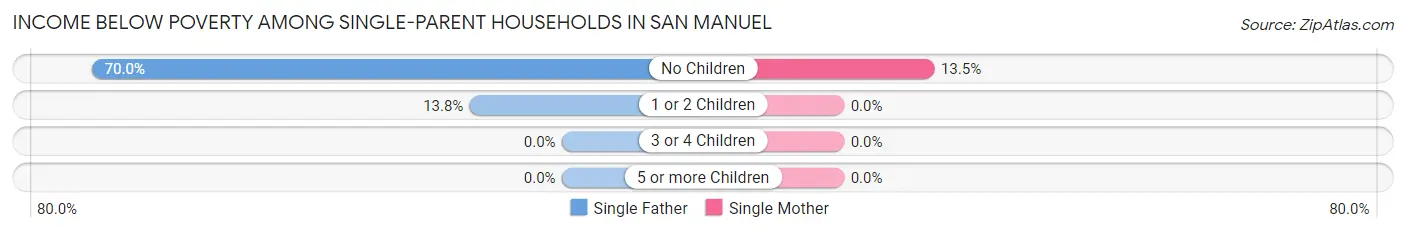
| Children | Single Father | Single Mother |
| No Children | 56 (70.0%) | 7 (13.5%) |
| 1 or 2 Children | 11 (13.8%) | 0 (0.0%) |
| 3 or 4 Children | 0 (0.0%) | 0 (0.0%) |
| 5 or more Children | 0 (0.0%) | 0 (0.0%) |
| Total | 67 (41.9%) | 7 (6.5%) |
Income Below Poverty Among Married-Couple vs Single-Parent Households in San Manuel
The poverty data for San Manuel shows that 115 of the married-couple family households (14.8%) and 74 of the single-parent households (27.7%) are living below the poverty level. Within the married-couple family households, those with 1 or 2 children have the highest poverty rate, with 47 households (54.0%) falling below the poverty line. Among the single-parent households, those with no children have the highest poverty rate, with 63 household (47.7%) living below poverty.
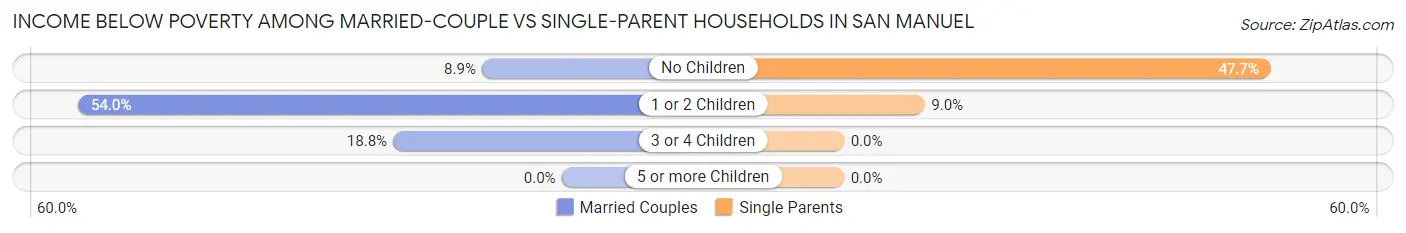
| Children | Married-Couple Families | Single-Parent Households |
| No Children | 55 (8.9%) | 63 (47.7%) |
| 1 or 2 Children | 47 (54.0%) | 11 (9.0%) |
| 3 or 4 Children | 13 (18.8%) | 0 (0.0%) |
| 5 or more Children | 0 (0.0%) | 0 (0.0%) |
| Total | 115 (14.8%) | 74 (27.7%) |
Race in San Manuel
The most populous races in San Manuel are White / Caucasian (2,654 | 75.1%), Hispanic or Latino (1,884 | 53.3%), and Two or more Races (557 | 15.8%).
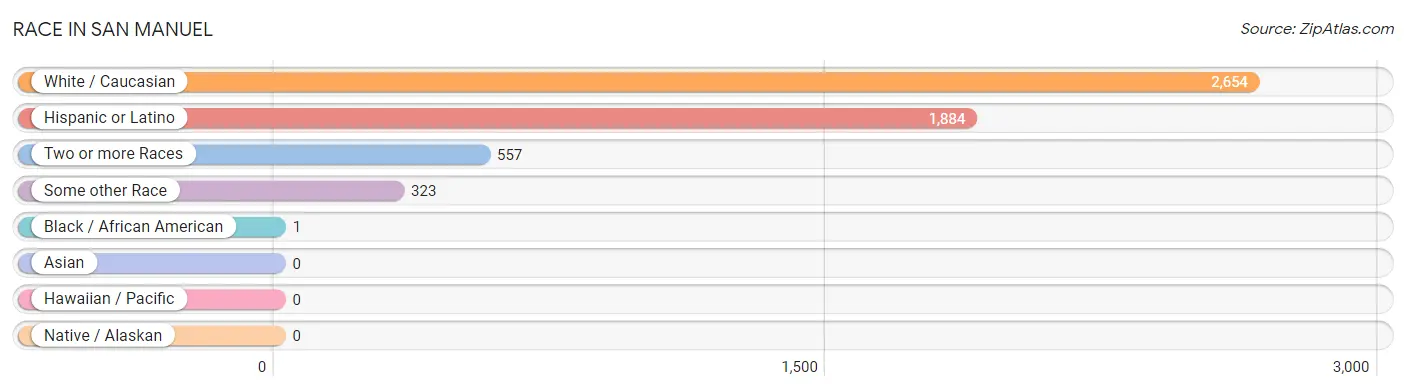
| Race | # Population | % Population |
| Asian | 0 | 0.0% |
| Black / African American | 1 | 0.0% |
| Hawaiian / Pacific | 0 | 0.0% |
| Hispanic or Latino | 1,884 | 53.3% |
| Native / Alaskan | 0 | 0.0% |
| White / Caucasian | 2,654 | 75.1% |
| Two or more Races | 557 | 15.8% |
| Some other Race | 323 | 9.1% |
| Total | 3,535 | 100.0% |
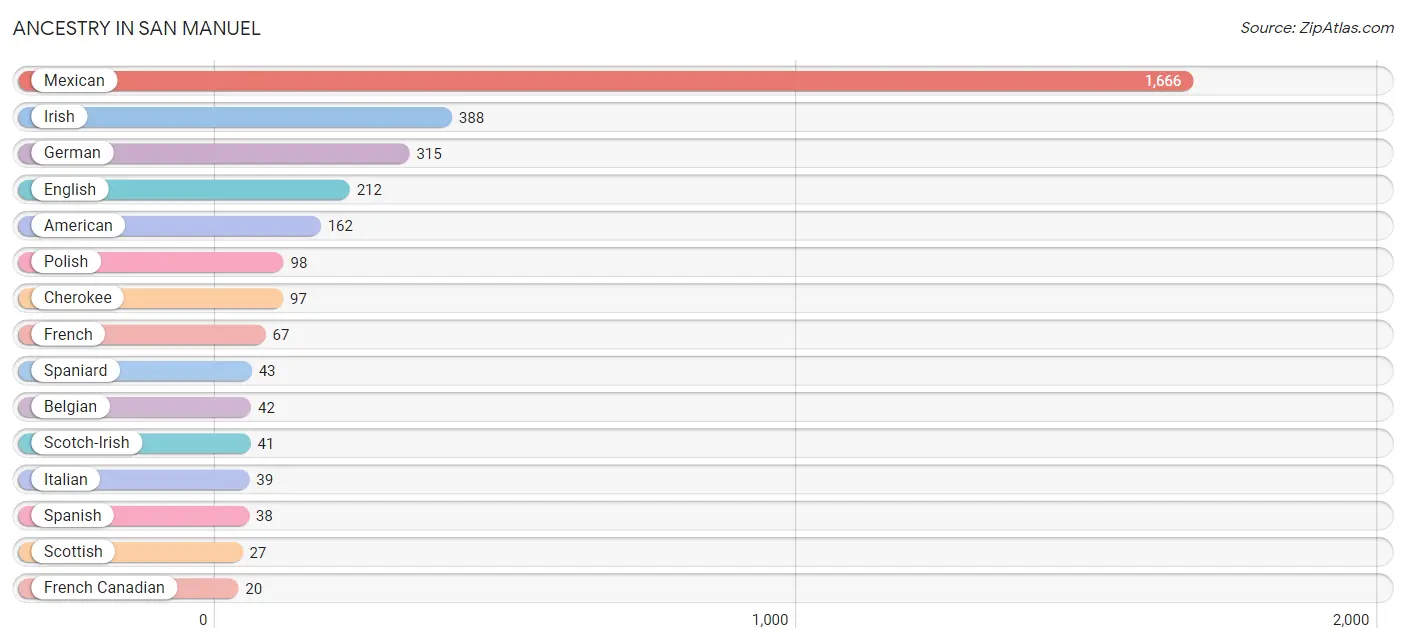
Ancestry in San Manuel
The most populous ancestries reported in San Manuel are Mexican (1,666 | 47.1%), Irish (388 | 11.0%), German (315 | 8.9%), English (212 | 6.0%), and American (162 | 4.6%), together accounting for 77.6% of all San Manuel residents.
| Ancestry | # Population | % Population |
| African | 4 | 0.1% |
| Alaskan Athabascan | 16 | 0.4% |
| American | 162 | 4.6% |
| Belgian | 42 | 1.2% |
| Bhutanese | 14 | 0.4% |
| British | 14 | 0.4% |
| Canadian | 16 | 0.4% |
| Cherokee | 97 | 2.7% |
| Danish | 15 | 0.4% |
| English | 212 | 6.0% |
| French | 67 | 1.9% |
| French Canadian | 20 | 0.6% |
| German | 315 | 8.9% |
| Iranian | 8 | 0.2% |
| Irish | 388 | 11.0% |
| Italian | 39 | 1.1% |
| Mexican | 1,666 | 47.1% |
| Nigerian | 1 | 0.0% |
| Norwegian | 15 | 0.4% |
| Pennsylvania German | 11 | 0.3% |
| Polish | 98 | 2.8% |
| Romanian | 7 | 0.2% |
| Scotch-Irish | 41 | 1.2% |
| Scottish | 27 | 0.8% |
| Sioux | 19 | 0.5% |
| Spaniard | 43 | 1.2% |
| Spanish | 38 | 1.1% |
| Subsaharan African | 5 | 0.1% |
| Swedish | 9 | 0.3% |
| Swiss | 14 | 0.4% |
| Welsh | 18 | 0.5% |
| Yaqui | 12 | 0.3% | View All 32 Rows |
Immigrants in San Manuel
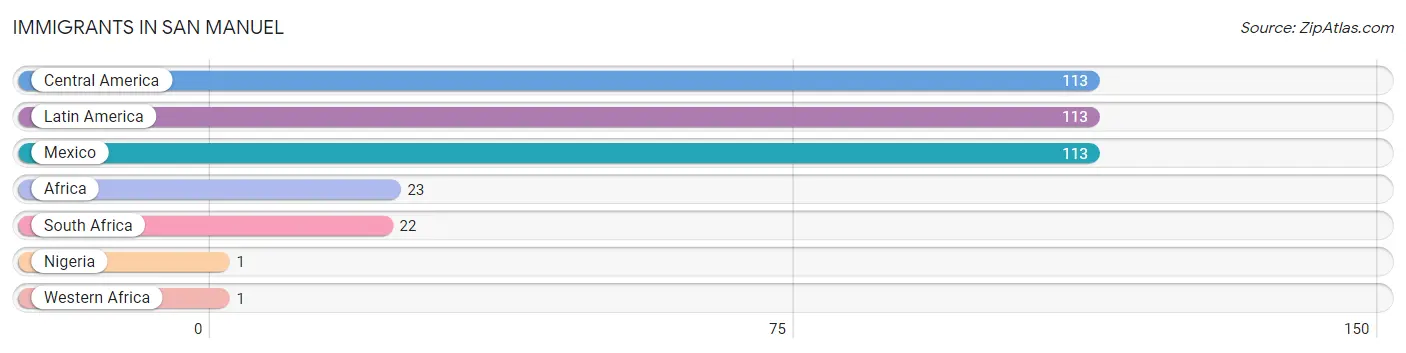
The most numerous immigrant groups reported in San Manuel came from Central America (113 | 3.2%), Latin America (113 | 3.2%), Mexico (113 | 3.2%), Africa (23 | 0.6%), and South Africa (22 | 0.6%), together accounting for 10.9% of all San Manuel residents.
| Immigration Origin | # Population | % Population |
| Africa | 23 | 0.6% |
| Central America | 113 | 3.2% |
| Latin America | 113 | 3.2% |
| Mexico | 113 | 3.2% |
| Nigeria | 1 | 0.0% |
| South Africa | 22 | 0.6% |
| Western Africa | 1 | 0.0% | View All 7 Rows |
Sex and Age in San Manuel
Sex and Age in San Manuel
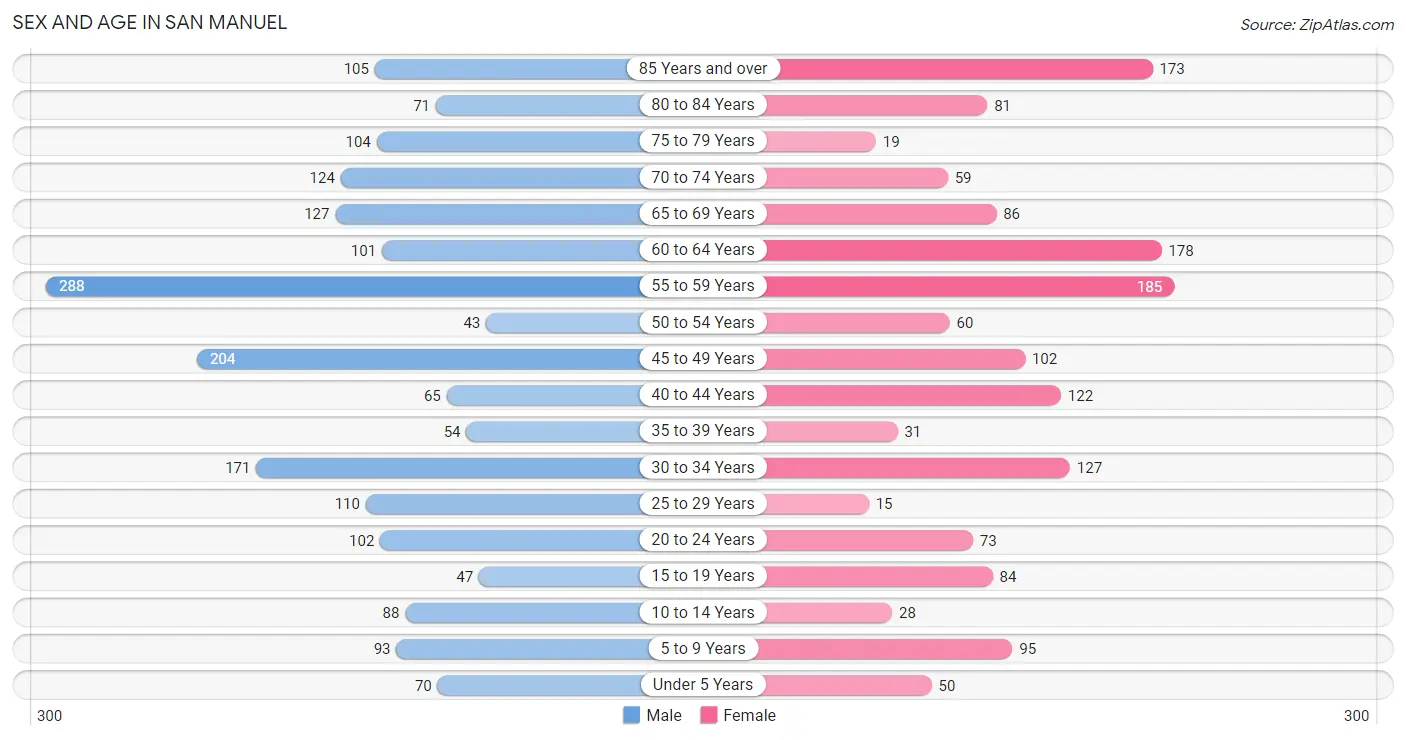
The most populous age groups in San Manuel are 55 to 59 Years (288 | 14.6%) for men and 55 to 59 Years (185 | 11.8%) for women.
| Age Bracket | Male | Female |
| Under 5 Years | 70 (3.6%) | 50 (3.2%) |
| 5 to 9 Years | 93 (4.7%) | 95 (6.1%) |
| 10 to 14 Years | 88 (4.5%) | 28 (1.8%) |
| 15 to 19 Years | 47 (2.4%) | 84 (5.4%) |
| 20 to 24 Years | 102 (5.2%) | 73 (4.7%) |
| 25 to 29 Years | 110 (5.6%) | 15 (1.0%) |
| 30 to 34 Years | 171 (8.7%) | 127 (8.1%) |
| 35 to 39 Years | 54 (2.8%) | 31 (2.0%) |
| 40 to 44 Years | 65 (3.3%) | 122 (7.8%) |
| 45 to 49 Years | 204 (10.4%) | 102 (6.5%) |
| 50 to 54 Years | 43 (2.2%) | 60 (3.8%) |
| 55 to 59 Years | 288 (14.6%) | 185 (11.8%) |
| 60 to 64 Years | 101 (5.1%) | 178 (11.4%) |
| 65 to 69 Years | 127 (6.5%) | 86 (5.5%) |
| 70 to 74 Years | 124 (6.3%) | 59 (3.8%) |
| 75 to 79 Years | 104 (5.3%) | 19 (1.2%) |
| 80 to 84 Years | 71 (3.6%) | 81 (5.2%) |
| 85 Years and over | 105 (5.3%) | 173 (11.0%) |
| Total | 1,967 (100.0%) | 1,568 (100.0%) |
Families and Households in San Manuel
Median Family Size in San Manuel
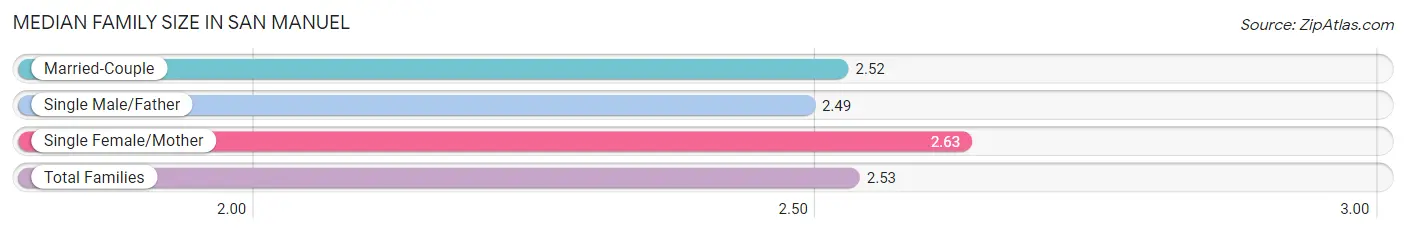
The median family size in San Manuel is 2.53 persons per family, with single female/mother families (107 | 10.3%) accounting for the largest median family size of 2.63 persons per family. On the other hand, single male/father families (160 | 15.4%) represent the smallest median family size with 2.49 persons per family.
| Family Type | # Families | Family Size |
| Married-Couple | 775 (74.4%) | 2.52 |
| Single Male/Father | 160 (15.4%) | 2.49 |
| Single Female/Mother | 107 (10.3%) | 2.63 |
| Total Families | 1,042 (100.0%) | 2.53 |
Median Household Size in San Manuel
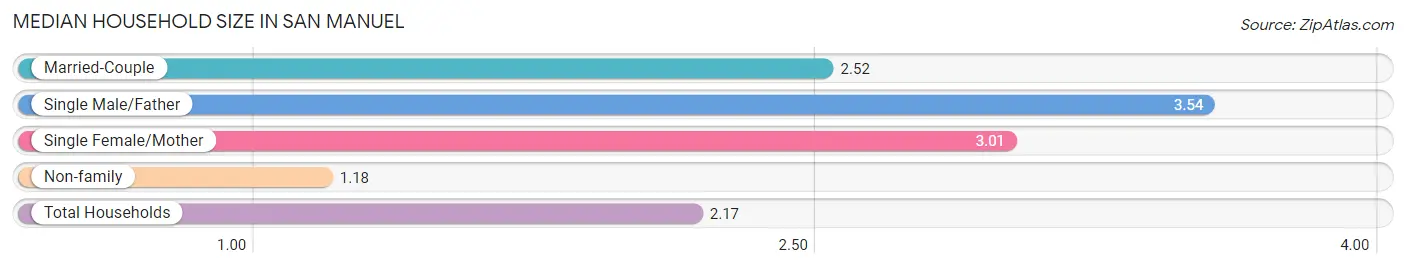
The median household size in San Manuel is 2.17 persons per household, with single male/father households (160 | 9.8%) accounting for the largest median household size of 3.54 persons per household. non-family households (584 | 35.9%) represent the smallest median household size with 1.18 persons per household.
| Household Type | # Households | Household Size |
| Married-Couple | 775 (47.7%) | 2.52 |
| Single Male/Father | 160 (9.8%) | 3.54 |
| Single Female/Mother | 107 (6.6%) | 3.01 |
| Non-family | 584 (35.9%) | 1.18 |
| Total Households | 1,626 (100.0%) | 2.17 |
Household Size by Marriage Status in San Manuel
Out of a total of 1,626 households in San Manuel, 1,042 (64.1%) are family households, while 584 (35.9%) are nonfamily households. The most numerous type of family households are 2-person households, comprising 603, and the most common type of nonfamily households are 1-person households, comprising 487.
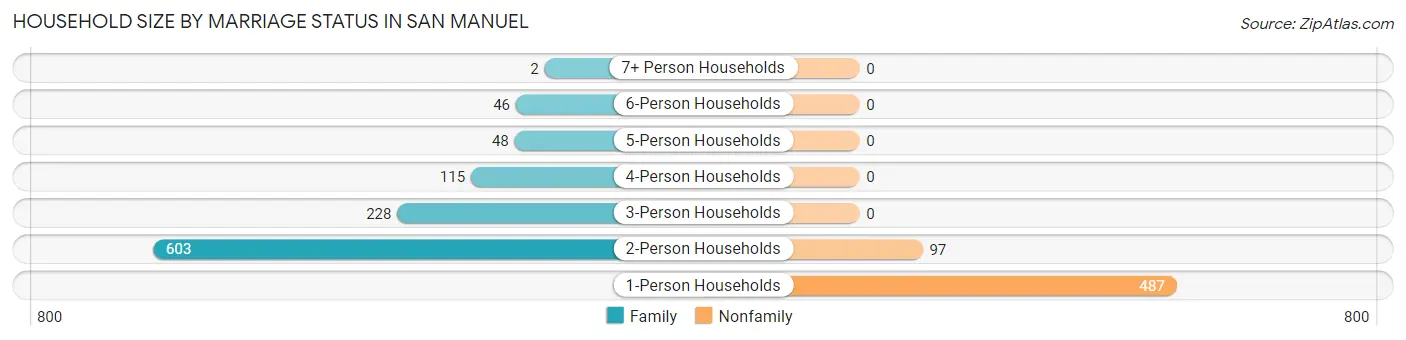
| Household Size | Family Households | Nonfamily Households |
| 1-Person Households | - | 487 (29.9%) |
| 2-Person Households | 603 (37.1%) | 97 (6.0%) |
| 3-Person Households | 228 (14.0%) | 0 (0.0%) |
| 4-Person Households | 115 (7.1%) | 0 (0.0%) |
| 5-Person Households | 48 (2.9%) | 0 (0.0%) |
| 6-Person Households | 46 (2.8%) | 0 (0.0%) |
| 7+ Person Households | 2 (0.1%) | 0 (0.0%) |
| Total | 1,042 (64.1%) | 584 (35.9%) |
Female Fertility in San Manuel
Fertility by Age in San Manuel
Average fertility rate in San Manuel is 40.0 births per 1,000 women. Women in the age bracket of 20 to 34 years have the highest fertility rate with 102.0 births per 1,000 women. Women in the age bracket of 20 to 34 years acount for 100.0% of all women with births.
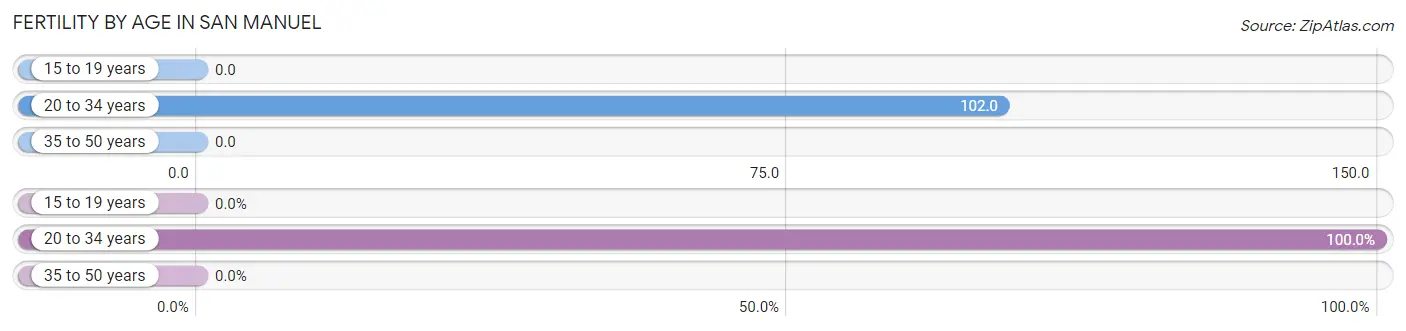
| Age Bracket | Women with Births | Births / 1,000 Women |
| 15 to 19 years | 0 (0.0%) | 0.0 |
| 20 to 34 years | 22 (100.0%) | 102.0 |
| 35 to 50 years | 0 (0.0%) | 0.0 |
| Total | 22 (100.0%) | 40.0 |
Fertility by Age by Marriage Status in San Manuel
59.1% of women with births (22) in San Manuel are married. The highest percentage of unmarried women with births falls into 20 to 34 years age bracket with 40.9% of them unmarried at the time of birth, while the lowest percentage of unmarried women with births belong to 20 to 34 years age bracket with 40.9% of them unmarried.
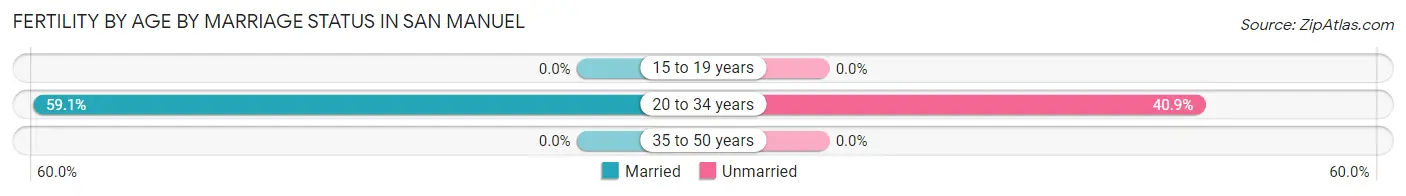
| Age Bracket | Married | Unmarried |
| 15 to 19 years | 0 (0.0%) | 0 (0.0%) |
| 20 to 34 years | 13 (59.1%) | 9 (40.9%) |
| 35 to 50 years | 0 (0.0%) | 0 (0.0%) |
| Total | 13 (59.1%) | 9 (40.9%) |
Fertility by Education in San Manuel
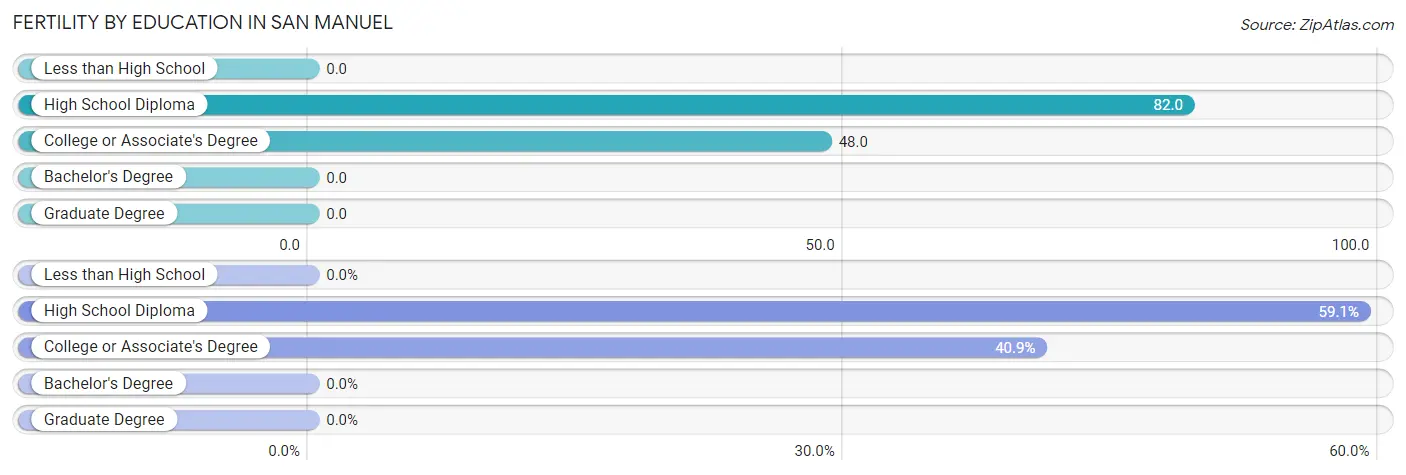
| Educational Attainment | Women with Births | Births / 1,000 Women |
| Less than High School | 0 (0.0%) | 0.0 |
| High School Diploma | 13 (59.1%) | 82.0 |
| College or Associate's Degree | 9 (40.9%) | 48.0 |
| Bachelor's Degree | 0 (0.0%) | 0.0 |
| Graduate Degree | 0 (0.0%) | 0.0 |
| Total | 22 (100.0%) | 40.0 |
Fertility by Education by Marriage Status in San Manuel
40.9% of women with births in San Manuel are unmarried. Women with the educational attainment of high school diploma are most likely to be married with 100.0% of them married at childbirth, while women with the educational attainment of college or associate's degree are least likely to be married with 100.0% of them unmarried at childbirth.
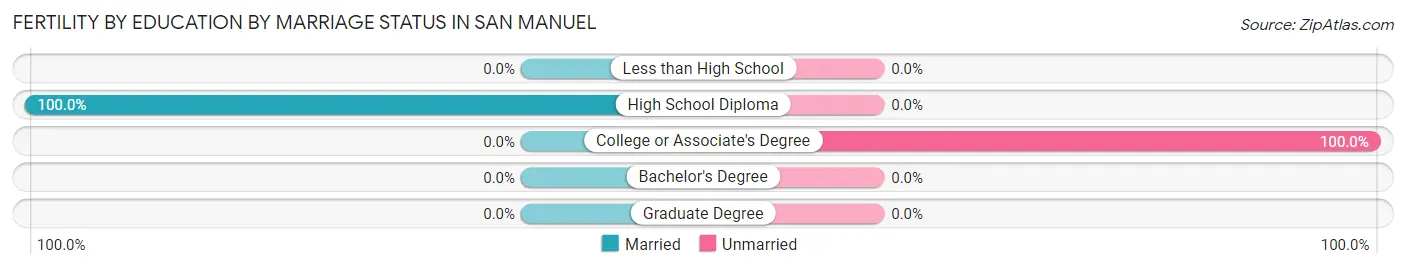
| Educational Attainment | Married | Unmarried |
| Less than High School | 0 (0.0%) | 0 (0.0%) |
| High School Diploma | 13 (100.0%) | 0 (0.0%) |
| College or Associate's Degree | 0 (0.0%) | 9 (100.0%) |
| Bachelor's Degree | 0 (0.0%) | 0 (0.0%) |
| Graduate Degree | 0 (0.0%) | 0 (0.0%) |
| Total | 13 (59.1%) | 9 (40.9%) |
Employment Characteristics in San Manuel
Employment by Class of Employer in San Manuel
Among the 1,242 employed individuals in San Manuel, private company employees (860 | 69.2%), local government employees (161 | 13.0%), and self-employed (not incorporated) (96 | 7.7%) make up the most common classes of employment.
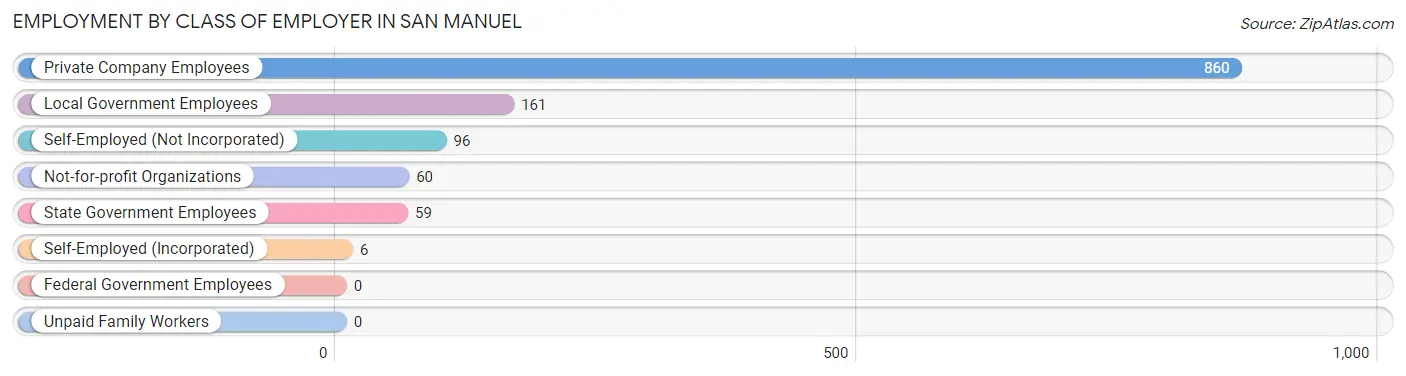
| Employer Class | # Employees | % Employees |
| Private Company Employees | 860 | 69.2% |
| Self-Employed (Incorporated) | 6 | 0.5% |
| Self-Employed (Not Incorporated) | 96 | 7.7% |
| Not-for-profit Organizations | 60 | 4.8% |
| Local Government Employees | 161 | 13.0% |
| State Government Employees | 59 | 4.8% |
| Federal Government Employees | 0 | 0.0% |
| Unpaid Family Workers | 0 | 0.0% |
| Total | 1,242 | 100.0% |
Employment Status by Age in San Manuel
According to the labor force statistics for San Manuel, out of the total population over 16 years of age (3,076), 46.1% or 1,418 individuals are in the labor force, with 9.9% or 140 of them unemployed. The age group with the highest labor force participation rate is 30 to 34 years, with 71.5% or 213 individuals in the labor force. Within the labor force, the 45 to 54 years age range has the highest percentage of unemployed individuals, with 41.1% or 118 of them being unemployed.
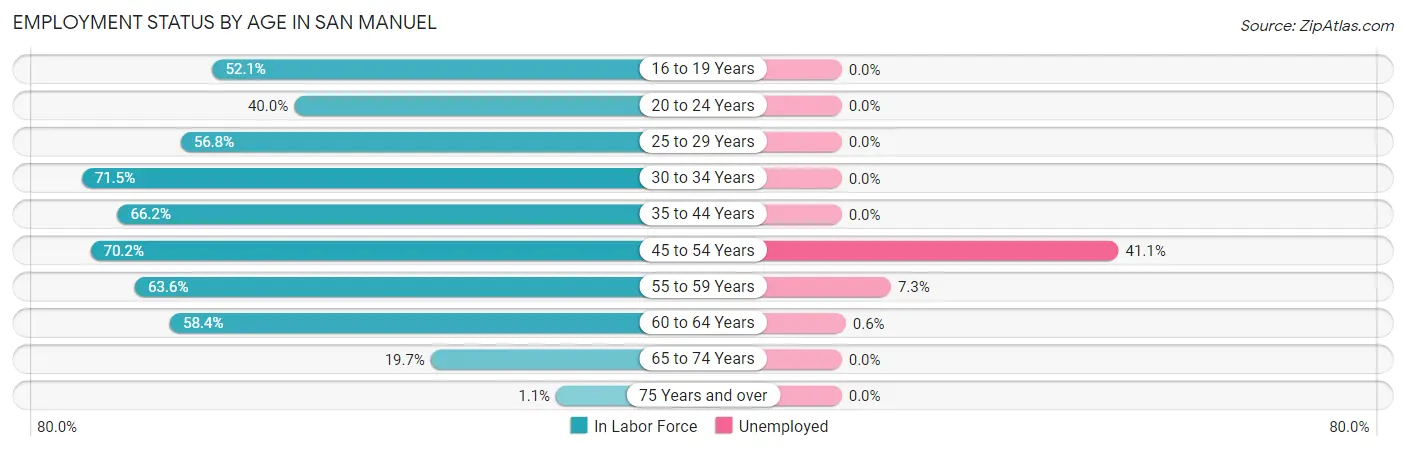
| Age Bracket | In Labor Force | Unemployed |
| 16 to 19 Years | 50 (52.1%) | 0 (0.0%) |
| 20 to 24 Years | 70 (40.0%) | 0 (0.0%) |
| 25 to 29 Years | 71 (56.8%) | 0 (0.0%) |
| 30 to 34 Years | 213 (71.5%) | 0 (0.0%) |
| 35 to 44 Years | 180 (66.2%) | 0 (0.0%) |
| 45 to 54 Years | 287 (70.2%) | 118 (41.1%) |
| 55 to 59 Years | 301 (63.6%) | 22 (7.3%) |
| 60 to 64 Years | 163 (58.4%) | 1 (0.6%) |
| 65 to 74 Years | 78 (19.7%) | 0 (0.0%) |
| 75 Years and over | 6 (1.1%) | 0 (0.0%) |
| Total | 1,418 (46.1%) | 140 (9.9%) |
Employment Status by Educational Attainment in San Manuel
According to labor force statistics for San Manuel, 65.5% of individuals (1,216) out of the total population between 25 and 64 years of age (1,856) are in the labor force, with 11.6% or 141 of them being unemployed. The group with the highest labor force participation rate are those with the educational attainment of college / associate degree, with 82.9% or 612 individuals in the labor force. Within the labor force, individuals with less than high school education have the highest percentage of unemployment, with 43.8% or 56 of them being unemployed.
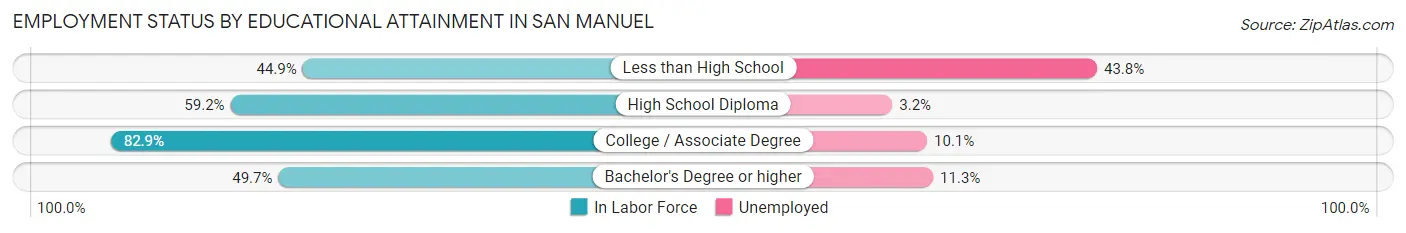
| Educational Attainment | In Labor Force | Unemployed |
| Less than High School | 128 (44.9%) | 125 (43.8%) |
| High School Diploma | 378 (59.2%) | 20 (3.2%) |
| College / Associate Degree | 612 (82.9%) | 75 (10.1%) |
| Bachelor's Degree or higher | 97 (49.7%) | 22 (11.3%) |
| Total | 1,216 (65.5%) | 215 (11.6%) |
Employment Occupations by Sex in San Manuel
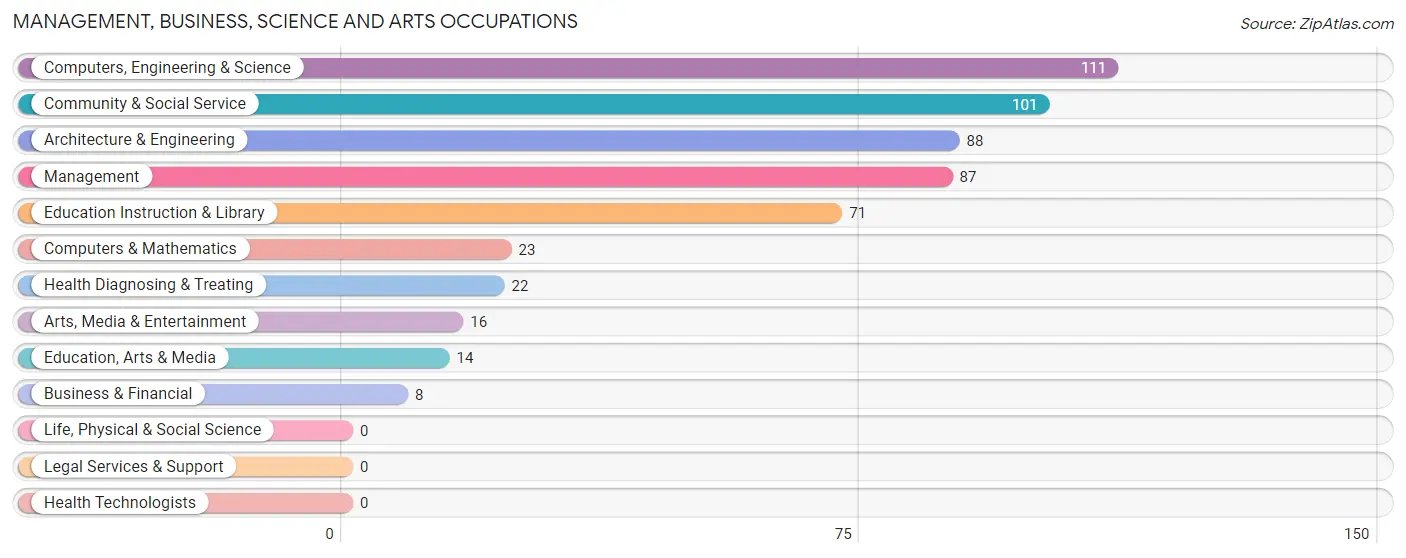
Management, Business, Science and Arts Occupations
The most common Management, Business, Science and Arts occupations in San Manuel are Computers, Engineering & Science (111 | 8.7%), Community & Social Service (101 | 7.9%), Architecture & Engineering (88 | 6.9%), Management (87 | 6.8%), and Education Instruction & Library (71 | 5.6%).
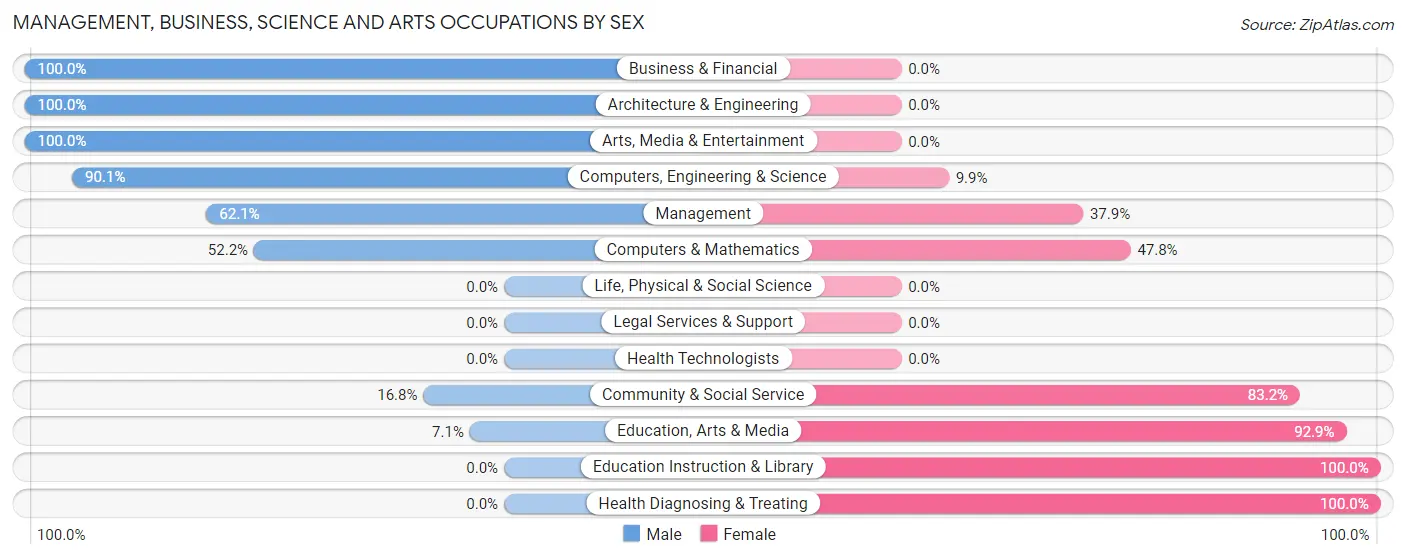
Management, Business, Science and Arts Occupations by Sex
Within the Management, Business, Science and Arts occupations in San Manuel, the most male-oriented occupations are Business & Financial (100.0%), Architecture & Engineering (100.0%), and Arts, Media & Entertainment (100.0%), while the most female-oriented occupations are Education Instruction & Library (100.0%), Health Diagnosing & Treating (100.0%), and Education, Arts & Media (92.9%).
| Occupation | Male | Female |
| Management | 54 (62.1%) | 33 (37.9%) |
| Business & Financial | 8 (100.0%) | 0 (0.0%) |
| Computers, Engineering & Science | 100 (90.1%) | 11 (9.9%) |
| Computers & Mathematics | 12 (52.2%) | 11 (47.8%) |
| Architecture & Engineering | 88 (100.0%) | 0 (0.0%) |
| Life, Physical & Social Science | 0 (0.0%) | 0 (0.0%) |
| Community & Social Service | 17 (16.8%) | 84 (83.2%) |
| Education, Arts & Media | 1 (7.1%) | 13 (92.9%) |
| Legal Services & Support | 0 (0.0%) | 0 (0.0%) |
| Education Instruction & Library | 0 (0.0%) | 71 (100.0%) |
| Arts, Media & Entertainment | 16 (100.0%) | 0 (0.0%) |
| Health Diagnosing & Treating | 0 (0.0%) | 22 (100.0%) |
| Health Technologists | 0 (0.0%) | 0 (0.0%) |
| Total (Category) | 179 (54.4%) | 150 (45.6%) |
| Total (Overall) | 752 (58.8%) | 526 (41.2%) |
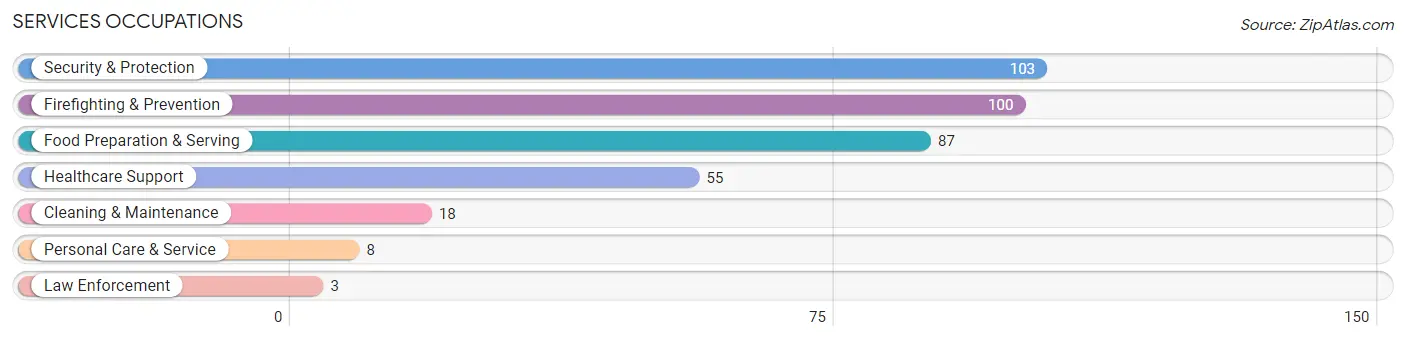
Services Occupations
The most common Services occupations in San Manuel are Security & Protection (103 | 8.1%), Firefighting & Prevention (100 | 7.8%), Food Preparation & Serving (87 | 6.8%), Healthcare Support (55 | 4.3%), and Cleaning & Maintenance (18 | 1.4%).
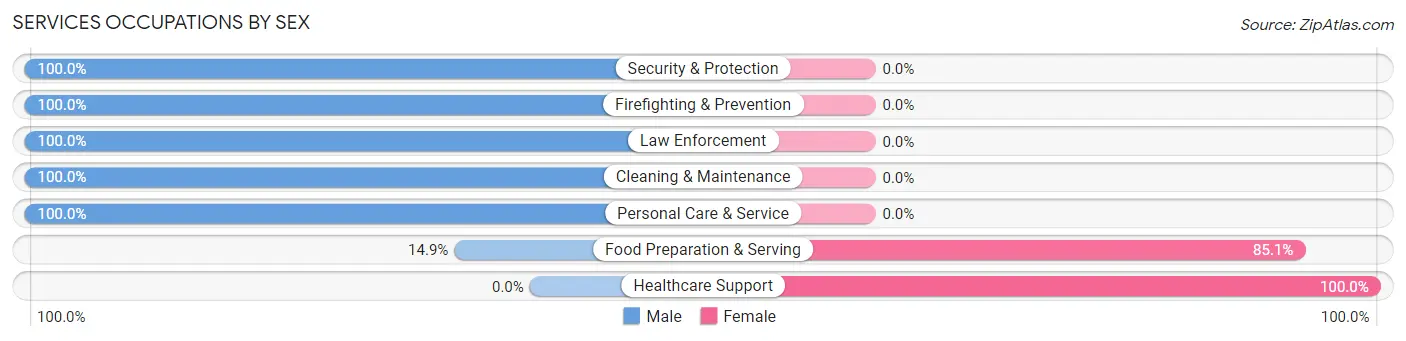
Services Occupations by Sex
Within the Services occupations in San Manuel, the most male-oriented occupations are Security & Protection (100.0%), Firefighting & Prevention (100.0%), and Law Enforcement (100.0%), while the most female-oriented occupations are Healthcare Support (100.0%), and Food Preparation & Serving (85.1%).
| Occupation | Male | Female |
| Healthcare Support | 0 (0.0%) | 55 (100.0%) |
| Security & Protection | 103 (100.0%) | 0 (0.0%) |
| Firefighting & Prevention | 100 (100.0%) | 0 (0.0%) |
| Law Enforcement | 3 (100.0%) | 0 (0.0%) |
| Food Preparation & Serving | 13 (14.9%) | 74 (85.1%) |
| Cleaning & Maintenance | 18 (100.0%) | 0 (0.0%) |
| Personal Care & Service | 8 (100.0%) | 0 (0.0%) |
| Total (Category) | 142 (52.4%) | 129 (47.6%) |
| Total (Overall) | 752 (58.8%) | 526 (41.2%) |
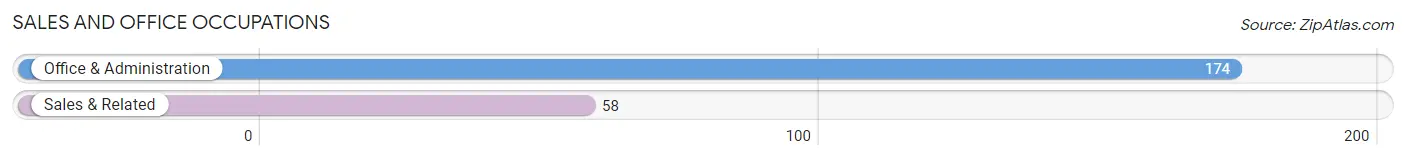
Sales and Office Occupations
The most common Sales and Office occupations in San Manuel are Office & Administration (174 | 13.6%), and Sales & Related (58 | 4.5%).
Sales and Office Occupations by Sex
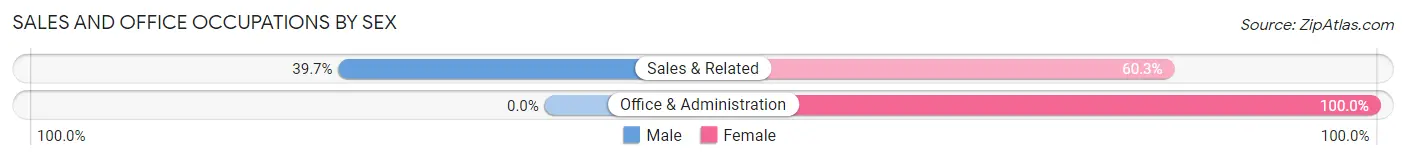
| Occupation | Male | Female |
| Sales & Related | 23 (39.7%) | 35 (60.3%) |
| Office & Administration | 0 (0.0%) | 174 (100.0%) |
| Total (Category) | 23 (9.9%) | 209 (90.1%) |
| Total (Overall) | 752 (58.8%) | 526 (41.2%) |
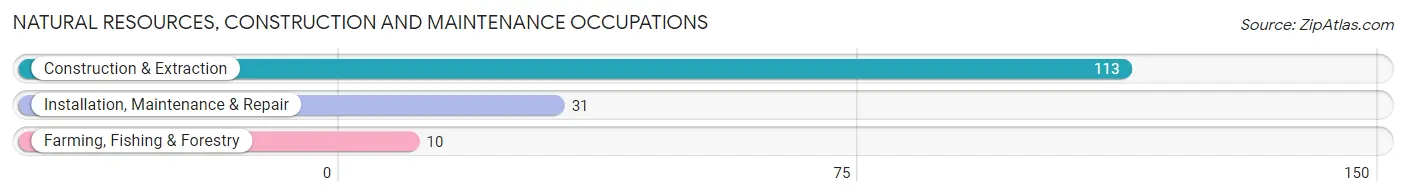
Natural Resources, Construction and Maintenance Occupations
The most common Natural Resources, Construction and Maintenance occupations in San Manuel are Construction & Extraction (113 | 8.8%), Installation, Maintenance & Repair (31 | 2.4%), and Farming, Fishing & Forestry (10 | 0.8%).
Natural Resources, Construction and Maintenance Occupations by Sex
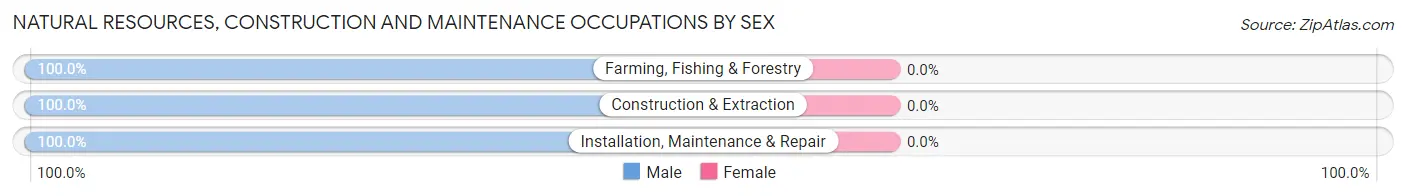
| Occupation | Male | Female |
| Farming, Fishing & Forestry | 10 (100.0%) | 0 (0.0%) |
| Construction & Extraction | 113 (100.0%) | 0 (0.0%) |
| Installation, Maintenance & Repair | 31 (100.0%) | 0 (0.0%) |
| Total (Category) | 154 (100.0%) | 0 (0.0%) |
| Total (Overall) | 752 (58.8%) | 526 (41.2%) |
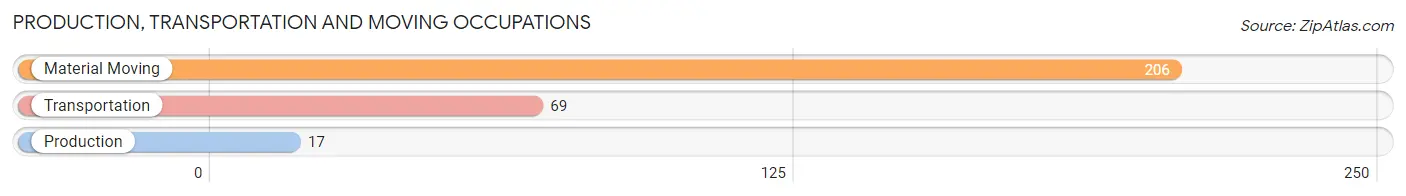
Production, Transportation and Moving Occupations
The most common Production, Transportation and Moving occupations in San Manuel are Material Moving (206 | 16.1%), Transportation (69 | 5.4%), and Production (17 | 1.3%).
Production, Transportation and Moving Occupations by Sex
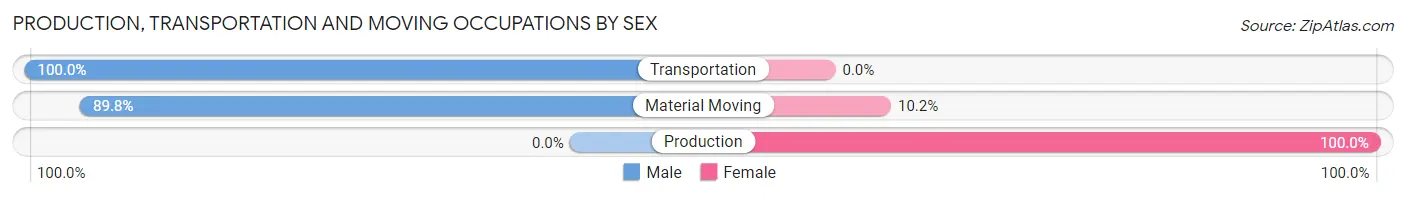
| Occupation | Male | Female |
| Production | 0 (0.0%) | 17 (100.0%) |
| Transportation | 69 (100.0%) | 0 (0.0%) |
| Material Moving | 185 (89.8%) | 21 (10.2%) |
| Total (Category) | 254 (87.0%) | 38 (13.0%) |
| Total (Overall) | 752 (58.8%) | 526 (41.2%) |
Employment Industries by Sex in San Manuel
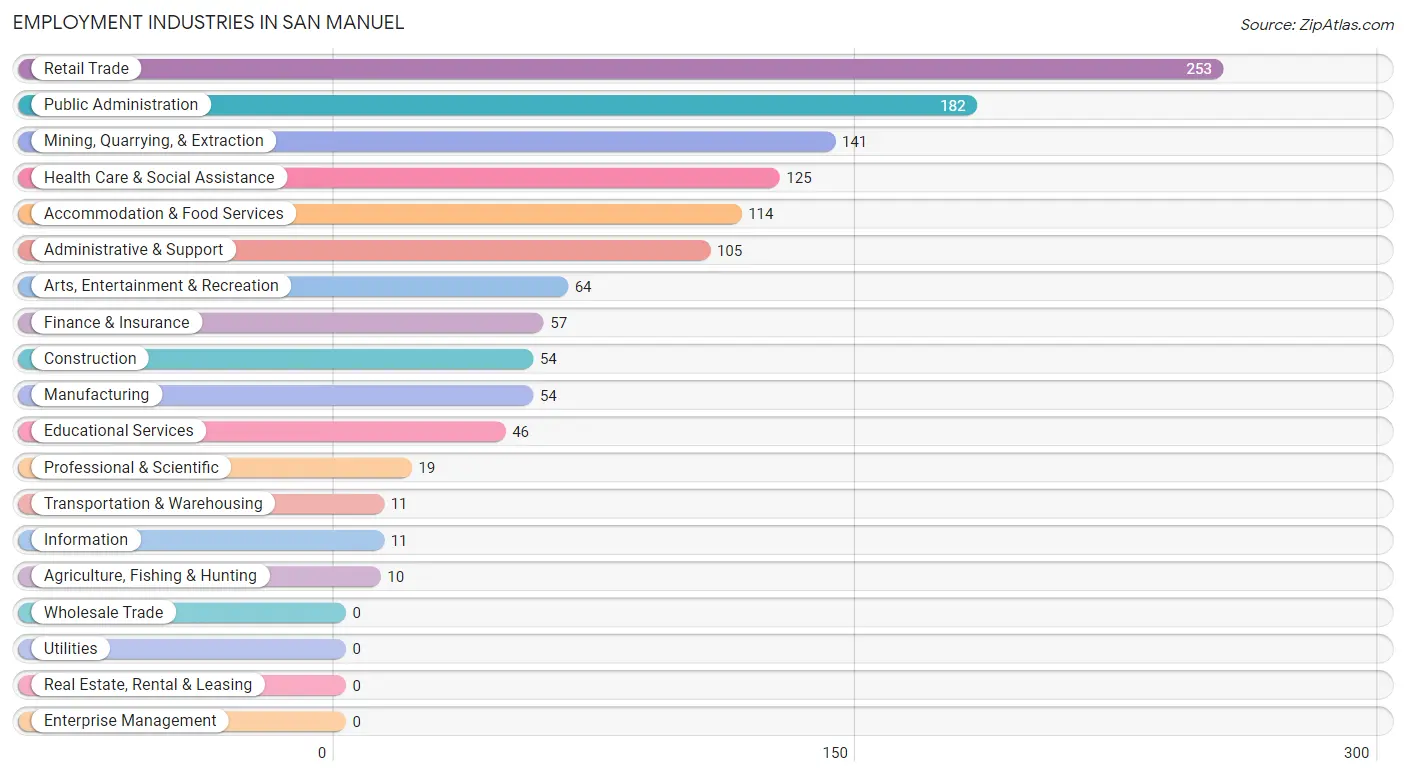
Employment Industries in San Manuel
The major employment industries in San Manuel include Retail Trade (253 | 19.8%), Public Administration (182 | 14.2%), Mining, Quarrying, & Extraction (141 | 11.0%), Health Care & Social Assistance (125 | 9.8%), and Accommodation & Food Services (114 | 8.9%).
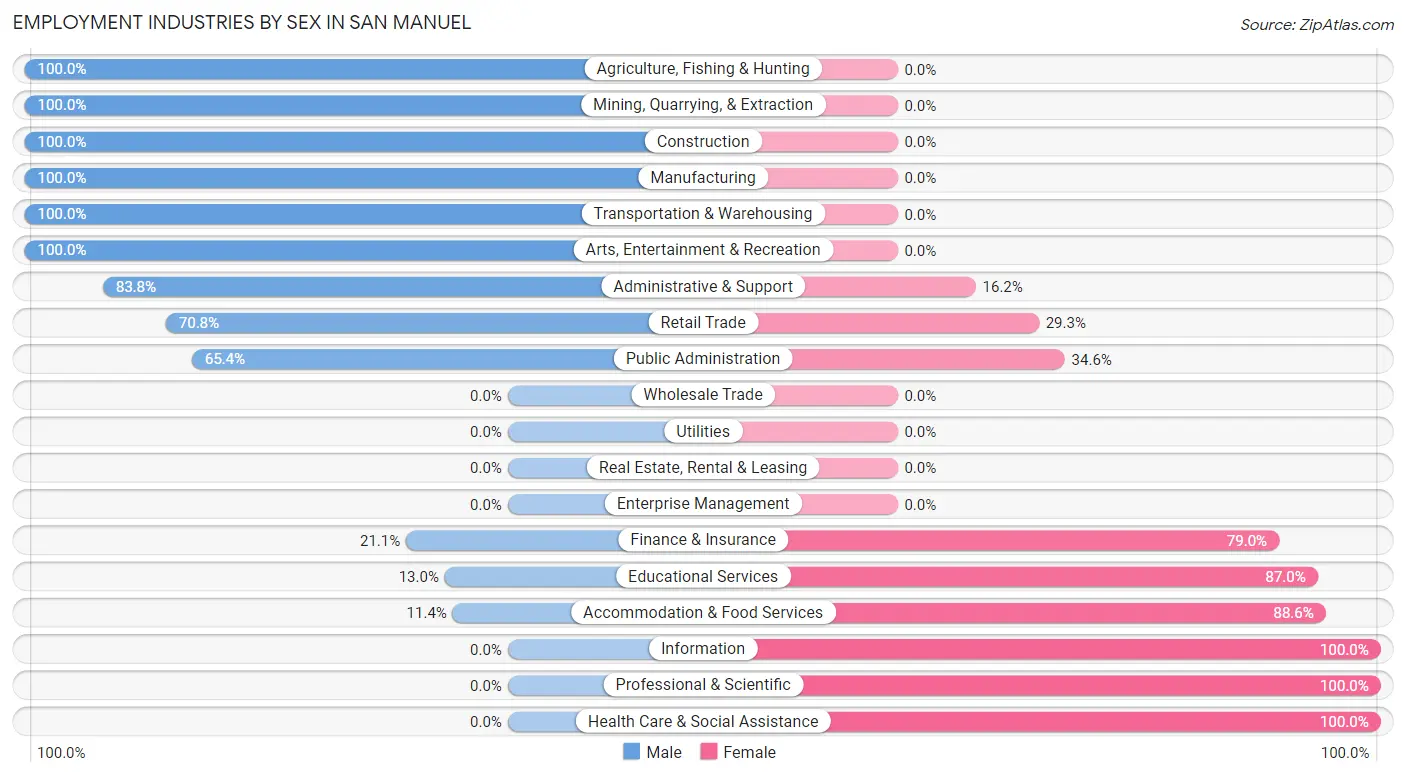
Employment Industries by Sex in San Manuel
The San Manuel industries that see more men than women are Agriculture, Fishing & Hunting (100.0%), Mining, Quarrying, & Extraction (100.0%), and Construction (100.0%), whereas the industries that tend to have a higher number of women are Information (100.0%), Professional & Scientific (100.0%), and Health Care & Social Assistance (100.0%).
| Industry | Male | Female |
| Agriculture, Fishing & Hunting | 10 (100.0%) | 0 (0.0%) |
| Mining, Quarrying, & Extraction | 141 (100.0%) | 0 (0.0%) |
| Construction | 54 (100.0%) | 0 (0.0%) |
| Manufacturing | 54 (100.0%) | 0 (0.0%) |
| Wholesale Trade | 0 (0.0%) | 0 (0.0%) |
| Retail Trade | 179 (70.8%) | 74 (29.2%) |
| Transportation & Warehousing | 11 (100.0%) | 0 (0.0%) |
| Utilities | 0 (0.0%) | 0 (0.0%) |
| Information | 0 (0.0%) | 11 (100.0%) |
| Finance & Insurance | 12 (21.0%) | 45 (78.9%) |
| Real Estate, Rental & Leasing | 0 (0.0%) | 0 (0.0%) |
| Professional & Scientific | 0 (0.0%) | 19 (100.0%) |
| Enterprise Management | 0 (0.0%) | 0 (0.0%) |
| Administrative & Support | 88 (83.8%) | 17 (16.2%) |
| Educational Services | 6 (13.0%) | 40 (87.0%) |
| Health Care & Social Assistance | 0 (0.0%) | 125 (100.0%) |
| Arts, Entertainment & Recreation | 64 (100.0%) | 0 (0.0%) |
| Accommodation & Food Services | 13 (11.4%) | 101 (88.6%) |
| Public Administration | 119 (65.4%) | 63 (34.6%) |
| Total | 752 (58.8%) | 526 (41.2%) |
Education in San Manuel
School Enrollment in San Manuel
The most common levels of schooling among the 510 students in San Manuel are elementary school (129 | 25.3%), middle school (119 | 23.3%), and college / undergraduate (116 | 22.8%).
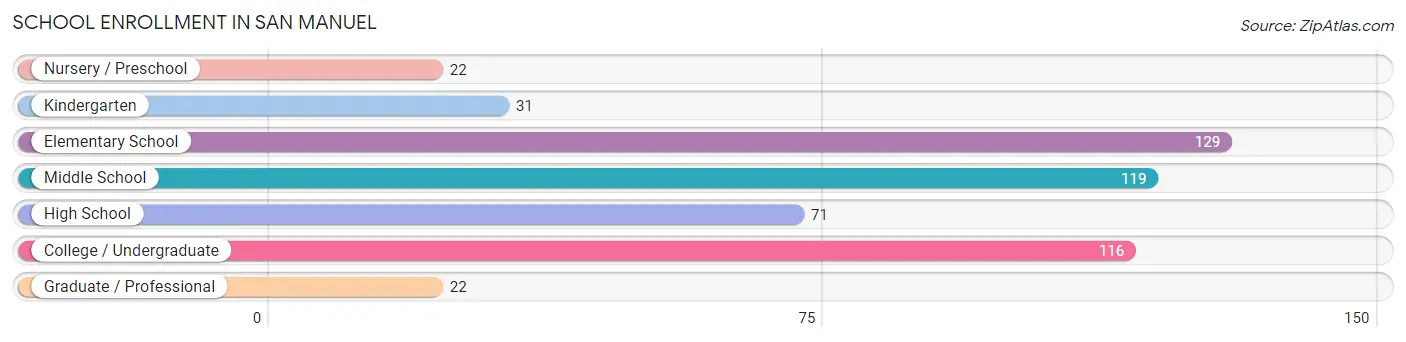
| School Level | # Students | % Students |
| Nursery / Preschool | 22 | 4.3% |
| Kindergarten | 31 | 6.1% |
| Elementary School | 129 | 25.3% |
| Middle School | 119 | 23.3% |
| High School | 71 | 13.9% |
| College / Undergraduate | 116 | 22.8% |
| Graduate / Professional | 22 | 4.3% |
| Total | 510 | 100.0% |
School Enrollment by Age by Funding Source in San Manuel
Out of a total of 510 students who are enrolled in schools in San Manuel, 71 (13.9%) attend a private institution, while the remaining 439 (86.1%) are enrolled in public schools. The age group of 25 to 34 year olds has the highest likelihood of being enrolled in private schools, with 19 (39.6% in the age bracket) enrolled. Conversely, the age group of 3 to 4 year olds has the lowest likelihood of being enrolled in a private school, with 15 (100.0% in the age bracket) attending a public institution.
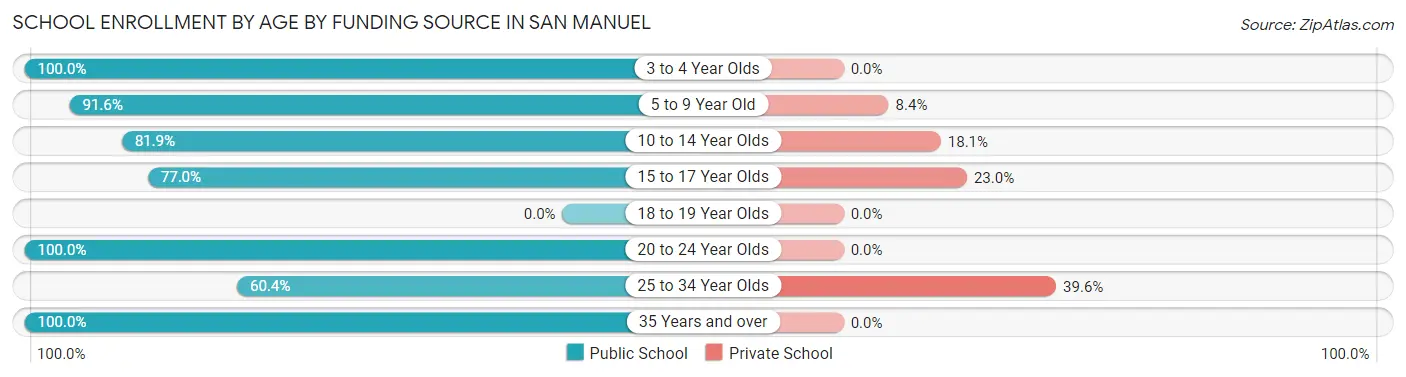
| Age Bracket | Public School | Private School |
| 3 to 4 Year Olds | 15 (100.0%) | 0 (0.0%) |
| 5 to 9 Year Old | 153 (91.6%) | 14 (8.4%) |
| 10 to 14 Year Olds | 95 (81.9%) | 21 (18.1%) |
| 15 to 17 Year Olds | 57 (77.0%) | 17 (23.0%) |
| 18 to 19 Year Olds | 0 (0.0%) | 0 (0.0%) |
| 20 to 24 Year Olds | 25 (100.0%) | 0 (0.0%) |
| 25 to 34 Year Olds | 29 (60.4%) | 19 (39.6%) |
| 35 Years and over | 65 (100.0%) | 0 (0.0%) |
| Total | 439 (86.1%) | 71 (13.9%) |
Educational Attainment by Field of Study in San Manuel
Education (60 | 19.7%), communications (53 | 17.4%), business (46 | 15.1%), science & technology (38 | 12.5%), and psychology (33 | 10.8%) are the most common fields of study among 305 individuals in San Manuel who have obtained a bachelor's degree or higher.
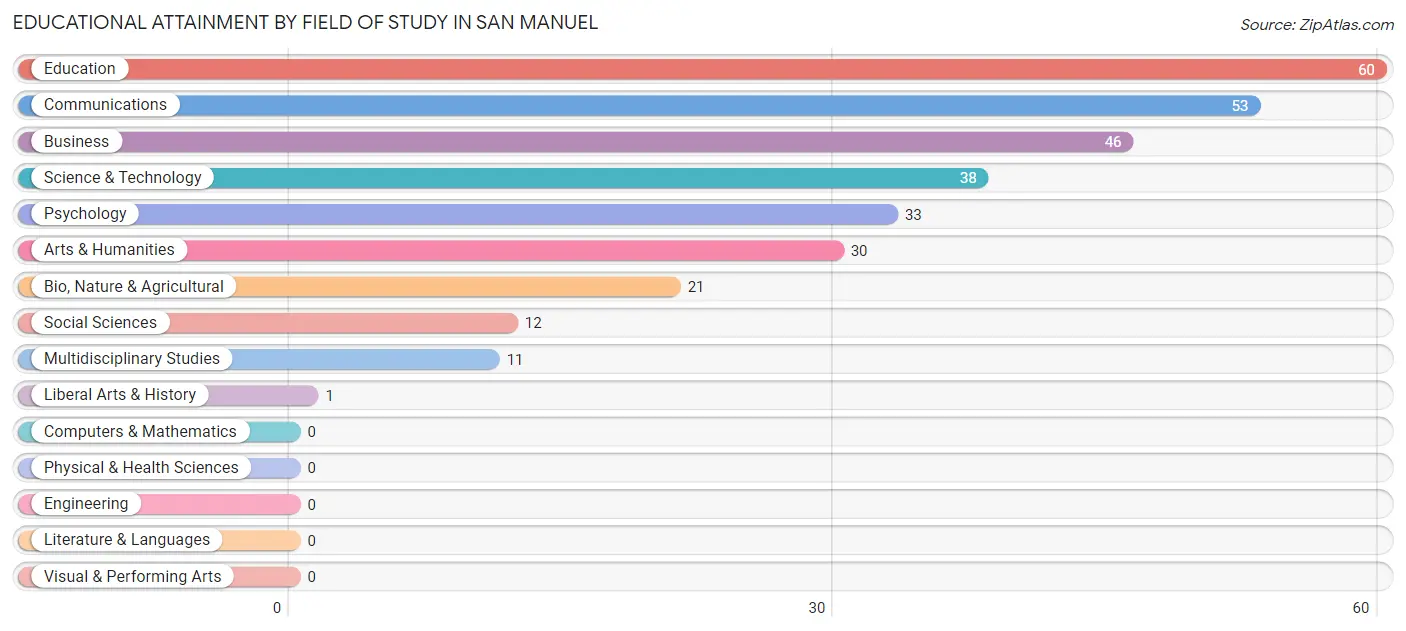
| Field of Study | # Graduates | % Graduates |
| Computers & Mathematics | 0 | 0.0% |
| Bio, Nature & Agricultural | 21 | 6.9% |
| Physical & Health Sciences | 0 | 0.0% |
| Psychology | 33 | 10.8% |
| Social Sciences | 12 | 3.9% |
| Engineering | 0 | 0.0% |
| Multidisciplinary Studies | 11 | 3.6% |
| Science & Technology | 38 | 12.5% |
| Business | 46 | 15.1% |
| Education | 60 | 19.7% |
| Literature & Languages | 0 | 0.0% |
| Liberal Arts & History | 1 | 0.3% |
| Visual & Performing Arts | 0 | 0.0% |
| Communications | 53 | 17.4% |
| Arts & Humanities | 30 | 9.8% |
| Total | 305 | 100.0% |
Transportation & Commute in San Manuel
Vehicle Availability by Sex in San Manuel
The most prevalent vehicle ownership categories in San Manuel are males with 2 vehicles (213, accounting for 29.1%) and females with 2 vehicles (204, making up 41.9%).
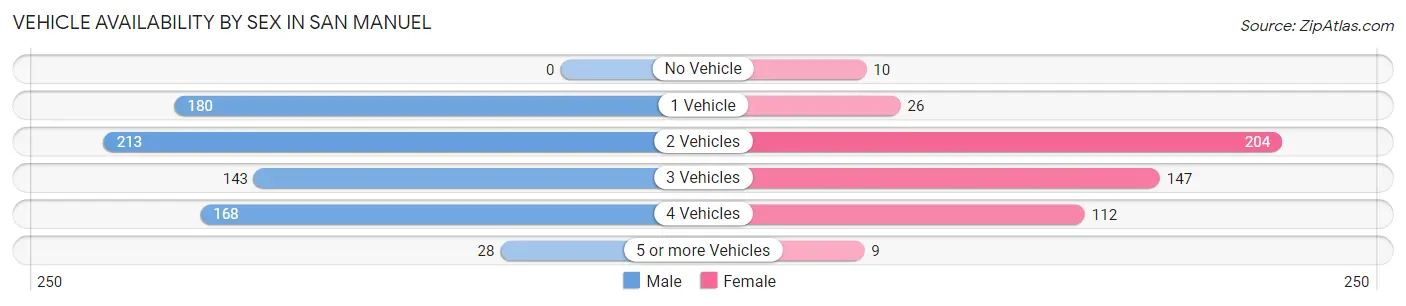
| Vehicles Available | Male | Female |
| No Vehicle | 0 (0.0%) | 10 (2.0%) |
| 1 Vehicle | 180 (24.6%) | 26 (5.1%) |
| 2 Vehicles | 213 (29.1%) | 204 (40.2%) |
| 3 Vehicles | 143 (19.5%) | 147 (28.9%) |
| 4 Vehicles | 168 (23.0%) | 112 (22.1%) |
| 5 or more Vehicles | 28 (3.8%) | 9 (1.8%) |
| Total | 732 (100.0%) | 508 (100.0%) |
Commute Time in San Manuel
The most frequently occuring commute durations in San Manuel are 45 to 59 minutes (313 commuters, 25.5%), 60 to 89 minutes (288 commuters, 23.5%), and 35 to 39 minutes (107 commuters, 8.7%).
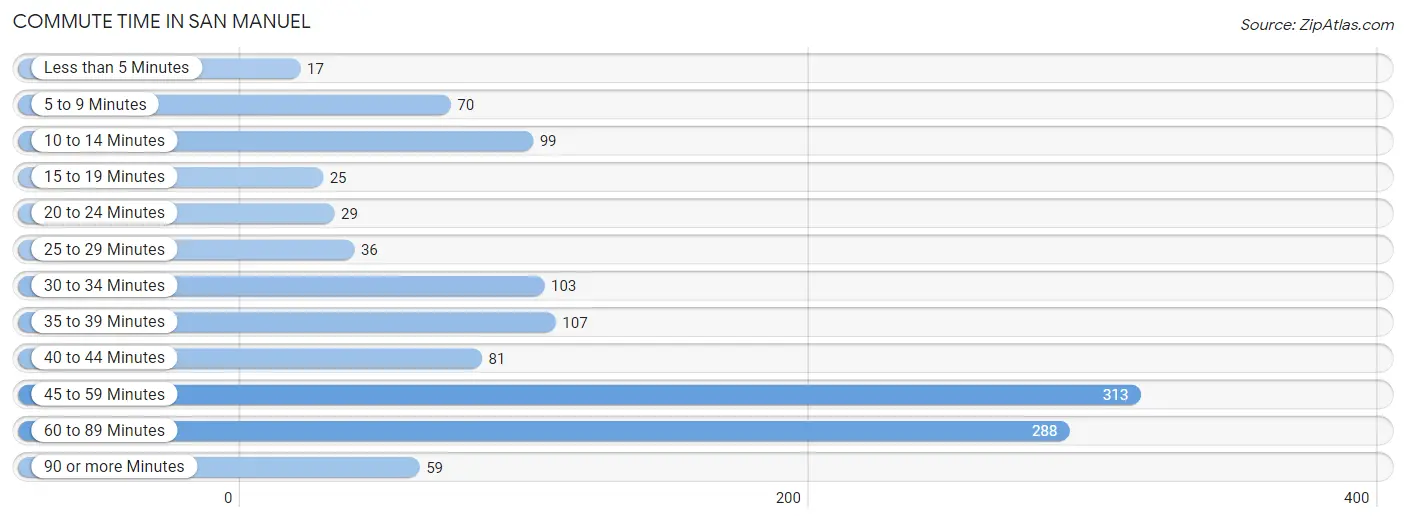
| Commute Time | # Commuters | % Commuters |
| Less than 5 Minutes | 17 | 1.4% |
| 5 to 9 Minutes | 70 | 5.7% |
| 10 to 14 Minutes | 99 | 8.1% |
| 15 to 19 Minutes | 25 | 2.0% |
| 20 to 24 Minutes | 29 | 2.4% |
| 25 to 29 Minutes | 36 | 2.9% |
| 30 to 34 Minutes | 103 | 8.4% |
| 35 to 39 Minutes | 107 | 8.7% |
| 40 to 44 Minutes | 81 | 6.6% |
| 45 to 59 Minutes | 313 | 25.5% |
| 60 to 89 Minutes | 288 | 23.5% |
| 90 or more Minutes | 59 | 4.8% |
Commute Time by Sex in San Manuel
The most common commute times in San Manuel are 60 to 89 minutes (251 commuters, 34.9%) for males and 45 to 59 minutes (178 commuters, 35.0%) for females.
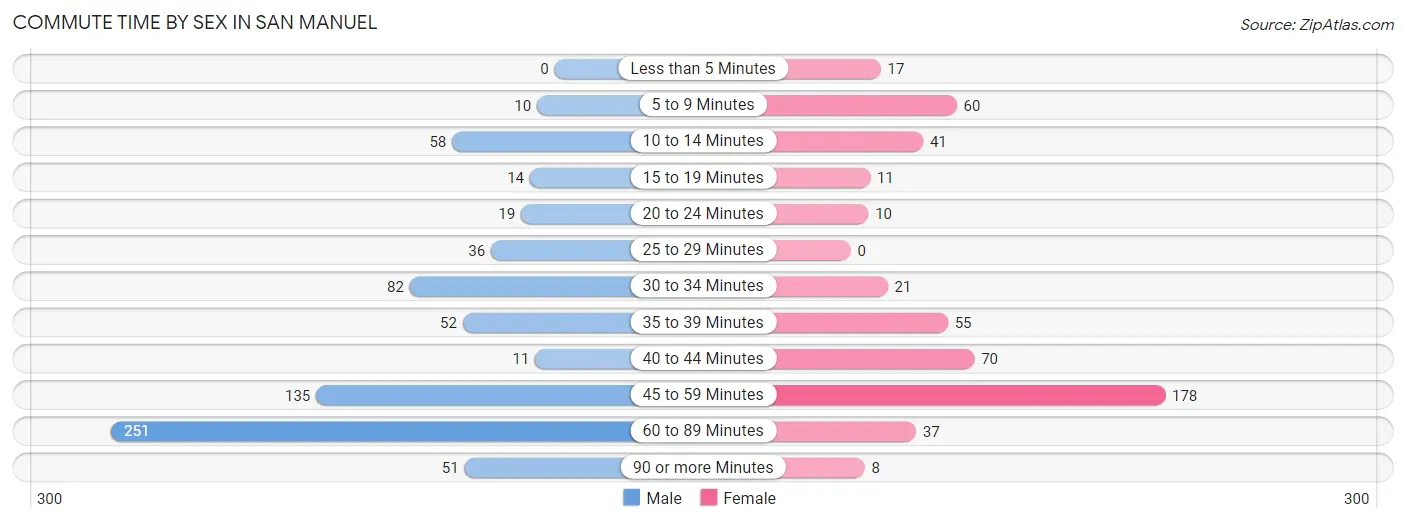
| Commute Time | Male | Female |
| Less than 5 Minutes | 0 (0.0%) | 17 (3.4%) |
| 5 to 9 Minutes | 10 (1.4%) | 60 (11.8%) |
| 10 to 14 Minutes | 58 (8.1%) | 41 (8.1%) |
| 15 to 19 Minutes | 14 (1.9%) | 11 (2.2%) |
| 20 to 24 Minutes | 19 (2.6%) | 10 (2.0%) |
| 25 to 29 Minutes | 36 (5.0%) | 0 (0.0%) |
| 30 to 34 Minutes | 82 (11.4%) | 21 (4.1%) |
| 35 to 39 Minutes | 52 (7.2%) | 55 (10.8%) |
| 40 to 44 Minutes | 11 (1.5%) | 70 (13.8%) |
| 45 to 59 Minutes | 135 (18.8%) | 178 (35.0%) |
| 60 to 89 Minutes | 251 (34.9%) | 37 (7.3%) |
| 90 or more Minutes | 51 (7.1%) | 8 (1.6%) |
Time of Departure to Work by Sex in San Manuel
The most frequent times of departure to work in San Manuel are 12:00 AM to 4:59 AM (283, 39.4%) for males and 6:30 AM to 6:59 AM (90, 17.7%) for females.
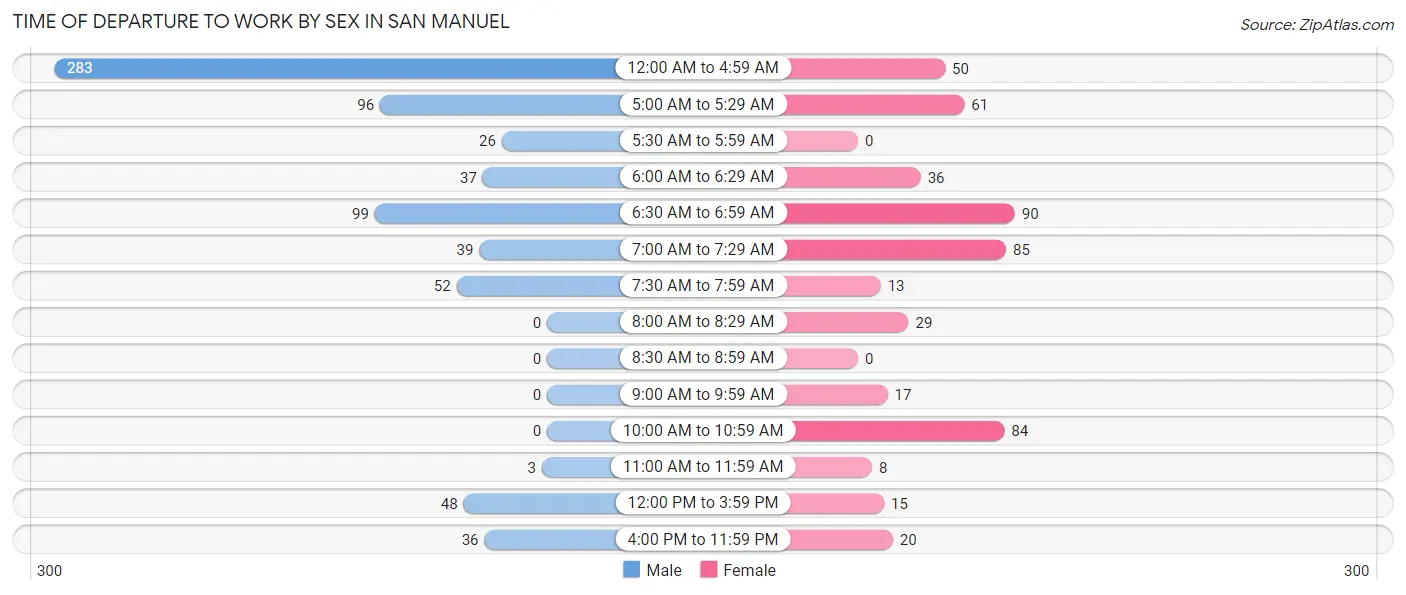
| Time of Departure | Male | Female |
| 12:00 AM to 4:59 AM | 283 (39.4%) | 50 (9.8%) |
| 5:00 AM to 5:29 AM | 96 (13.4%) | 61 (12.0%) |
| 5:30 AM to 5:59 AM | 26 (3.6%) | 0 (0.0%) |
| 6:00 AM to 6:29 AM | 37 (5.1%) | 36 (7.1%) |
| 6:30 AM to 6:59 AM | 99 (13.8%) | 90 (17.7%) |
| 7:00 AM to 7:29 AM | 39 (5.4%) | 85 (16.7%) |
| 7:30 AM to 7:59 AM | 52 (7.2%) | 13 (2.6%) |
| 8:00 AM to 8:29 AM | 0 (0.0%) | 29 (5.7%) |
| 8:30 AM to 8:59 AM | 0 (0.0%) | 0 (0.0%) |
| 9:00 AM to 9:59 AM | 0 (0.0%) | 17 (3.4%) |
| 10:00 AM to 10:59 AM | 0 (0.0%) | 84 (16.5%) |
| 11:00 AM to 11:59 AM | 3 (0.4%) | 8 (1.6%) |
| 12:00 PM to 3:59 PM | 48 (6.7%) | 15 (2.9%) |
| 4:00 PM to 11:59 PM | 36 (5.0%) | 20 (3.9%) |
| Total | 719 (100.0%) | 508 (100.0%) |
Housing Occupancy in San Manuel
Occupancy by Ownership in San Manuel
Of the total 1,626 dwellings in San Manuel, owner-occupied units account for 1,276 (78.5%), while renter-occupied units make up 350 (21.5%).
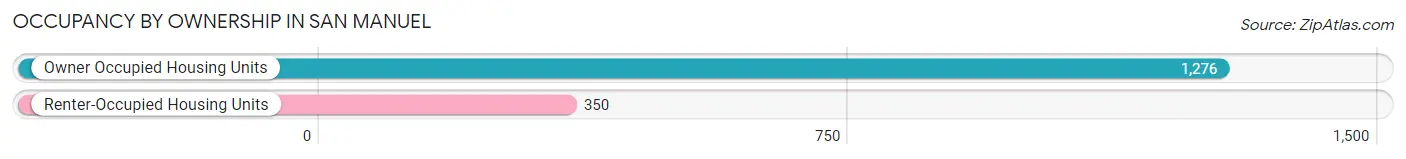
| Occupancy | # Housing Units | % Housing Units |
| Owner Occupied Housing Units | 1,276 | 78.5% |
| Renter-Occupied Housing Units | 350 | 21.5% |
| Total Occupied Housing Units | 1,626 | 100.0% |
Occupancy by Household Size in San Manuel
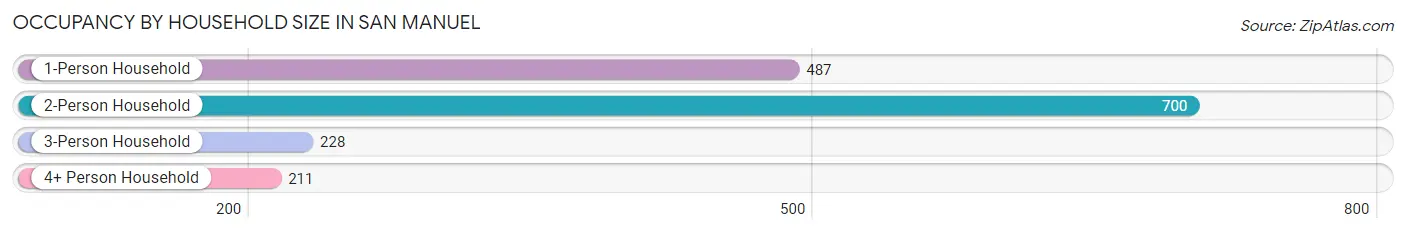
| Household Size | # Housing Units | % Housing Units |
| 1-Person Household | 487 | 29.9% |
| 2-Person Household | 700 | 43.0% |
| 3-Person Household | 228 | 14.0% |
| 4+ Person Household | 211 | 13.0% |
| Total Housing Units | 1,626 | 100.0% |
Occupancy by Ownership by Household Size in San Manuel
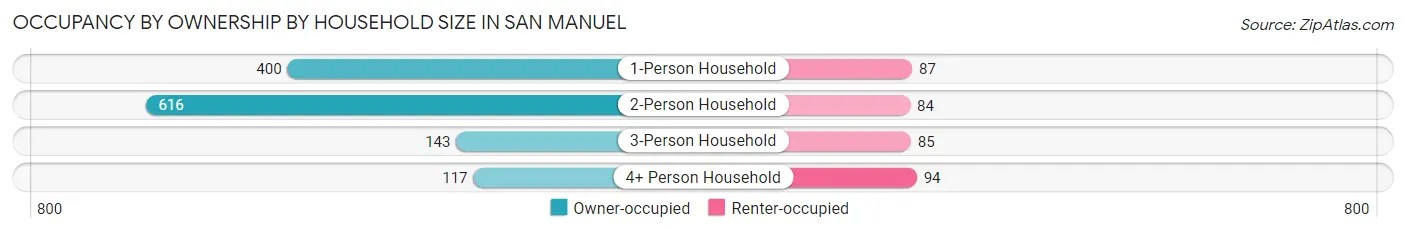
| Household Size | Owner-occupied | Renter-occupied |
| 1-Person Household | 400 (82.1%) | 87 (17.9%) |
| 2-Person Household | 616 (88.0%) | 84 (12.0%) |
| 3-Person Household | 143 (62.7%) | 85 (37.3%) |
| 4+ Person Household | 117 (55.4%) | 94 (44.6%) |
| Total Housing Units | 1,276 (78.5%) | 350 (21.5%) |
Occupancy by Educational Attainment in San Manuel
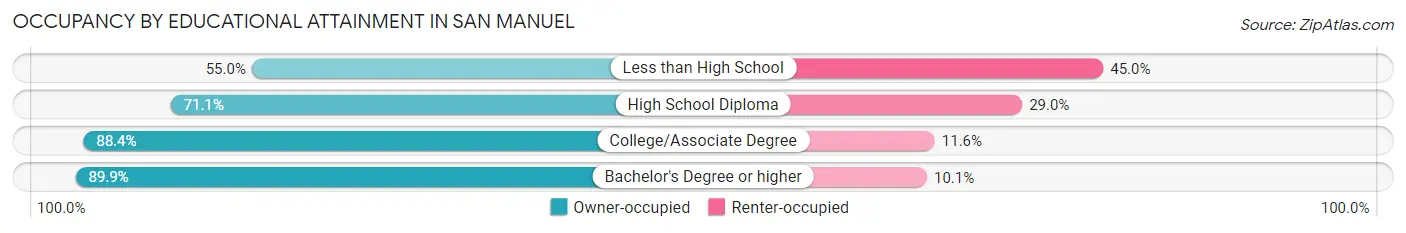
| Household Size | Owner-occupied | Renter-occupied |
| Less than High School | 105 (55.0%) | 86 (45.0%) |
| High School Diploma | 405 (71.1%) | 165 (28.9%) |
| College/Associate Degree | 668 (88.4%) | 88 (11.6%) |
| Bachelor's Degree or higher | 98 (89.9%) | 11 (10.1%) |
Occupancy by Age of Householder in San Manuel
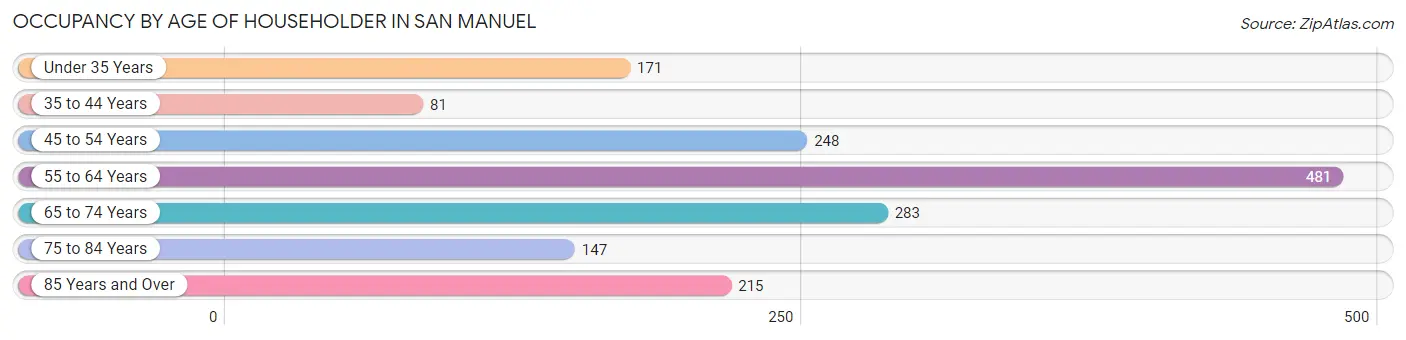
| Age Bracket | # Households | % Households |
| Under 35 Years | 171 | 10.5% |
| 35 to 44 Years | 81 | 5.0% |
| 45 to 54 Years | 248 | 15.2% |
| 55 to 64 Years | 481 | 29.6% |
| 65 to 74 Years | 283 | 17.4% |
| 75 to 84 Years | 147 | 9.0% |
| 85 Years and Over | 215 | 13.2% |
| Total | 1,626 | 100.0% |
Housing Finances in San Manuel
Median Income by Occupancy in San Manuel
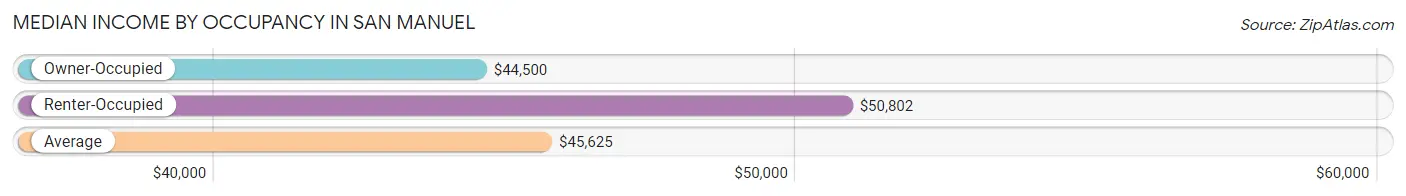
| Occupancy Type | # Households | Median Income |
| Owner-Occupied | 1,276 (78.5%) | $44,500 |
| Renter-Occupied | 350 (21.5%) | $50,802 |
| Average | 1,626 (100.0%) | $45,625 |
Occupancy by Householder Income Bracket in San Manuel
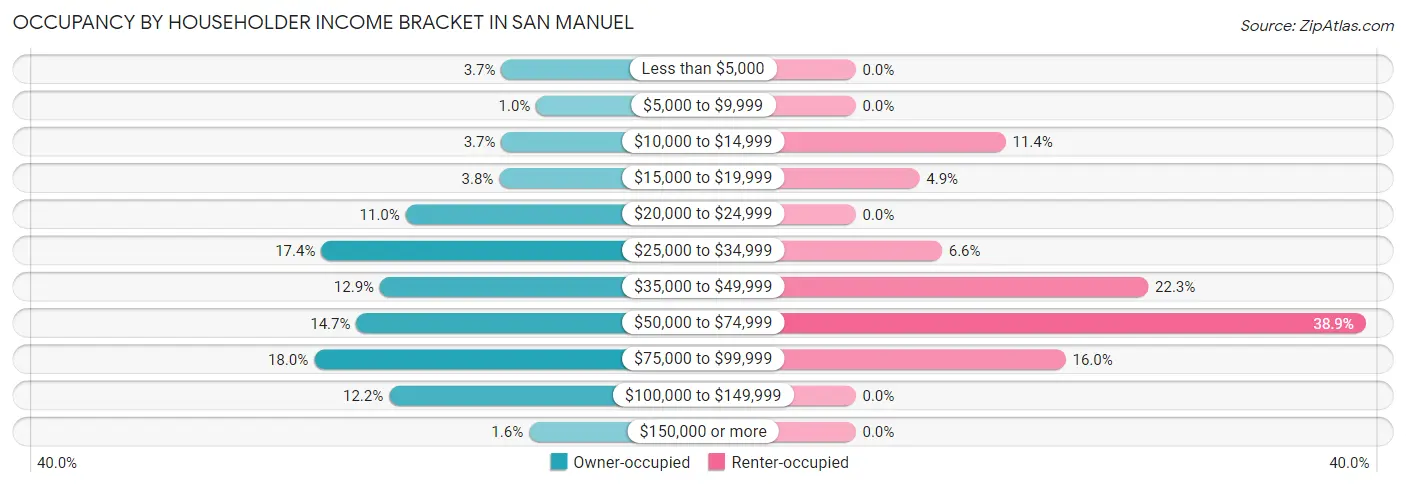
| Income Bracket | Owner-occupied | Renter-occupied |
| Less than $5,000 | 47 (3.7%) | 0 (0.0%) |
| $5,000 to $9,999 | 13 (1.0%) | 0 (0.0%) |
| $10,000 to $14,999 | 47 (3.7%) | 40 (11.4%) |
| $15,000 to $19,999 | 49 (3.8%) | 17 (4.9%) |
| $20,000 to $24,999 | 140 (11.0%) | 0 (0.0%) |
| $25,000 to $34,999 | 222 (17.4%) | 23 (6.6%) |
| $35,000 to $49,999 | 165 (12.9%) | 78 (22.3%) |
| $50,000 to $74,999 | 188 (14.7%) | 136 (38.9%) |
| $75,000 to $99,999 | 229 (17.9%) | 56 (16.0%) |
| $100,000 to $149,999 | 156 (12.2%) | 0 (0.0%) |
| $150,000 or more | 20 (1.6%) | 0 (0.0%) |
| Total | 1,276 (100.0%) | 350 (100.0%) |
Monthly Housing Cost Tiers in San Manuel
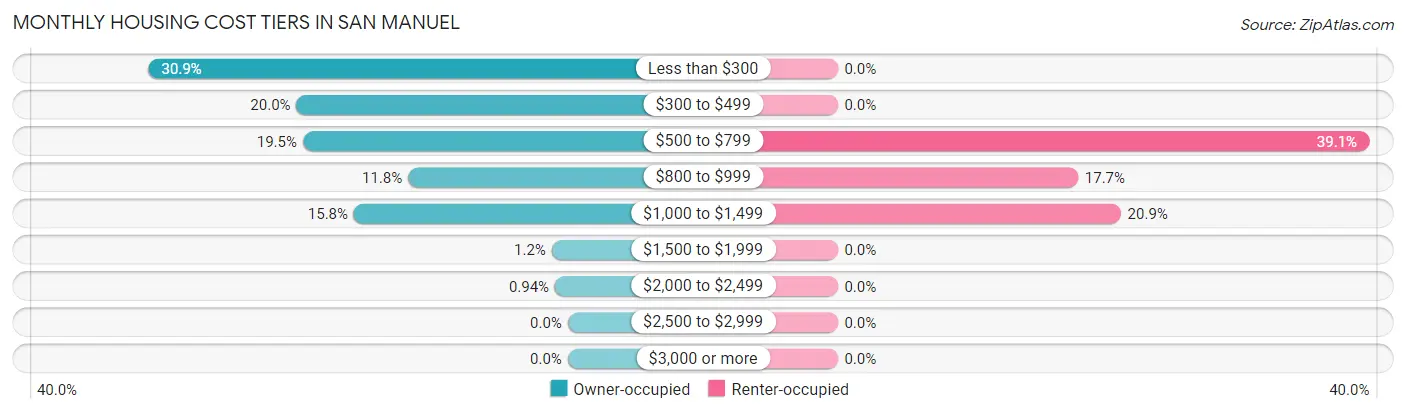
| Monthly Cost | Owner-occupied | Renter-occupied |
| Less than $300 | 394 (30.9%) | 0 (0.0%) |
| $300 to $499 | 255 (20.0%) | 0 (0.0%) |
| $500 to $799 | 249 (19.5%) | 137 (39.1%) |
| $800 to $999 | 150 (11.8%) | 62 (17.7%) |
| $1,000 to $1,499 | 201 (15.8%) | 73 (20.9%) |
| $1,500 to $1,999 | 15 (1.2%) | 0 (0.0%) |
| $2,000 to $2,499 | 12 (0.9%) | 0 (0.0%) |
| $2,500 to $2,999 | 0 (0.0%) | 0 (0.0%) |
| $3,000 or more | 0 (0.0%) | 0 (0.0%) |
| Total | 1,276 (100.0%) | 350 (100.0%) |
Physical Housing Characteristics in San Manuel
Housing Structures in San Manuel
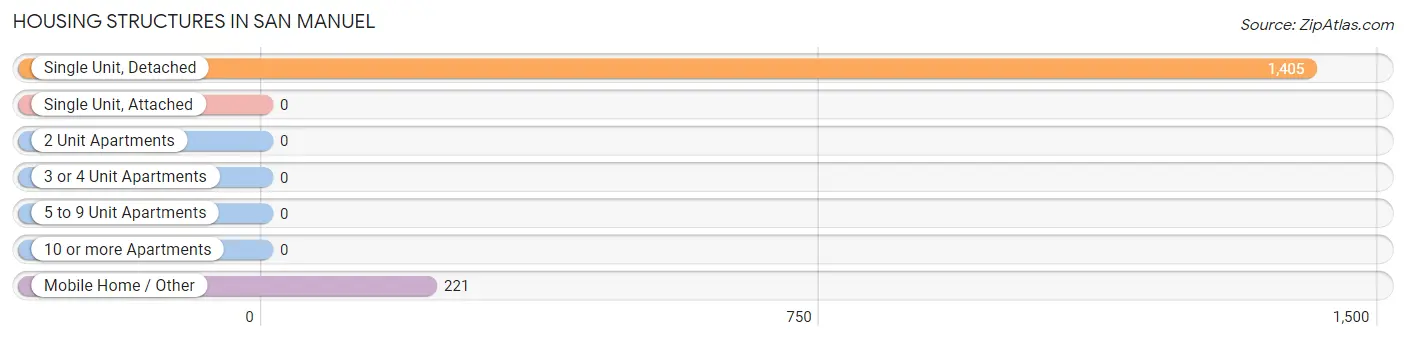
| Structure Type | # Housing Units | % Housing Units |
| Single Unit, Detached | 1,405 | 86.4% |
| Single Unit, Attached | 0 | 0.0% |
| 2 Unit Apartments | 0 | 0.0% |
| 3 or 4 Unit Apartments | 0 | 0.0% |
| 5 to 9 Unit Apartments | 0 | 0.0% |
| 10 or more Apartments | 0 | 0.0% |
| Mobile Home / Other | 221 | 13.6% |
| Total | 1,626 | 100.0% |
Housing Structures by Occupancy in San Manuel
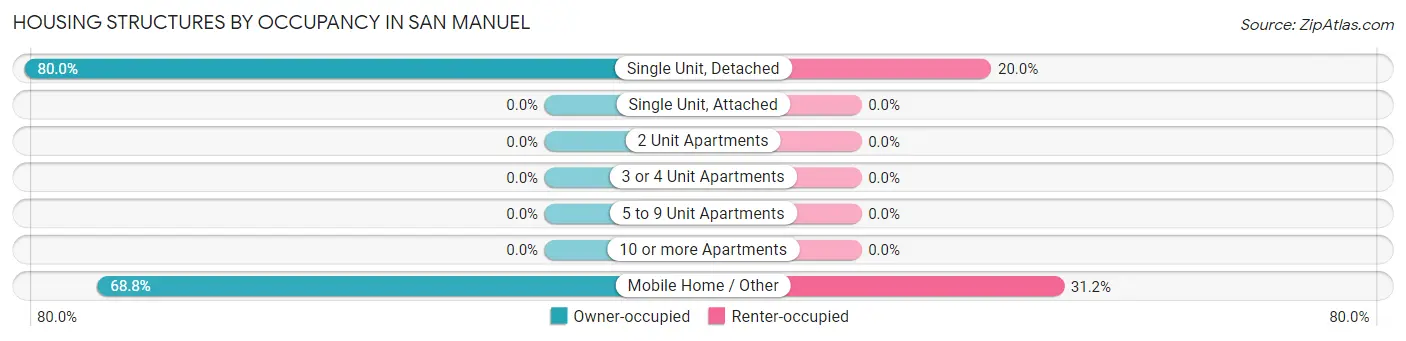
| Structure Type | Owner-occupied | Renter-occupied |
| Single Unit, Detached | 1,124 (80.0%) | 281 (20.0%) |
| Single Unit, Attached | 0 (0.0%) | 0 (0.0%) |
| 2 Unit Apartments | 0 (0.0%) | 0 (0.0%) |
| 3 or 4 Unit Apartments | 0 (0.0%) | 0 (0.0%) |
| 5 to 9 Unit Apartments | 0 (0.0%) | 0 (0.0%) |
| 10 or more Apartments | 0 (0.0%) | 0 (0.0%) |
| Mobile Home / Other | 152 (68.8%) | 69 (31.2%) |
| Total | 1,276 (78.5%) | 350 (21.5%) |
Housing Structures by Number of Rooms in San Manuel
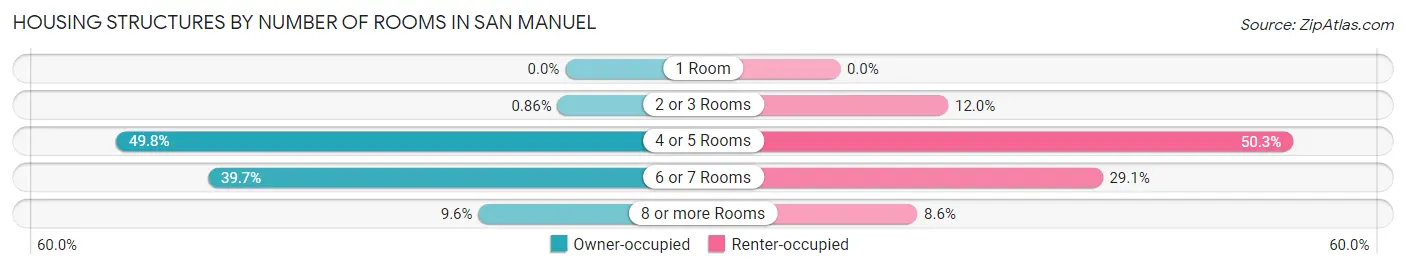
| Number of Rooms | Owner-occupied | Renter-occupied |
| 1 Room | 0 (0.0%) | 0 (0.0%) |
| 2 or 3 Rooms | 11 (0.9%) | 42 (12.0%) |
| 4 or 5 Rooms | 636 (49.8%) | 176 (50.3%) |
| 6 or 7 Rooms | 506 (39.7%) | 102 (29.1%) |
| 8 or more Rooms | 123 (9.6%) | 30 (8.6%) |
| Total | 1,276 (100.0%) | 350 (100.0%) |
Housing Structure by Heating Type in San Manuel
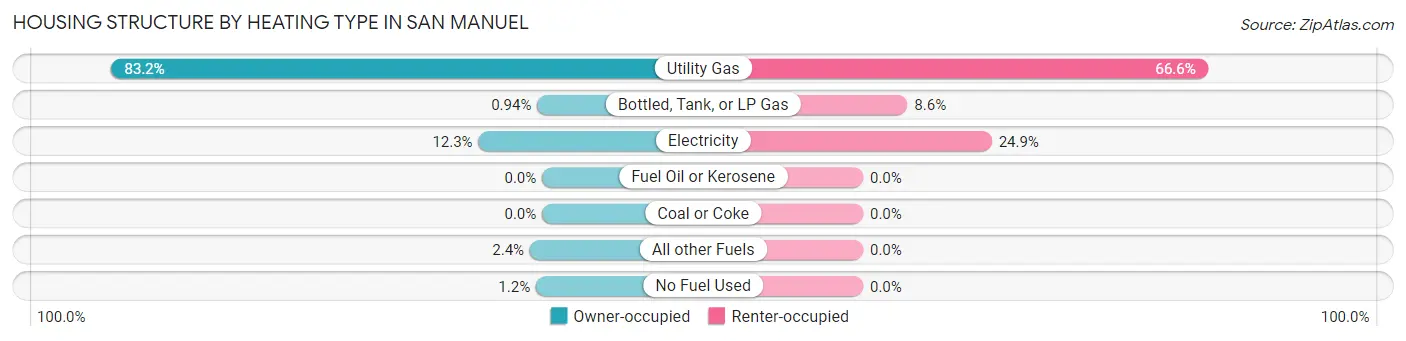
| Heating Type | Owner-occupied | Renter-occupied |
| Utility Gas | 1,062 (83.2%) | 233 (66.6%) |
| Bottled, Tank, or LP Gas | 12 (0.9%) | 30 (8.6%) |
| Electricity | 157 (12.3%) | 87 (24.9%) |
| Fuel Oil or Kerosene | 0 (0.0%) | 0 (0.0%) |
| Coal or Coke | 0 (0.0%) | 0 (0.0%) |
| All other Fuels | 30 (2.4%) | 0 (0.0%) |
| No Fuel Used | 15 (1.2%) | 0 (0.0%) |
| Total | 1,276 (100.0%) | 350 (100.0%) |
Household Vehicle Usage in San Manuel
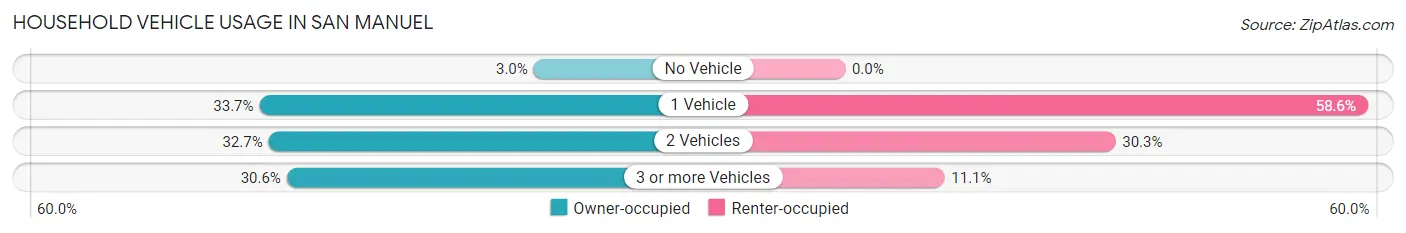
| Vehicles per Household | Owner-occupied | Renter-occupied |
| No Vehicle | 38 (3.0%) | 0 (0.0%) |
| 1 Vehicle | 430 (33.7%) | 205 (58.6%) |
| 2 Vehicles | 417 (32.7%) | 106 (30.3%) |
| 3 or more Vehicles | 391 (30.6%) | 39 (11.1%) |
| Total | 1,276 (100.0%) | 350 (100.0%) |
Real Estate & Mortgages in San Manuel
Real Estate and Mortgage Overview in San Manuel
| Characteristic | Without Mortgage | With Mortgage |
| Housing Units | 757 | 519 |
| Median Property Value | $74,000 | $109,700 |
| Median Household Income | $30,792 | $8 |
| Monthly Housing Costs | $295 | $0 |
| Real Estate Taxes | $630 | $20 |
Property Value by Mortgage Status in San Manuel
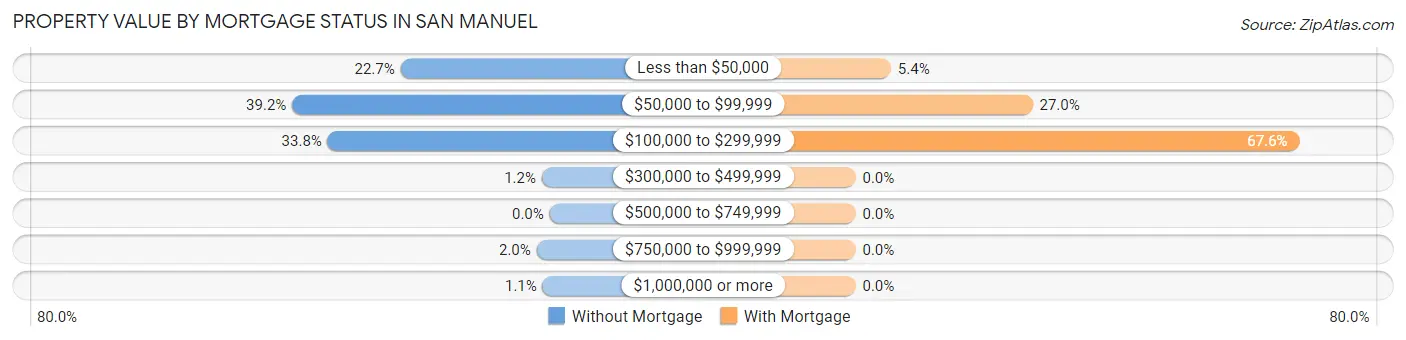
| Property Value | Without Mortgage | With Mortgage |
| Less than $50,000 | 172 (22.7%) | 28 (5.4%) |
| $50,000 to $99,999 | 297 (39.2%) | 140 (27.0%) |
| $100,000 to $299,999 | 256 (33.8%) | 351 (67.6%) |
| $300,000 to $499,999 | 9 (1.2%) | 0 (0.0%) |
| $500,000 to $749,999 | 0 (0.0%) | 0 (0.0%) |
| $750,000 to $999,999 | 15 (2.0%) | 0 (0.0%) |
| $1,000,000 or more | 8 (1.1%) | 0 (0.0%) |
| Total | 757 (100.0%) | 519 (100.0%) |
Household Income by Mortgage Status in San Manuel
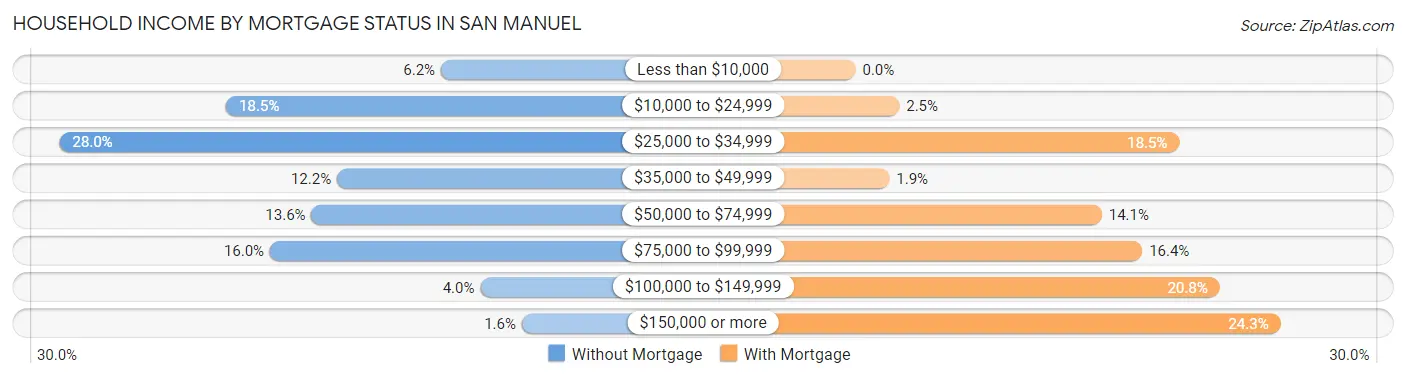
| Household Income | Without Mortgage | With Mortgage |
| Less than $10,000 | 47 (6.2%) | 0 (0.0%) |
| $10,000 to $24,999 | 140 (18.5%) | 13 (2.5%) |
| $25,000 to $34,999 | 212 (28.0%) | 96 (18.5%) |
| $35,000 to $49,999 | 92 (12.1%) | 10 (1.9%) |
| $50,000 to $74,999 | 103 (13.6%) | 73 (14.1%) |
| $75,000 to $99,999 | 121 (16.0%) | 85 (16.4%) |
| $100,000 to $149,999 | 30 (4.0%) | 108 (20.8%) |
| $150,000 or more | 12 (1.6%) | 126 (24.3%) |
| Total | 757 (100.0%) | 519 (100.0%) |
Property Value to Household Income Ratio in San Manuel
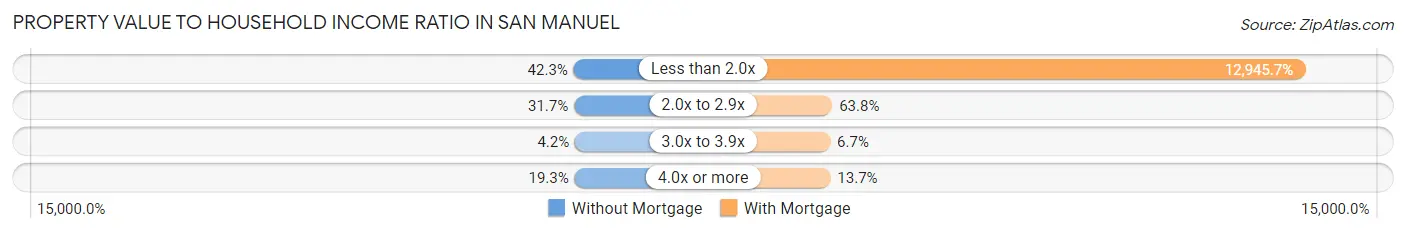
| Value-to-Income Ratio | Without Mortgage | With Mortgage |
| Less than 2.0x | 320 (42.3%) | 67,188 (12,945.7%) |
| 2.0x to 2.9x | 240 (31.7%) | 331 (63.8%) |
| 3.0x to 3.9x | 32 (4.2%) | 35 (6.7%) |
| 4.0x or more | 146 (19.3%) | 71 (13.7%) |
| Total | 757 (100.0%) | 519 (100.0%) |
Real Estate Taxes by Mortgage Status in San Manuel
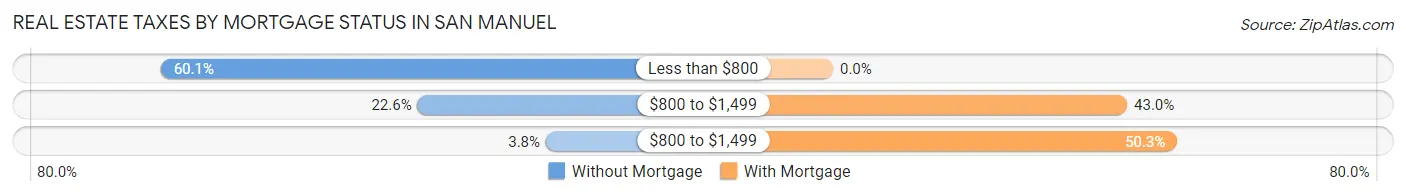
| Property Taxes | Without Mortgage | With Mortgage |
| Less than $800 | 455 (60.1%) | 0 (0.0%) |
| $800 to $1,499 | 171 (22.6%) | 223 (43.0%) |
| $800 to $1,499 | 29 (3.8%) | 261 (50.3%) |
| Total | 757 (100.0%) | 519 (100.0%) |
Health & Disability in San Manuel
Health Insurance Coverage by Age in San Manuel
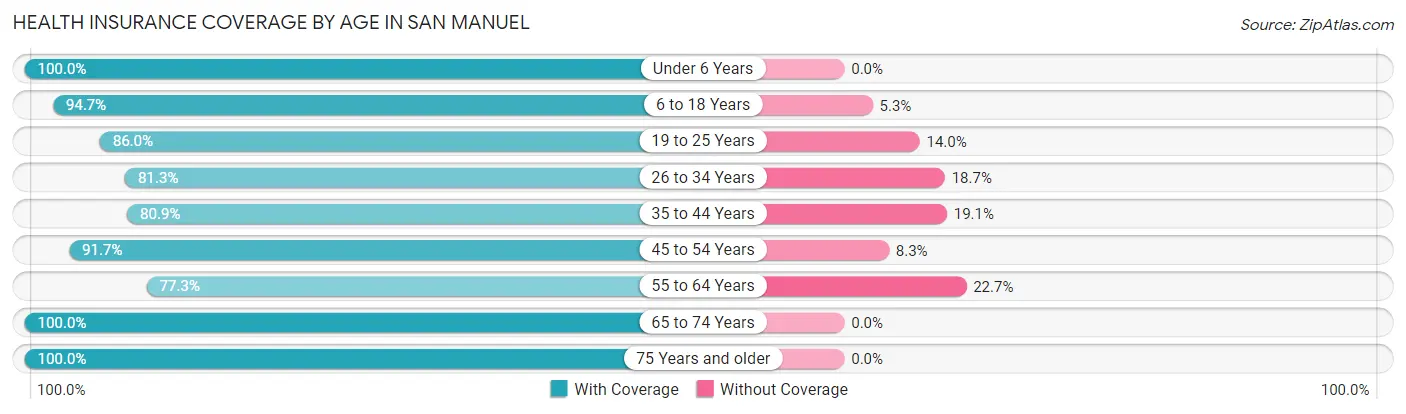
| Age Bracket | With Coverage | Without Coverage |
| Under 6 Years | 158 (100.0%) | 0 (0.0%) |
| 6 to 18 Years | 359 (94.7%) | 20 (5.3%) |
| 19 to 25 Years | 190 (86.0%) | 31 (14.0%) |
| 26 to 34 Years | 321 (81.3%) | 74 (18.7%) |
| 35 to 44 Years | 220 (80.9%) | 52 (19.1%) |
| 45 to 54 Years | 375 (91.7%) | 34 (8.3%) |
| 55 to 64 Years | 581 (77.3%) | 171 (22.7%) |
| 65 to 74 Years | 396 (100.0%) | 0 (0.0%) |
| 75 Years and older | 553 (100.0%) | 0 (0.0%) |
| Total | 3,153 (89.2%) | 382 (10.8%) |
Health Insurance Coverage by Citizenship Status in San Manuel
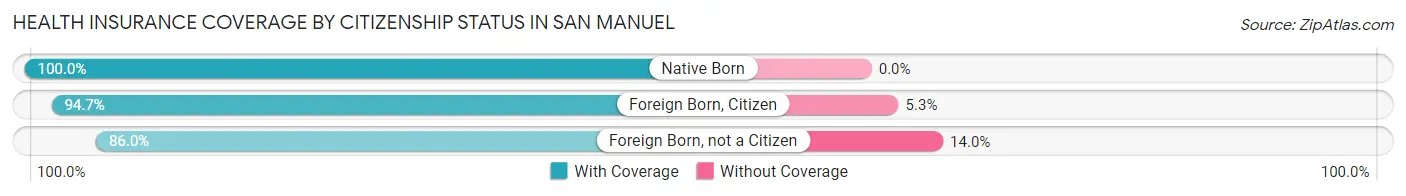
| Citizenship Status | With Coverage | Without Coverage |
| Native Born | 158 (100.0%) | 0 (0.0%) |
| Foreign Born, Citizen | 359 (94.7%) | 20 (5.3%) |
| Foreign Born, not a Citizen | 190 (86.0%) | 31 (14.0%) |
Health Insurance Coverage by Household Income in San Manuel
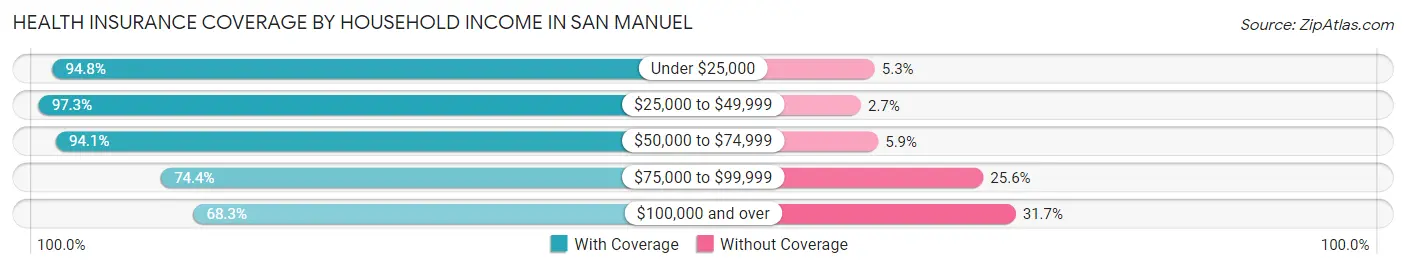
| Household Income | With Coverage | Without Coverage |
| Under $25,000 | 650 (94.8%) | 36 (5.2%) |
| $25,000 to $49,999 | 986 (97.3%) | 27 (2.7%) |
| $50,000 to $74,999 | 814 (94.1%) | 51 (5.9%) |
| $75,000 to $99,999 | 468 (74.4%) | 161 (25.6%) |
| $100,000 and over | 231 (68.3%) | 107 (31.7%) |
Public vs Private Health Insurance Coverage by Age in San Manuel
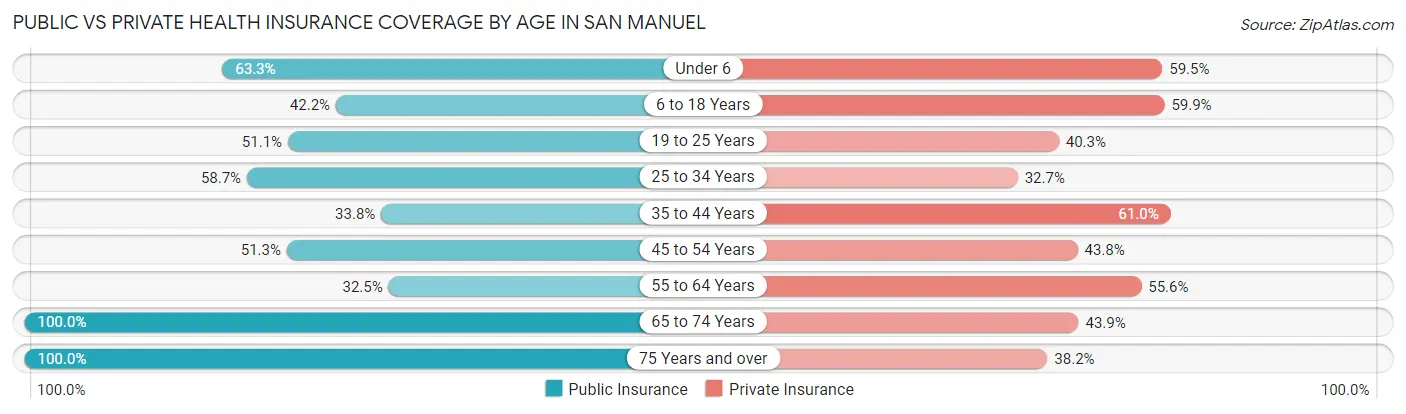
| Age Bracket | Public Insurance | Private Insurance |
| Under 6 | 100 (63.3%) | 94 (59.5%) |
| 6 to 18 Years | 160 (42.2%) | 227 (59.9%) |
| 19 to 25 Years | 113 (51.1%) | 89 (40.3%) |
| 25 to 34 Years | 232 (58.7%) | 129 (32.7%) |
| 35 to 44 Years | 92 (33.8%) | 166 (61.0%) |
| 45 to 54 Years | 210 (51.3%) | 179 (43.8%) |
| 55 to 64 Years | 244 (32.5%) | 418 (55.6%) |
| 65 to 74 Years | 396 (100.0%) | 174 (43.9%) |
| 75 Years and over | 553 (100.0%) | 211 (38.2%) |
| Total | 2,100 (59.4%) | 1,687 (47.7%) |
Disability Status by Sex by Age in San Manuel
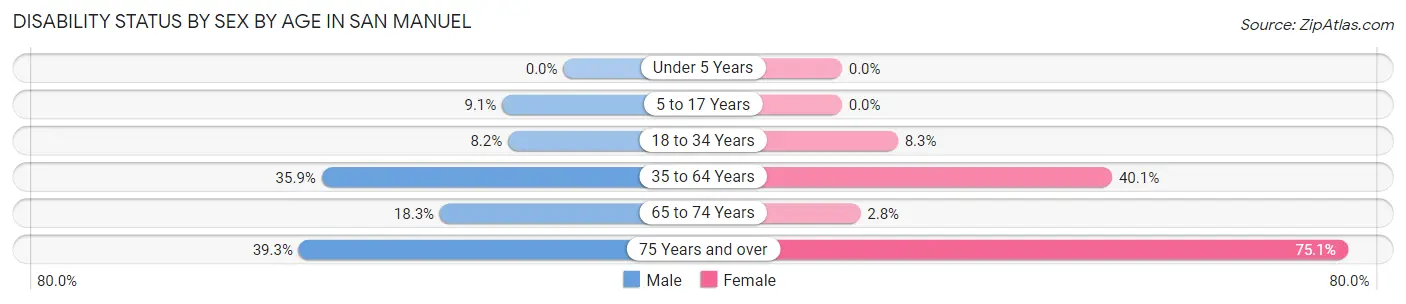
| Age Bracket | Male | Female |
| Under 5 Years | 0 (0.0%) | 0 (0.0%) |
| 5 to 17 Years | 19 (9.1%) | 0 (0.0%) |
| 18 to 34 Years | 33 (8.2%) | 21 (8.3%) |
| 35 to 64 Years | 271 (35.9%) | 272 (40.1%) |
| 65 to 74 Years | 46 (18.3%) | 4 (2.8%) |
| 75 Years and over | 110 (39.3%) | 205 (75.1%) |
Disability Class by Sex by Age in San Manuel
Disability Class: Hearing Difficulty
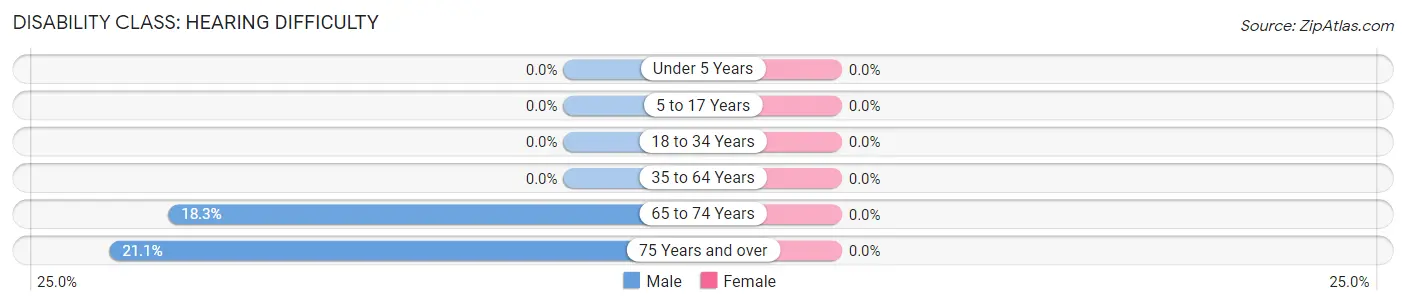
| Age Bracket | Male | Female |
| Under 5 Years | 0 (0.0%) | 0 (0.0%) |
| 5 to 17 Years | 0 (0.0%) | 0 (0.0%) |
| 18 to 34 Years | 0 (0.0%) | 0 (0.0%) |
| 35 to 64 Years | 0 (0.0%) | 0 (0.0%) |
| 65 to 74 Years | 46 (18.3%) | 0 (0.0%) |
| 75 Years and over | 59 (21.1%) | 0 (0.0%) |
Disability Class: Vision Difficulty
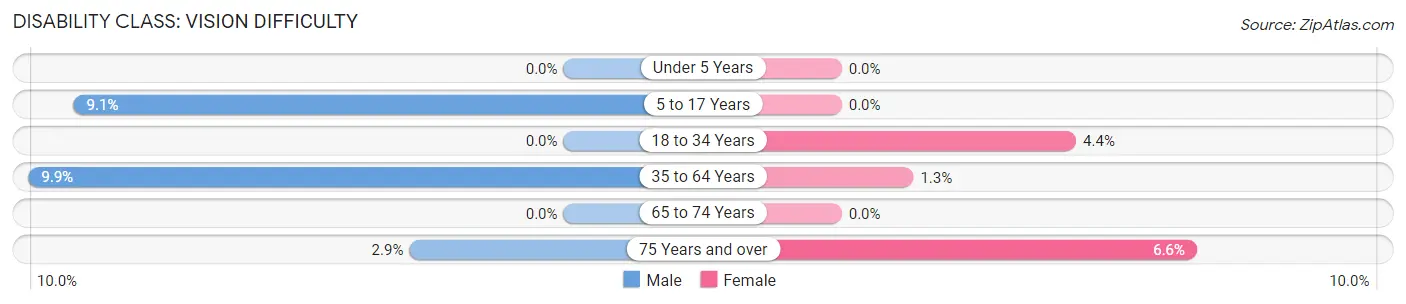
| Age Bracket | Male | Female |
| Under 5 Years | 0 (0.0%) | 0 (0.0%) |
| 5 to 17 Years | 19 (9.1%) | 0 (0.0%) |
| 18 to 34 Years | 0 (0.0%) | 11 (4.3%) |
| 35 to 64 Years | 75 (9.9%) | 9 (1.3%) |
| 65 to 74 Years | 0 (0.0%) | 0 (0.0%) |
| 75 Years and over | 8 (2.9%) | 18 (6.6%) |
Disability Class: Cognitive Difficulty
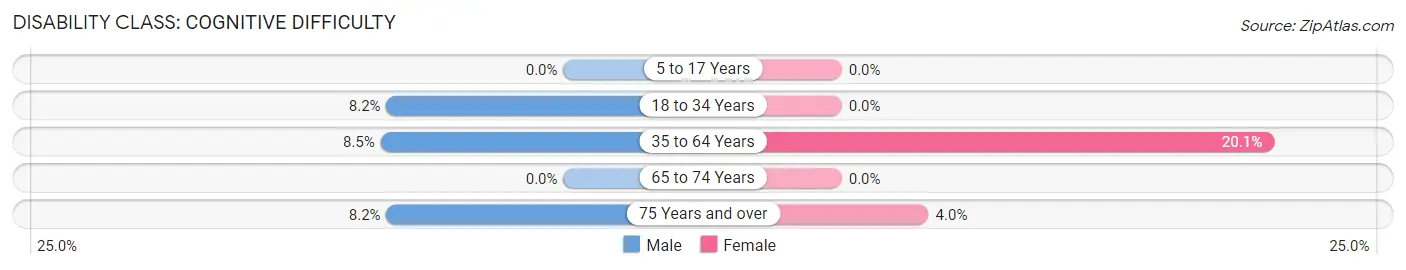
| Age Bracket | Male | Female |
| 5 to 17 Years | 0 (0.0%) | 0 (0.0%) |
| 18 to 34 Years | 33 (8.2%) | 0 (0.0%) |
| 35 to 64 Years | 64 (8.5%) | 136 (20.1%) |
| 65 to 74 Years | 0 (0.0%) | 0 (0.0%) |
| 75 Years and over | 23 (8.2%) | 11 (4.0%) |
Disability Class: Ambulatory Difficulty
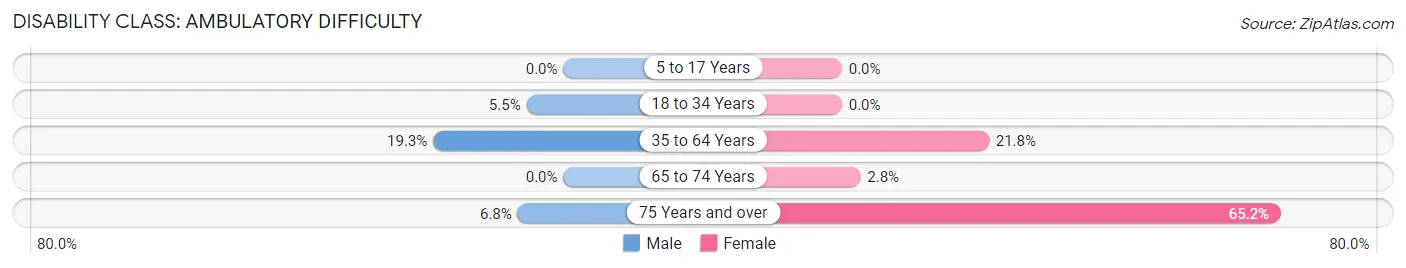
| Age Bracket | Male | Female |
| 5 to 17 Years | 0 (0.0%) | 0 (0.0%) |
| 18 to 34 Years | 22 (5.5%) | 0 (0.0%) |
| 35 to 64 Years | 146 (19.3%) | 148 (21.8%) |
| 65 to 74 Years | 0 (0.0%) | 4 (2.8%) |
| 75 Years and over | 19 (6.8%) | 178 (65.2%) |
Disability Class: Self-Care Difficulty
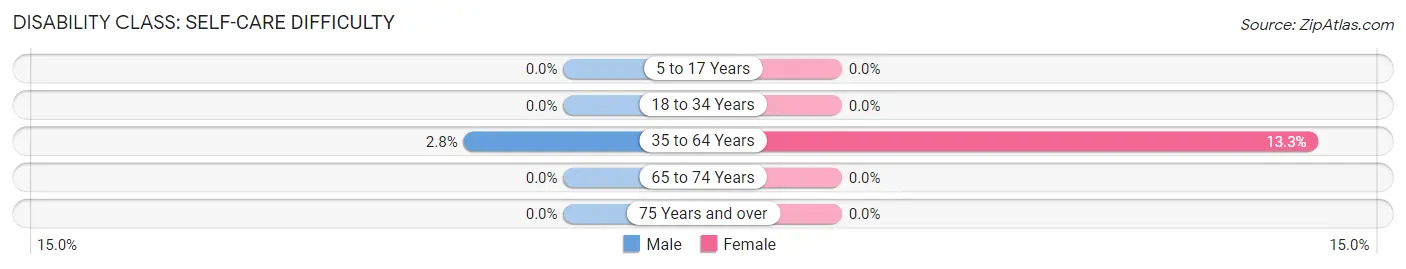
| Age Bracket | Male | Female |
| 5 to 17 Years | 0 (0.0%) | 0 (0.0%) |
| 18 to 34 Years | 0 (0.0%) | 0 (0.0%) |
| 35 to 64 Years | 21 (2.8%) | 90 (13.3%) |
| 65 to 74 Years | 0 (0.0%) | 0 (0.0%) |
| 75 Years and over | 0 (0.0%) | 0 (0.0%) |
Technology Access in San Manuel
Computing Device Access in San Manuel
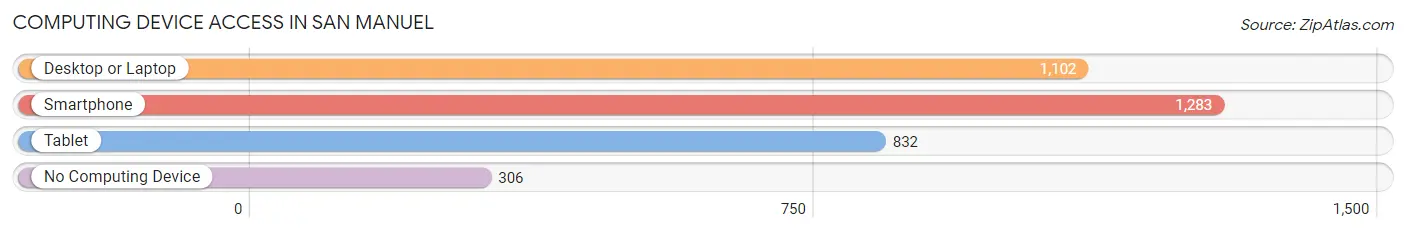
| Device Type | # Households | % Households |
| Desktop or Laptop | 1,102 | 67.8% |
| Smartphone | 1,283 | 78.9% |
| Tablet | 832 | 51.2% |
| No Computing Device | 306 | 18.8% |
| Total | 1,626 | 100.0% |
Internet Access in San Manuel
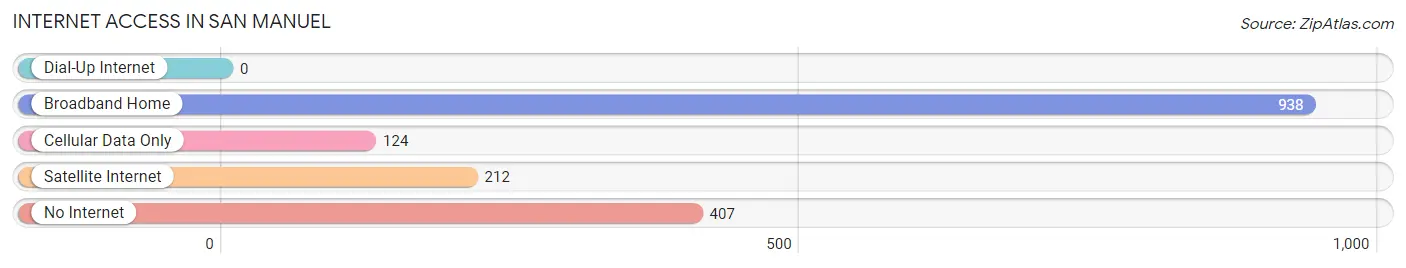
| Internet Type | # Households | % Households |
| Dial-Up Internet | 0 | 0.0% |
| Broadband Home | 938 | 57.7% |
| Cellular Data Only | 124 | 7.6% |
| Satellite Internet | 212 | 13.0% |
| No Internet | 407 | 25.0% |
| Total | 1,626 | 100.0% |
San Manuel Summary
San Manuel, Arizona is a small town located in Pinal County, Arizona. It is situated in the foothills of the Santa Catalina Mountains, approximately 30 miles northeast of Tucson. The town was founded in the late 1800s and has a population of approximately 3,000 people.
History
San Manuel was founded in 1881 by a group of miners who were searching for silver and copper. The town was named after Manuel Elias, a Mexican miner who was the first to discover the ore deposits in the area. The town quickly grew and by the early 1900s, it had become a bustling mining town with a population of over 1,000 people.
The town was home to several mines, including the San Manuel Copper Mine, which was the largest copper mine in the world at the time. The mine was owned by the San Manuel Mining Company, which was founded in 1906. The company was responsible for the construction of the San Manuel Railroad, which connected the town to Tucson and other nearby towns.
The town experienced a period of decline in the mid-1900s as the mining industry began to decline. The San Manuel Copper Mine closed in the 1950s and the town’s population began to dwindle. In the late 1970s, the town was revitalized when the San Manuel Indian Reservation was established. The reservation is home to the Tohono O’odham Nation, which is the second largest Native American tribe in the United States.
Geography
San Manuel is located in the foothills of the Santa Catalina Mountains, approximately 30 miles northeast of Tucson. The town is situated at an elevation of 2,400 feet and is surrounded by desert and mountain terrain. The town is located in the Sonoran Desert, which is characterized by hot, dry summers and mild winters.
The town is located in the San Pedro Valley, which is a major agricultural region in Arizona. The valley is home to a variety of crops, including cotton, alfalfa, and citrus fruits. The valley is also home to several ranches, which are used for cattle and horse breeding.
Economy
San Manuel’s economy is largely based on agriculture and tourism. The town is home to several farms and ranches, which produce a variety of crops and livestock. The town is also home to several tourist attractions, including the San Manuel Indian Reservation, which is home to the Tohono O’odham Nation.
The town is also home to several businesses, including restaurants, retail stores, and hotels. The town is also home to several manufacturing companies, which produce a variety of products, including furniture, clothing, and electronics.
Demographics
As of the 2010 census, the population of San Manuel was 3,037. The town is predominantly Hispanic, with over 90% of the population identifying as Hispanic or Latino. The town is also home to a small Native American population, with approximately 5% of the population identifying as Native American.
The median household income in San Manuel is $35,000, which is lower than the national average. The town has a poverty rate of 22%, which is higher than the national average. The town also has a high unemployment rate, with approximately 10% of the population unemployed.
Conclusion
San Manuel, Arizona is a small town located in Pinal County, Arizona. It was founded in the late 1800s and has a population of approximately 3,000 people. The town’s economy is largely based on agriculture and tourism, and it is home to several tourist attractions, including the San Manuel Indian Reservation. The town is predominantly Hispanic, with over 90% of the population identifying as Hispanic or Latino. The town has a median household income of $35,000 and a poverty rate of 22%.
Common Questions
What is Per Capita Income in San Manuel?
Per Capita income in San Manuel is $24,772.
What is the Median Family Income in San Manuel?
Median Family Income in San Manuel is $47,188.
What is the Median Household income in San Manuel?
Median Household Income in San Manuel is $45,625.
What is Income or Wage Gap in San Manuel?
Income or Wage Gap in San Manuel is 48.2%.
Women in San Manuel earn 51.8 cents for every dollar earned by a man.
What is Inequality or Gini Index in San Manuel?
Inequality or Gini Index in San Manuel is 0.36.
What is the Total Population of San Manuel?
Total Population of San Manuel is 3,535.
What is the Total Male Population of San Manuel?
Total Male Population of San Manuel is 1,967.
What is the Total Female Population of San Manuel?
Total Female Population of San Manuel is 1,568.
What is the Ratio of Males per 100 Females in San Manuel?
There are 125.45 Males per 100 Females in San Manuel.
What is the Ratio of Females per 100 Males in San Manuel?
There are 79.72 Females per 100 Males in San Manuel.
What is the Median Population Age in San Manuel?
Median Population Age in San Manuel is 52.5 Years.
What is the Average Family Size in San Manuel
Average Family Size in San Manuel is 2.5 People.
What is the Average Household Size in San Manuel
Average Household Size in San Manuel is 2.2 People.
How Large is the Labor Force in San Manuel?
There are 1,418 People in the Labor Forcein in San Manuel.
What is the Percentage of People in the Labor Force in San Manuel?
46.1% of People are in the Labor Force in San Manuel.
What is the Unemployment Rate in San Manuel?
Unemployment Rate in San Manuel is 9.9%.