Rio Rico, AZ Map & Demographics
Rio Rico Map
Rio Rico Overview
$25,168
PER CAPITA INCOME
$68,680
AVG FAMILY INCOME
$62,537
AVG HOUSEHOLD INCOME
11.5%
WAGE / INCOME GAP [ % ]
88.5¢/ $1
WAGE / INCOME GAP [ $ ]
0.39
INEQUALITY / GINI INDEX
21,447
TOTAL POPULATION
10,525
MALE POPULATION
10,922
FEMALE POPULATION
96.37
MALES / 100 FEMALES
103.77
FEMALES / 100 MALES
33.8
MEDIAN AGE
3.5
AVG FAMILY SIZE
3.1
AVG HOUSEHOLD SIZE
9,915
LABOR FORCE [ PEOPLE ]
64.3%
PERCENT IN LABOR FORCE
7.7%
UNEMPLOYMENT RATE
Rio Rico Zip Codes
Rio Rico Area Codes
Income in Rio Rico
Income Overview in Rio Rico
Per Capita Income in Rio Rico is $25,168, while median incomes of families and households are $68,680 and $62,537 respectively.
| Characteristic | Number | Measure |
| Per Capita Income | 21,447 | $25,168 |
| Median Family Income | 5,506 | $68,680 |
| Mean Family Income | 5,506 | $81,161 |
| Median Household Income | 6,809 | $62,537 |
| Mean Household Income | 6,809 | $78,423 |
| Income Deficit | 5,506 | $0 |
| Wage / Income Gap (%) | 21,447 | 11.49% |
| Wage / Income Gap ($) | 21,447 | 88.51¢ per $1 |
| Gini / Inequality Index | 21,447 | 0.39 |
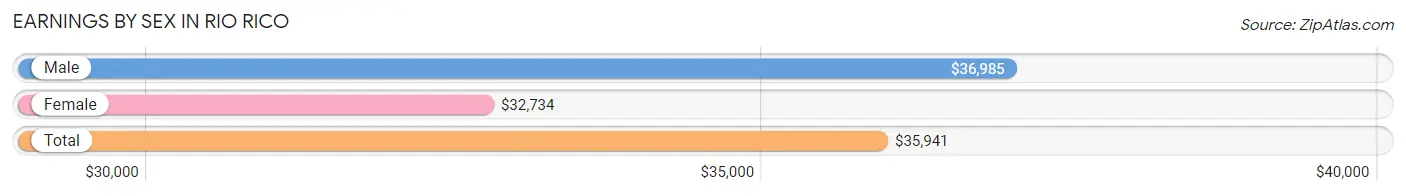
Earnings by Sex in Rio Rico
Average Earnings in Rio Rico are $35,941, $36,985 for men and $32,734 for women, a difference of 11.5%.
| Sex | Number | Average Earnings |
| Male | 5,320 (52.7%) | $36,985 |
| Female | 4,783 (47.3%) | $32,734 |
| Total | 10,103 (100.0%) | $35,941 |
Earnings by Sex by Income Bracket in Rio Rico
The most common earnings brackets in Rio Rico are $55,000 to $64,999 for men (625 | 11.7%) and $25,000 to $29,999 for women (499 | 10.4%).
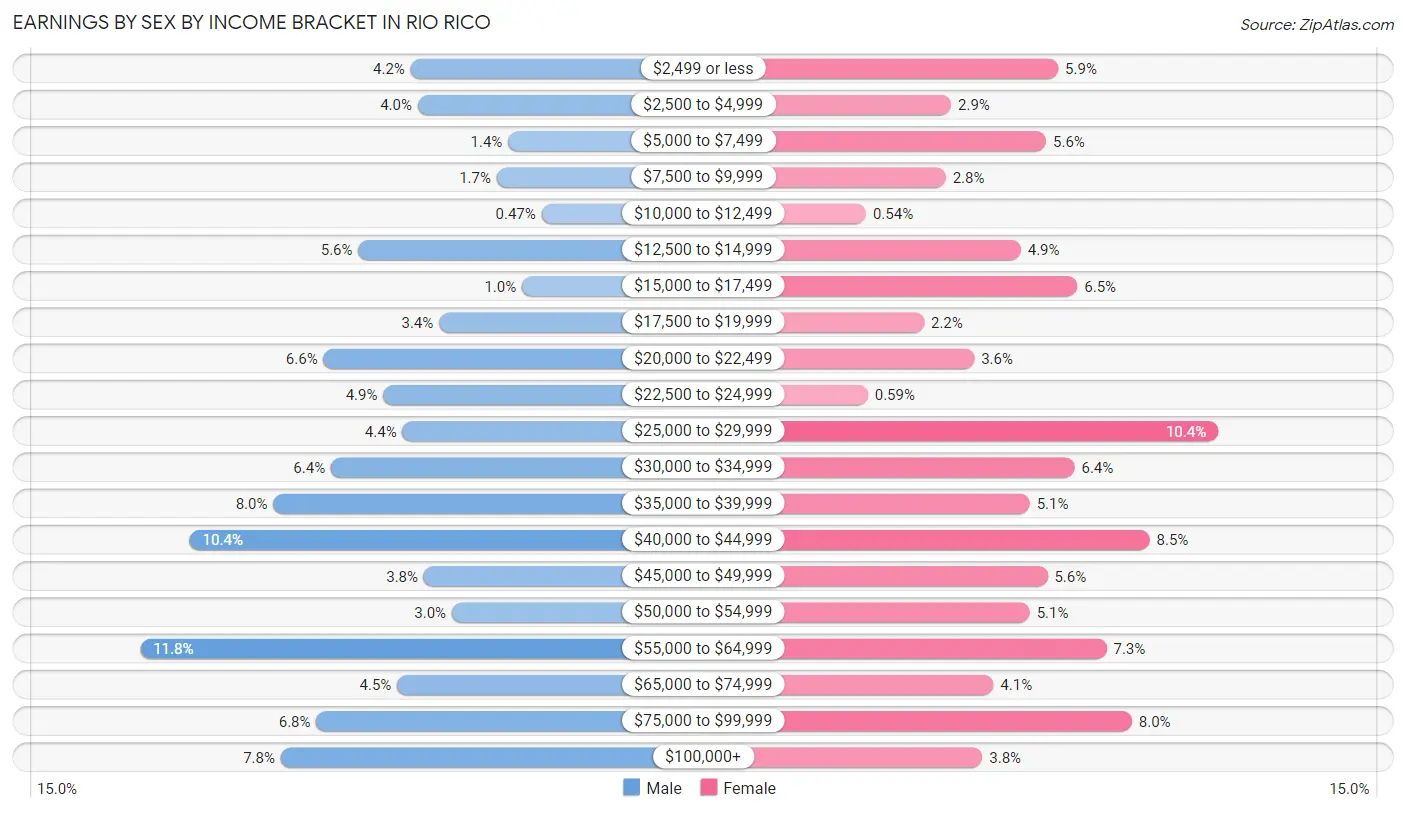
| Income | Male | Female |
| $2,499 or less | 221 (4.2%) | 284 (5.9%) |
| $2,500 to $4,999 | 210 (4.0%) | 140 (2.9%) |
| $5,000 to $7,499 | 75 (1.4%) | 268 (5.6%) |
| $7,500 to $9,999 | 92 (1.7%) | 133 (2.8%) |
| $10,000 to $12,499 | 25 (0.5%) | 26 (0.5%) |
| $12,500 to $14,999 | 299 (5.6%) | 234 (4.9%) |
| $15,000 to $17,499 | 54 (1.0%) | 310 (6.5%) |
| $17,500 to $19,999 | 178 (3.4%) | 104 (2.2%) |
| $20,000 to $22,499 | 351 (6.6%) | 171 (3.6%) |
| $22,500 to $24,999 | 262 (4.9%) | 28 (0.6%) |
| $25,000 to $29,999 | 233 (4.4%) | 499 (10.4%) |
| $30,000 to $34,999 | 340 (6.4%) | 306 (6.4%) |
| $35,000 to $39,999 | 426 (8.0%) | 246 (5.1%) |
| $40,000 to $44,999 | 551 (10.4%) | 407 (8.5%) |
| $45,000 to $49,999 | 201 (3.8%) | 270 (5.6%) |
| $50,000 to $54,999 | 159 (3.0%) | 246 (5.1%) |
| $55,000 to $64,999 | 625 (11.7%) | 349 (7.3%) |
| $65,000 to $74,999 | 241 (4.5%) | 197 (4.1%) |
| $75,000 to $99,999 | 362 (6.8%) | 383 (8.0%) |
| $100,000+ | 415 (7.8%) | 182 (3.8%) |
| Total | 5,320 (100.0%) | 4,783 (100.0%) |
Earnings by Sex by Educational Attainment in Rio Rico
Average earnings in Rio Rico are $43,300 for men and $39,368 for women, a difference of 9.1%. Men with an educational attainment of bachelor's degree enjoy the highest average annual earnings of $68,801, while those with high school diploma education earn the least with $40,000. Women with an educational attainment of graduate degree earn the most with the average annual earnings of $55,769, while those with less than high school education have the smallest earnings of $16,574.
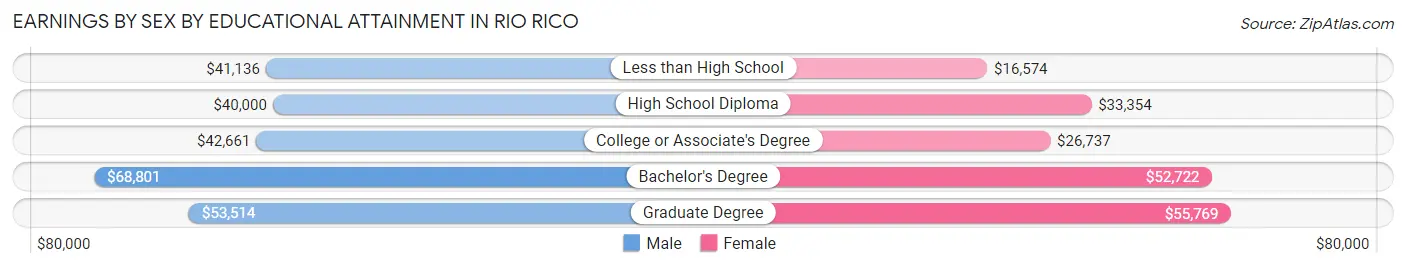
| Educational Attainment | Male Income | Female Income |
| Less than High School | $41,136 | $16,574 |
| High School Diploma | $40,000 | $33,354 |
| College or Associate's Degree | $42,661 | $26,737 |
| Bachelor's Degree | $68,801 | $52,722 |
| Graduate Degree | $53,514 | $55,769 |
| Total | $43,300 | $39,368 |
Family Income in Rio Rico
Family Income Brackets in Rio Rico
According to the Rio Rico family income data, there are 1,041 families falling into the $100,000 to $149,999 income range, which is the most common income bracket and makes up 18.9% of all families. Conversely, the $10,000 to $14,999 income bracket is the least frequent group with only 99 families (1.8%) belonging to this category.
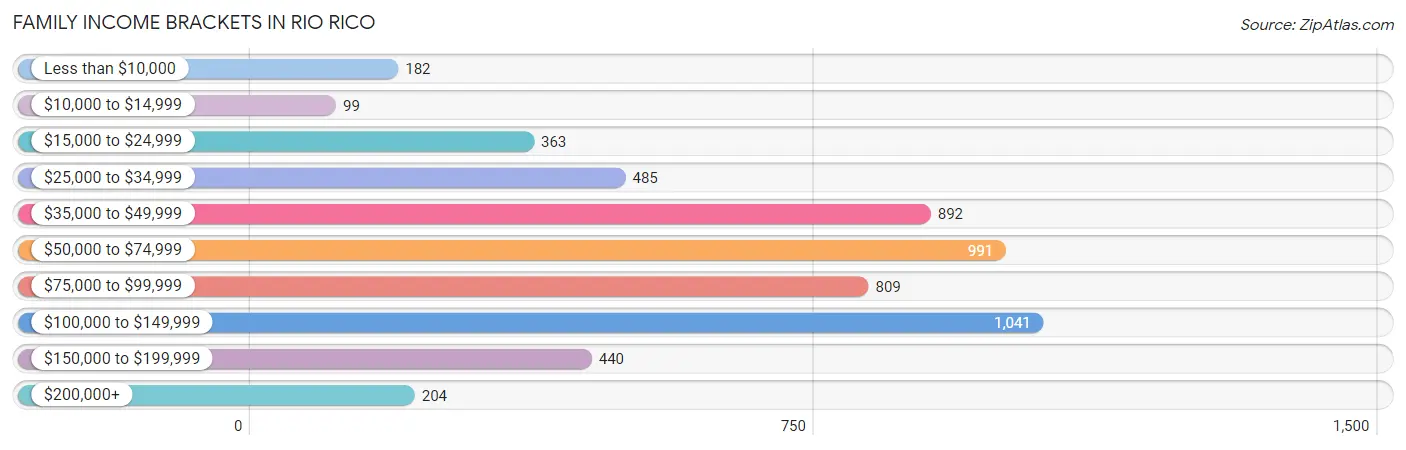
| Income Bracket | # Families | % Families |
| Less than $10,000 | 182 | 3.3% |
| $10,000 to $14,999 | 99 | 1.8% |
| $15,000 to $24,999 | 363 | 6.6% |
| $25,000 to $34,999 | 485 | 8.8% |
| $35,000 to $49,999 | 892 | 16.2% |
| $50,000 to $74,999 | 991 | 18.0% |
| $75,000 to $99,999 | 809 | 14.7% |
| $100,000 to $149,999 | 1,041 | 18.9% |
| $150,000 to $199,999 | 440 | 8.0% |
| $200,000+ | 204 | 3.7% |
Family Income by Famaliy Size in Rio Rico
6-person families (445 | 8.1%) account for the highest median family income in Rio Rico with $87,455 per family, while 2-person families (1,748 | 31.8%) have the highest median income of $29,432 per family member.
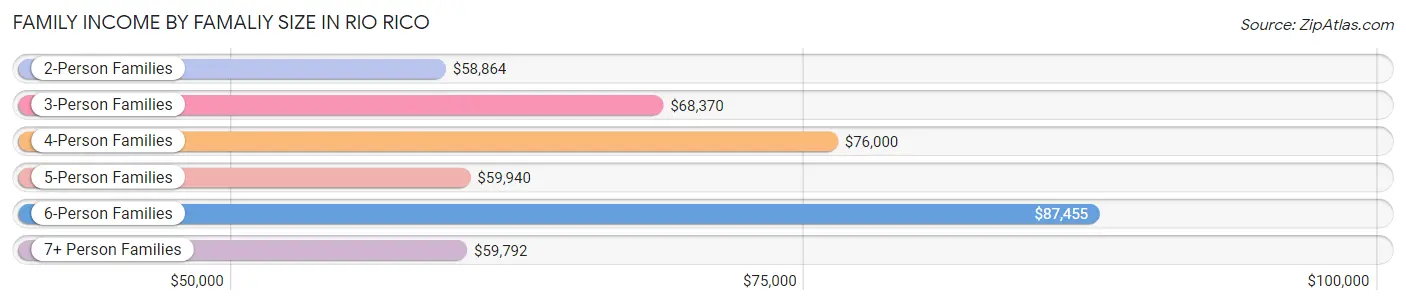
| Income Bracket | # Families | Median Income |
| 2-Person Families | 1,748 (31.8%) | $58,864 |
| 3-Person Families | 1,364 (24.8%) | $68,370 |
| 4-Person Families | 962 (17.5%) | $76,000 |
| 5-Person Families | 856 (15.5%) | $59,940 |
| 6-Person Families | 445 (8.1%) | $87,455 |
| 7+ Person Families | 131 (2.4%) | $59,792 |
| Total | 5,506 (100.0%) | $68,680 |
Family Income by Number of Earners in Rio Rico
The median family income in Rio Rico is $68,680, with families comprising 2 earners (2,390) having the highest median family income of $98,872, while families with 1 earner (2,146) have the lowest median family income of $42,153, accounting for 43.4% and 39.0% of families, respectively.
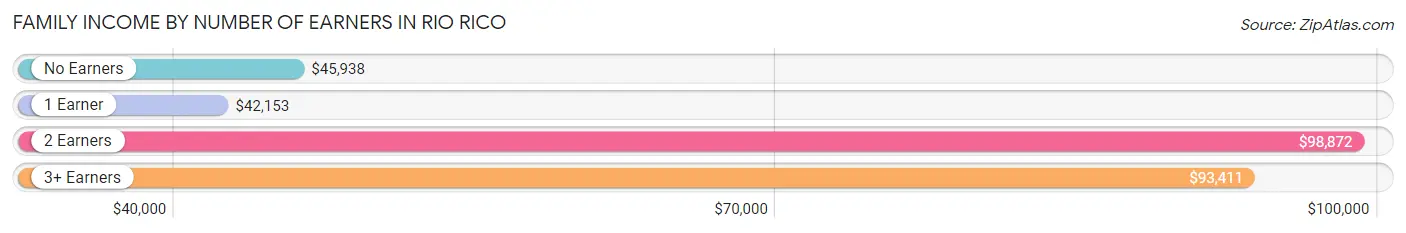
| Number of Earners | # Families | Median Income |
| No Earners | 525 (9.5%) | $45,938 |
| 1 Earner | 2,146 (39.0%) | $42,153 |
| 2 Earners | 2,390 (43.4%) | $98,872 |
| 3+ Earners | 445 (8.1%) | $93,411 |
| Total | 5,506 (100.0%) | $68,680 |
Household Income in Rio Rico
Household Income Brackets in Rio Rico
With 1,301 households falling in the category, the $50,000 to $74,999 income range is the most frequent in Rio Rico, accounting for 19.1% of all households. In contrast, only 116 households (1.7%) fall into the $10,000 to $14,999 income bracket, making it the least populous group.
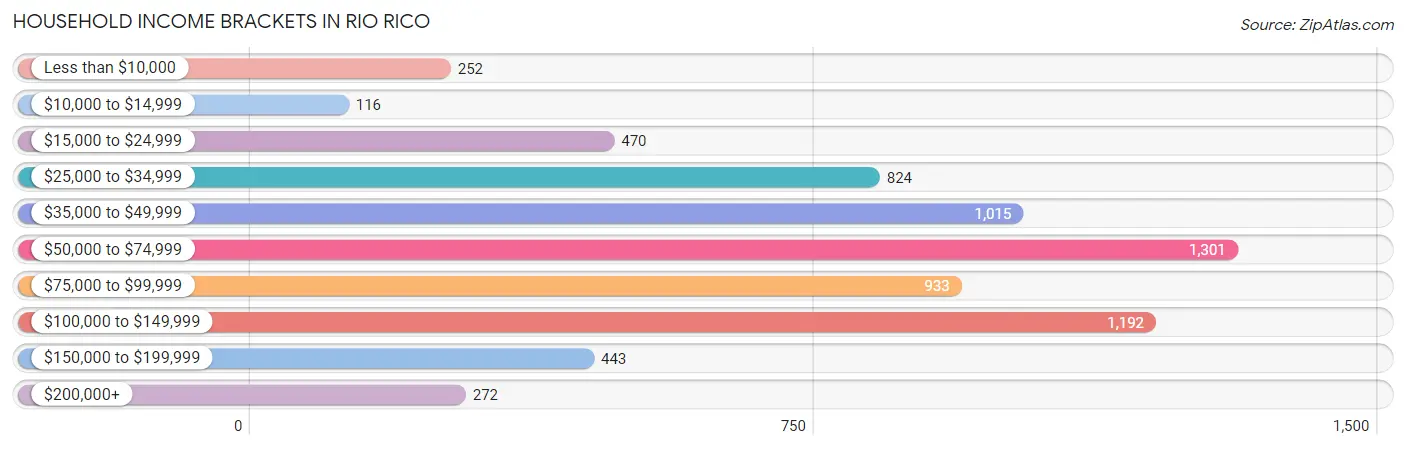
| Income Bracket | # Households | % Households |
| Less than $10,000 | 252 | 3.7% |
| $10,000 to $14,999 | 116 | 1.7% |
| $15,000 to $24,999 | 470 | 6.9% |
| $25,000 to $34,999 | 824 | 12.1% |
| $35,000 to $49,999 | 1,015 | 14.9% |
| $50,000 to $74,999 | 1,301 | 19.1% |
| $75,000 to $99,999 | 933 | 13.7% |
| $100,000 to $149,999 | 1,192 | 17.5% |
| $150,000 to $199,999 | 443 | 6.5% |
| $200,000+ | 272 | 4.0% |
Household Income by Householder Age in Rio Rico
The median household income in Rio Rico is $62,537, with the highest median household income of $72,571 found in the 25 to 44 years age bracket for the primary householder. A total of 2,265 households (33.3%) fall into this category. Meanwhile, the 15 to 24 years age bracket for the primary householder has the lowest median household income of $28,598, with 287 households (4.2%) in this group.
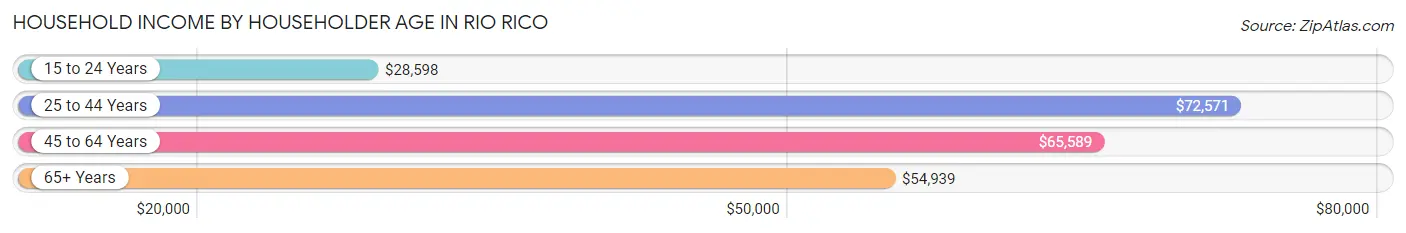
| Income Bracket | # Households | Median Income |
| 15 to 24 Years | 287 (4.2%) | $28,598 |
| 25 to 44 Years | 2,265 (33.3%) | $72,571 |
| 45 to 64 Years | 2,989 (43.9%) | $65,589 |
| 65+ Years | 1,268 (18.6%) | $54,939 |
| Total | 6,809 (100.0%) | $62,537 |
Poverty in Rio Rico
Income Below Poverty by Sex and Age in Rio Rico
With 17.0% poverty level for males and 16.0% for females among the residents of Rio Rico, under 5 year old males and 15 year old females are the most vulnerable to poverty, with 311 males (31.9%) and 48 females (26.2%) in their respective age groups living below the poverty level.
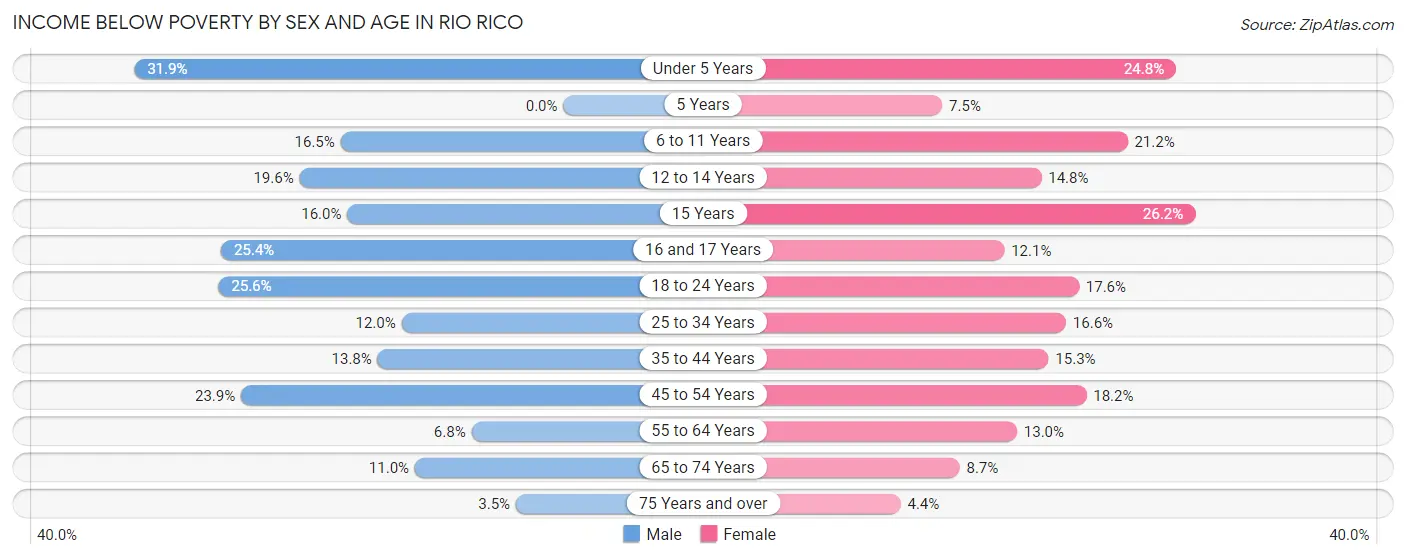
| Age Bracket | Male | Female |
| Under 5 Years | 311 (31.9%) | 198 (24.8%) |
| 5 Years | 0 (0.0%) | 31 (7.4%) |
| 6 to 11 Years | 148 (16.5%) | 225 (21.2%) |
| 12 to 14 Years | 202 (19.6%) | 60 (14.8%) |
| 15 Years | 30 (16.0%) | 48 (26.2%) |
| 16 and 17 Years | 75 (25.4%) | 34 (12.1%) |
| 18 to 24 Years | 232 (25.6%) | 241 (17.6%) |
| 25 to 34 Years | 139 (12.0%) | 213 (16.6%) |
| 35 to 44 Years | 180 (13.8%) | 198 (15.3%) |
| 45 to 54 Years | 274 (23.9%) | 246 (18.1%) |
| 55 to 64 Years | 93 (6.8%) | 167 (13.0%) |
| 65 to 74 Years | 91 (11.0%) | 68 (8.7%) |
| 75 Years and over | 13 (3.5%) | 18 (4.4%) |
| Total | 1,788 (17.0%) | 1,747 (16.0%) |
Income Above Poverty by Sex and Age in Rio Rico
According to the poverty statistics in Rio Rico, males aged 5 years and females aged 75 years and over are the age groups that are most secure financially, with 100.0% of males and 95.6% of females in these age groups living above the poverty line.
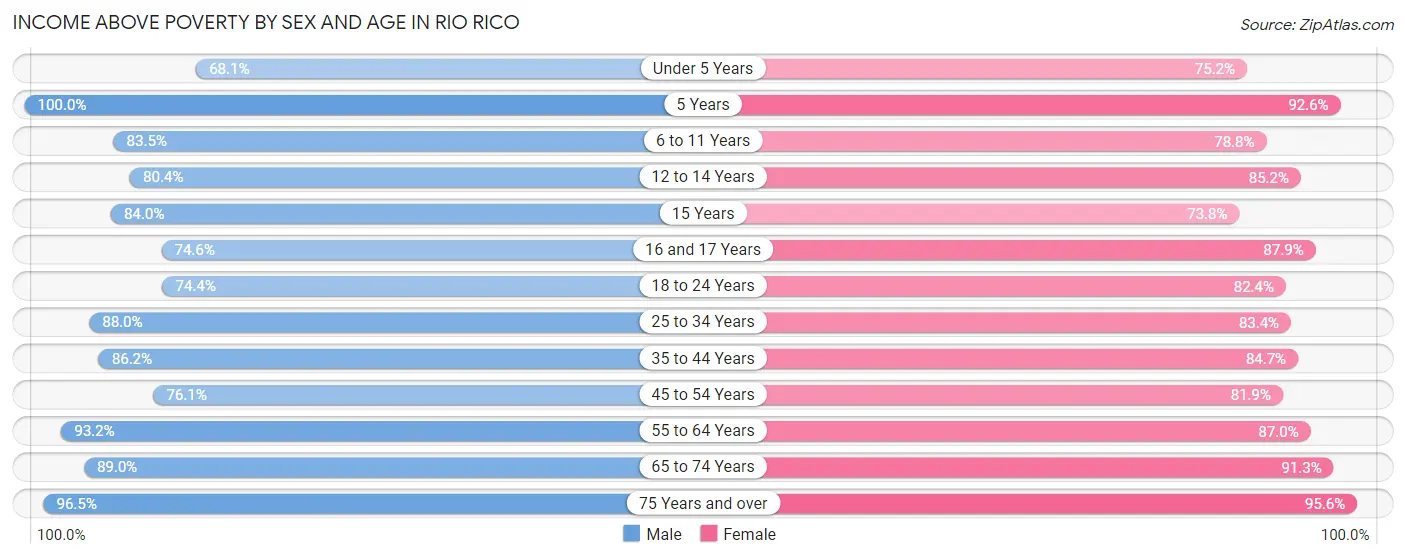
| Age Bracket | Male | Female |
| Under 5 Years | 665 (68.1%) | 600 (75.2%) |
| 5 Years | 69 (100.0%) | 385 (92.5%) |
| 6 to 11 Years | 747 (83.5%) | 836 (78.8%) |
| 12 to 14 Years | 829 (80.4%) | 345 (85.2%) |
| 15 Years | 157 (84.0%) | 135 (73.8%) |
| 16 and 17 Years | 220 (74.6%) | 248 (87.9%) |
| 18 to 24 Years | 674 (74.4%) | 1,128 (82.4%) |
| 25 to 34 Years | 1,018 (88.0%) | 1,067 (83.4%) |
| 35 to 44 Years | 1,125 (86.2%) | 1,093 (84.7%) |
| 45 to 54 Years | 871 (76.1%) | 1,109 (81.9%) |
| 55 to 64 Years | 1,271 (93.2%) | 1,118 (87.0%) |
| 65 to 74 Years | 735 (89.0%) | 710 (91.3%) |
| 75 Years and over | 356 (96.5%) | 395 (95.6%) |
| Total | 8,737 (83.0%) | 9,169 (84.0%) |
Income Below Poverty Among Married-Couple Families in Rio Rico
The poverty statistics for married-couple families in Rio Rico show that 11.7% or 479 of the total 4,097 families live below the poverty line. Families with 3 or 4 children have the highest poverty rate of 19.4%, comprising of 126 families. On the other hand, families with no children have the lowest poverty rate of 7.2%, which includes 128 families.
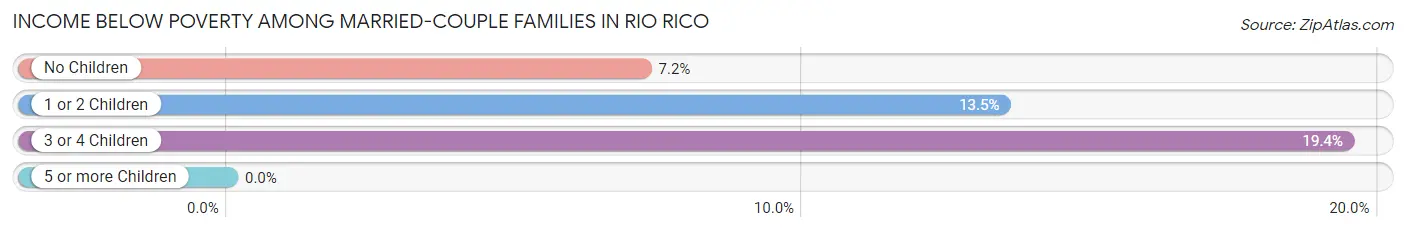
| Children | Above Poverty | Below Poverty |
| No Children | 1,650 (92.8%) | 128 (7.2%) |
| 1 or 2 Children | 1,446 (86.5%) | 225 (13.5%) |
| 3 or 4 Children | 522 (80.6%) | 126 (19.4%) |
| 5 or more Children | 0 (0.0%) | 0 (0.0%) |
| Total | 3,618 (88.3%) | 479 (11.7%) |
Income Below Poverty Among Single-Parent Households in Rio Rico
According to the poverty data in Rio Rico, 10.2% or 34 single-father households and 28.8% or 310 single-mother households are living below the poverty line. Among single-father households, those with no children have the highest poverty rate, with 20 households (21.3%) experiencing poverty. Likewise, among single-mother households, those with 3 or 4 children have the highest poverty rate, with 69 households (50.4%) falling below the poverty line.
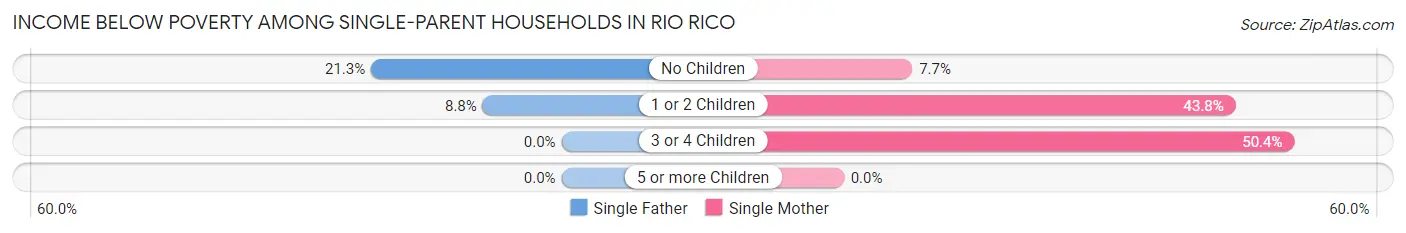
| Children | Single Father | Single Mother |
| No Children | 20 (21.3%) | 36 (7.7%) |
| 1 or 2 Children | 14 (8.8%) | 205 (43.8%) |
| 3 or 4 Children | 0 (0.0%) | 69 (50.4%) |
| 5 or more Children | 0 (0.0%) | 0 (0.0%) |
| Total | 34 (10.2%) | 310 (28.8%) |
Income Below Poverty Among Married-Couple vs Single-Parent Households in Rio Rico
The poverty data for Rio Rico shows that 479 of the married-couple family households (11.7%) and 344 of the single-parent households (24.4%) are living below the poverty level. Within the married-couple family households, those with 3 or 4 children have the highest poverty rate, with 126 households (19.4%) falling below the poverty line. Among the single-parent households, those with 1 or 2 children have the highest poverty rate, with 219 household (34.9%) living below poverty.
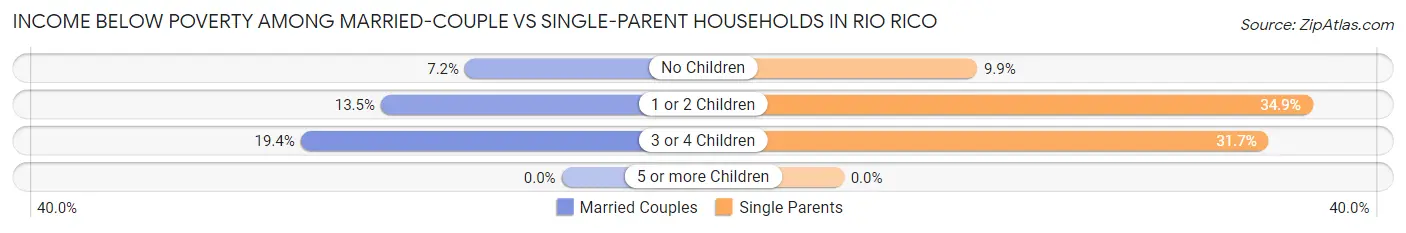
| Children | Married-Couple Families | Single-Parent Households |
| No Children | 128 (7.2%) | 56 (9.9%) |
| 1 or 2 Children | 225 (13.5%) | 219 (34.9%) |
| 3 or 4 Children | 126 (19.4%) | 69 (31.7%) |
| 5 or more Children | 0 (0.0%) | 0 (0.0%) |
| Total | 479 (11.7%) | 344 (24.4%) |
Race in Rio Rico
The most populous races in Rio Rico are Hispanic or Latino (18,672 | 87.1%), White / Caucasian (10,629 | 49.6%), and Two or more Races (7,627 | 35.6%).
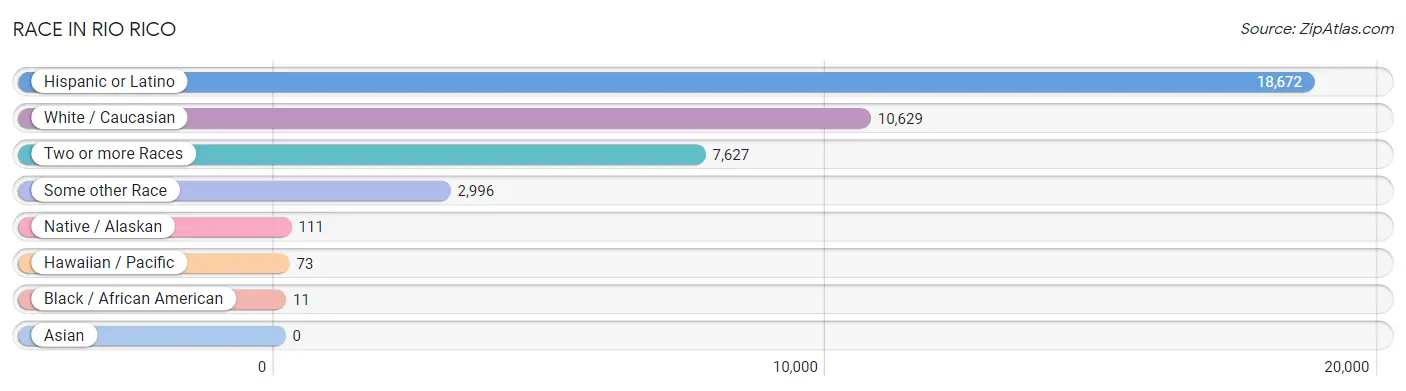
| Race | # Population | % Population |
| Asian | 0 | 0.0% |
| Black / African American | 11 | 0.1% |
| Hawaiian / Pacific | 73 | 0.3% |
| Hispanic or Latino | 18,672 | 87.1% |
| Native / Alaskan | 111 | 0.5% |
| White / Caucasian | 10,629 | 49.6% |
| Two or more Races | 7,627 | 35.6% |
| Some other Race | 2,996 | 14.0% |
| Total | 21,447 | 100.0% |
Ancestry in Rio Rico
The most populous ancestries reported in Rio Rico are Mexican (18,019 | 84.0%), German (758 | 3.5%), Swedish (478 | 2.2%), Italian (463 | 2.2%), and Irish (382 | 1.8%), together accounting for 93.7% of all Rio Rico residents.
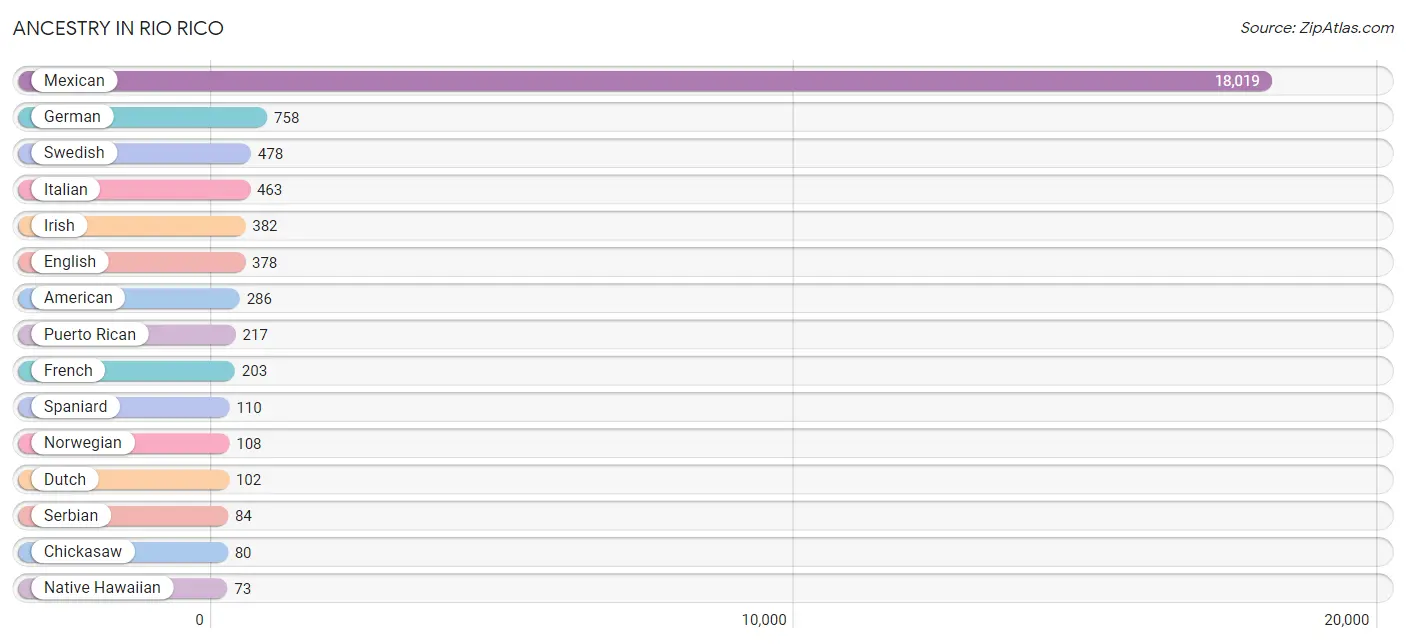
| Ancestry | # Population | % Population |
| American | 286 | 1.3% |
| Arab | 23 | 0.1% |
| Bhutanese | 11 | 0.1% |
| British | 8 | 0.0% |
| Canadian | 6 | 0.0% |
| Cherokee | 64 | 0.3% |
| Chickasaw | 80 | 0.4% |
| Choctaw | 18 | 0.1% |
| Colombian | 43 | 0.2% |
| Cuban | 15 | 0.1% |
| Czech | 11 | 0.1% |
| Danish | 31 | 0.1% |
| Dutch | 102 | 0.5% |
| Egyptian | 23 | 0.1% |
| English | 378 | 1.8% |
| European | 10 | 0.1% |
| Finnish | 34 | 0.2% |
| French | 203 | 0.9% |
| French Canadian | 22 | 0.1% |
| German | 758 | 3.5% |
| Greek | 64 | 0.3% |
| Hungarian | 31 | 0.1% |
| Iranian | 8 | 0.0% |
| Irish | 382 | 1.8% |
| Italian | 463 | 2.2% |
| Mexican | 18,019 | 84.0% |
| Native Hawaiian | 73 | 0.3% |
| Northern European | 17 | 0.1% |
| Norwegian | 108 | 0.5% |
| Paraguayan | 6 | 0.0% |
| Peruvian | 11 | 0.1% |
| Polish | 73 | 0.3% |
| Portuguese | 22 | 0.1% |
| Potawatomi | 29 | 0.1% |
| Puerto Rican | 217 | 1.0% |
| Russian | 53 | 0.3% |
| Scotch-Irish | 31 | 0.1% |
| Scottish | 63 | 0.3% |
| Serbian | 84 | 0.4% |
| South American | 60 | 0.3% |
| Spaniard | 110 | 0.5% |
| Spanish | 20 | 0.1% |
| Swedish | 478 | 2.2% |
| Swiss | 11 | 0.1% |
| Welsh | 12 | 0.1% | View All 45 Rows |
Immigrants in Rio Rico
The most numerous immigrant groups reported in Rio Rico came from Latin America (6,034 | 28.1%), Central America (6,003 | 28.0%), Mexico (6,003 | 28.0%), Europe (130 | 0.6%), and Germany (72 | 0.3%), together accounting for 85.1% of all Rio Rico residents.
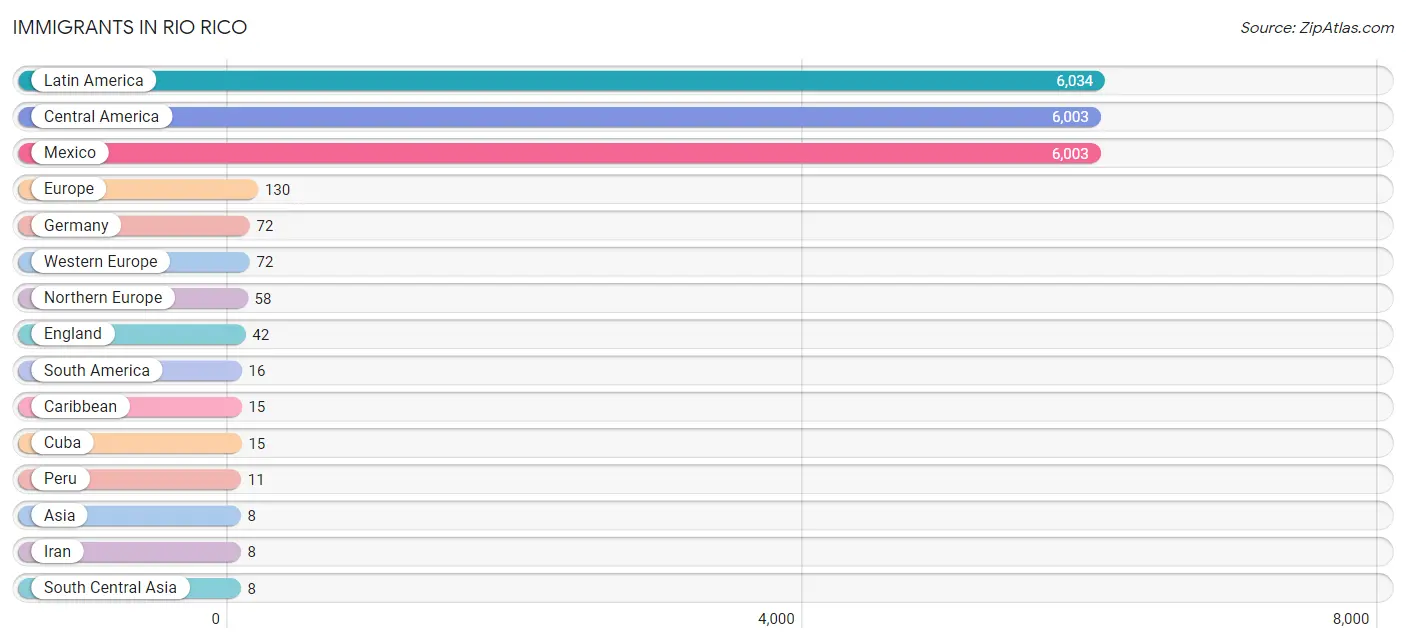
| Immigration Origin | # Population | % Population |
| Asia | 8 | 0.0% |
| Bolivia | 5 | 0.0% |
| Caribbean | 15 | 0.1% |
| Central America | 6,003 | 28.0% |
| Cuba | 15 | 0.1% |
| England | 42 | 0.2% |
| Europe | 130 | 0.6% |
| Germany | 72 | 0.3% |
| Iran | 8 | 0.0% |
| Latin America | 6,034 | 28.1% |
| Mexico | 6,003 | 28.0% |
| Northern Europe | 58 | 0.3% |
| Peru | 11 | 0.1% |
| South America | 16 | 0.1% |
| South Central Asia | 8 | 0.0% |
| Western Europe | 72 | 0.3% | View All 16 Rows |
Sex and Age in Rio Rico
Sex and Age in Rio Rico
The most populous age groups in Rio Rico are 10 to 14 Years (1,360 | 12.9%) for men and 5 to 9 Years (1,189 | 10.9%) for women.
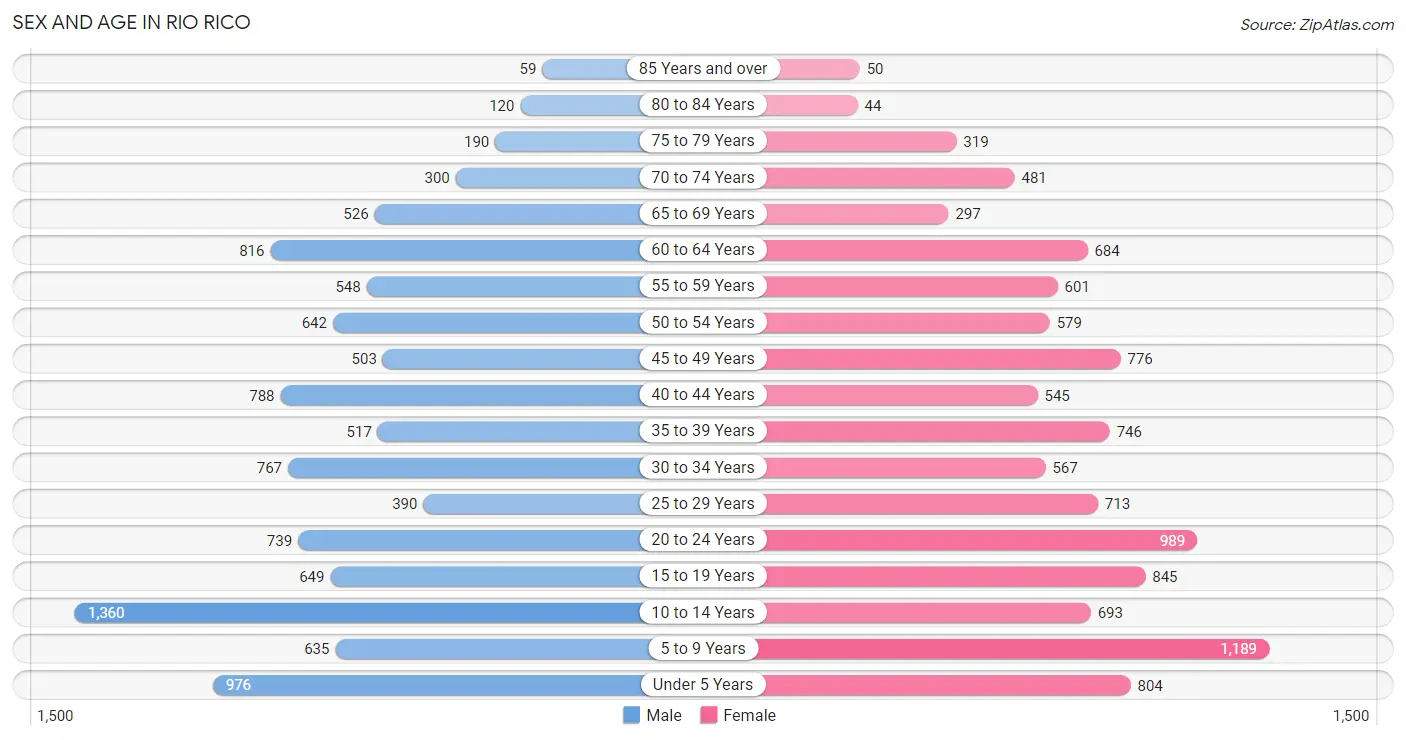
| Age Bracket | Male | Female |
| Under 5 Years | 976 (9.3%) | 804 (7.4%) |
| 5 to 9 Years | 635 (6.0%) | 1,189 (10.9%) |
| 10 to 14 Years | 1,360 (12.9%) | 693 (6.3%) |
| 15 to 19 Years | 649 (6.2%) | 845 (7.7%) |
| 20 to 24 Years | 739 (7.0%) | 989 (9.1%) |
| 25 to 29 Years | 390 (3.7%) | 713 (6.5%) |
| 30 to 34 Years | 767 (7.3%) | 567 (5.2%) |
| 35 to 39 Years | 517 (4.9%) | 746 (6.8%) |
| 40 to 44 Years | 788 (7.5%) | 545 (5.0%) |
| 45 to 49 Years | 503 (4.8%) | 776 (7.1%) |
| 50 to 54 Years | 642 (6.1%) | 579 (5.3%) |
| 55 to 59 Years | 548 (5.2%) | 601 (5.5%) |
| 60 to 64 Years | 816 (7.7%) | 684 (6.3%) |
| 65 to 69 Years | 526 (5.0%) | 297 (2.7%) |
| 70 to 74 Years | 300 (2.9%) | 481 (4.4%) |
| 75 to 79 Years | 190 (1.8%) | 319 (2.9%) |
| 80 to 84 Years | 120 (1.1%) | 44 (0.4%) |
| 85 Years and over | 59 (0.6%) | 50 (0.5%) |
| Total | 10,525 (100.0%) | 10,922 (100.0%) |
Families and Households in Rio Rico
Median Family Size in Rio Rico
The median family size in Rio Rico is 3.53 persons per family, with married-couple families (4,097 | 74.4%) accounting for the largest median family size of 3.71 persons per family. On the other hand, single male/father families (334 | 6.1%) represent the smallest median family size with 2.94 persons per family.
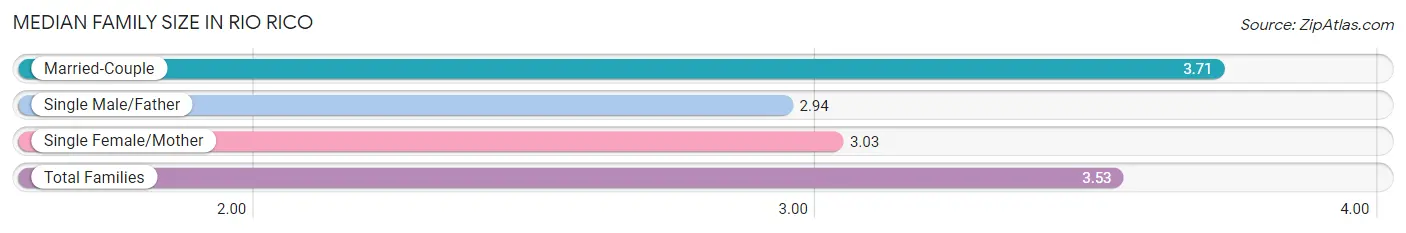
| Family Type | # Families | Family Size |
| Married-Couple | 4,097 (74.4%) | 3.71 |
| Single Male/Father | 334 (6.1%) | 2.94 |
| Single Female/Mother | 1,075 (19.5%) | 3.03 |
| Total Families | 5,506 (100.0%) | 3.53 |
Median Household Size in Rio Rico
The median household size in Rio Rico is 3.15 persons per household, with married-couple households (4,097 | 60.2%) accounting for the largest median household size of 3.73 persons per household. non-family households (1,303 | 19.1%) represent the smallest median household size with 1.16 persons per household.
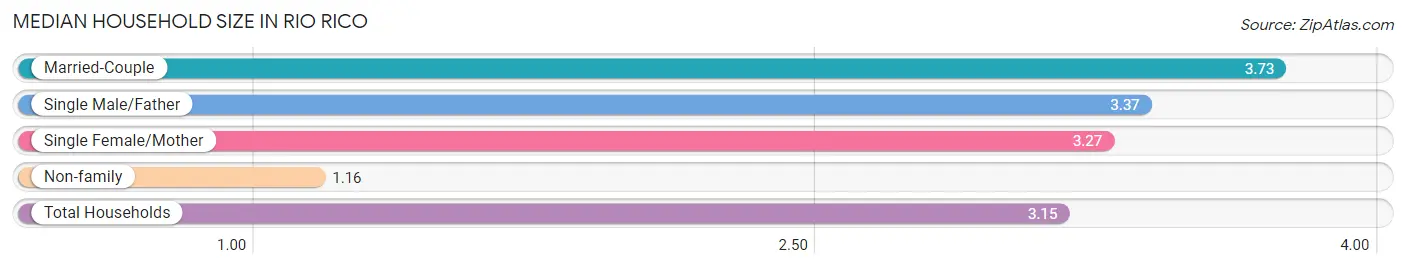
| Household Type | # Households | Household Size |
| Married-Couple | 4,097 (60.2%) | 3.73 |
| Single Male/Father | 334 (4.9%) | 3.37 |
| Single Female/Mother | 1,075 (15.8%) | 3.27 |
| Non-family | 1,303 (19.1%) | 1.16 |
| Total Households | 6,809 (100.0%) | 3.15 |
Household Size by Marriage Status in Rio Rico
Out of a total of 6,809 households in Rio Rico, 5,506 (80.9%) are family households, while 1,303 (19.1%) are nonfamily households. The most numerous type of family households are 2-person households, comprising 1,580, and the most common type of nonfamily households are 1-person households, comprising 1,087.
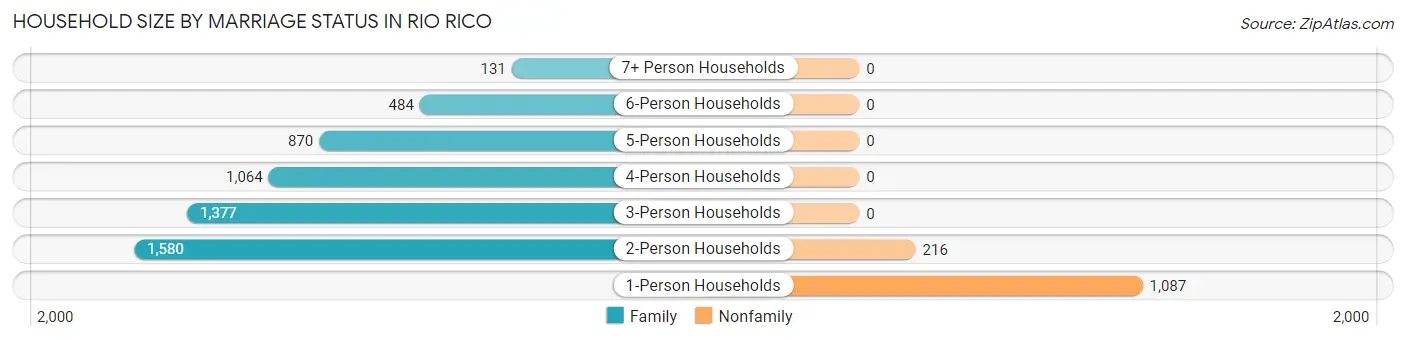
| Household Size | Family Households | Nonfamily Households |
| 1-Person Households | - | 1,087 (16.0%) |
| 2-Person Households | 1,580 (23.2%) | 216 (3.2%) |
| 3-Person Households | 1,377 (20.2%) | 0 (0.0%) |
| 4-Person Households | 1,064 (15.6%) | 0 (0.0%) |
| 5-Person Households | 870 (12.8%) | 0 (0.0%) |
| 6-Person Households | 484 (7.1%) | 0 (0.0%) |
| 7+ Person Households | 131 (1.9%) | 0 (0.0%) |
| Total | 5,506 (80.9%) | 1,303 (19.1%) |
Female Fertility in Rio Rico
Fertility by Age in Rio Rico
Average fertility rate in Rio Rico is 69.0 births per 1,000 women. Women in the age bracket of 20 to 34 years have the highest fertility rate with 143.0 births per 1,000 women. Women in the age bracket of 20 to 34 years acount for 90.0% of all women with births.
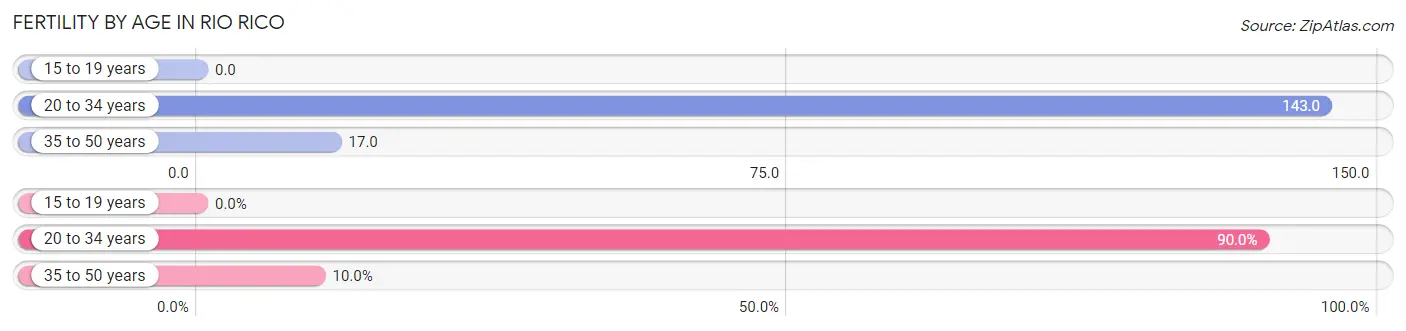
| Age Bracket | Women with Births | Births / 1,000 Women |
| 15 to 19 years | 0 (0.0%) | 0.0 |
| 20 to 34 years | 325 (90.0%) | 143.0 |
| 35 to 50 years | 36 (10.0%) | 17.0 |
| Total | 361 (100.0%) | 69.0 |
Fertility by Age by Marriage Status in Rio Rico
22.7% of women with births (361) in Rio Rico are married. The highest percentage of unmarried women with births falls into 20 to 34 years age bracket with 85.9% of them unmarried at the time of birth, while the lowest percentage of unmarried women with births belong to 35 to 50 years age bracket with 0.0% of them unmarried.
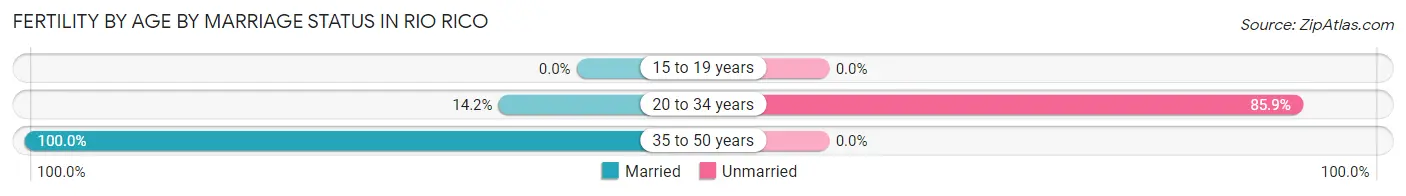
| Age Bracket | Married | Unmarried |
| 15 to 19 years | 0 (0.0%) | 0 (0.0%) |
| 20 to 34 years | 46 (14.1%) | 279 (85.9%) |
| 35 to 50 years | 36 (100.0%) | 0 (0.0%) |
| Total | 82 (22.7%) | 279 (77.3%) |
Fertility by Education in Rio Rico
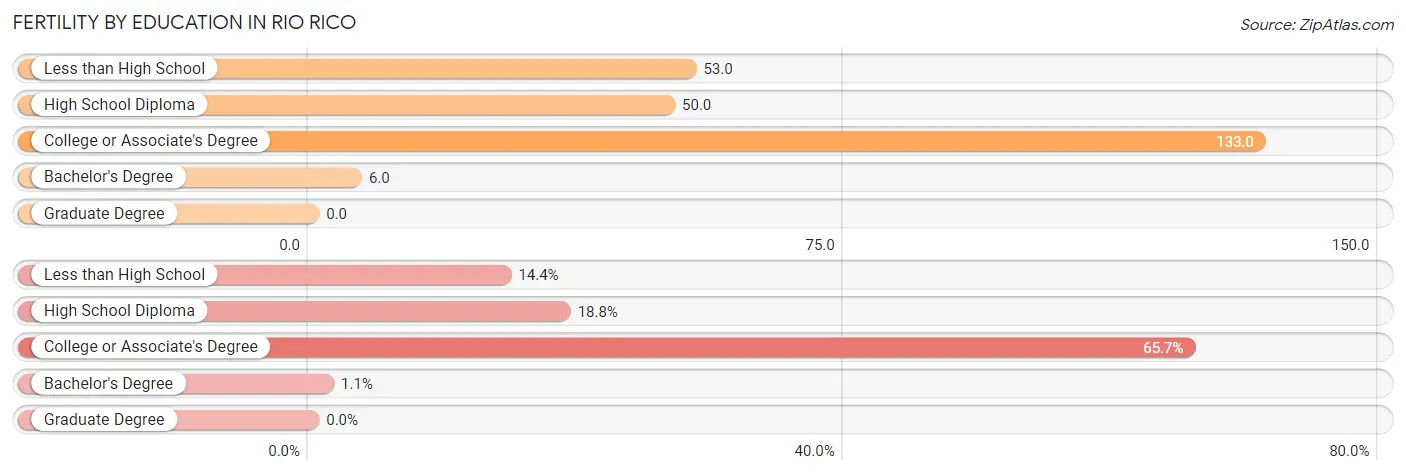
| Educational Attainment | Women with Births | Births / 1,000 Women |
| Less than High School | 52 (14.4%) | 53.0 |
| High School Diploma | 68 (18.8%) | 50.0 |
| College or Associate's Degree | 237 (65.6%) | 133.0 |
| Bachelor's Degree | 4 (1.1%) | 6.0 |
| Graduate Degree | 0 (0.0%) | 0.0 |
| Total | 361 (100.0%) | 69.0 |
Fertility by Education by Marriage Status in Rio Rico
77.3% of women with births in Rio Rico are unmarried. Women with the educational attainment of bachelor's degree are most likely to be married with 100.0% of them married at childbirth, while women with the educational attainment of less than high school are least likely to be married with 100.0% of them unmarried at childbirth.
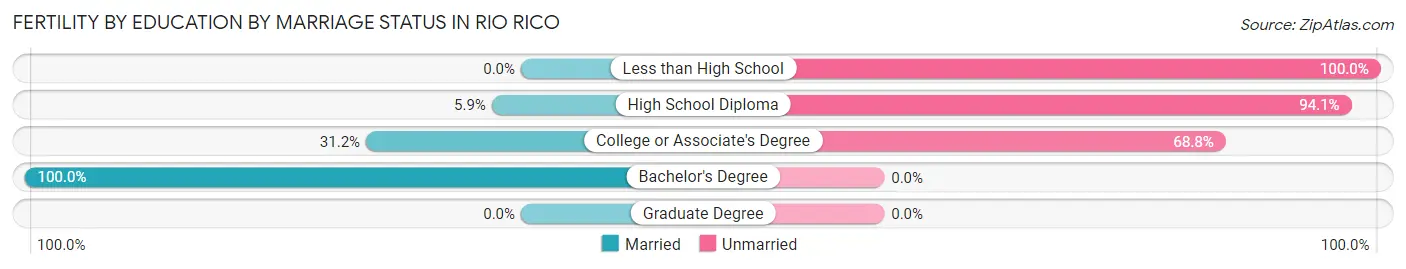
| Educational Attainment | Married | Unmarried |
| Less than High School | 0 (0.0%) | 52 (100.0%) |
| High School Diploma | 4 (5.9%) | 64 (94.1%) |
| College or Associate's Degree | 74 (31.2%) | 163 (68.8%) |
| Bachelor's Degree | 4 (100.0%) | 0 (0.0%) |
| Graduate Degree | 0 (0.0%) | 0 (0.0%) |
| Total | 82 (22.7%) | 279 (77.3%) |
Employment Characteristics in Rio Rico
Employment by Class of Employer in Rio Rico
Among the 8,851 employed individuals in Rio Rico, private company employees (5,224 | 59.0%), local government employees (1,136 | 12.8%), and not-for-profit organizations (613 | 6.9%) make up the most common classes of employment.
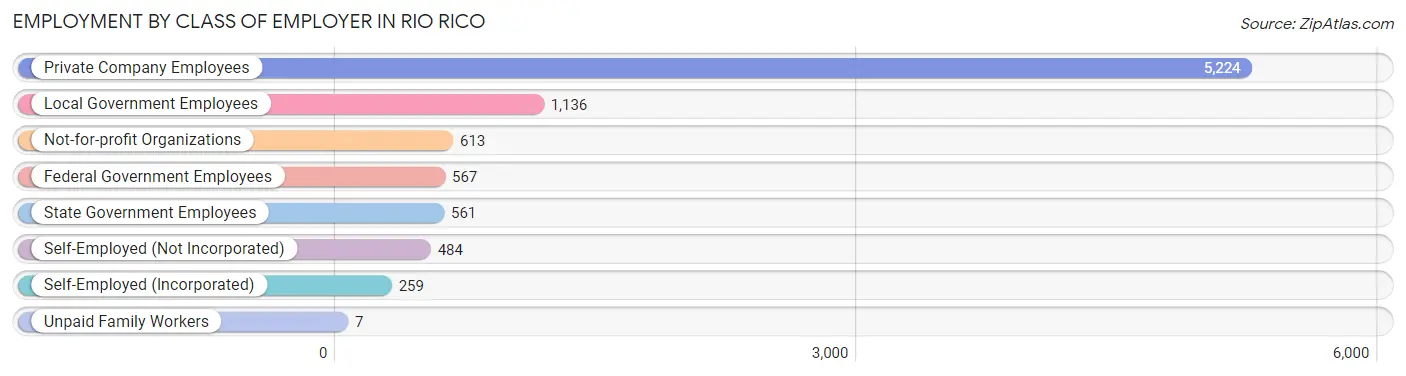
| Employer Class | # Employees | % Employees |
| Private Company Employees | 5,224 | 59.0% |
| Self-Employed (Incorporated) | 259 | 2.9% |
| Self-Employed (Not Incorporated) | 484 | 5.5% |
| Not-for-profit Organizations | 613 | 6.9% |
| Local Government Employees | 1,136 | 12.8% |
| State Government Employees | 561 | 6.3% |
| Federal Government Employees | 567 | 6.4% |
| Unpaid Family Workers | 7 | 0.1% |
| Total | 8,851 | 100.0% |
Employment Status by Age in Rio Rico
According to the labor force statistics for Rio Rico, out of the total population over 16 years of age (15,420), 64.3% or 9,915 individuals are in the labor force, with 7.7% or 763 of them unemployed. The age group with the highest labor force participation rate is 35 to 44 years, with 83.1% or 2,157 individuals in the labor force. Within the labor force, the 16 to 19 years age range has the highest percentage of unemployed individuals, with 45.6% or 167 of them being unemployed.
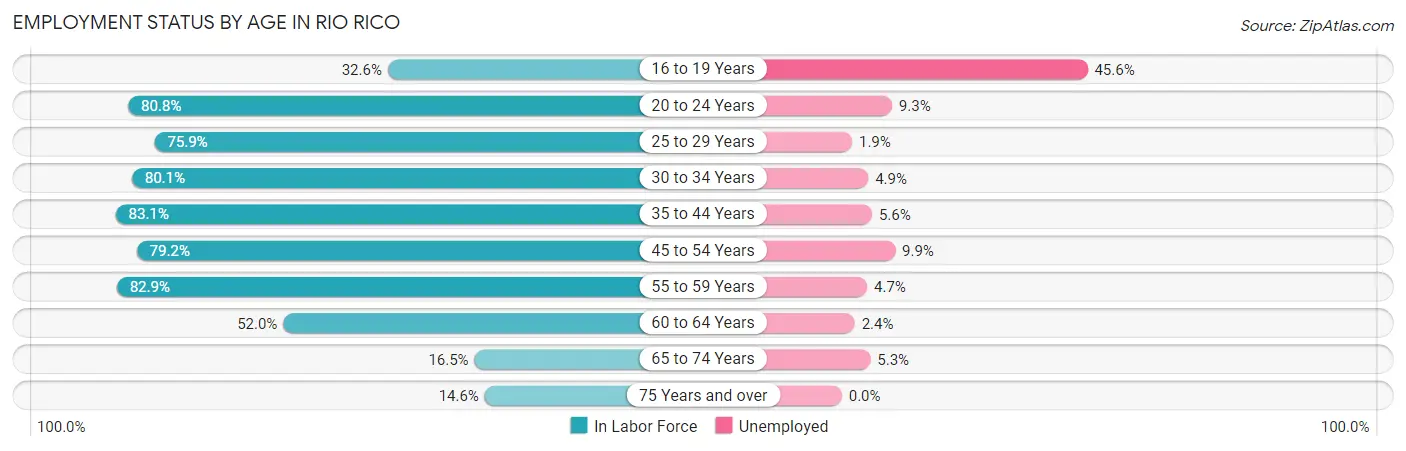
| Age Bracket | In Labor Force | Unemployed |
| 16 to 19 Years | 366 (32.6%) | 167 (45.6%) |
| 20 to 24 Years | 1,396 (80.8%) | 130 (9.3%) |
| 25 to 29 Years | 837 (75.9%) | 16 (1.9%) |
| 30 to 34 Years | 1,069 (80.1%) | 52 (4.9%) |
| 35 to 44 Years | 2,157 (83.1%) | 121 (5.6%) |
| 45 to 54 Years | 1,980 (79.2%) | 196 (9.9%) |
| 55 to 59 Years | 953 (82.9%) | 45 (4.7%) |
| 60 to 64 Years | 780 (52.0%) | 19 (2.4%) |
| 65 to 74 Years | 265 (16.5%) | 14 (5.3%) |
| 75 Years and over | 114 (14.6%) | 0 (0.0%) |
| Total | 9,915 (64.3%) | 763 (7.7%) |
Employment Status by Educational Attainment in Rio Rico
According to labor force statistics for Rio Rico, 76.4% of individuals (7,779) out of the total population between 25 and 64 years of age (10,182) are in the labor force, with 5.8% or 451 of them being unemployed. The group with the highest labor force participation rate are those with the educational attainment of bachelor's degree or higher, with 83.4% or 2,028 individuals in the labor force. Within the labor force, individuals with college / associate degree education have the highest percentage of unemployment, with 8.8% or 243 of them being unemployed.
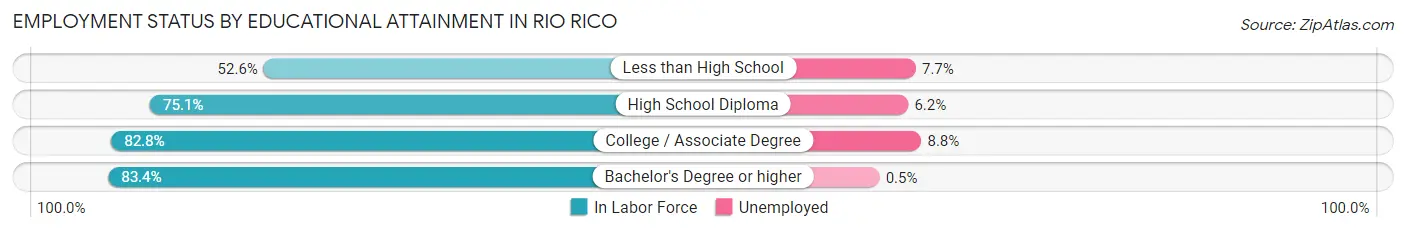
| Educational Attainment | In Labor Force | Unemployed |
| Less than High School | 768 (52.6%) | 112 (7.7%) |
| High School Diploma | 2,223 (75.1%) | 184 (6.2%) |
| College / Associate Degree | 2,756 (82.8%) | 293 (8.8%) |
| Bachelor's Degree or higher | 2,028 (83.4%) | 12 (0.5%) |
| Total | 7,779 (76.4%) | 591 (5.8%) |
Employment Occupations by Sex in Rio Rico
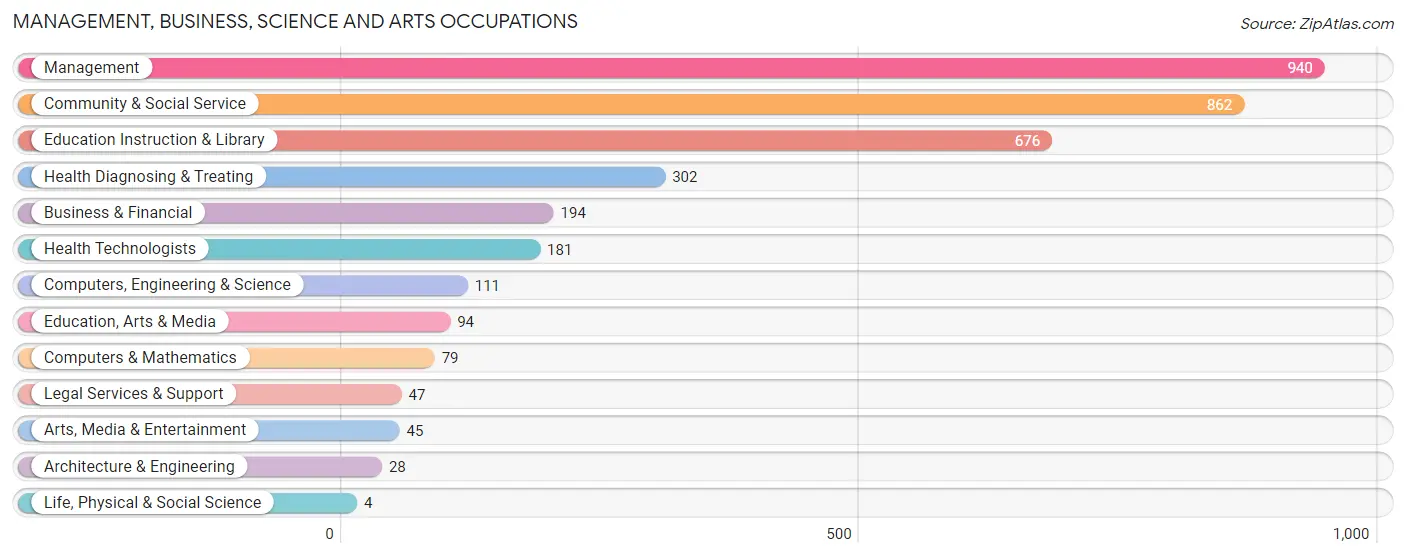
Management, Business, Science and Arts Occupations
The most common Management, Business, Science and Arts occupations in Rio Rico are Management (940 | 10.3%), Community & Social Service (862 | 9.5%), Education Instruction & Library (676 | 7.4%), Health Diagnosing & Treating (302 | 3.3%), and Business & Financial (194 | 2.1%).
Management, Business, Science and Arts Occupations by Sex
Within the Management, Business, Science and Arts occupations in Rio Rico, the most male-oriented occupations are Life, Physical & Social Science (100.0%), Computers & Mathematics (50.6%), and Computers, Engineering & Science (48.6%), while the most female-oriented occupations are Education Instruction & Library (90.1%), Community & Social Service (84.3%), and Health Diagnosing & Treating (71.9%).
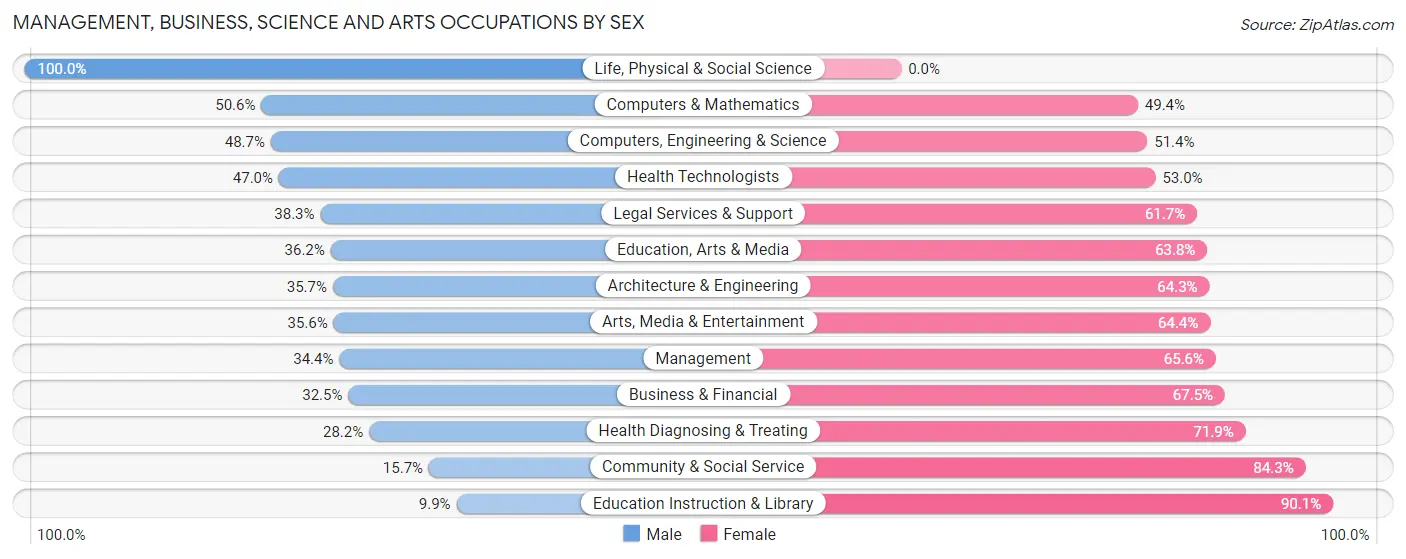
| Occupation | Male | Female |
| Management | 323 (34.4%) | 617 (65.6%) |
| Business & Financial | 63 (32.5%) | 131 (67.5%) |
| Computers, Engineering & Science | 54 (48.6%) | 57 (51.3%) |
| Computers & Mathematics | 40 (50.6%) | 39 (49.4%) |
| Architecture & Engineering | 10 (35.7%) | 18 (64.3%) |
| Life, Physical & Social Science | 4 (100.0%) | 0 (0.0%) |
| Community & Social Service | 135 (15.7%) | 727 (84.3%) |
| Education, Arts & Media | 34 (36.2%) | 60 (63.8%) |
| Legal Services & Support | 18 (38.3%) | 29 (61.7%) |
| Education Instruction & Library | 67 (9.9%) | 609 (90.1%) |
| Arts, Media & Entertainment | 16 (35.6%) | 29 (64.4%) |
| Health Diagnosing & Treating | 85 (28.1%) | 217 (71.9%) |
| Health Technologists | 85 (47.0%) | 96 (53.0%) |
| Total (Category) | 660 (27.4%) | 1,749 (72.6%) |
| Total (Overall) | 4,676 (51.3%) | 4,444 (48.7%) |
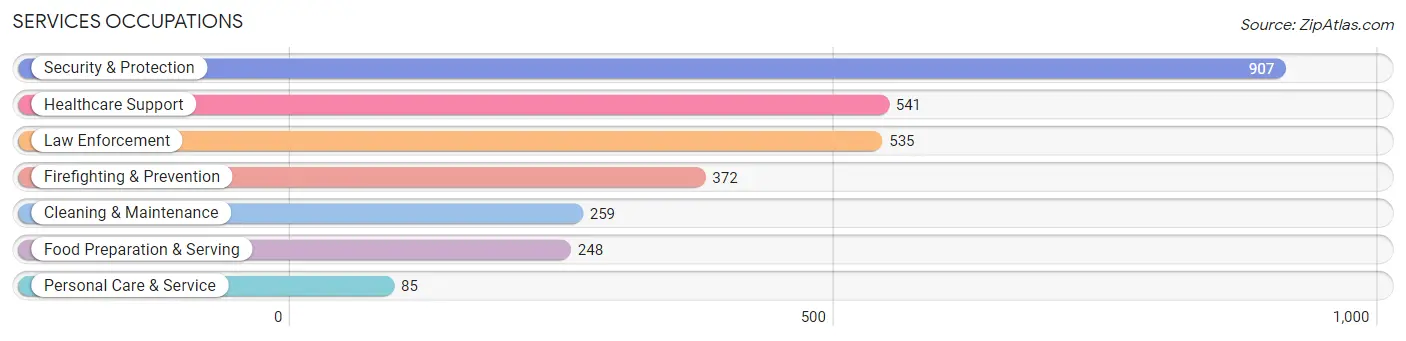
Services Occupations
The most common Services occupations in Rio Rico are Security & Protection (907 | 10.0%), Healthcare Support (541 | 5.9%), Law Enforcement (535 | 5.9%), Firefighting & Prevention (372 | 4.1%), and Cleaning & Maintenance (259 | 2.8%).
Services Occupations by Sex
Within the Services occupations in Rio Rico, the most male-oriented occupations are Law Enforcement (96.1%), Security & Protection (86.7%), and Firefighting & Prevention (73.1%), while the most female-oriented occupations are Healthcare Support (97.8%), Food Preparation & Serving (77.8%), and Personal Care & Service (48.2%).
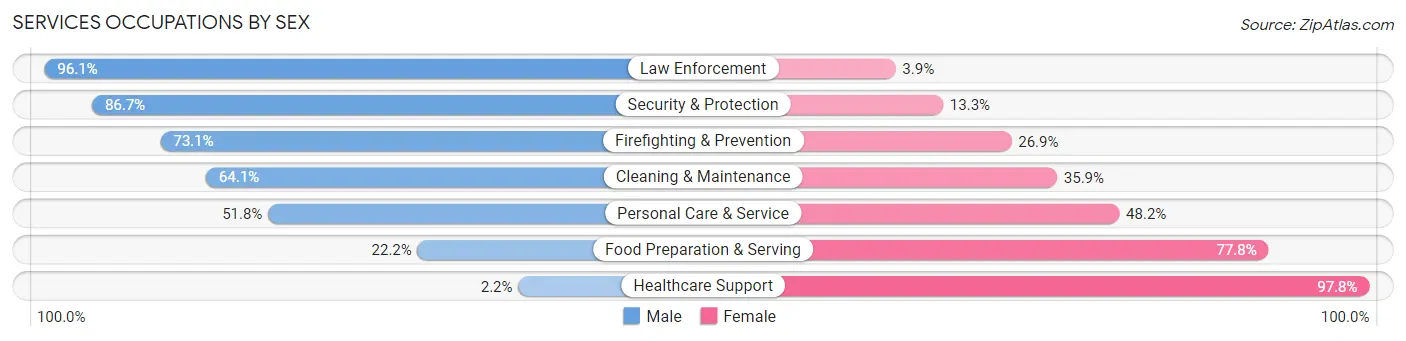
| Occupation | Male | Female |
| Healthcare Support | 12 (2.2%) | 529 (97.8%) |
| Security & Protection | 786 (86.7%) | 121 (13.3%) |
| Firefighting & Prevention | 272 (73.1%) | 100 (26.9%) |
| Law Enforcement | 514 (96.1%) | 21 (3.9%) |
| Food Preparation & Serving | 55 (22.2%) | 193 (77.8%) |
| Cleaning & Maintenance | 166 (64.1%) | 93 (35.9%) |
| Personal Care & Service | 44 (51.8%) | 41 (48.2%) |
| Total (Category) | 1,063 (52.1%) | 977 (47.9%) |
| Total (Overall) | 4,676 (51.3%) | 4,444 (48.7%) |
Sales and Office Occupations
The most common Sales and Office occupations in Rio Rico are Office & Administration (1,424 | 15.6%), and Sales & Related (1,086 | 11.9%).

Sales and Office Occupations by Sex

| Occupation | Male | Female |
| Sales & Related | 483 (44.5%) | 603 (55.5%) |
| Office & Administration | 649 (45.6%) | 775 (54.4%) |
| Total (Category) | 1,132 (45.1%) | 1,378 (54.9%) |
| Total (Overall) | 4,676 (51.3%) | 4,444 (48.7%) |
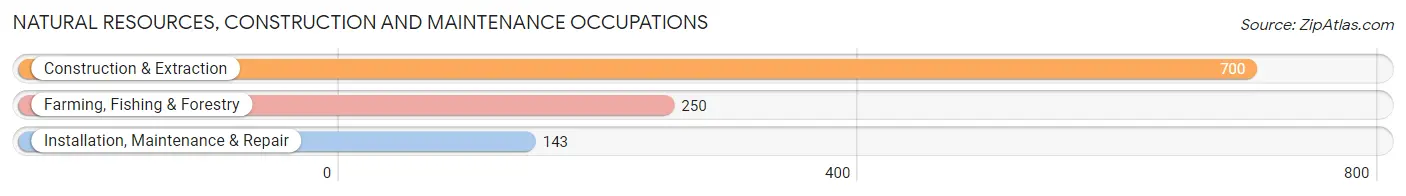
Natural Resources, Construction and Maintenance Occupations
The most common Natural Resources, Construction and Maintenance occupations in Rio Rico are Construction & Extraction (700 | 7.7%), Farming, Fishing & Forestry (250 | 2.7%), and Installation, Maintenance & Repair (143 | 1.6%).
Natural Resources, Construction and Maintenance Occupations by Sex
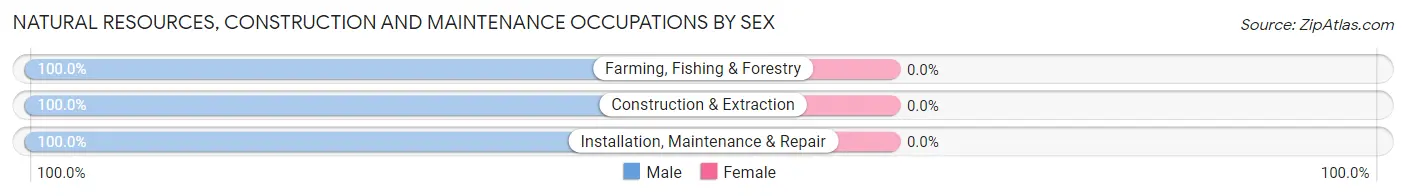
| Occupation | Male | Female |
| Farming, Fishing & Forestry | 250 (100.0%) | 0 (0.0%) |
| Construction & Extraction | 700 (100.0%) | 0 (0.0%) |
| Installation, Maintenance & Repair | 143 (100.0%) | 0 (0.0%) |
| Total (Category) | 1,093 (100.0%) | 0 (0.0%) |
| Total (Overall) | 4,676 (51.3%) | 4,444 (48.7%) |
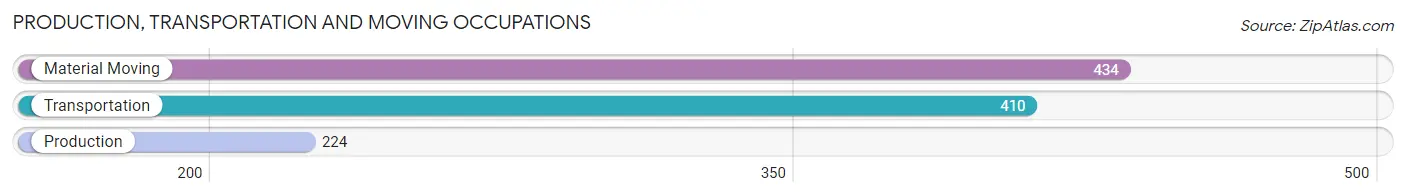
Production, Transportation and Moving Occupations
The most common Production, Transportation and Moving occupations in Rio Rico are Material Moving (434 | 4.8%), Transportation (410 | 4.5%), and Production (224 | 2.5%).
Production, Transportation and Moving Occupations by Sex
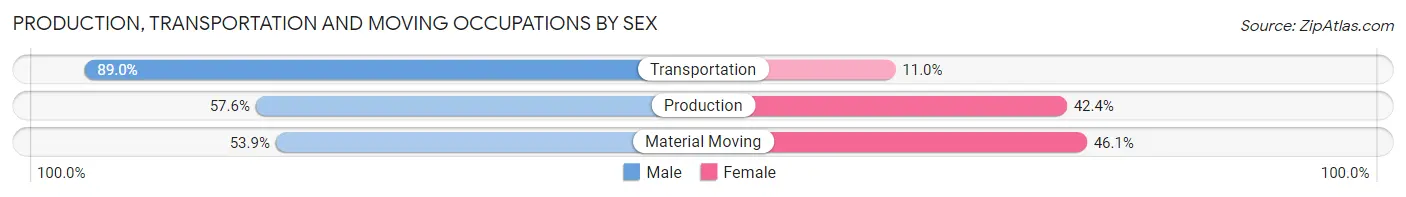
| Occupation | Male | Female |
| Production | 129 (57.6%) | 95 (42.4%) |
| Transportation | 365 (89.0%) | 45 (11.0%) |
| Material Moving | 234 (53.9%) | 200 (46.1%) |
| Total (Category) | 728 (68.2%) | 340 (31.8%) |
| Total (Overall) | 4,676 (51.3%) | 4,444 (48.7%) |
Employment Industries by Sex in Rio Rico
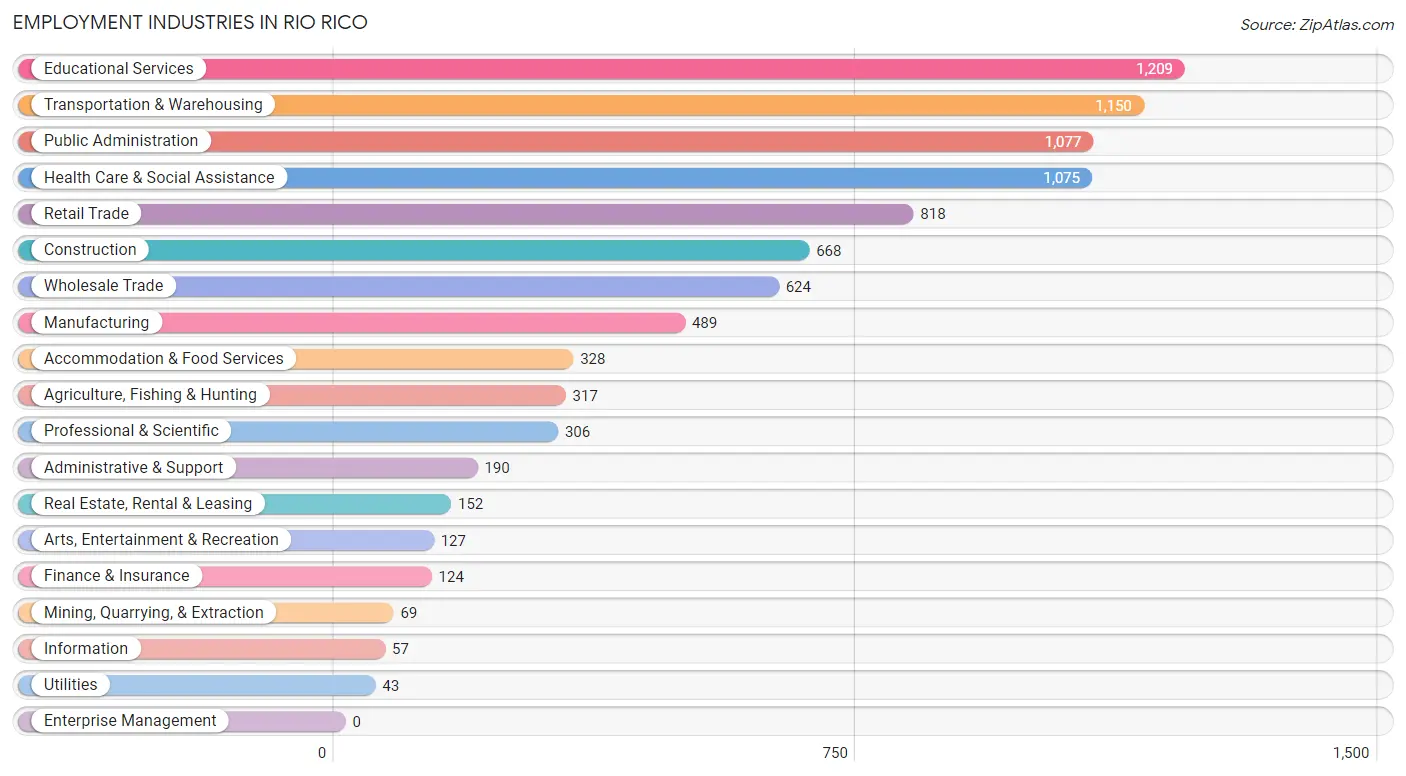
Employment Industries in Rio Rico
The major employment industries in Rio Rico include Educational Services (1,209 | 13.3%), Transportation & Warehousing (1,150 | 12.6%), Public Administration (1,077 | 11.8%), Health Care & Social Assistance (1,075 | 11.8%), and Retail Trade (818 | 9.0%).
Employment Industries by Sex in Rio Rico
The Rio Rico industries that see more men than women are Mining, Quarrying, & Extraction (100.0%), Construction (98.4%), and Agriculture, Fishing & Hunting (91.5%), whereas the industries that tend to have a higher number of women are Educational Services (91.9%), Finance & Insurance (90.3%), and Utilities (88.4%).
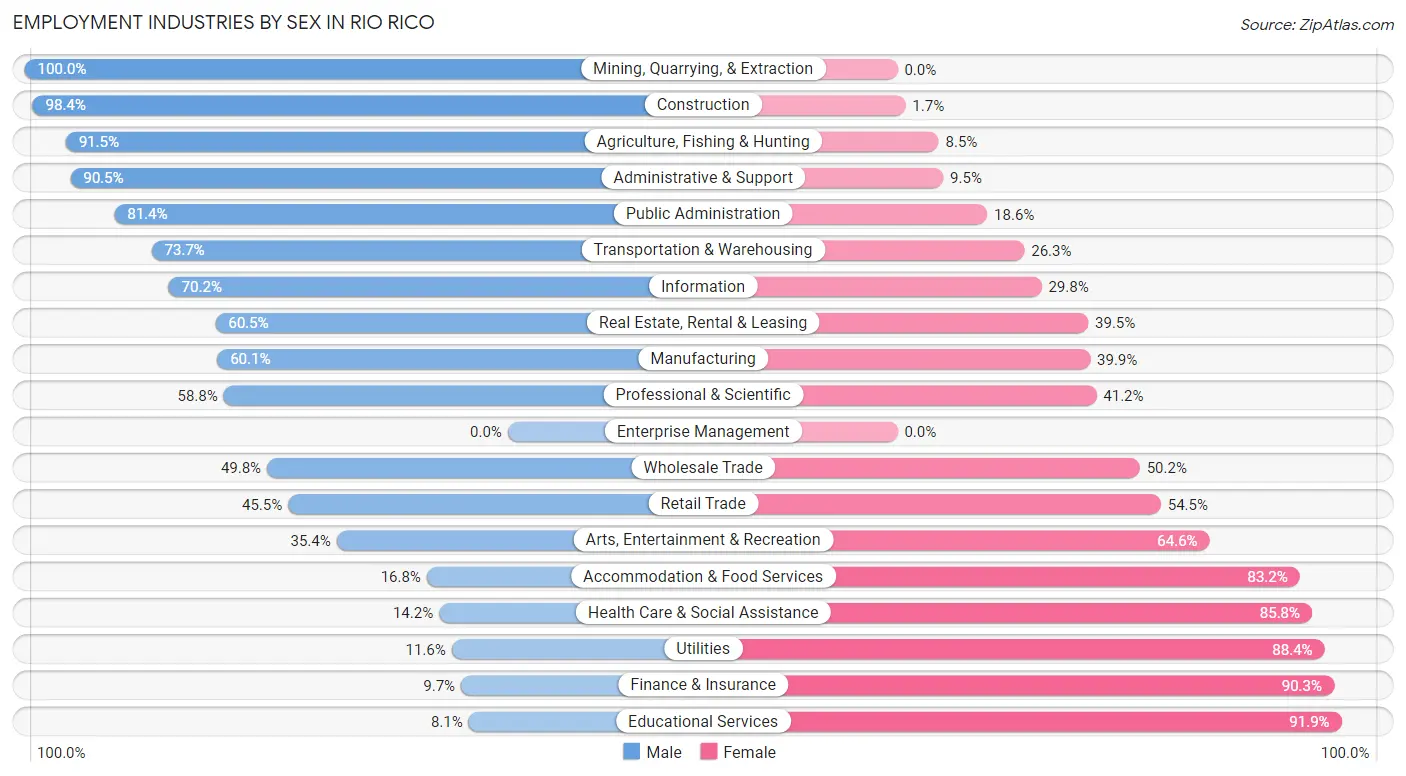
| Industry | Male | Female |
| Agriculture, Fishing & Hunting | 290 (91.5%) | 27 (8.5%) |
| Mining, Quarrying, & Extraction | 69 (100.0%) | 0 (0.0%) |
| Construction | 657 (98.4%) | 11 (1.7%) |
| Manufacturing | 294 (60.1%) | 195 (39.9%) |
| Wholesale Trade | 311 (49.8%) | 313 (50.2%) |
| Retail Trade | 372 (45.5%) | 446 (54.5%) |
| Transportation & Warehousing | 848 (73.7%) | 302 (26.3%) |
| Utilities | 5 (11.6%) | 38 (88.4%) |
| Information | 40 (70.2%) | 17 (29.8%) |
| Finance & Insurance | 12 (9.7%) | 112 (90.3%) |
| Real Estate, Rental & Leasing | 92 (60.5%) | 60 (39.5%) |
| Professional & Scientific | 180 (58.8%) | 126 (41.2%) |
| Enterprise Management | 0 (0.0%) | 0 (0.0%) |
| Administrative & Support | 172 (90.5%) | 18 (9.5%) |
| Educational Services | 98 (8.1%) | 1,111 (91.9%) |
| Health Care & Social Assistance | 153 (14.2%) | 922 (85.8%) |
| Arts, Entertainment & Recreation | 45 (35.4%) | 82 (64.6%) |
| Accommodation & Food Services | 55 (16.8%) | 273 (83.2%) |
| Public Administration | 877 (81.4%) | 200 (18.6%) |
| Total | 4,676 (51.3%) | 4,444 (48.7%) |
Education in Rio Rico
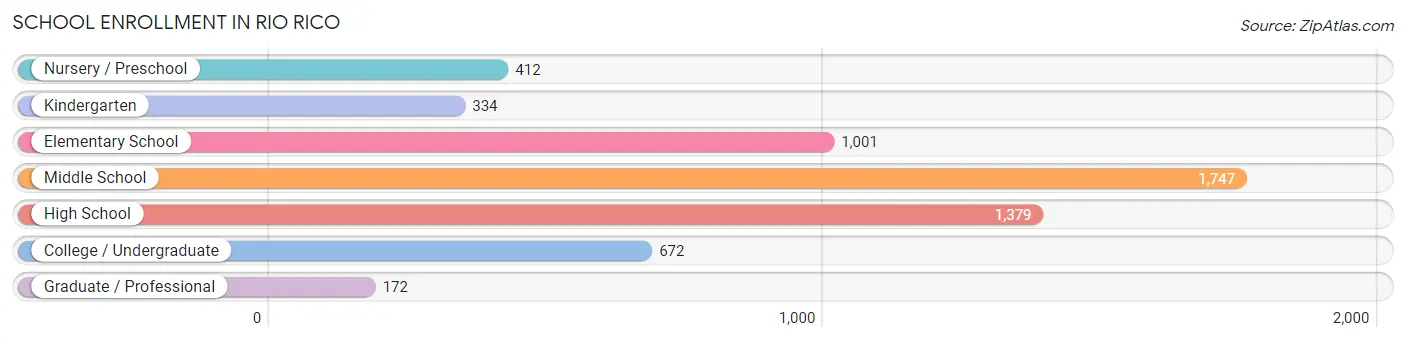
School Enrollment in Rio Rico
The most common levels of schooling among the 5,717 students in Rio Rico are middle school (1,747 | 30.6%), high school (1,379 | 24.1%), and elementary school (1,001 | 17.5%).
| School Level | # Students | % Students |
| Nursery / Preschool | 412 | 7.2% |
| Kindergarten | 334 | 5.8% |
| Elementary School | 1,001 | 17.5% |
| Middle School | 1,747 | 30.6% |
| High School | 1,379 | 24.1% |
| College / Undergraduate | 672 | 11.7% |
| Graduate / Professional | 172 | 3.0% |
| Total | 5,717 | 100.0% |
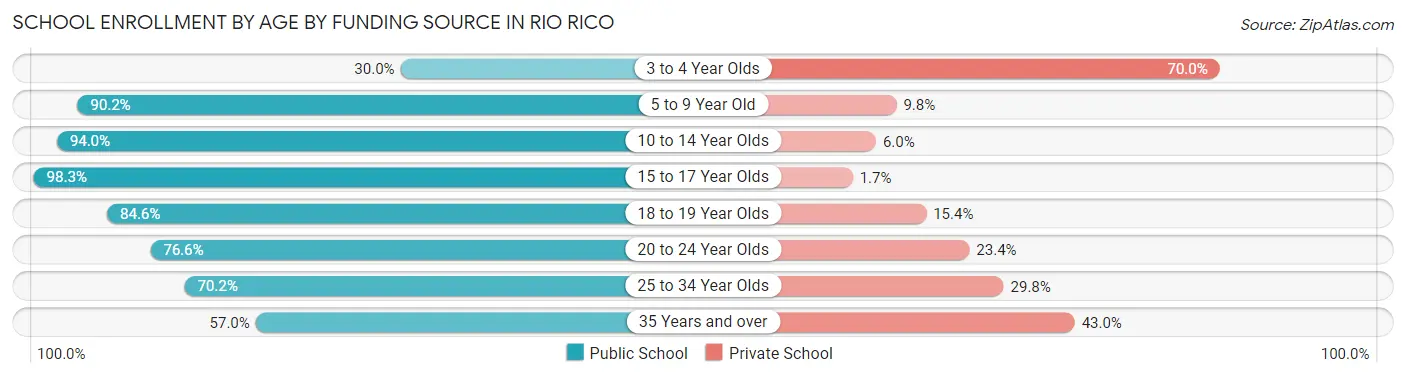
School Enrollment by Age by Funding Source in Rio Rico
Out of a total of 5,717 students who are enrolled in schools in Rio Rico, 657 (11.5%) attend a private institution, while the remaining 5,060 (88.5%) are enrolled in public schools. The age group of 3 to 4 year olds has the highest likelihood of being enrolled in private schools, with 84 (70.0% in the age bracket) enrolled. Conversely, the age group of 15 to 17 year olds has the lowest likelihood of being enrolled in a private school, with 931 (98.3% in the age bracket) attending a public institution.
| Age Bracket | Public School | Private School |
| 3 to 4 Year Olds | 36 (30.0%) | 84 (70.0%) |
| 5 to 9 Year Old | 1,457 (90.2%) | 159 (9.8%) |
| 10 to 14 Year Olds | 1,815 (94.0%) | 116 (6.0%) |
| 15 to 17 Year Olds | 931 (98.3%) | 16 (1.7%) |
| 18 to 19 Year Olds | 374 (84.6%) | 68 (15.4%) |
| 20 to 24 Year Olds | 170 (76.6%) | 52 (23.4%) |
| 25 to 34 Year Olds | 132 (70.2%) | 56 (29.8%) |
| 35 Years and over | 143 (57.0%) | 108 (43.0%) |
| Total | 5,060 (88.5%) | 657 (11.5%) |
Educational Attainment by Field of Study in Rio Rico
Business (753 | 23.6%), education (748 | 23.4%), science & technology (359 | 11.2%), engineering (304 | 9.5%), and liberal arts & history (248 | 7.8%) are the most common fields of study among 3,195 individuals in Rio Rico who have obtained a bachelor's degree or higher.
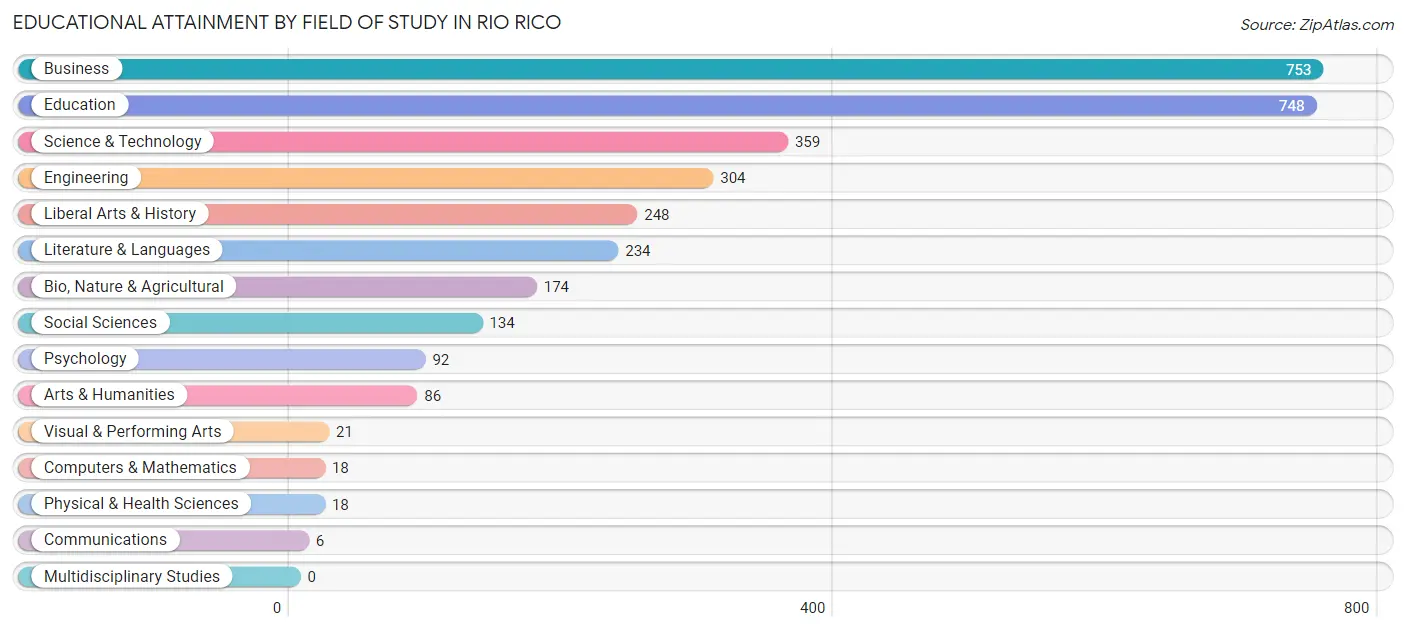
| Field of Study | # Graduates | % Graduates |
| Computers & Mathematics | 18 | 0.6% |
| Bio, Nature & Agricultural | 174 | 5.4% |
| Physical & Health Sciences | 18 | 0.6% |
| Psychology | 92 | 2.9% |
| Social Sciences | 134 | 4.2% |
| Engineering | 304 | 9.5% |
| Multidisciplinary Studies | 0 | 0.0% |
| Science & Technology | 359 | 11.2% |
| Business | 753 | 23.6% |
| Education | 748 | 23.4% |
| Literature & Languages | 234 | 7.3% |
| Liberal Arts & History | 248 | 7.8% |
| Visual & Performing Arts | 21 | 0.7% |
| Communications | 6 | 0.2% |
| Arts & Humanities | 86 | 2.7% |
| Total | 3,195 | 100.0% |
Transportation & Commute in Rio Rico
Vehicle Availability by Sex in Rio Rico
The most prevalent vehicle ownership categories in Rio Rico are males with 3 vehicles (1,918, accounting for 41.5%) and females with 3 vehicles (1,128, making up 45.3%).
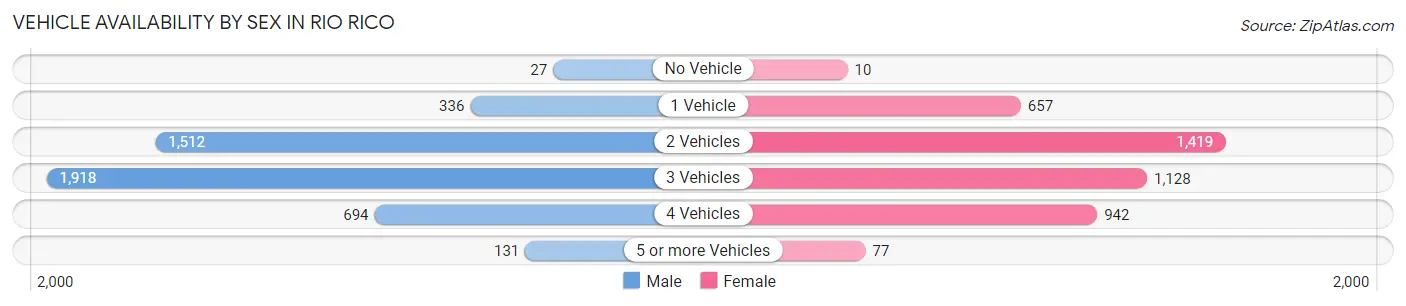
| Vehicles Available | Male | Female |
| No Vehicle | 27 (0.6%) | 10 (0.2%) |
| 1 Vehicle | 336 (7.3%) | 657 (15.5%) |
| 2 Vehicles | 1,512 (32.7%) | 1,419 (33.5%) |
| 3 Vehicles | 1,918 (41.5%) | 1,128 (26.7%) |
| 4 Vehicles | 694 (15.0%) | 942 (22.3%) |
| 5 or more Vehicles | 131 (2.8%) | 77 (1.8%) |
| Total | 4,618 (100.0%) | 4,233 (100.0%) |
Commute Time in Rio Rico
The most frequently occuring commute durations in Rio Rico are 15 to 19 minutes (2,498 commuters, 29.9%), 20 to 24 minutes (1,858 commuters, 22.2%), and 10 to 14 minutes (1,297 commuters, 15.5%).
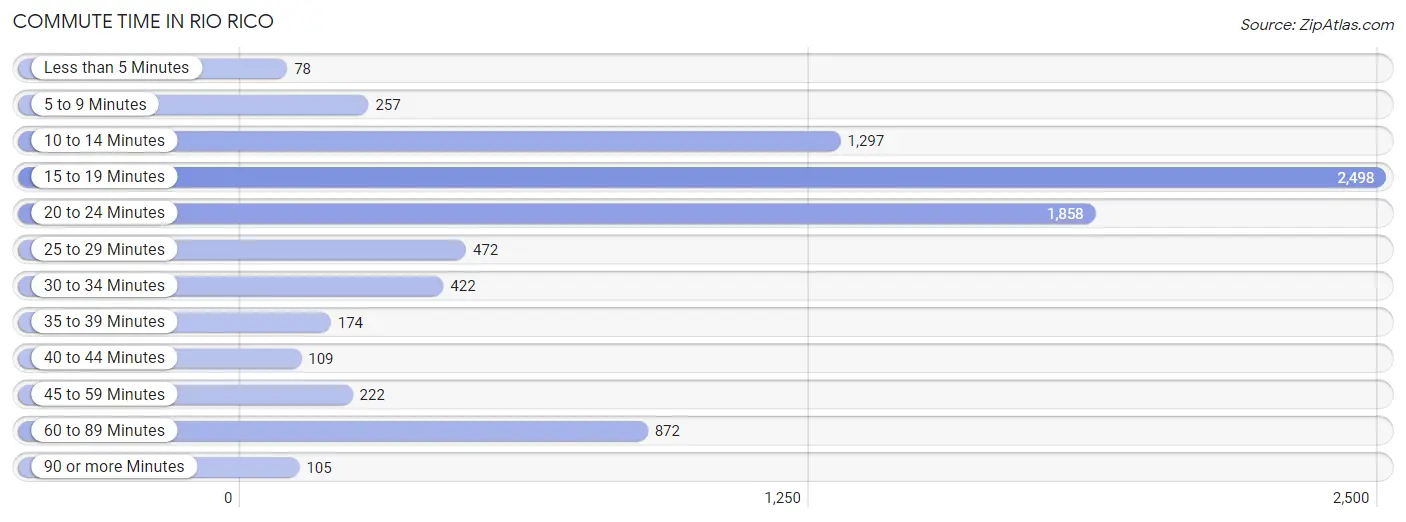
| Commute Time | # Commuters | % Commuters |
| Less than 5 Minutes | 78 | 0.9% |
| 5 to 9 Minutes | 257 | 3.1% |
| 10 to 14 Minutes | 1,297 | 15.5% |
| 15 to 19 Minutes | 2,498 | 29.9% |
| 20 to 24 Minutes | 1,858 | 22.2% |
| 25 to 29 Minutes | 472 | 5.6% |
| 30 to 34 Minutes | 422 | 5.1% |
| 35 to 39 Minutes | 174 | 2.1% |
| 40 to 44 Minutes | 109 | 1.3% |
| 45 to 59 Minutes | 222 | 2.6% |
| 60 to 89 Minutes | 872 | 10.4% |
| 90 or more Minutes | 105 | 1.3% |
Commute Time by Sex in Rio Rico
The most common commute times in Rio Rico are 15 to 19 minutes (1,248 commuters, 27.9%) for males and 15 to 19 minutes (1,250 commuters, 32.1%) for females.
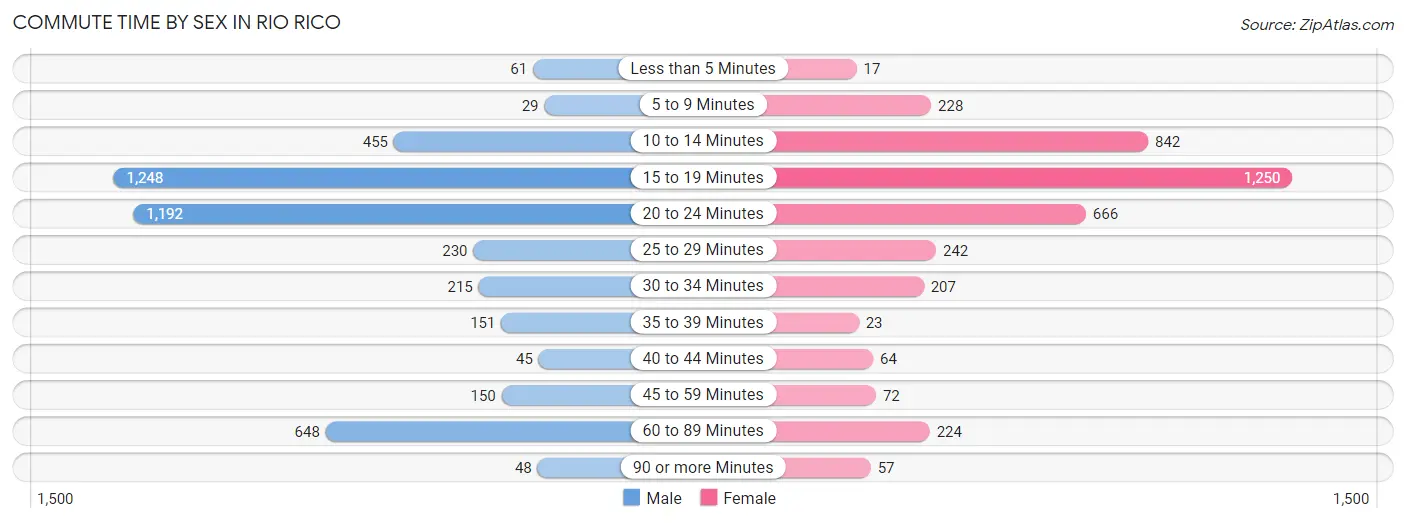
| Commute Time | Male | Female |
| Less than 5 Minutes | 61 (1.4%) | 17 (0.4%) |
| 5 to 9 Minutes | 29 (0.6%) | 228 (5.9%) |
| 10 to 14 Minutes | 455 (10.2%) | 842 (21.6%) |
| 15 to 19 Minutes | 1,248 (27.9%) | 1,250 (32.1%) |
| 20 to 24 Minutes | 1,192 (26.7%) | 666 (17.1%) |
| 25 to 29 Minutes | 230 (5.1%) | 242 (6.2%) |
| 30 to 34 Minutes | 215 (4.8%) | 207 (5.3%) |
| 35 to 39 Minutes | 151 (3.4%) | 23 (0.6%) |
| 40 to 44 Minutes | 45 (1.0%) | 64 (1.6%) |
| 45 to 59 Minutes | 150 (3.4%) | 72 (1.8%) |
| 60 to 89 Minutes | 648 (14.5%) | 224 (5.8%) |
| 90 or more Minutes | 48 (1.1%) | 57 (1.5%) |
Time of Departure to Work by Sex in Rio Rico
The most frequent times of departure to work in Rio Rico are 12:00 AM to 4:59 AM (551, 12.3%) for males and 7:00 AM to 7:29 AM (883, 22.7%) for females.
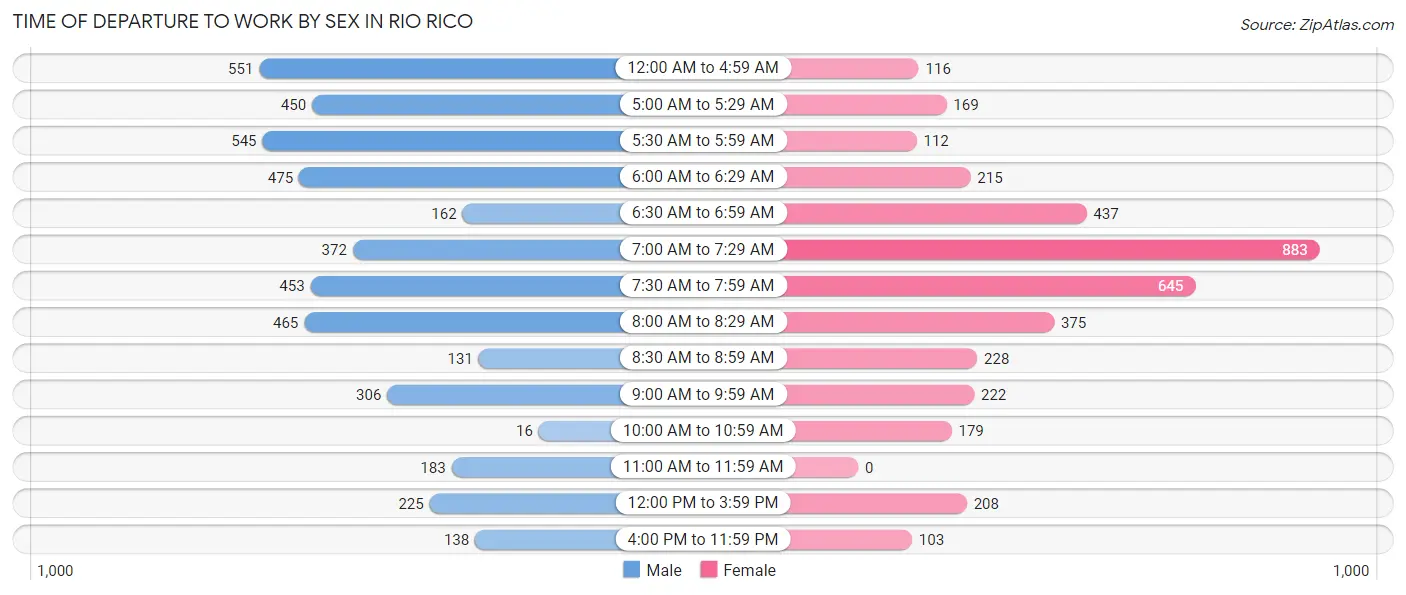
| Time of Departure | Male | Female |
| 12:00 AM to 4:59 AM | 551 (12.3%) | 116 (3.0%) |
| 5:00 AM to 5:29 AM | 450 (10.1%) | 169 (4.3%) |
| 5:30 AM to 5:59 AM | 545 (12.2%) | 112 (2.9%) |
| 6:00 AM to 6:29 AM | 475 (10.6%) | 215 (5.5%) |
| 6:30 AM to 6:59 AM | 162 (3.6%) | 437 (11.2%) |
| 7:00 AM to 7:29 AM | 372 (8.3%) | 883 (22.7%) |
| 7:30 AM to 7:59 AM | 453 (10.1%) | 645 (16.6%) |
| 8:00 AM to 8:29 AM | 465 (10.4%) | 375 (9.6%) |
| 8:30 AM to 8:59 AM | 131 (2.9%) | 228 (5.9%) |
| 9:00 AM to 9:59 AM | 306 (6.8%) | 222 (5.7%) |
| 10:00 AM to 10:59 AM | 16 (0.4%) | 179 (4.6%) |
| 11:00 AM to 11:59 AM | 183 (4.1%) | 0 (0.0%) |
| 12:00 PM to 3:59 PM | 225 (5.0%) | 208 (5.3%) |
| 4:00 PM to 11:59 PM | 138 (3.1%) | 103 (2.6%) |
| Total | 4,472 (100.0%) | 3,892 (100.0%) |
Housing Occupancy in Rio Rico
Occupancy by Ownership in Rio Rico
Of the total 6,809 dwellings in Rio Rico, owner-occupied units account for 5,567 (81.8%), while renter-occupied units make up 1,242 (18.2%).
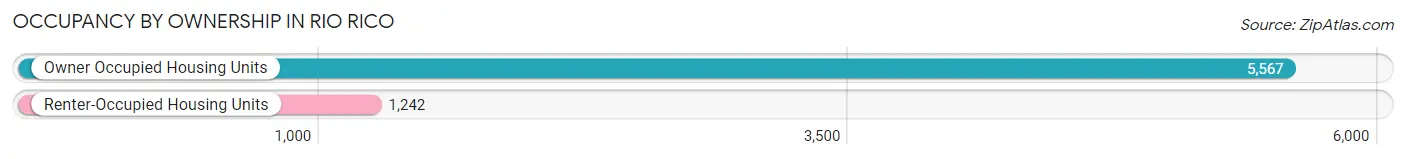
| Occupancy | # Housing Units | % Housing Units |
| Owner Occupied Housing Units | 5,567 | 81.8% |
| Renter-Occupied Housing Units | 1,242 | 18.2% |
| Total Occupied Housing Units | 6,809 | 100.0% |
Occupancy by Household Size in Rio Rico
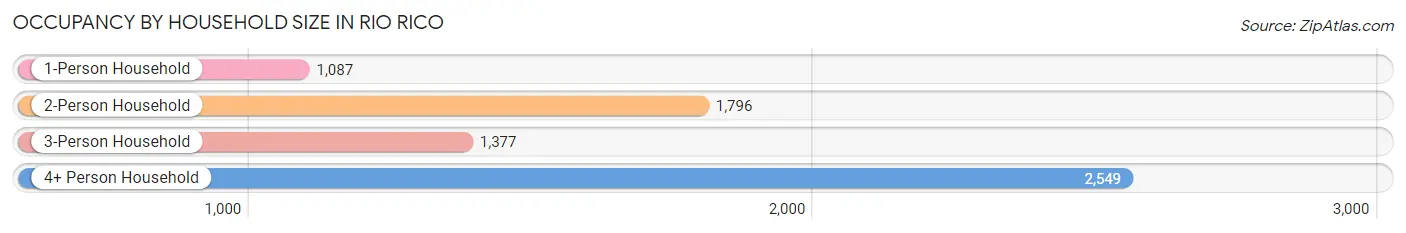
| Household Size | # Housing Units | % Housing Units |
| 1-Person Household | 1,087 | 16.0% |
| 2-Person Household | 1,796 | 26.4% |
| 3-Person Household | 1,377 | 20.2% |
| 4+ Person Household | 2,549 | 37.4% |
| Total Housing Units | 6,809 | 100.0% |
Occupancy by Ownership by Household Size in Rio Rico
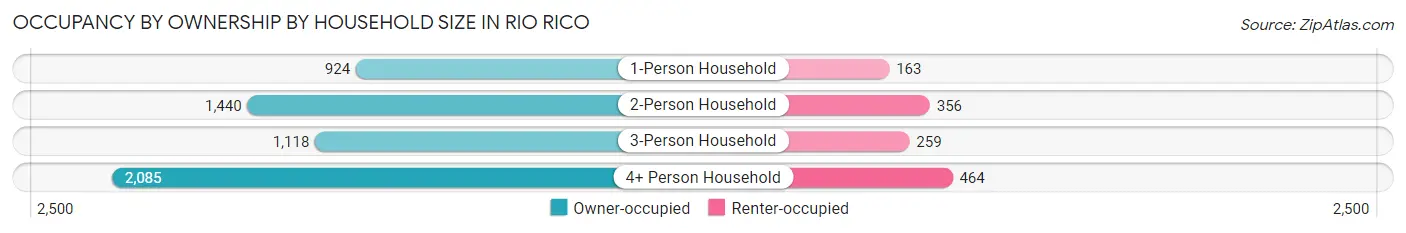
| Household Size | Owner-occupied | Renter-occupied |
| 1-Person Household | 924 (85.0%) | 163 (15.0%) |
| 2-Person Household | 1,440 (80.2%) | 356 (19.8%) |
| 3-Person Household | 1,118 (81.2%) | 259 (18.8%) |
| 4+ Person Household | 2,085 (81.8%) | 464 (18.2%) |
| Total Housing Units | 5,567 (81.8%) | 1,242 (18.2%) |
Occupancy by Educational Attainment in Rio Rico
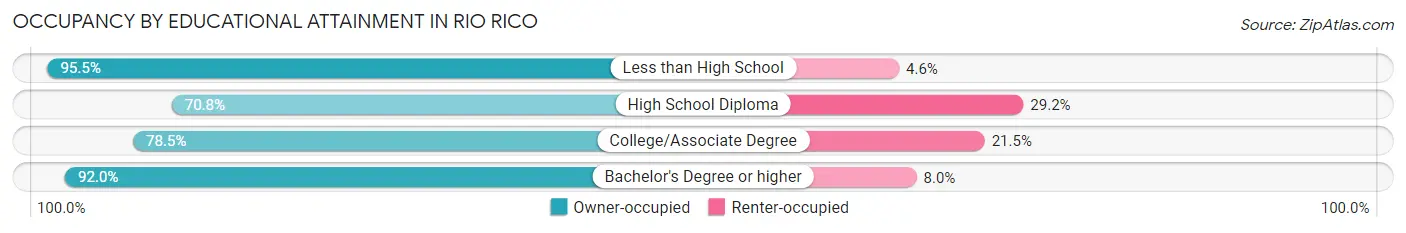
| Household Size | Owner-occupied | Renter-occupied |
| Less than High School | 882 (95.5%) | 42 (4.5%) |
| High School Diploma | 1,327 (70.8%) | 547 (29.2%) |
| College/Associate Degree | 1,925 (78.5%) | 528 (21.5%) |
| Bachelor's Degree or higher | 1,433 (92.0%) | 125 (8.0%) |
Occupancy by Age of Householder in Rio Rico
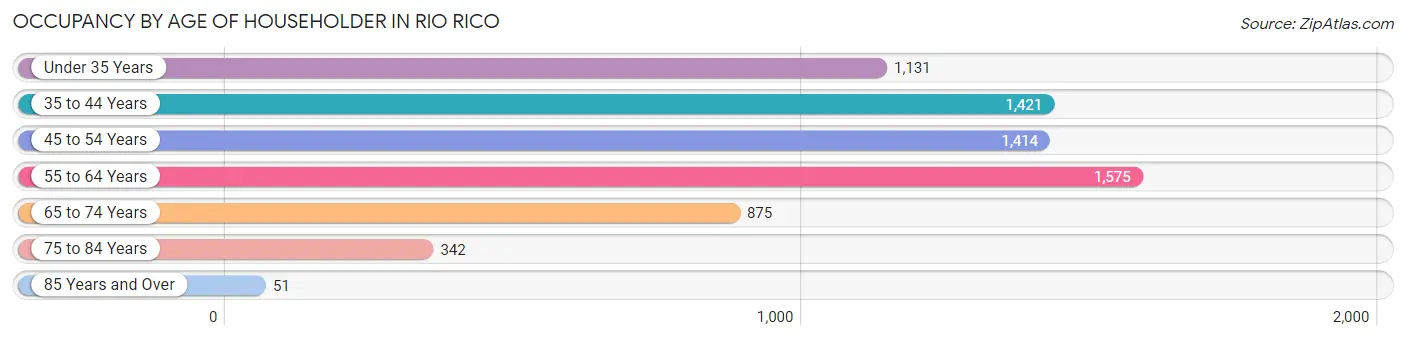
| Age Bracket | # Households | % Households |
| Under 35 Years | 1,131 | 16.6% |
| 35 to 44 Years | 1,421 | 20.9% |
| 45 to 54 Years | 1,414 | 20.8% |
| 55 to 64 Years | 1,575 | 23.1% |
| 65 to 74 Years | 875 | 12.9% |
| 75 to 84 Years | 342 | 5.0% |
| 85 Years and Over | 51 | 0.7% |
| Total | 6,809 | 100.0% |
Housing Finances in Rio Rico
Median Income by Occupancy in Rio Rico
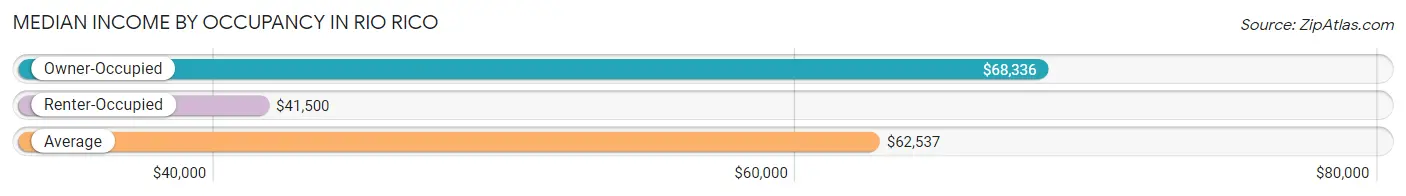
| Occupancy Type | # Households | Median Income |
| Owner-Occupied | 5,567 (81.8%) | $68,336 |
| Renter-Occupied | 1,242 (18.2%) | $41,500 |
| Average | 6,809 (100.0%) | $62,537 |
Occupancy by Householder Income Bracket in Rio Rico
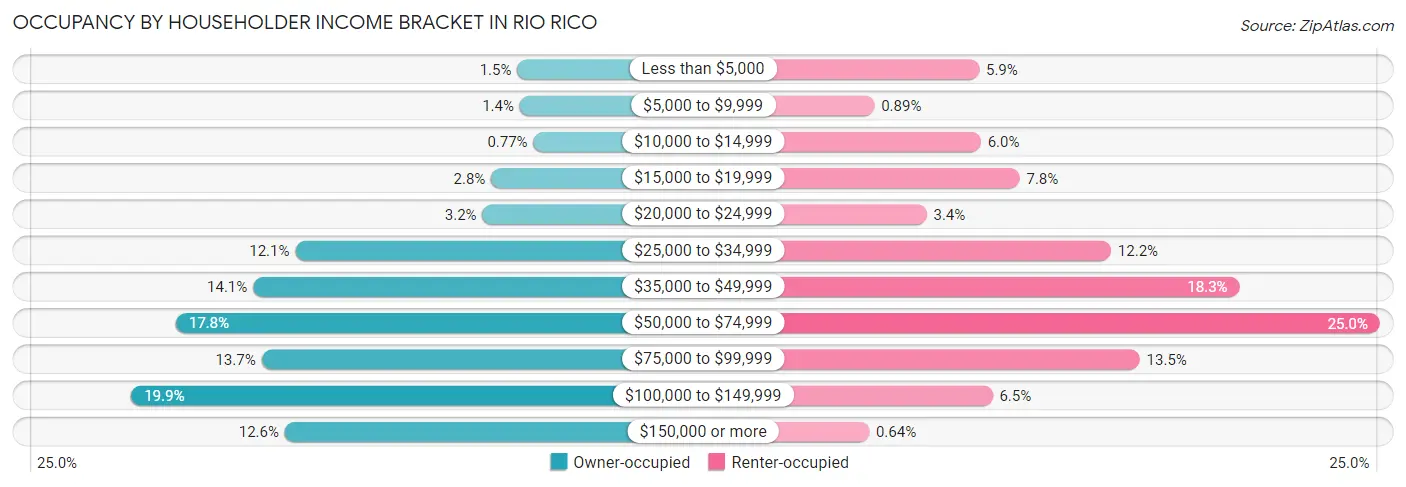
| Income Bracket | Owner-occupied | Renter-occupied |
| Less than $5,000 | 86 (1.5%) | 73 (5.9%) |
| $5,000 to $9,999 | 79 (1.4%) | 11 (0.9%) |
| $10,000 to $14,999 | 43 (0.8%) | 74 (6.0%) |
| $15,000 to $19,999 | 155 (2.8%) | 97 (7.8%) |
| $20,000 to $24,999 | 178 (3.2%) | 42 (3.4%) |
| $25,000 to $34,999 | 674 (12.1%) | 151 (12.2%) |
| $35,000 to $49,999 | 786 (14.1%) | 227 (18.3%) |
| $50,000 to $74,999 | 991 (17.8%) | 310 (25.0%) |
| $75,000 to $99,999 | 764 (13.7%) | 168 (13.5%) |
| $100,000 to $149,999 | 1,109 (19.9%) | 81 (6.5%) |
| $150,000 or more | 702 (12.6%) | 8 (0.6%) |
| Total | 5,567 (100.0%) | 1,242 (100.0%) |
Monthly Housing Cost Tiers in Rio Rico
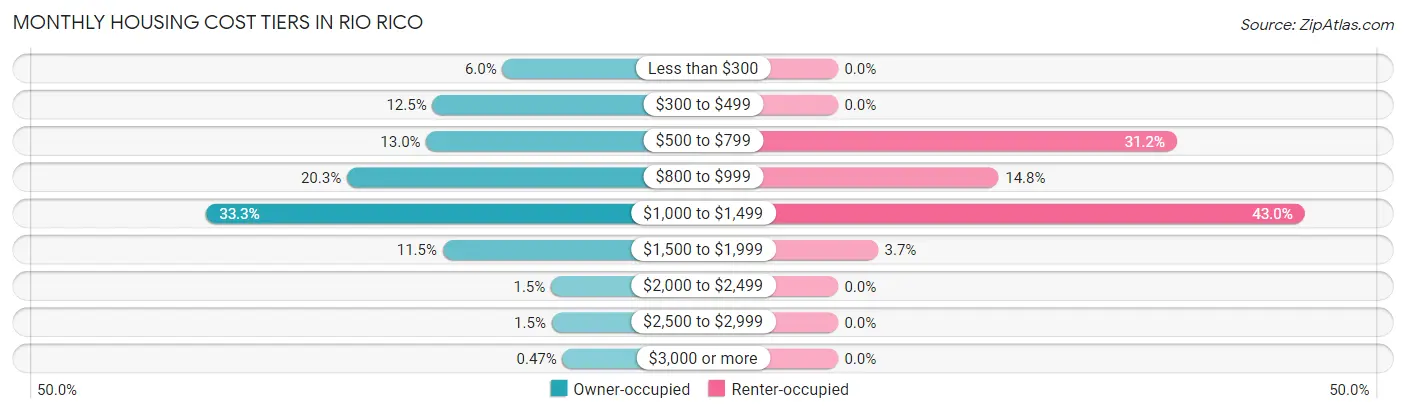
| Monthly Cost | Owner-occupied | Renter-occupied |
| Less than $300 | 334 (6.0%) | 0 (0.0%) |
| $300 to $499 | 693 (12.4%) | 0 (0.0%) |
| $500 to $799 | 724 (13.0%) | 388 (31.2%) |
| $800 to $999 | 1,131 (20.3%) | 184 (14.8%) |
| $1,000 to $1,499 | 1,852 (33.3%) | 534 (43.0%) |
| $1,500 to $1,999 | 640 (11.5%) | 46 (3.7%) |
| $2,000 to $2,499 | 85 (1.5%) | 0 (0.0%) |
| $2,500 to $2,999 | 82 (1.5%) | 0 (0.0%) |
| $3,000 or more | 26 (0.5%) | 0 (0.0%) |
| Total | 5,567 (100.0%) | 1,242 (100.0%) |
Physical Housing Characteristics in Rio Rico
Housing Structures in Rio Rico
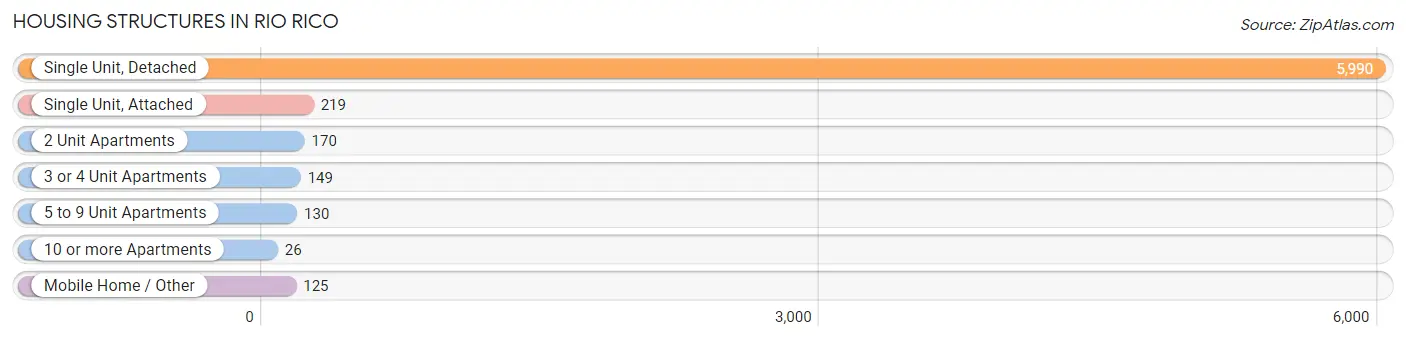
| Structure Type | # Housing Units | % Housing Units |
| Single Unit, Detached | 5,990 | 88.0% |
| Single Unit, Attached | 219 | 3.2% |
| 2 Unit Apartments | 170 | 2.5% |
| 3 or 4 Unit Apartments | 149 | 2.2% |
| 5 to 9 Unit Apartments | 130 | 1.9% |
| 10 or more Apartments | 26 | 0.4% |
| Mobile Home / Other | 125 | 1.8% |
| Total | 6,809 | 100.0% |
Housing Structures by Occupancy in Rio Rico
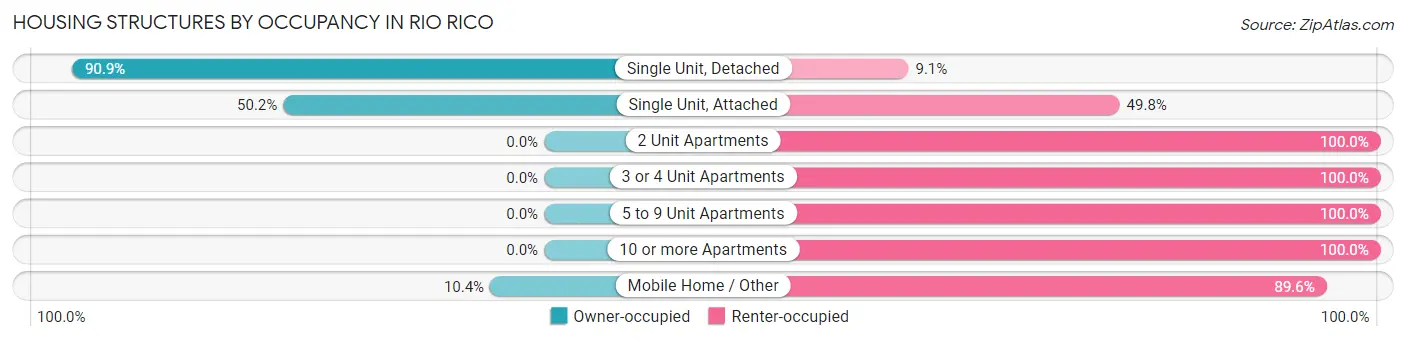
| Structure Type | Owner-occupied | Renter-occupied |
| Single Unit, Detached | 5,444 (90.9%) | 546 (9.1%) |
| Single Unit, Attached | 110 (50.2%) | 109 (49.8%) |
| 2 Unit Apartments | 0 (0.0%) | 170 (100.0%) |
| 3 or 4 Unit Apartments | 0 (0.0%) | 149 (100.0%) |
| 5 to 9 Unit Apartments | 0 (0.0%) | 130 (100.0%) |
| 10 or more Apartments | 0 (0.0%) | 26 (100.0%) |
| Mobile Home / Other | 13 (10.4%) | 112 (89.6%) |
| Total | 5,567 (81.8%) | 1,242 (18.2%) |
Housing Structures by Number of Rooms in Rio Rico
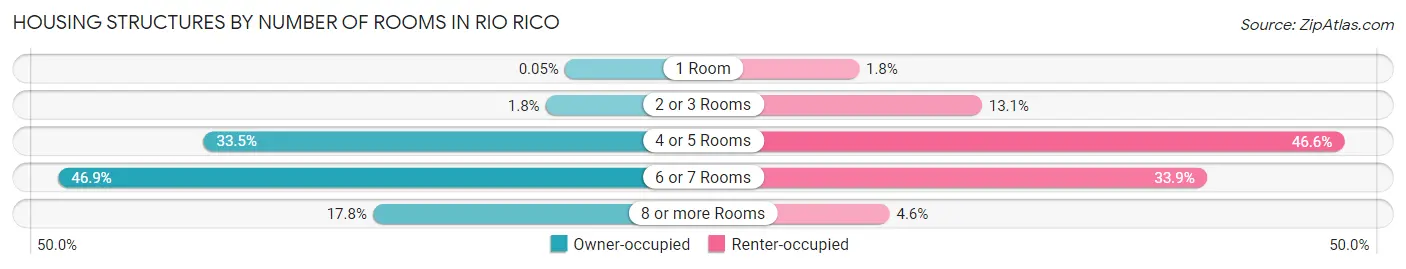
| Number of Rooms | Owner-occupied | Renter-occupied |
| 1 Room | 3 (0.1%) | 22 (1.8%) |
| 2 or 3 Rooms | 102 (1.8%) | 163 (13.1%) |
| 4 or 5 Rooms | 1,862 (33.5%) | 579 (46.6%) |
| 6 or 7 Rooms | 2,609 (46.9%) | 421 (33.9%) |
| 8 or more Rooms | 991 (17.8%) | 57 (4.6%) |
| Total | 5,567 (100.0%) | 1,242 (100.0%) |
Housing Structure by Heating Type in Rio Rico
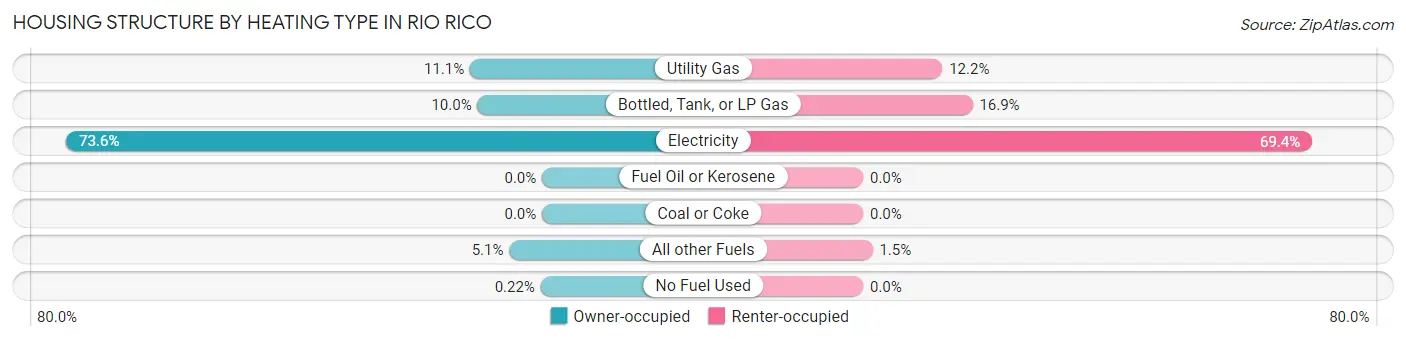
| Heating Type | Owner-occupied | Renter-occupied |
| Utility Gas | 620 (11.1%) | 152 (12.2%) |
| Bottled, Tank, or LP Gas | 556 (10.0%) | 210 (16.9%) |
| Electricity | 4,097 (73.6%) | 862 (69.4%) |
| Fuel Oil or Kerosene | 0 (0.0%) | 0 (0.0%) |
| Coal or Coke | 0 (0.0%) | 0 (0.0%) |
| All other Fuels | 282 (5.1%) | 18 (1.5%) |
| No Fuel Used | 12 (0.2%) | 0 (0.0%) |
| Total | 5,567 (100.0%) | 1,242 (100.0%) |
Household Vehicle Usage in Rio Rico
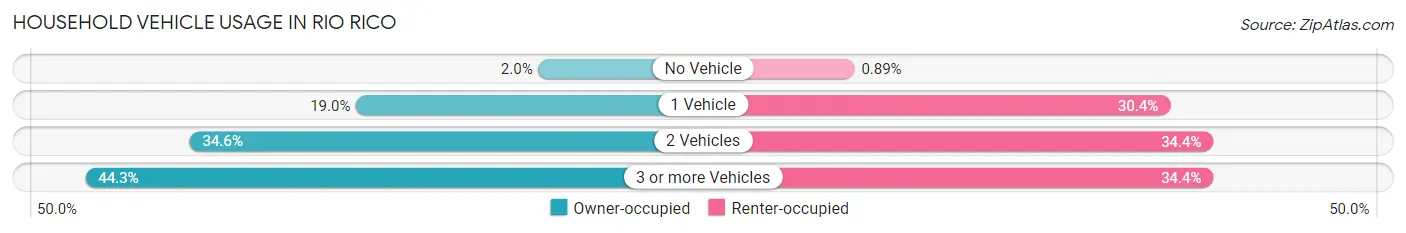
| Vehicles per Household | Owner-occupied | Renter-occupied |
| No Vehicle | 113 (2.0%) | 11 (0.9%) |
| 1 Vehicle | 1,060 (19.0%) | 377 (30.3%) |
| 2 Vehicles | 1,926 (34.6%) | 427 (34.4%) |
| 3 or more Vehicles | 2,468 (44.3%) | 427 (34.4%) |
| Total | 5,567 (100.0%) | 1,242 (100.0%) |
Real Estate & Mortgages in Rio Rico
Real Estate and Mortgage Overview in Rio Rico
| Characteristic | Without Mortgage | With Mortgage |
| Housing Units | 1,319 | 4,248 |
| Median Property Value | $189,500 | $190,700 |
| Median Household Income | $65,824 | $566 |
| Monthly Housing Costs | $375 | $20 |
| Real Estate Taxes | $1,305 | $39 |
Property Value by Mortgage Status in Rio Rico
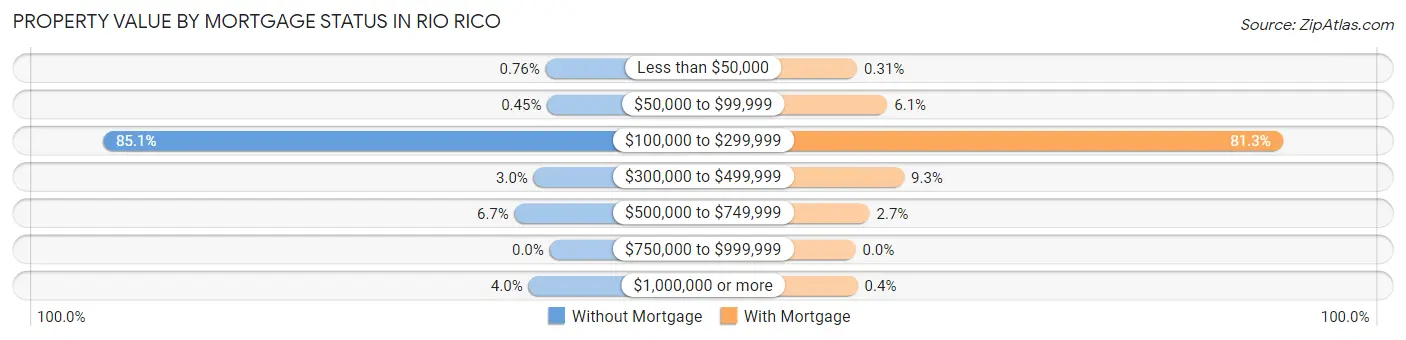
| Property Value | Without Mortgage | With Mortgage |
| Less than $50,000 | 10 (0.8%) | 13 (0.3%) |
| $50,000 to $99,999 | 6 (0.4%) | 257 (6.0%) |
| $100,000 to $299,999 | 1,122 (85.1%) | 3,454 (81.3%) |
| $300,000 to $499,999 | 40 (3.0%) | 393 (9.2%) |
| $500,000 to $749,999 | 88 (6.7%) | 114 (2.7%) |
| $750,000 to $999,999 | 0 (0.0%) | 0 (0.0%) |
| $1,000,000 or more | 53 (4.0%) | 17 (0.4%) |
| Total | 1,319 (100.0%) | 4,248 (100.0%) |
Household Income by Mortgage Status in Rio Rico
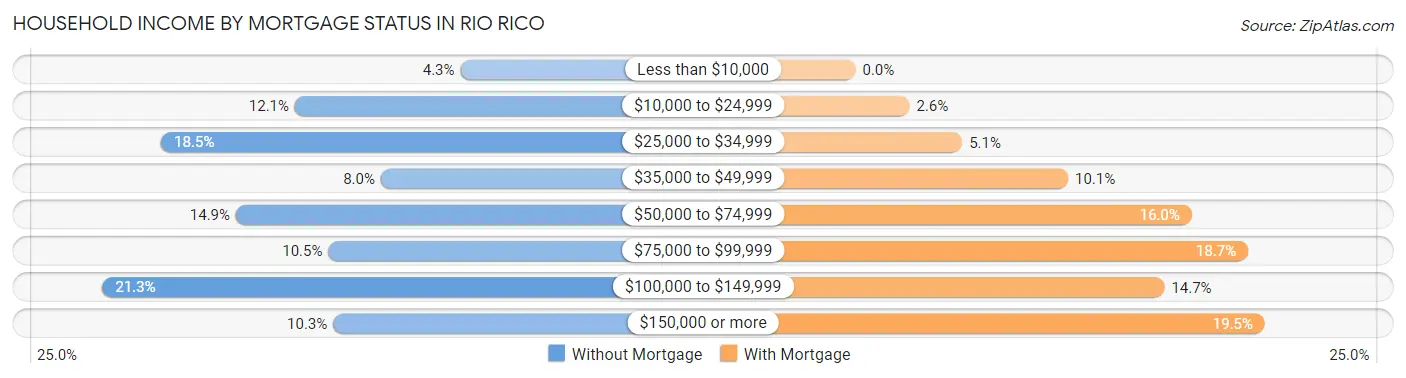
| Household Income | Without Mortgage | With Mortgage |
| Less than $10,000 | 56 (4.3%) | 0 (0.0%) |
| $10,000 to $24,999 | 160 (12.1%) | 109 (2.6%) |
| $25,000 to $34,999 | 244 (18.5%) | 216 (5.1%) |
| $35,000 to $49,999 | 106 (8.0%) | 430 (10.1%) |
| $50,000 to $74,999 | 197 (14.9%) | 680 (16.0%) |
| $75,000 to $99,999 | 139 (10.5%) | 794 (18.7%) |
| $100,000 to $149,999 | 281 (21.3%) | 625 (14.7%) |
| $150,000 or more | 136 (10.3%) | 828 (19.5%) |
| Total | 1,319 (100.0%) | 4,248 (100.0%) |
Property Value to Household Income Ratio in Rio Rico
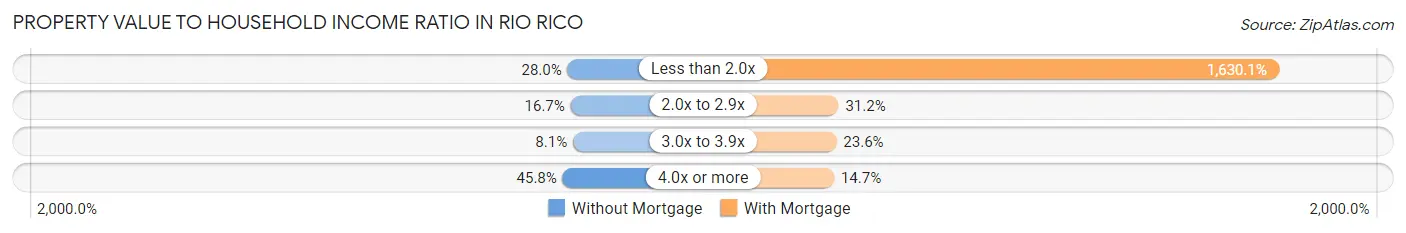
| Value-to-Income Ratio | Without Mortgage | With Mortgage |
| Less than 2.0x | 369 (28.0%) | 69,246 (1,630.1%) |
| 2.0x to 2.9x | 220 (16.7%) | 1,324 (31.2%) |
| 3.0x to 3.9x | 107 (8.1%) | 1,002 (23.6%) |
| 4.0x or more | 604 (45.8%) | 625 (14.7%) |
| Total | 1,319 (100.0%) | 4,248 (100.0%) |
Real Estate Taxes by Mortgage Status in Rio Rico
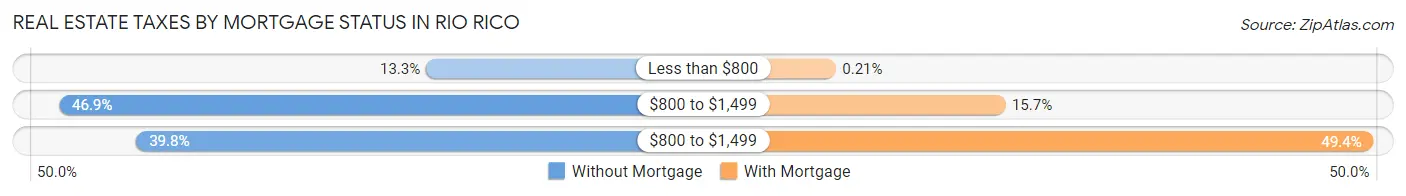
| Property Taxes | Without Mortgage | With Mortgage |
| Less than $800 | 176 (13.3%) | 9 (0.2%) |
| $800 to $1,499 | 618 (46.9%) | 667 (15.7%) |
| $800 to $1,499 | 525 (39.8%) | 2,097 (49.4%) |
| Total | 1,319 (100.0%) | 4,248 (100.0%) |
Health & Disability in Rio Rico
Health Insurance Coverage by Age in Rio Rico
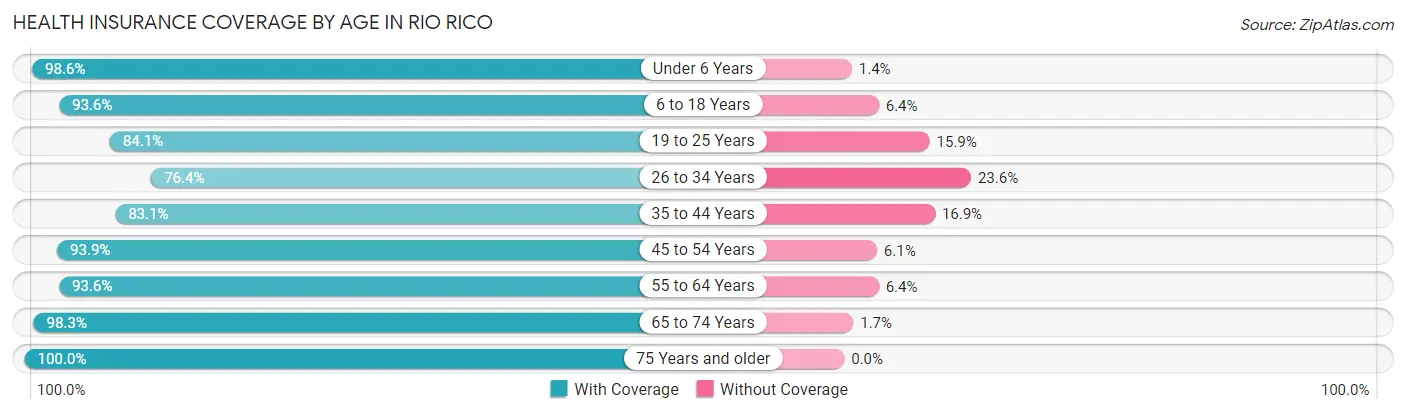
| Age Bracket | With Coverage | Without Coverage |
| Under 6 Years | 2,233 (98.6%) | 32 (1.4%) |
| 6 to 18 Years | 4,336 (93.6%) | 298 (6.4%) |
| 19 to 25 Years | 1,765 (84.1%) | 334 (15.9%) |
| 26 to 34 Years | 1,743 (76.4%) | 539 (23.6%) |
| 35 to 44 Years | 2,153 (83.1%) | 438 (16.9%) |
| 45 to 54 Years | 2,348 (93.9%) | 152 (6.1%) |
| 55 to 64 Years | 2,479 (93.6%) | 170 (6.4%) |
| 65 to 74 Years | 1,577 (98.3%) | 27 (1.7%) |
| 75 Years and older | 782 (100.0%) | 0 (0.0%) |
| Total | 19,416 (90.7%) | 1,990 (9.3%) |
Health Insurance Coverage by Citizenship Status in Rio Rico
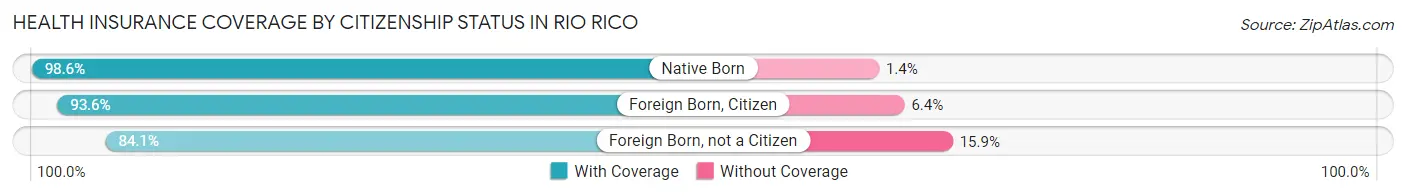
| Citizenship Status | With Coverage | Without Coverage |
| Native Born | 2,233 (98.6%) | 32 (1.4%) |
| Foreign Born, Citizen | 4,336 (93.6%) | 298 (6.4%) |
| Foreign Born, not a Citizen | 1,765 (84.1%) | 334 (15.9%) |
Health Insurance Coverage by Household Income in Rio Rico
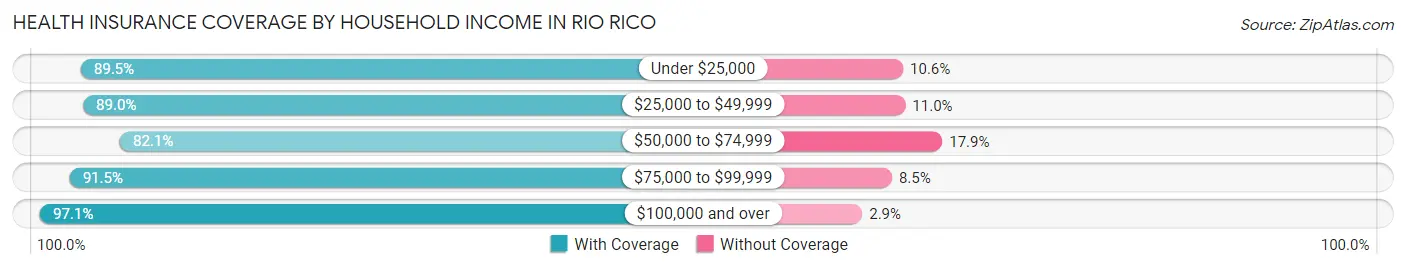
| Household Income | With Coverage | Without Coverage |
| Under $25,000 | 1,951 (89.4%) | 230 (10.5%) |
| $25,000 to $49,999 | 4,719 (89.0%) | 582 (11.0%) |
| $50,000 to $74,999 | 3,084 (82.1%) | 672 (17.9%) |
| $75,000 to $99,999 | 3,475 (91.5%) | 321 (8.5%) |
| $100,000 and over | 6,187 (97.1%) | 185 (2.9%) |
Public vs Private Health Insurance Coverage by Age in Rio Rico
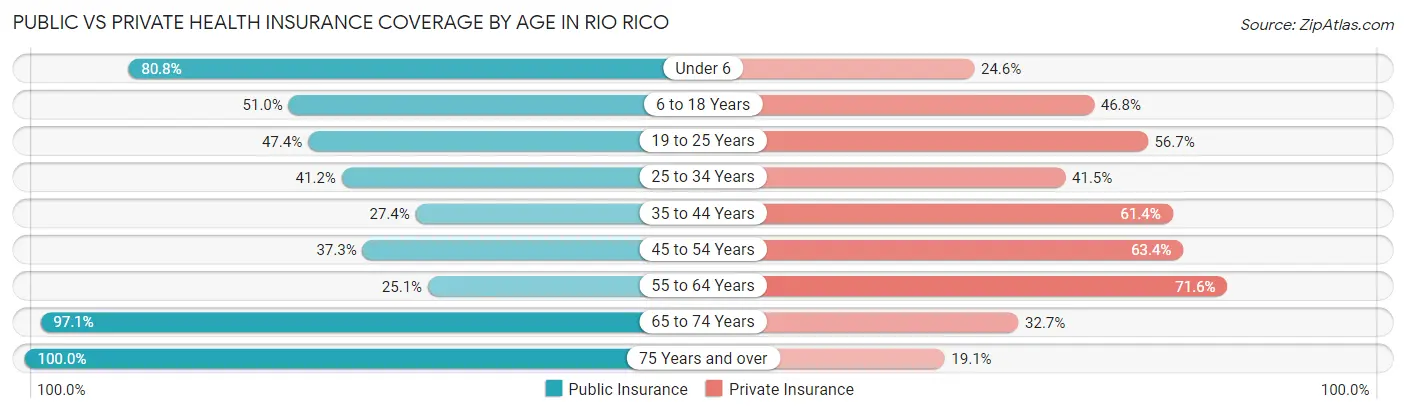
| Age Bracket | Public Insurance | Private Insurance |
| Under 6 | 1,829 (80.7%) | 556 (24.5%) |
| 6 to 18 Years | 2,363 (51.0%) | 2,168 (46.8%) |
| 19 to 25 Years | 995 (47.4%) | 1,191 (56.7%) |
| 25 to 34 Years | 939 (41.1%) | 946 (41.4%) |
| 35 to 44 Years | 711 (27.4%) | 1,591 (61.4%) |
| 45 to 54 Years | 932 (37.3%) | 1,584 (63.4%) |
| 55 to 64 Years | 666 (25.1%) | 1,896 (71.6%) |
| 65 to 74 Years | 1,557 (97.1%) | 525 (32.7%) |
| 75 Years and over | 782 (100.0%) | 149 (19.1%) |
| Total | 10,774 (50.3%) | 10,606 (49.5%) |
Disability Status by Sex by Age in Rio Rico
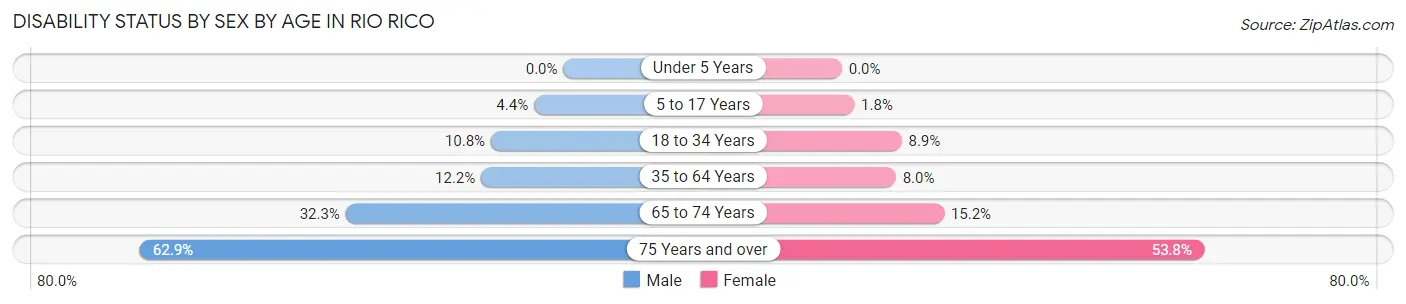
| Age Bracket | Male | Female |
| Under 5 Years | 0 (0.0%) | 0 (0.0%) |
| 5 to 17 Years | 108 (4.4%) | 43 (1.8%) |
| 18 to 34 Years | 218 (10.7%) | 235 (8.9%) |
| 35 to 64 Years | 465 (12.2%) | 315 (8.0%) |
| 65 to 74 Years | 267 (32.3%) | 118 (15.2%) |
| 75 Years and over | 232 (62.9%) | 222 (53.7%) |
Disability Class by Sex by Age in Rio Rico
Disability Class: Hearing Difficulty
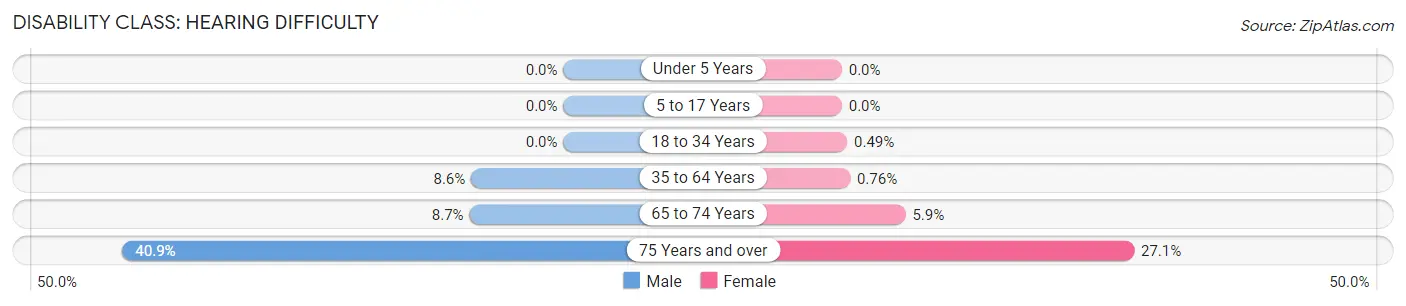
| Age Bracket | Male | Female |
| Under 5 Years | 0 (0.0%) | 0 (0.0%) |
| 5 to 17 Years | 0 (0.0%) | 0 (0.0%) |
| 18 to 34 Years | 0 (0.0%) | 13 (0.5%) |
| 35 to 64 Years | 326 (8.6%) | 30 (0.8%) |
| 65 to 74 Years | 72 (8.7%) | 46 (5.9%) |
| 75 Years and over | 151 (40.9%) | 112 (27.1%) |
Disability Class: Vision Difficulty
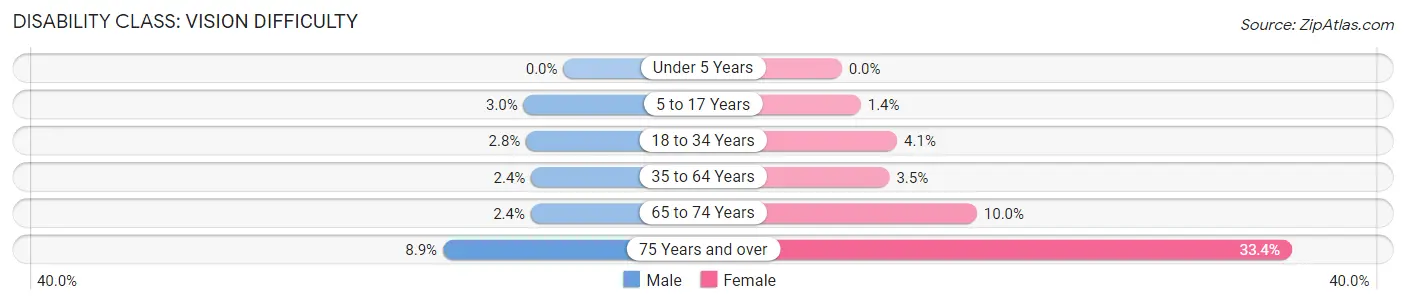
| Age Bracket | Male | Female |
| Under 5 Years | 0 (0.0%) | 0 (0.0%) |
| 5 to 17 Years | 73 (2.9%) | 33 (1.4%) |
| 18 to 34 Years | 56 (2.8%) | 109 (4.1%) |
| 35 to 64 Years | 91 (2.4%) | 139 (3.5%) |
| 65 to 74 Years | 20 (2.4%) | 78 (10.0%) |
| 75 Years and over | 33 (8.9%) | 138 (33.4%) |
Disability Class: Cognitive Difficulty
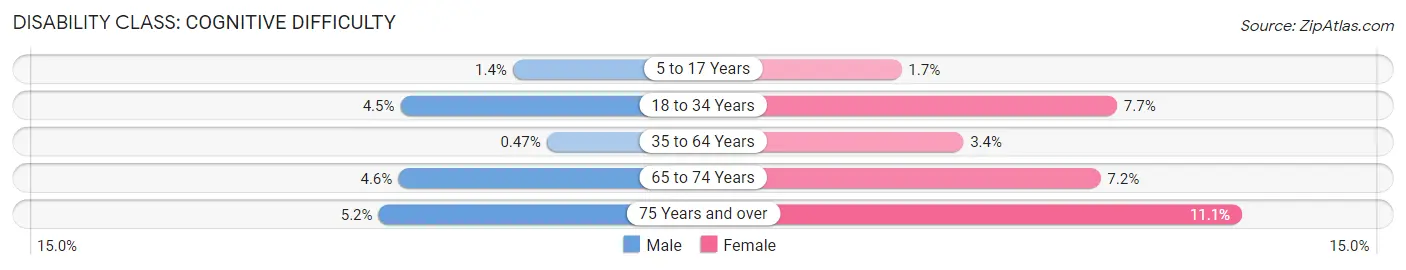
| Age Bracket | Male | Female |
| 5 to 17 Years | 35 (1.4%) | 39 (1.7%) |
| 18 to 34 Years | 92 (4.5%) | 203 (7.7%) |
| 35 to 64 Years | 18 (0.5%) | 133 (3.4%) |
| 65 to 74 Years | 38 (4.6%) | 56 (7.2%) |
| 75 Years and over | 19 (5.1%) | 46 (11.1%) |
Disability Class: Ambulatory Difficulty
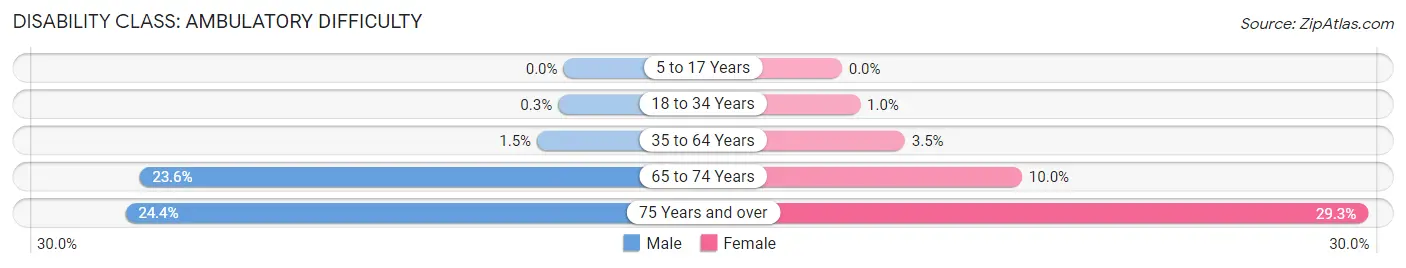
| Age Bracket | Male | Female |
| 5 to 17 Years | 0 (0.0%) | 0 (0.0%) |
| 18 to 34 Years | 6 (0.3%) | 27 (1.0%) |
| 35 to 64 Years | 56 (1.5%) | 138 (3.5%) |
| 65 to 74 Years | 195 (23.6%) | 78 (10.0%) |
| 75 Years and over | 90 (24.4%) | 121 (29.3%) |
Disability Class: Self-Care Difficulty
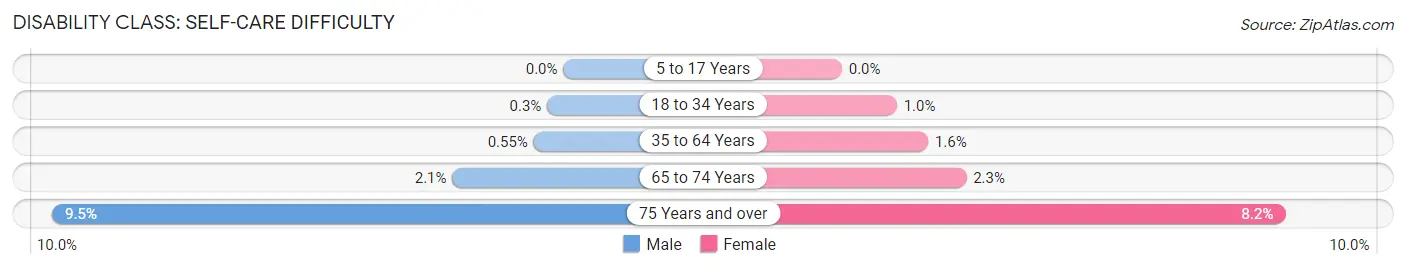
| Age Bracket | Male | Female |
| 5 to 17 Years | 0 (0.0%) | 0 (0.0%) |
| 18 to 34 Years | 6 (0.3%) | 27 (1.0%) |
| 35 to 64 Years | 21 (0.5%) | 63 (1.6%) |
| 65 to 74 Years | 17 (2.1%) | 18 (2.3%) |
| 75 Years and over | 35 (9.5%) | 34 (8.2%) |
Technology Access in Rio Rico
Computing Device Access in Rio Rico
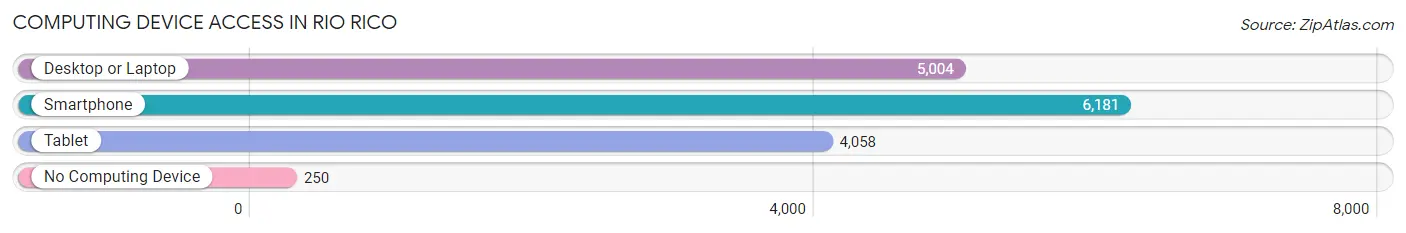
| Device Type | # Households | % Households |
| Desktop or Laptop | 5,004 | 73.5% |
| Smartphone | 6,181 | 90.8% |
| Tablet | 4,058 | 59.6% |
| No Computing Device | 250 | 3.7% |
| Total | 6,809 | 100.0% |
Internet Access in Rio Rico
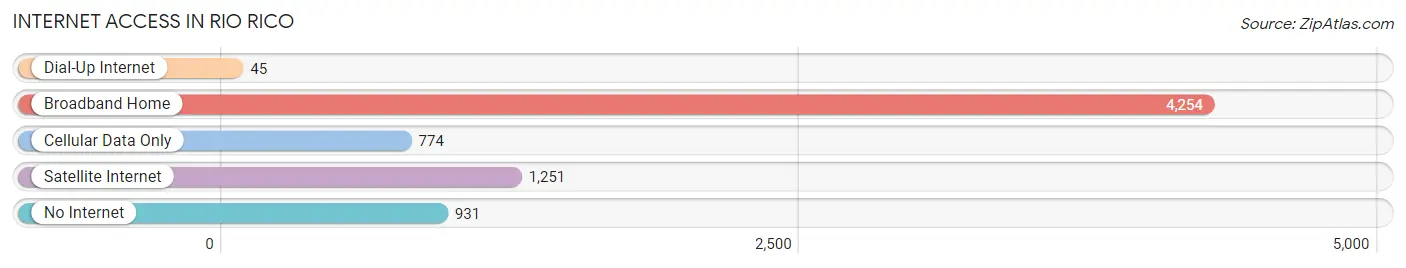
| Internet Type | # Households | % Households |
| Dial-Up Internet | 45 | 0.7% |
| Broadband Home | 4,254 | 62.5% |
| Cellular Data Only | 774 | 11.4% |
| Satellite Internet | 1,251 | 18.4% |
| No Internet | 931 | 13.7% |
| Total | 6,809 | 100.0% |
Rio Rico Summary
Rio Rico is a census-designated place (CDP) located in Santa Cruz County, Arizona. It is situated in the Santa Cruz Valley, approximately 15 miles north of Nogales and the Mexican border. The population of Rio Rico was 10,817 at the 2010 census.
History
Rio Rico was founded in the late 19th century by Mexican settlers who were attracted to the area by its fertile soil and abundant water supply. The name Rio Rico is Spanish for “rich river” and was chosen to reflect the abundance of the Santa Cruz River, which runs through the area.
In the early 20th century, the area was developed as an agricultural center, with citrus and cotton being the primary crops. The area was also home to a number of small mining operations.
In the 1950s, the area began to experience rapid growth as a result of the development of the nearby Tubac and Nogales communities. This growth was further accelerated in the 1960s and 1970s with the construction of Interstate 19, which connected Rio Rico to Tucson and Phoenix.
Geography
Rio Rico is located in the Santa Cruz Valley, approximately 15 miles north of Nogales and the Mexican border. The area is characterized by rolling hills and valleys, with the Santa Cruz River running through the center of the community.
The climate in Rio Rico is semi-arid, with hot summers and mild winters. The average annual temperature is 73°F, with an average annual precipitation of 13.5 inches.
Economy
Rio Rico’s economy is largely based on agriculture and tourism. The area is home to a number of citrus and cotton farms, as well as several wineries. Tourism is also an important part of the local economy, with visitors coming to the area to enjoy the nearby Tubac and Nogales communities, as well as the nearby Coronado National Forest.
Demographics
As of the 2010 census, the population of Rio Rico was 10,817. The racial makeup of the community was 79.3% White, 0.7% African American, 0.7% Native American, 0.3% Asian, 0.1% Pacific Islander, 16.2% from other races, and 2.9% from two or more races. Hispanic or Latino of any race were 79.3% of the population.
The median household income in Rio Rico was $30,938, and the median family income was $35,938. The per capita income was $14,938. About 18.2% of families and 22.2% of the population were below the poverty line, including 28.2% of those under age 18 and 11.2% of those age 65 or over.
Common Questions
What is Per Capita Income in Rio Rico?
Per Capita income in Rio Rico is $25,168.
What is the Median Family Income in Rio Rico?
Median Family Income in Rio Rico is $68,680.
What is the Median Household income in Rio Rico?
Median Household Income in Rio Rico is $62,537.
What is Income or Wage Gap in Rio Rico?
Income or Wage Gap in Rio Rico is 11.5%.
Women in Rio Rico earn 88.5 cents for every dollar earned by a man.
What is Inequality or Gini Index in Rio Rico?
Inequality or Gini Index in Rio Rico is 0.39.
What is the Total Population of Rio Rico?
Total Population of Rio Rico is 21,447.
What is the Total Male Population of Rio Rico?
Total Male Population of Rio Rico is 10,525.
What is the Total Female Population of Rio Rico?
Total Female Population of Rio Rico is 10,922.
What is the Ratio of Males per 100 Females in Rio Rico?
There are 96.37 Males per 100 Females in Rio Rico.
What is the Ratio of Females per 100 Males in Rio Rico?
There are 103.77 Females per 100 Males in Rio Rico.
What is the Median Population Age in Rio Rico?
Median Population Age in Rio Rico is 33.8 Years.
What is the Average Family Size in Rio Rico
Average Family Size in Rio Rico is 3.5 People.
What is the Average Household Size in Rio Rico
Average Household Size in Rio Rico is 3.1 People.
How Large is the Labor Force in Rio Rico?
There are 9,915 People in the Labor Forcein in Rio Rico.
What is the Percentage of People in the Labor Force in Rio Rico?
64.3% of People are in the Labor Force in Rio Rico.
What is the Unemployment Rate in Rio Rico?
Unemployment Rate in Rio Rico is 7.7%.