Picacho, AZ Map & Demographics
Picacho Map
Picacho Overview
$28,812
PER CAPITA INCOME
$52,813
AVG HOUSEHOLD INCOME
0.38
INEQUALITY / GINI INDEX
289
TOTAL POPULATION
135
MALE POPULATION
154
FEMALE POPULATION
87.66
MALES / 100 FEMALES
114.07
FEMALES / 100 MALES
61.2
MEDIAN AGE
2.4
AVG FAMILY SIZE
2.1
AVG HOUSEHOLD SIZE
123
LABOR FORCE [ PEOPLE ]
46.6%
PERCENT IN LABOR FORCE
17.1%
UNEMPLOYMENT RATE
Picacho Zip Codes
Picacho Area Codes
Income in Picacho
Income Overview in Picacho
| Characteristic | Number | Measure |
| Per Capita Income | 289 | $28,812 |
| Median Family Income | 95 | $0 |
| Mean Family Income | 95 | $67,398 |
| Median Household Income | 133 | $52,813 |
| Mean Household Income | 133 | $63,089 |
| Income Deficit | 95 | $0 |
| Wage / Income Gap (%) | 289 | 0.00% |
| Wage / Income Gap ($) | 289 | 100.00¢ per $1 |
| Gini / Inequality Index | 289 | 0.38 |
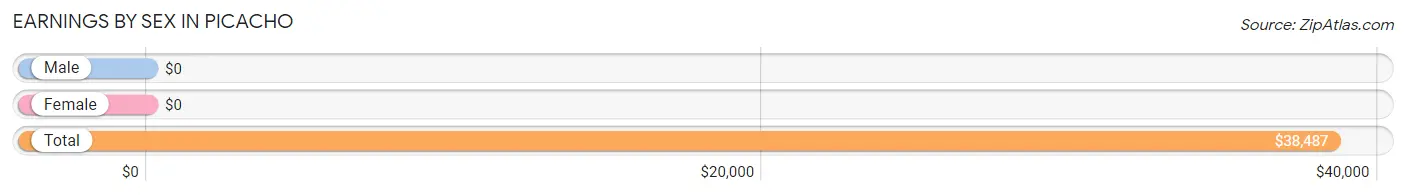
Earnings by Sex in Picacho
| Sex | Number | Average Earnings |
| Male | 73 (48.3%) | $0 |
| Female | 78 (51.7%) | $0 |
| Total | 151 (100.0%) | $38,487 |
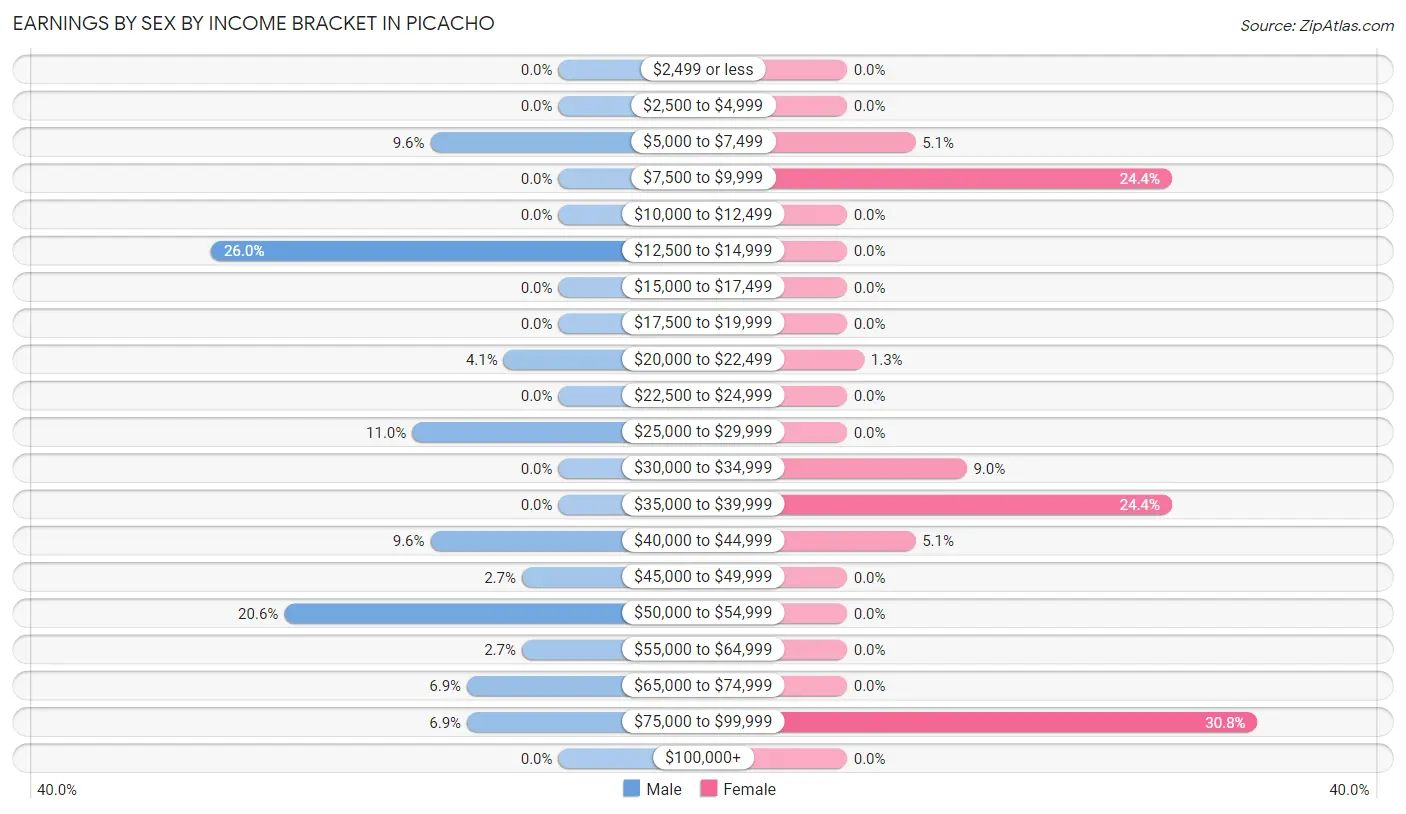
Earnings by Sex by Income Bracket in Picacho
The most common earnings brackets in Picacho are $12,500 to $14,999 for men (19 | 26.0%) and $75,000 to $99,999 for women (24 | 30.8%).
| Income | Male | Female |
| $2,499 or less | 0 (0.0%) | 0 (0.0%) |
| $2,500 to $4,999 | 0 (0.0%) | 0 (0.0%) |
| $5,000 to $7,499 | 7 (9.6%) | 4 (5.1%) |
| $7,500 to $9,999 | 0 (0.0%) | 19 (24.4%) |
| $10,000 to $12,499 | 0 (0.0%) | 0 (0.0%) |
| $12,500 to $14,999 | 19 (26.0%) | 0 (0.0%) |
| $15,000 to $17,499 | 0 (0.0%) | 0 (0.0%) |
| $17,500 to $19,999 | 0 (0.0%) | 0 (0.0%) |
| $20,000 to $22,499 | 3 (4.1%) | 1 (1.3%) |
| $22,500 to $24,999 | 0 (0.0%) | 0 (0.0%) |
| $25,000 to $29,999 | 8 (11.0%) | 0 (0.0%) |
| $30,000 to $34,999 | 0 (0.0%) | 7 (9.0%) |
| $35,000 to $39,999 | 0 (0.0%) | 19 (24.4%) |
| $40,000 to $44,999 | 7 (9.6%) | 4 (5.1%) |
| $45,000 to $49,999 | 2 (2.7%) | 0 (0.0%) |
| $50,000 to $54,999 | 15 (20.5%) | 0 (0.0%) |
| $55,000 to $64,999 | 2 (2.7%) | 0 (0.0%) |
| $65,000 to $74,999 | 5 (6.9%) | 0 (0.0%) |
| $75,000 to $99,999 | 5 (6.9%) | 24 (30.8%) |
| $100,000+ | 0 (0.0%) | 0 (0.0%) |
| Total | 73 (100.0%) | 78 (100.0%) |
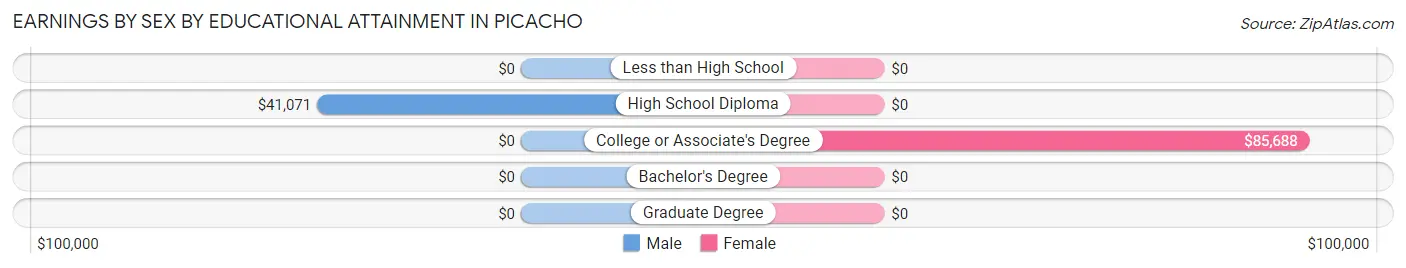
Earnings by Sex by Educational Attainment in Picacho
| Educational Attainment | Male Income | Female Income |
| Less than High School | - | - |
| High School Diploma | $41,071 | $0 |
| College or Associate's Degree | - | - |
| Bachelor's Degree | - | - |
| Graduate Degree | - | - |
| Total | $40,714 | $0 |
Family Income in Picacho
Family Income Brackets in Picacho
According to the Picacho family income data, there are 31 families falling into the $15,000 to $24,999 income range, which is the most common income bracket and makes up 32.6% of all families.
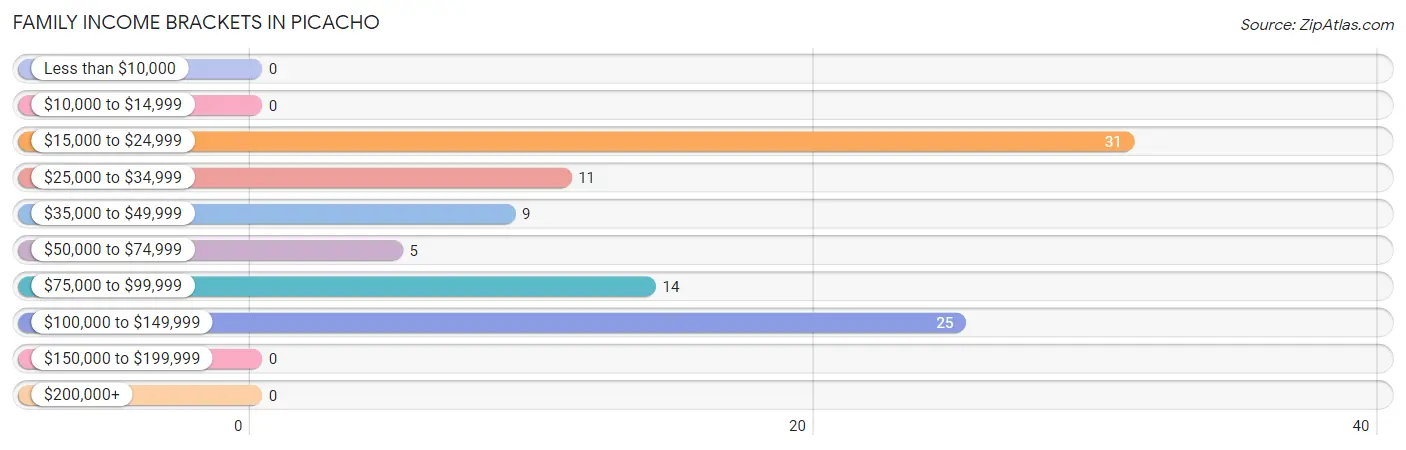
| Income Bracket | # Families | % Families |
| Less than $10,000 | 0 | 0.0% |
| $10,000 to $14,999 | 0 | 0.0% |
| $15,000 to $24,999 | 31 | 32.6% |
| $25,000 to $34,999 | 11 | 11.6% |
| $35,000 to $49,999 | 9 | 9.5% |
| $50,000 to $74,999 | 5 | 5.3% |
| $75,000 to $99,999 | 14 | 14.7% |
| $100,000 to $149,999 | 25 | 26.3% |
| $150,000 to $199,999 | 0 | 0.0% |
| $200,000+ | 0 | 0.0% |
Family Income by Famaliy Size in Picacho
3-person families (32 | 33.7%) account for the highest median family income in Picacho with $33,571 per family, while 3-person families (32 | 33.7%) have the highest median income of $11,190 per family member.
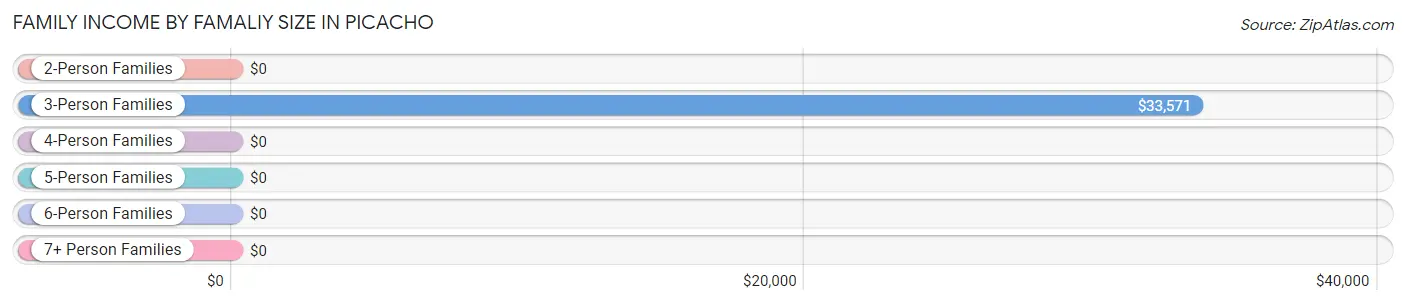
| Income Bracket | # Families | Median Income |
| 2-Person Families | 58 (61.1%) | $0 |
| 3-Person Families | 32 (33.7%) | $33,571 |
| 4-Person Families | 0 (0.0%) | $0 |
| 5-Person Families | 5 (5.3%) | $0 |
| 6-Person Families | 0 (0.0%) | $0 |
| 7+ Person Families | 0 (0.0%) | $0 |
| Total | 95 (100.0%) | $0 |
Family Income by Number of Earners in Picacho
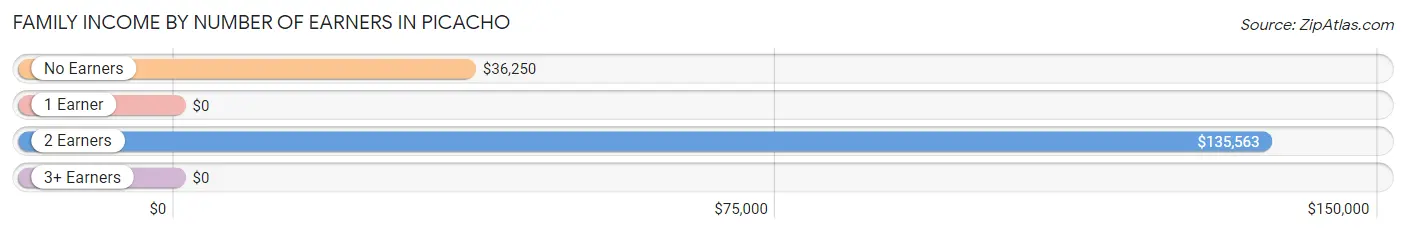
| Number of Earners | # Families | Median Income |
| No Earners | 8 (8.4%) | $36,250 |
| 1 Earner | 56 (59.0%) | $0 |
| 2 Earners | 31 (32.6%) | $135,563 |
| 3+ Earners | 0 (0.0%) | $0 |
| Total | 95 (100.0%) | $0 |
Household Income in Picacho
Household Income Brackets in Picacho
With 32 households falling in the category, the $15,000 to $24,999 income range is the most frequent in Picacho, accounting for 24.1% of all households.
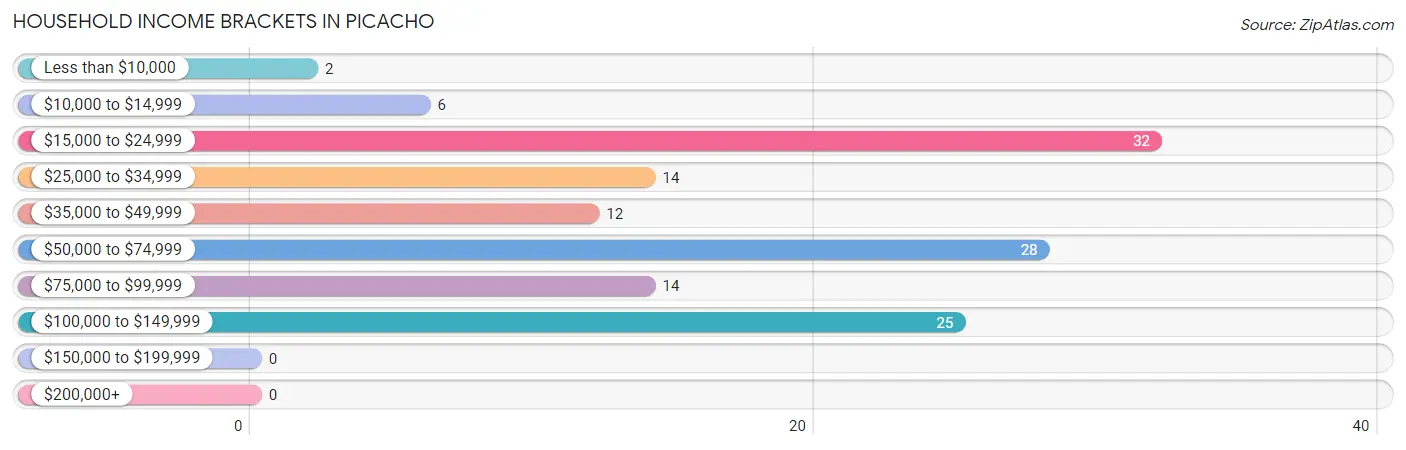
| Income Bracket | # Households | % Households |
| Less than $10,000 | 2 | 1.5% |
| $10,000 to $14,999 | 6 | 4.5% |
| $15,000 to $24,999 | 32 | 24.1% |
| $25,000 to $34,999 | 14 | 10.5% |
| $35,000 to $49,999 | 12 | 9.0% |
| $50,000 to $74,999 | 28 | 21.1% |
| $75,000 to $99,999 | 14 | 10.5% |
| $100,000 to $149,999 | 25 | 18.8% |
| $150,000 to $199,999 | 0 | 0.0% |
| $200,000+ | 0 | 0.0% |
Household Income by Householder Age in Picacho
The median household income in Picacho is $52,813, with the highest median household income of $72,763 found in the 65+ years age bracket for the primary householder. A total of 54 households (40.6%) fall into this category.
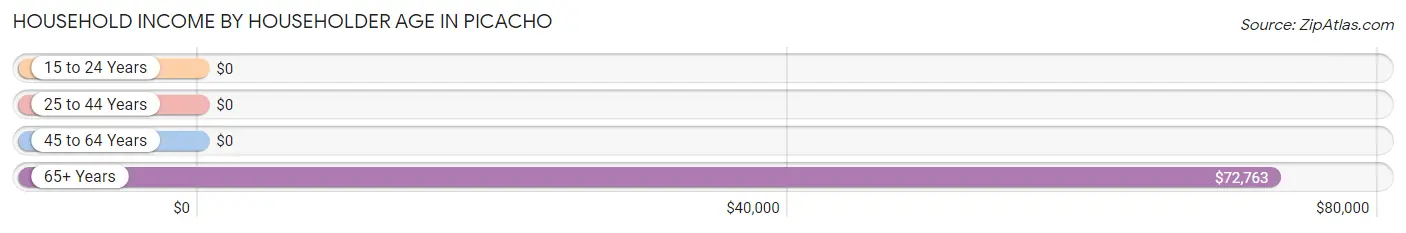
| Income Bracket | # Households | Median Income |
| 15 to 24 Years | 0 (0.0%) | $0 |
| 25 to 44 Years | 9 (6.8%) | $0 |
| 45 to 64 Years | 70 (52.6%) | $0 |
| 65+ Years | 54 (40.6%) | $72,763 |
| Total | 133 (100.0%) | $52,813 |
Poverty in Picacho
Income Below Poverty by Sex and Age in Picacho
With 28.1% poverty level for males and 19.5% for females among the residents of Picacho, under 5 year old males and 25 to 34 year old females are the most vulnerable to poverty, with 4 males (100.0%) and 13 females (92.9%) in their respective age groups living below the poverty level.
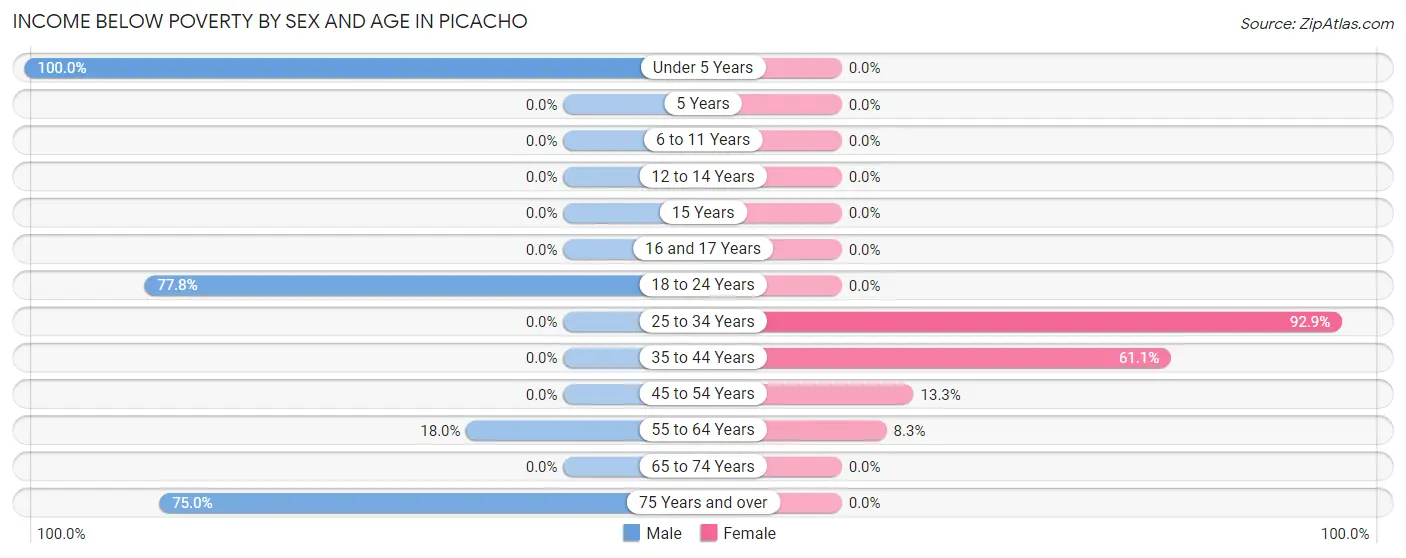
| Age Bracket | Male | Female |
| Under 5 Years | 4 (100.0%) | 0 (0.0%) |
| 5 Years | 0 (0.0%) | 0 (0.0%) |
| 6 to 11 Years | 0 (0.0%) | 0 (0.0%) |
| 12 to 14 Years | 0 (0.0%) | 0 (0.0%) |
| 15 Years | 0 (0.0%) | 0 (0.0%) |
| 16 and 17 Years | 0 (0.0%) | 0 (0.0%) |
| 18 to 24 Years | 7 (77.8%) | 0 (0.0%) |
| 25 to 34 Years | 0 (0.0%) | 13 (92.9%) |
| 35 to 44 Years | 0 (0.0%) | 11 (61.1%) |
| 45 to 54 Years | 0 (0.0%) | 4 (13.3%) |
| 55 to 64 Years | 9 (18.0%) | 2 (8.3%) |
| 65 to 74 Years | 0 (0.0%) | 0 (0.0%) |
| 75 Years and over | 18 (75.0%) | 0 (0.0%) |
| Total | 38 (28.1%) | 30 (19.5%) |
Income Above Poverty by Sex and Age in Picacho
According to the poverty statistics in Picacho, males aged 6 to 11 years and females aged 6 to 11 years are the age groups that are most secure financially, with 100.0% of males and 100.0% of females in these age groups living above the poverty line.
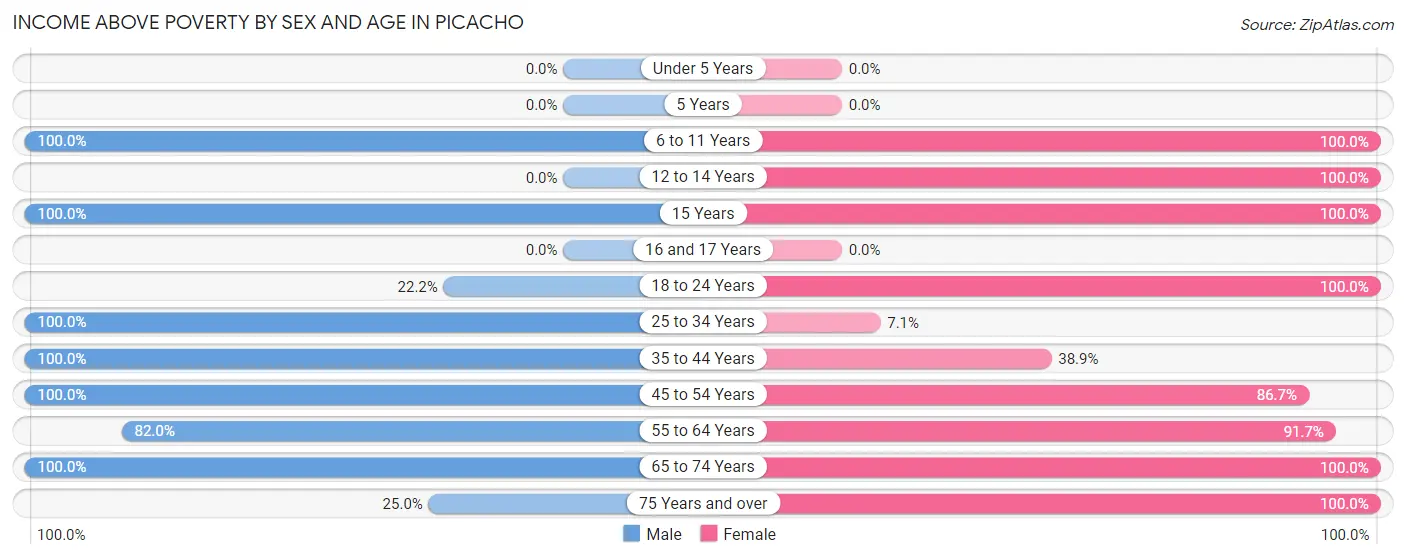
| Age Bracket | Male | Female |
| Under 5 Years | 0 (0.0%) | 0 (0.0%) |
| 5 Years | 0 (0.0%) | 0 (0.0%) |
| 6 to 11 Years | 6 (100.0%) | 3 (100.0%) |
| 12 to 14 Years | 0 (0.0%) | 5 (100.0%) |
| 15 Years | 4 (100.0%) | 3 (100.0%) |
| 16 and 17 Years | 0 (0.0%) | 0 (0.0%) |
| 18 to 24 Years | 2 (22.2%) | 10 (100.0%) |
| 25 to 34 Years | 3 (100.0%) | 1 (7.1%) |
| 35 to 44 Years | 5 (100.0%) | 7 (38.9%) |
| 45 to 54 Years | 10 (100.0%) | 26 (86.7%) |
| 55 to 64 Years | 41 (82.0%) | 22 (91.7%) |
| 65 to 74 Years | 20 (100.0%) | 40 (100.0%) |
| 75 Years and over | 6 (25.0%) | 7 (100.0%) |
| Total | 97 (71.9%) | 124 (80.5%) |
Income Below Poverty Among Married-Couple Families in Picacho
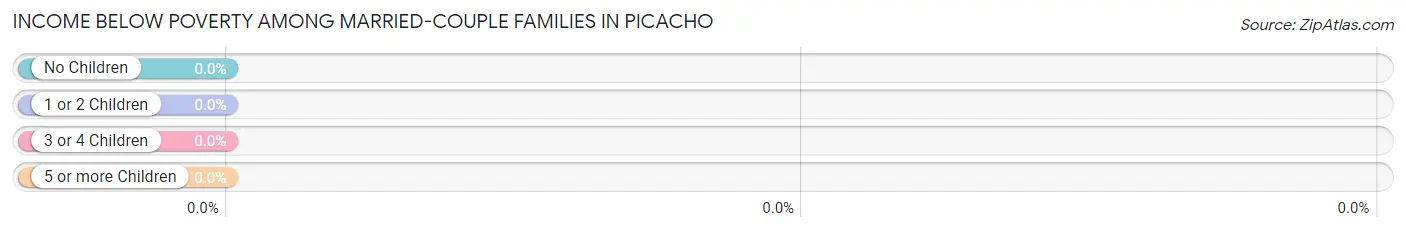
| Children | Above Poverty | Below Poverty |
| No Children | 63 (100.0%) | 0 (0.0%) |
| 1 or 2 Children | 0 (0.0%) | 0 (0.0%) |
| 3 or 4 Children | 0 (0.0%) | 0 (0.0%) |
| 5 or more Children | 0 (0.0%) | 0 (0.0%) |
| Total | 63 (100.0%) | 0 (0.0%) |
Income Below Poverty Among Single-Parent Households in Picacho
According to the poverty data in Picacho, 52.9% or 9 single-father households and 26.7% or 4 single-mother households are living below the poverty line. Among single-father households, those with no children have the highest poverty rate, with 9 households (100.0%) experiencing poverty. Likewise, among single-mother households, those with 1 or 2 children have the highest poverty rate, with 4 households (26.7%) falling below the poverty line.
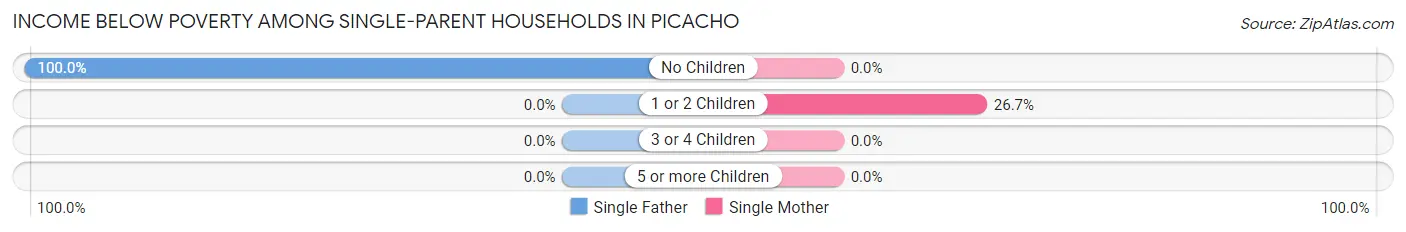
| Children | Single Father | Single Mother |
| No Children | 9 (100.0%) | 0 (0.0%) |
| 1 or 2 Children | 0 (0.0%) | 4 (26.7%) |
| 3 or 4 Children | 0 (0.0%) | 0 (0.0%) |
| 5 or more Children | 0 (0.0%) | 0 (0.0%) |
| Total | 9 (52.9%) | 4 (26.7%) |
Income Below Poverty Among Married-Couple vs Single-Parent Households in Picacho
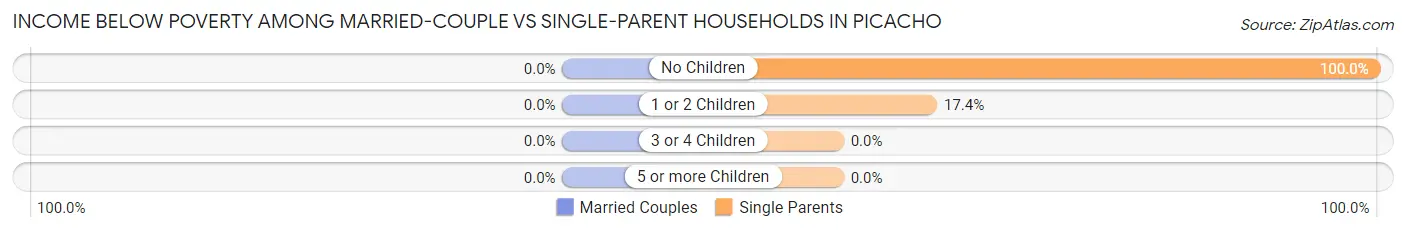
| Children | Married-Couple Families | Single-Parent Households |
| No Children | 0 (0.0%) | 9 (100.0%) |
| 1 or 2 Children | 0 (0.0%) | 4 (17.4%) |
| 3 or 4 Children | 0 (0.0%) | 0 (0.0%) |
| 5 or more Children | 0 (0.0%) | 0 (0.0%) |
| Total | 0 (0.0%) | 13 (40.6%) |
Race in Picacho
The most populous races in Picacho are White / Caucasian (191 | 66.1%), Hispanic or Latino (177 | 61.3%), and Two or more Races (67 | 23.2%).
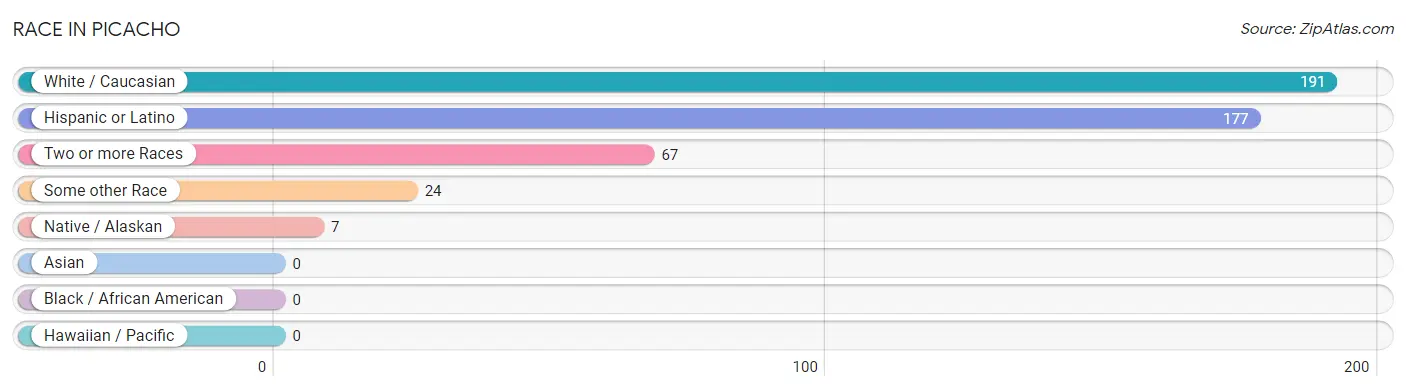
| Race | # Population | % Population |
| Asian | 0 | 0.0% |
| Black / African American | 0 | 0.0% |
| Hawaiian / Pacific | 0 | 0.0% |
| Hispanic or Latino | 177 | 61.3% |
| Native / Alaskan | 7 | 2.4% |
| White / Caucasian | 191 | 66.1% |
| Two or more Races | 67 | 23.2% |
| Some other Race | 24 | 8.3% |
| Total | 289 | 100.0% |
Ancestry in Picacho
The most populous ancestries reported in Picacho are Mexican (177 | 61.3%), German (15 | 5.2%), Irish (14 | 4.8%), English (10 | 3.5%), and Scottish (6 | 2.1%), together accounting for 76.8% of all Picacho residents.
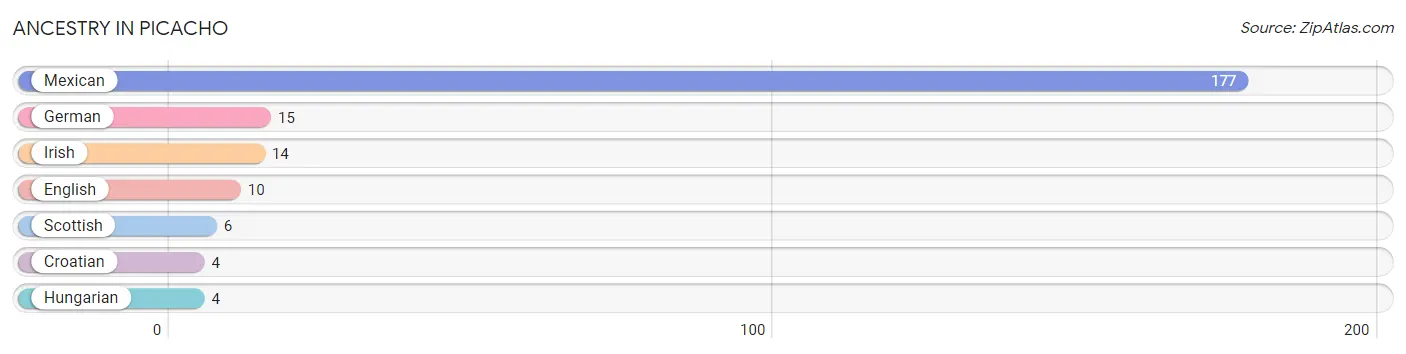
| Ancestry | # Population | % Population |
| Croatian | 4 | 1.4% |
| English | 10 | 3.5% |
| German | 15 | 5.2% |
| Hungarian | 4 | 1.4% |
| Irish | 14 | 4.8% |
| Mexican | 177 | 61.3% |
| Scottish | 6 | 2.1% | View All 7 Rows |
Immigrants in Picacho
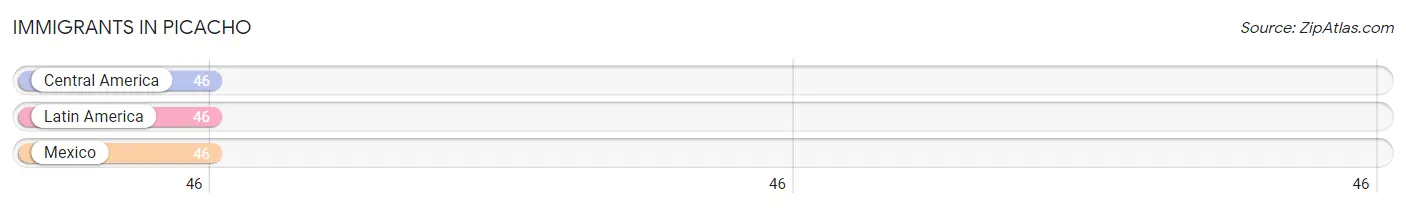
The most numerous immigrant groups reported in Picacho came from Central America (46 | 15.9%), Latin America (46 | 15.9%), and Mexico (46 | 15.9%), together accounting for 47.8% of all Picacho residents.
| Immigration Origin | # Population | % Population |
| Central America | 46 | 15.9% |
| Latin America | 46 | 15.9% |
| Mexico | 46 | 15.9% | View All 3 Rows |
Sex and Age in Picacho
Sex and Age in Picacho
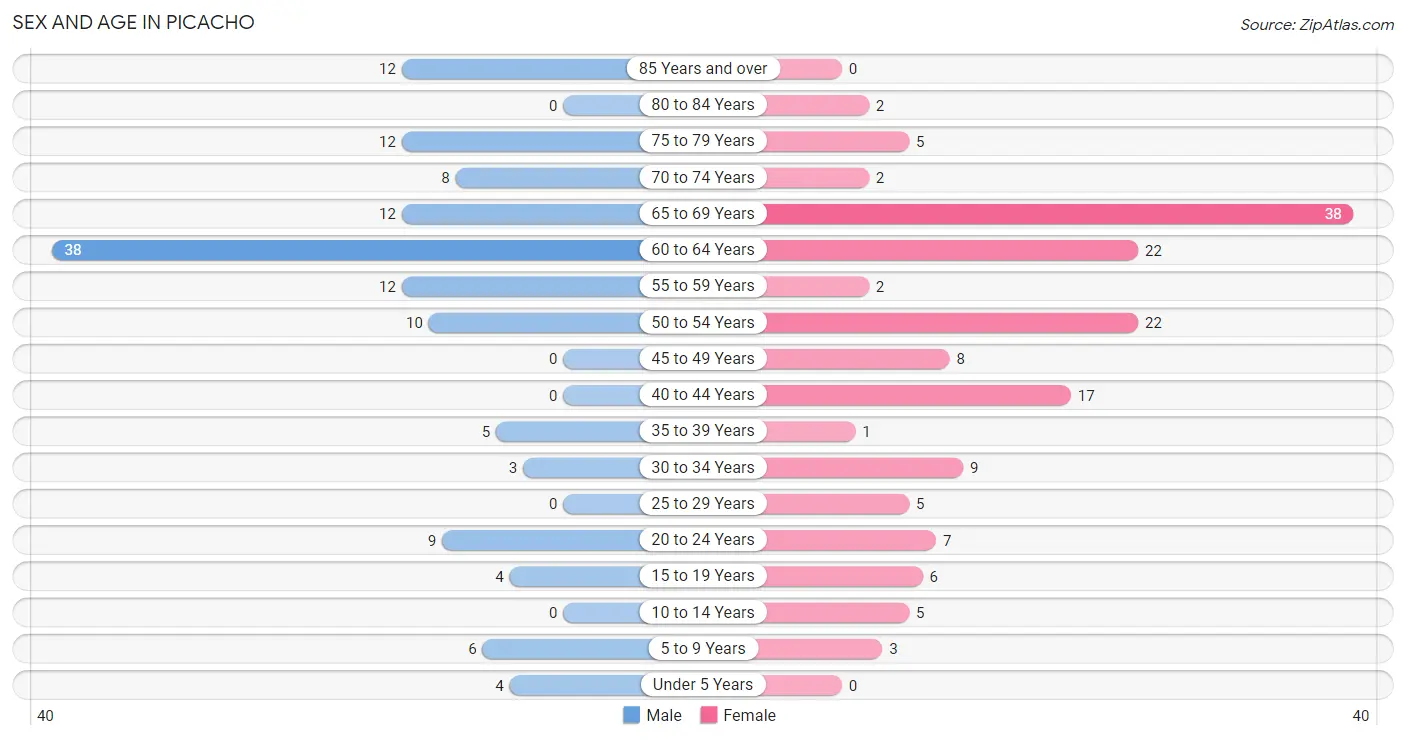
The most populous age groups in Picacho are 60 to 64 Years (38 | 28.1%) for men and 65 to 69 Years (38 | 24.7%) for women.
| Age Bracket | Male | Female |
| Under 5 Years | 4 (3.0%) | 0 (0.0%) |
| 5 to 9 Years | 6 (4.4%) | 3 (1.9%) |
| 10 to 14 Years | 0 (0.0%) | 5 (3.3%) |
| 15 to 19 Years | 4 (3.0%) | 6 (3.9%) |
| 20 to 24 Years | 9 (6.7%) | 7 (4.5%) |
| 25 to 29 Years | 0 (0.0%) | 5 (3.3%) |
| 30 to 34 Years | 3 (2.2%) | 9 (5.8%) |
| 35 to 39 Years | 5 (3.7%) | 1 (0.6%) |
| 40 to 44 Years | 0 (0.0%) | 17 (11.0%) |
| 45 to 49 Years | 0 (0.0%) | 8 (5.2%) |
| 50 to 54 Years | 10 (7.4%) | 22 (14.3%) |
| 55 to 59 Years | 12 (8.9%) | 2 (1.3%) |
| 60 to 64 Years | 38 (28.1%) | 22 (14.3%) |
| 65 to 69 Years | 12 (8.9%) | 38 (24.7%) |
| 70 to 74 Years | 8 (5.9%) | 2 (1.3%) |
| 75 to 79 Years | 12 (8.9%) | 5 (3.3%) |
| 80 to 84 Years | 0 (0.0%) | 2 (1.3%) |
| 85 Years and over | 12 (8.9%) | 0 (0.0%) |
| Total | 135 (100.0%) | 154 (100.0%) |
Families and Households in Picacho
Median Family Size in Picacho
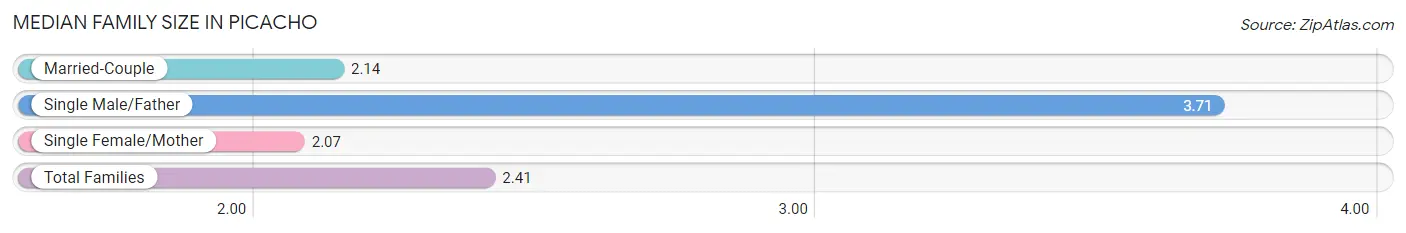
The median family size in Picacho is 2.41 persons per family, with single male/father families (17 | 17.9%) accounting for the largest median family size of 3.71 persons per family. On the other hand, single female/mother families (15 | 15.8%) represent the smallest median family size with 2.07 persons per family.
| Family Type | # Families | Family Size |
| Married-Couple | 63 (66.3%) | 2.14 |
| Single Male/Father | 17 (17.9%) | 3.71 |
| Single Female/Mother | 15 (15.8%) | 2.07 |
| Total Families | 95 (100.0%) | 2.41 |
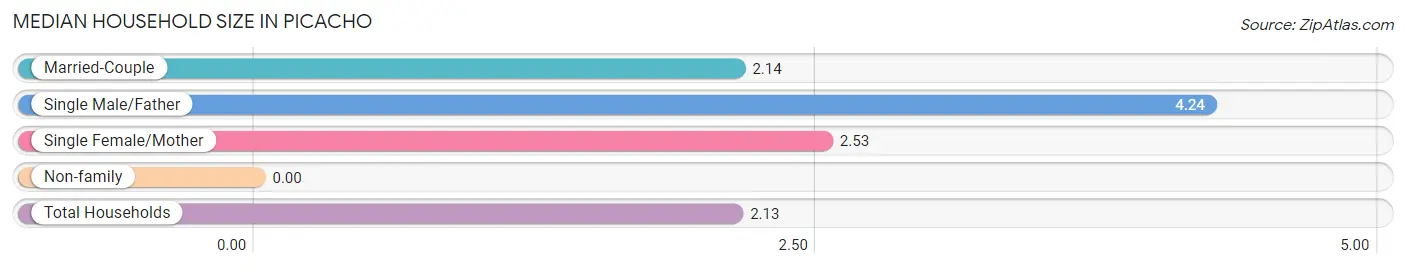
Median Household Size in Picacho
| Household Type | # Households | Household Size |
| Married-Couple | 63 (47.4%) | 2.14 |
| Single Male/Father | 17 (12.8%) | 4.24 |
| Single Female/Mother | 15 (11.3%) | 2.53 |
| Non-family | 38 (28.6%) | - |
| Total Households | 133 (100.0%) | 2.13 |
Household Size by Marriage Status in Picacho
Out of a total of 133 households in Picacho, 95 (71.4%) are family households, while 38 (28.6%) are nonfamily households. The most numerous type of family households are 2-person households, comprising 58, and the most common type of nonfamily households are 1-person households, comprising 38.
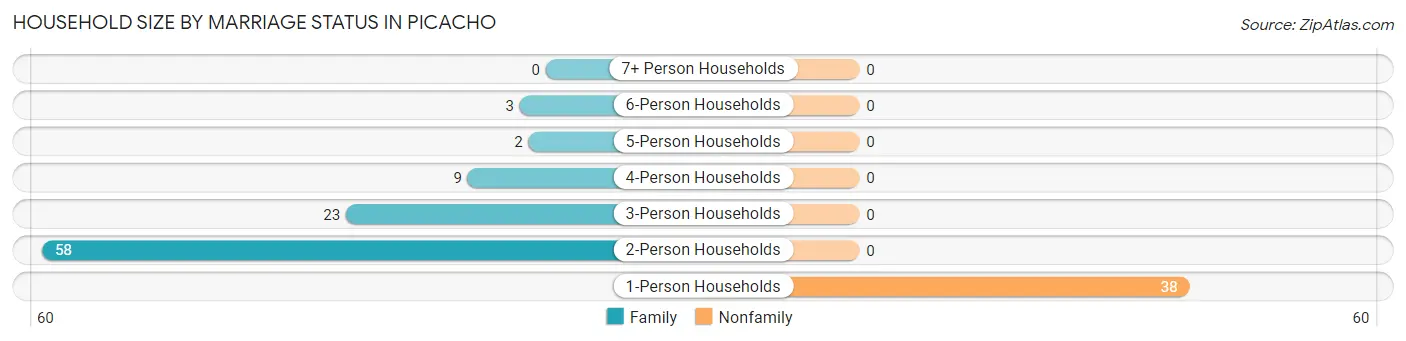
| Household Size | Family Households | Nonfamily Households |
| 1-Person Households | - | 38 (28.6%) |
| 2-Person Households | 58 (43.6%) | 0 (0.0%) |
| 3-Person Households | 23 (17.3%) | 0 (0.0%) |
| 4-Person Households | 9 (6.8%) | 0 (0.0%) |
| 5-Person Households | 2 (1.5%) | 0 (0.0%) |
| 6-Person Households | 3 (2.3%) | 0 (0.0%) |
| 7+ Person Households | 0 (0.0%) | 0 (0.0%) |
| Total | 95 (71.4%) | 38 (28.6%) |
Female Fertility in Picacho
Fertility by Age in Picacho
| Age Bracket | Women with Births | Births / 1,000 Women |
| 15 to 19 years | 0 (0.0%) | 0.0 |
| 20 to 34 years | 0 (0.0%) | 0.0 |
| 35 to 50 years | 0 (0.0%) | 0.0 |
| Total | 0 (0.0%) | 0.0 |
Fertility by Age by Marriage Status in Picacho
| Age Bracket | Married | Unmarried |
| 15 to 19 years | 0 (0.0%) | 0 (0.0%) |
| 20 to 34 years | 0 (0.0%) | 0 (0.0%) |
| 35 to 50 years | 0 (0.0%) | 0 (0.0%) |
| Total | 0 (0.0%) | 0 (0.0%) |
Fertility by Education in Picacho
| Educational Attainment | Women with Births | Births / 1,000 Women |
| Less than High School | 0 (0.0%) | 0.0 |
| High School Diploma | 0 (0.0%) | 0.0 |
| College or Associate's Degree | 0 (0.0%) | 0.0 |
| Bachelor's Degree | 0 (0.0%) | 0.0 |
| Graduate Degree | 0 (0.0%) | 0.0 |
| Total | 0 (0.0%) | 0.0 |
Fertility by Education by Marriage Status in Picacho
| Educational Attainment | Married | Unmarried |
| Less than High School | 0 (0.0%) | 0 (0.0%) |
| High School Diploma | 0 (0.0%) | 0 (0.0%) |
| College or Associate's Degree | 0 (0.0%) | 0 (0.0%) |
| Bachelor's Degree | 0 (0.0%) | 0 (0.0%) |
| Graduate Degree | 0 (0.0%) | 0 (0.0%) |
| Total | 0 (0.0%) | 0 (0.0%) |
Employment Characteristics in Picacho
Employment by Class of Employer in Picacho
Among the 102 employed individuals in Picacho, private company employees (47 | 46.1%), self-employed (incorporated) (20 | 19.6%), and not-for-profit organizations (16 | 15.7%) make up the most common classes of employment.
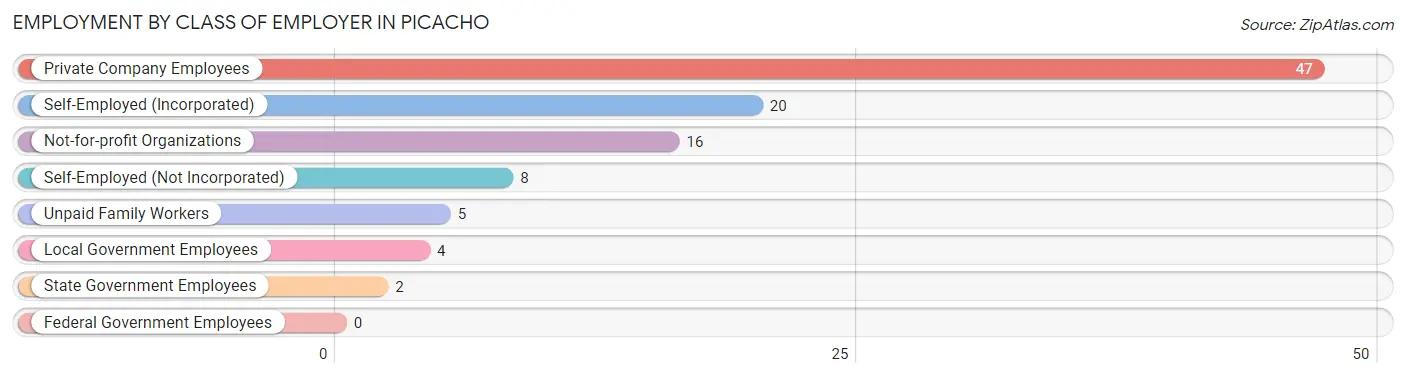
| Employer Class | # Employees | % Employees |
| Private Company Employees | 47 | 46.1% |
| Self-Employed (Incorporated) | 20 | 19.6% |
| Self-Employed (Not Incorporated) | 8 | 7.8% |
| Not-for-profit Organizations | 16 | 15.7% |
| Local Government Employees | 4 | 3.9% |
| State Government Employees | 2 | 2.0% |
| Federal Government Employees | 0 | 0.0% |
| Unpaid Family Workers | 5 | 4.9% |
| Total | 102 | 100.0% |
Employment Status by Age in Picacho
According to the labor force statistics for Picacho, out of the total population over 16 years of age (264), 46.6% or 123 individuals are in the labor force, with 17.1% or 21 of them unemployed. The age group with the highest labor force participation rate is 45 to 54 years, with 95.0% or 38 individuals in the labor force. Within the labor force, the 65 to 74 years age range has the highest percentage of unemployed individuals, with 67.9% or 19 of them being unemployed.
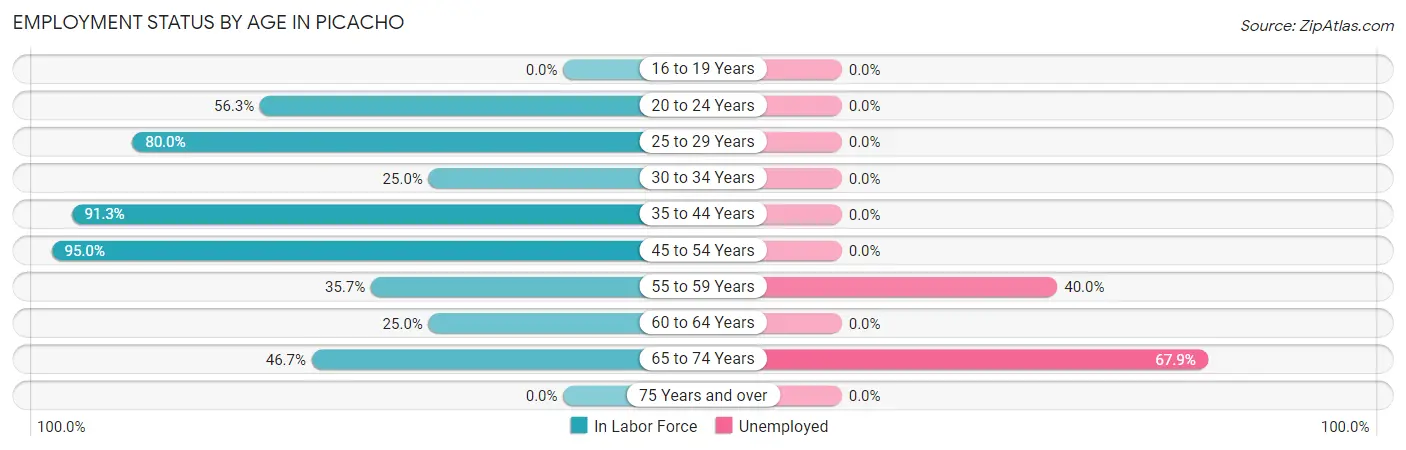
| Age Bracket | In Labor Force | Unemployed |
| 16 to 19 Years | 0 (0.0%) | 0 (0.0%) |
| 20 to 24 Years | 9 (56.3%) | 0 (0.0%) |
| 25 to 29 Years | 4 (80.0%) | 0 (0.0%) |
| 30 to 34 Years | 3 (25.0%) | 0 (0.0%) |
| 35 to 44 Years | 21 (91.3%) | 0 (0.0%) |
| 45 to 54 Years | 38 (95.0%) | 0 (0.0%) |
| 55 to 59 Years | 5 (35.7%) | 2 (40.0%) |
| 60 to 64 Years | 15 (25.0%) | 0 (0.0%) |
| 65 to 74 Years | 28 (46.7%) | 19 (67.9%) |
| 75 Years and over | 0 (0.0%) | 0 (0.0%) |
| Total | 123 (46.6%) | 21 (17.1%) |
Employment Status by Educational Attainment in Picacho
According to labor force statistics for Picacho, 55.8% of individuals (86) out of the total population between 25 and 64 years of age (154) are in the labor force, with 2.3% or 2 of them being unemployed. The group with the highest labor force participation rate are those with the educational attainment of college / associate degree, with 100.0% or 32 individuals in the labor force. Within the labor force, individuals with high school diploma education have the highest percentage of unemployment, with 5.1% or 2 of them being unemployed.
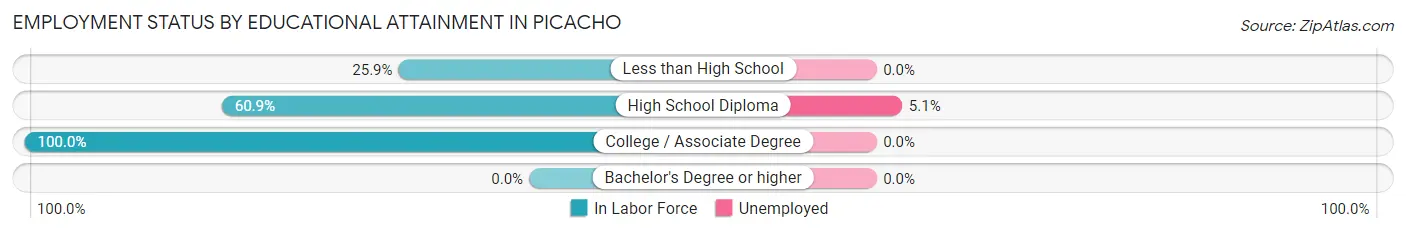
| Educational Attainment | In Labor Force | Unemployed |
| Less than High School | 15 (25.9%) | 0 (0.0%) |
| High School Diploma | 39 (60.9%) | 3 (5.1%) |
| College / Associate Degree | 32 (100.0%) | 0 (0.0%) |
| Bachelor's Degree or higher | 0 (0.0%) | 0 (0.0%) |
| Total | 86 (55.8%) | 4 (2.3%) |
Employment Occupations by Sex in Picacho
Management, Business, Science and Arts Occupations
The most common Management, Business, Science and Arts occupations in Picacho are Business & Financial (15 | 14.7%), Management (6 | 5.9%), Community & Social Service (2 | 2.0%), and Education Instruction & Library (2 | 2.0%).
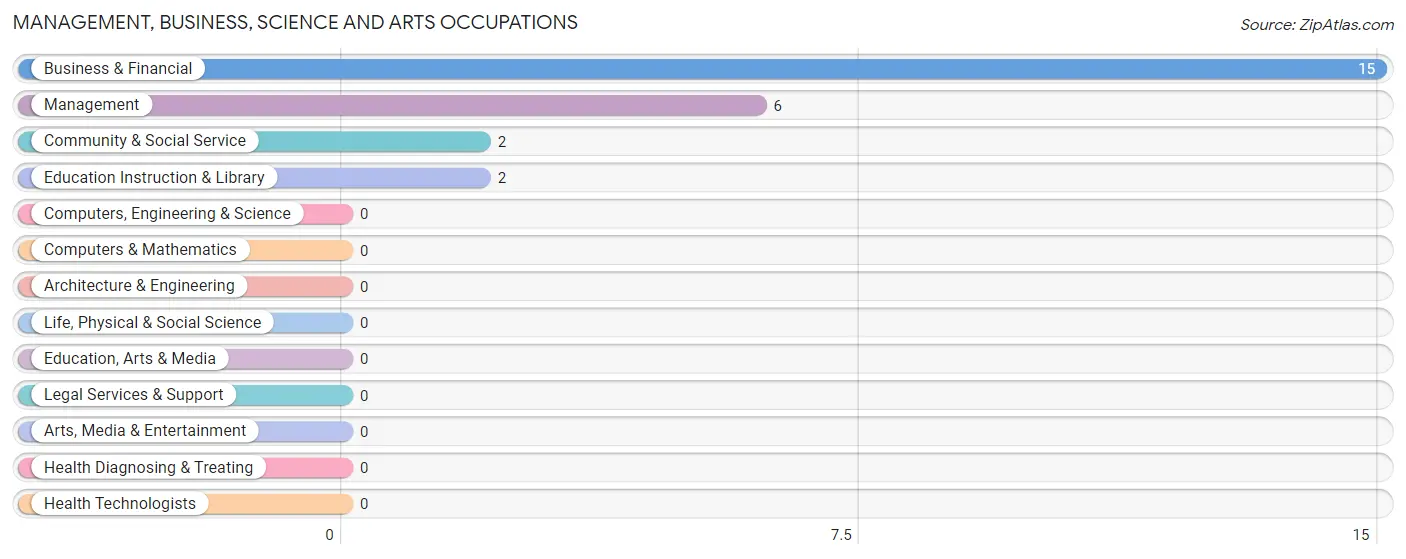
Management, Business, Science and Arts Occupations by Sex
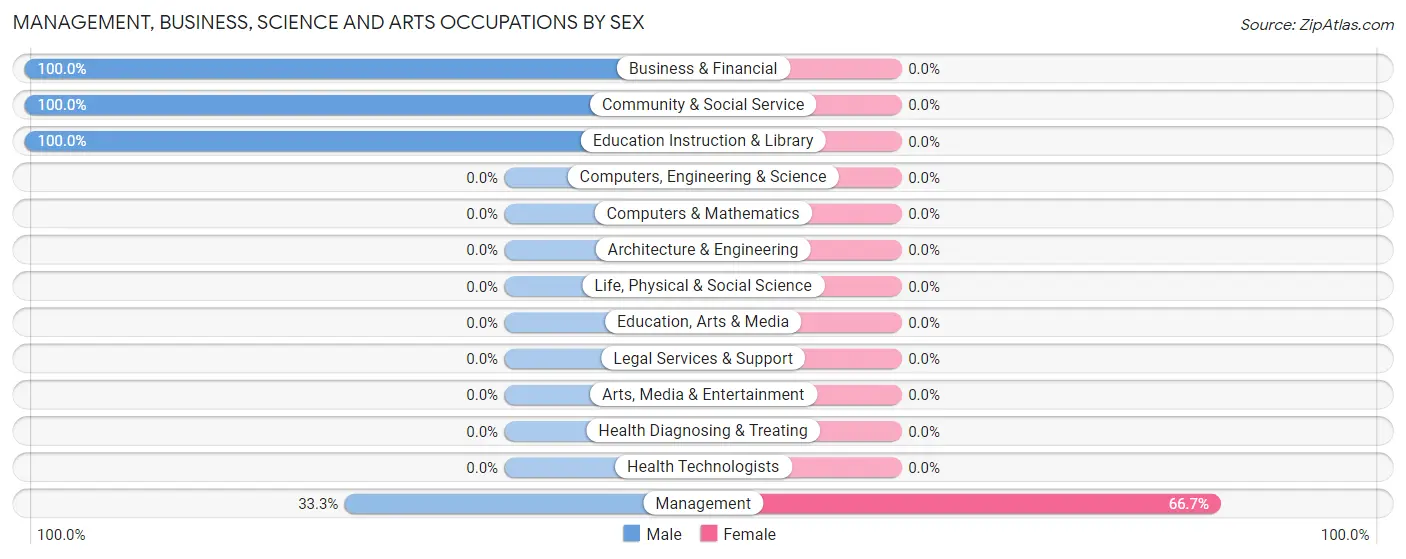
| Occupation | Male | Female |
| Management | 2 (33.3%) | 4 (66.7%) |
| Business & Financial | 15 (100.0%) | 0 (0.0%) |
| Computers, Engineering & Science | 0 (0.0%) | 0 (0.0%) |
| Computers & Mathematics | 0 (0.0%) | 0 (0.0%) |
| Architecture & Engineering | 0 (0.0%) | 0 (0.0%) |
| Life, Physical & Social Science | 0 (0.0%) | 0 (0.0%) |
| Community & Social Service | 2 (100.0%) | 0 (0.0%) |
| Education, Arts & Media | 0 (0.0%) | 0 (0.0%) |
| Legal Services & Support | 0 (0.0%) | 0 (0.0%) |
| Education Instruction & Library | 2 (100.0%) | 0 (0.0%) |
| Arts, Media & Entertainment | 0 (0.0%) | 0 (0.0%) |
| Health Diagnosing & Treating | 0 (0.0%) | 0 (0.0%) |
| Health Technologists | 0 (0.0%) | 0 (0.0%) |
| Total (Category) | 19 (82.6%) | 4 (17.4%) |
| Total (Overall) | 54 (52.9%) | 48 (47.1%) |
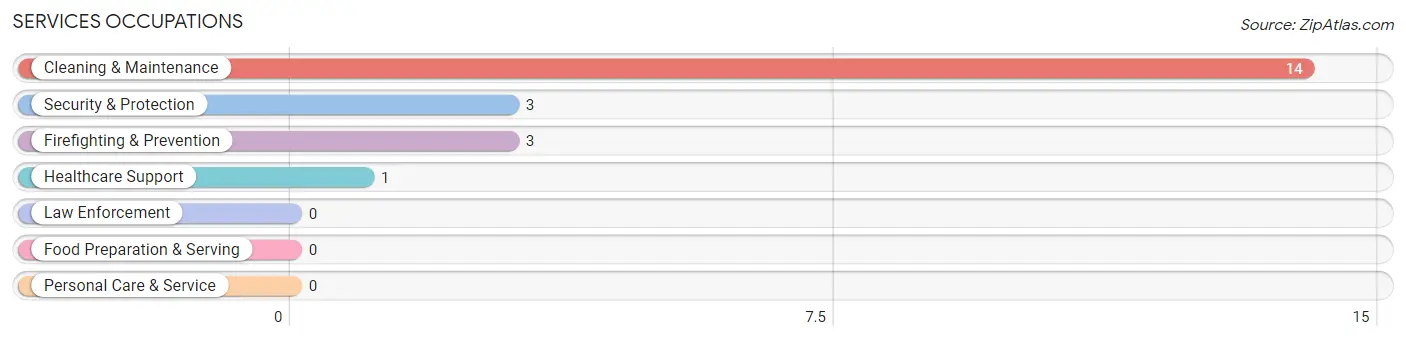
Services Occupations
The most common Services occupations in Picacho are Cleaning & Maintenance (14 | 13.7%), Security & Protection (3 | 2.9%), Firefighting & Prevention (3 | 2.9%), and Healthcare Support (1 | 1.0%).
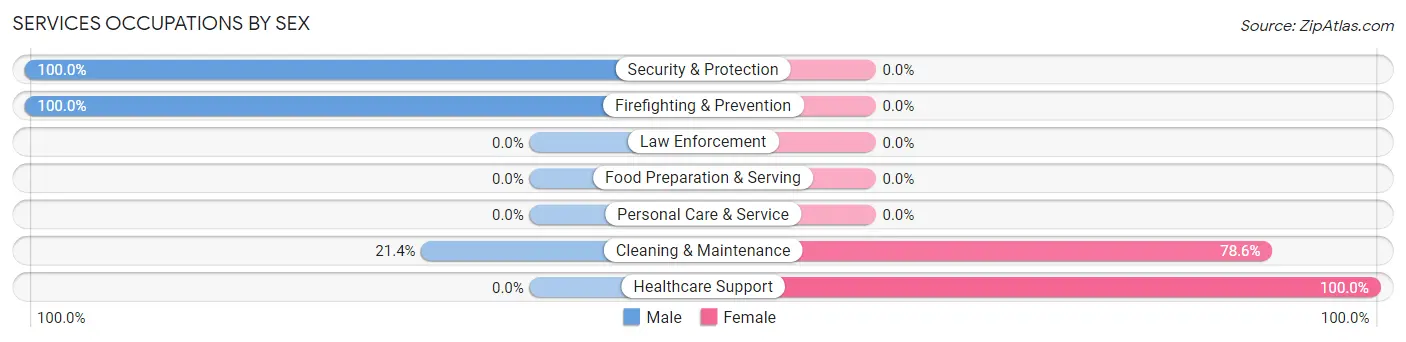
Services Occupations by Sex
Within the Services occupations in Picacho, the most male-oriented occupations are Security & Protection (100.0%), Firefighting & Prevention (100.0%), and Cleaning & Maintenance (21.4%), while the most female-oriented occupations are Healthcare Support (100.0%), and Cleaning & Maintenance (78.6%).
| Occupation | Male | Female |
| Healthcare Support | 0 (0.0%) | 1 (100.0%) |
| Security & Protection | 3 (100.0%) | 0 (0.0%) |
| Firefighting & Prevention | 3 (100.0%) | 0 (0.0%) |
| Law Enforcement | 0 (0.0%) | 0 (0.0%) |
| Food Preparation & Serving | 0 (0.0%) | 0 (0.0%) |
| Cleaning & Maintenance | 3 (21.4%) | 11 (78.6%) |
| Personal Care & Service | 0 (0.0%) | 0 (0.0%) |
| Total (Category) | 6 (33.3%) | 12 (66.7%) |
| Total (Overall) | 54 (52.9%) | 48 (47.1%) |
Sales and Office Occupations
The most common Sales and Office occupations in Picacho are Sales & Related (16 | 15.7%), and Office & Administration (4 | 3.9%).
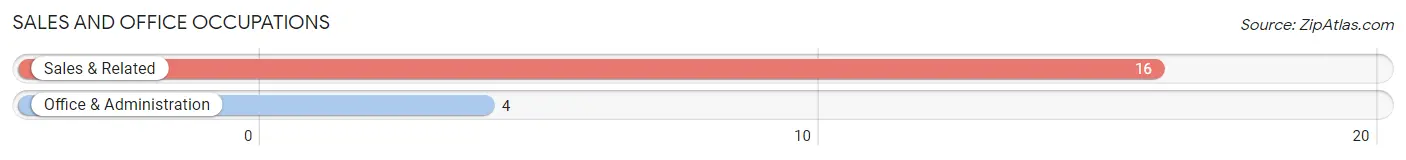
Sales and Office Occupations by Sex
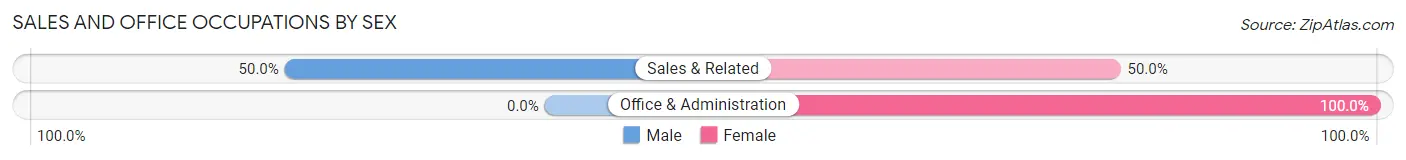
| Occupation | Male | Female |
| Sales & Related | 8 (50.0%) | 8 (50.0%) |
| Office & Administration | 0 (0.0%) | 4 (100.0%) |
| Total (Category) | 8 (40.0%) | 12 (60.0%) |
| Total (Overall) | 54 (52.9%) | 48 (47.1%) |
Natural Resources, Construction and Maintenance Occupations
The most common Natural Resources, Construction and Maintenance occupations in Picacho are Construction & Extraction (5 | 4.9%), and Installation, Maintenance & Repair (4 | 3.9%).
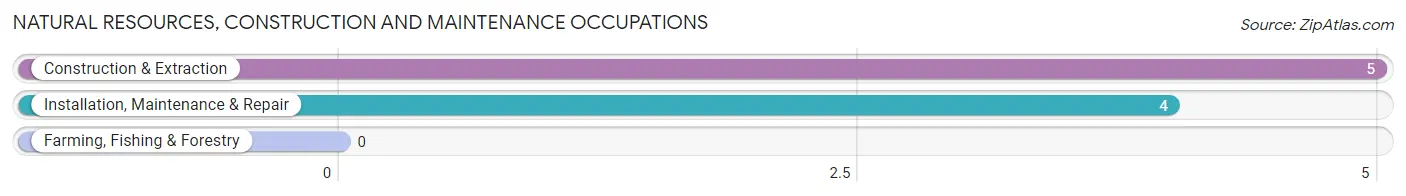
Natural Resources, Construction and Maintenance Occupations by Sex
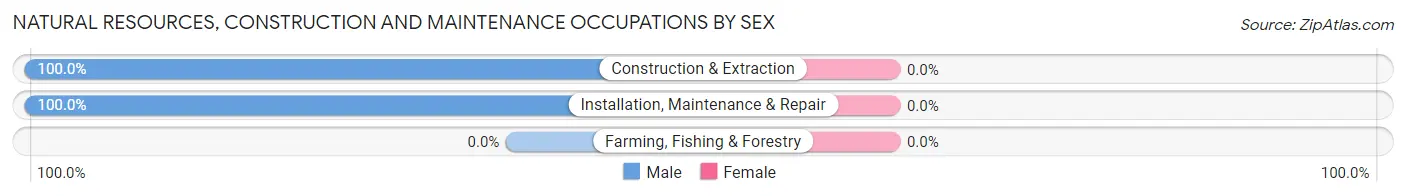
| Occupation | Male | Female |
| Farming, Fishing & Forestry | 0 (0.0%) | 0 (0.0%) |
| Construction & Extraction | 5 (100.0%) | 0 (0.0%) |
| Installation, Maintenance & Repair | 4 (100.0%) | 0 (0.0%) |
| Total (Category) | 9 (100.0%) | 0 (0.0%) |
| Total (Overall) | 54 (52.9%) | 48 (47.1%) |
Production, Transportation and Moving Occupations
The most common Production, Transportation and Moving occupations in Picacho are Production (27 | 26.5%), and Material Moving (5 | 4.9%).
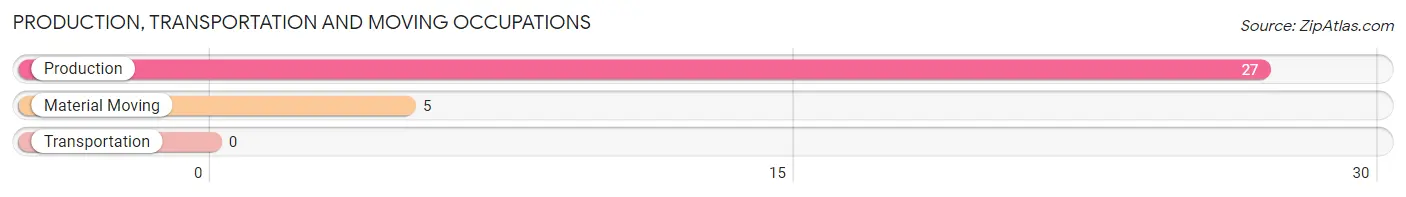
Production, Transportation and Moving Occupations by Sex
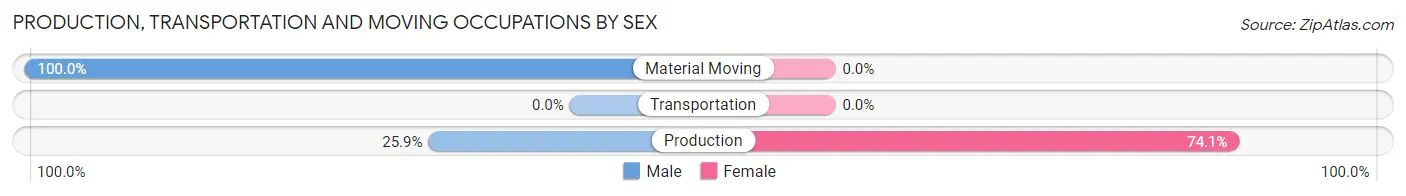
| Occupation | Male | Female |
| Production | 7 (25.9%) | 20 (74.1%) |
| Transportation | 0 (0.0%) | 0 (0.0%) |
| Material Moving | 5 (100.0%) | 0 (0.0%) |
| Total (Category) | 12 (37.5%) | 20 (62.5%) |
| Total (Overall) | 54 (52.9%) | 48 (47.1%) |
Employment Industries by Sex in Picacho
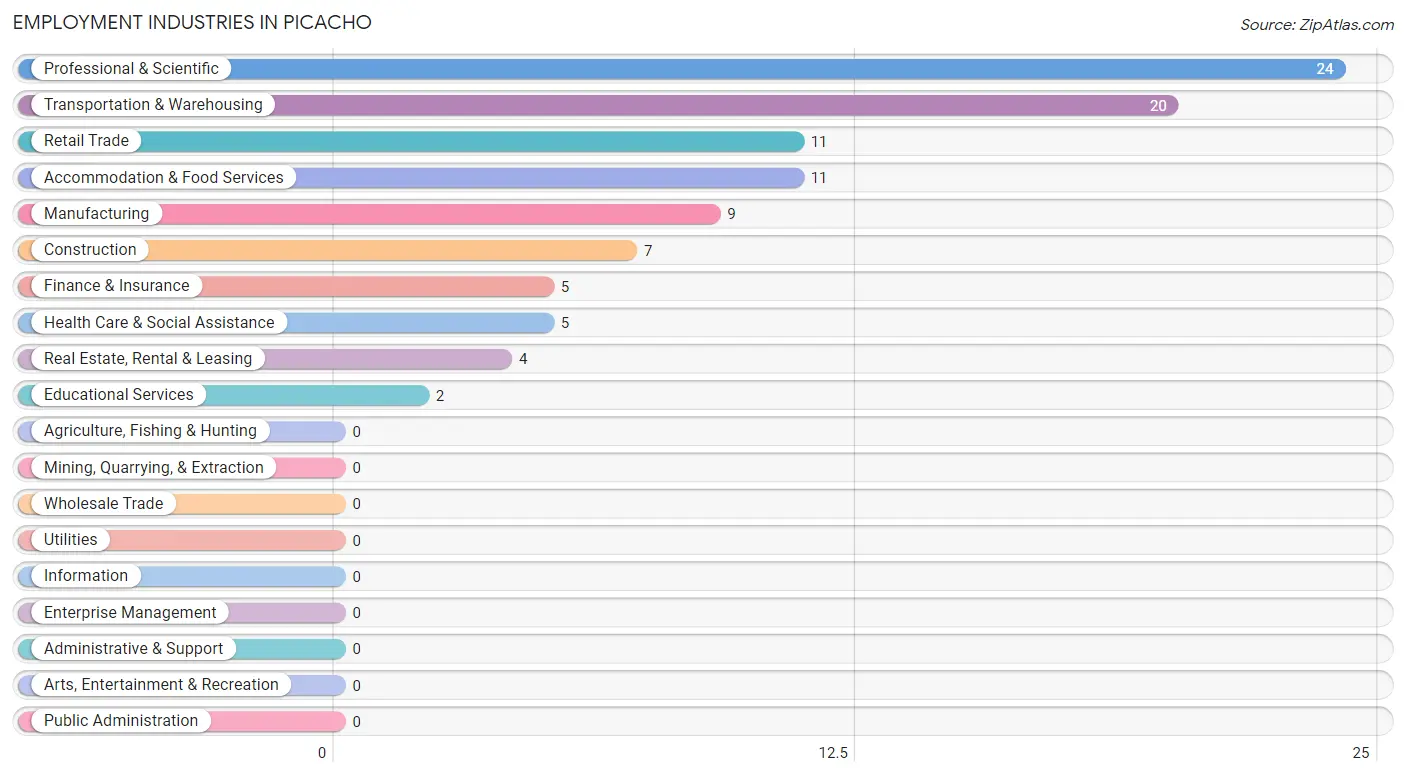
Employment Industries in Picacho
The major employment industries in Picacho include Professional & Scientific (24 | 23.5%), Transportation & Warehousing (20 | 19.6%), Retail Trade (11 | 10.8%), Accommodation & Food Services (11 | 10.8%), and Manufacturing (9 | 8.8%).
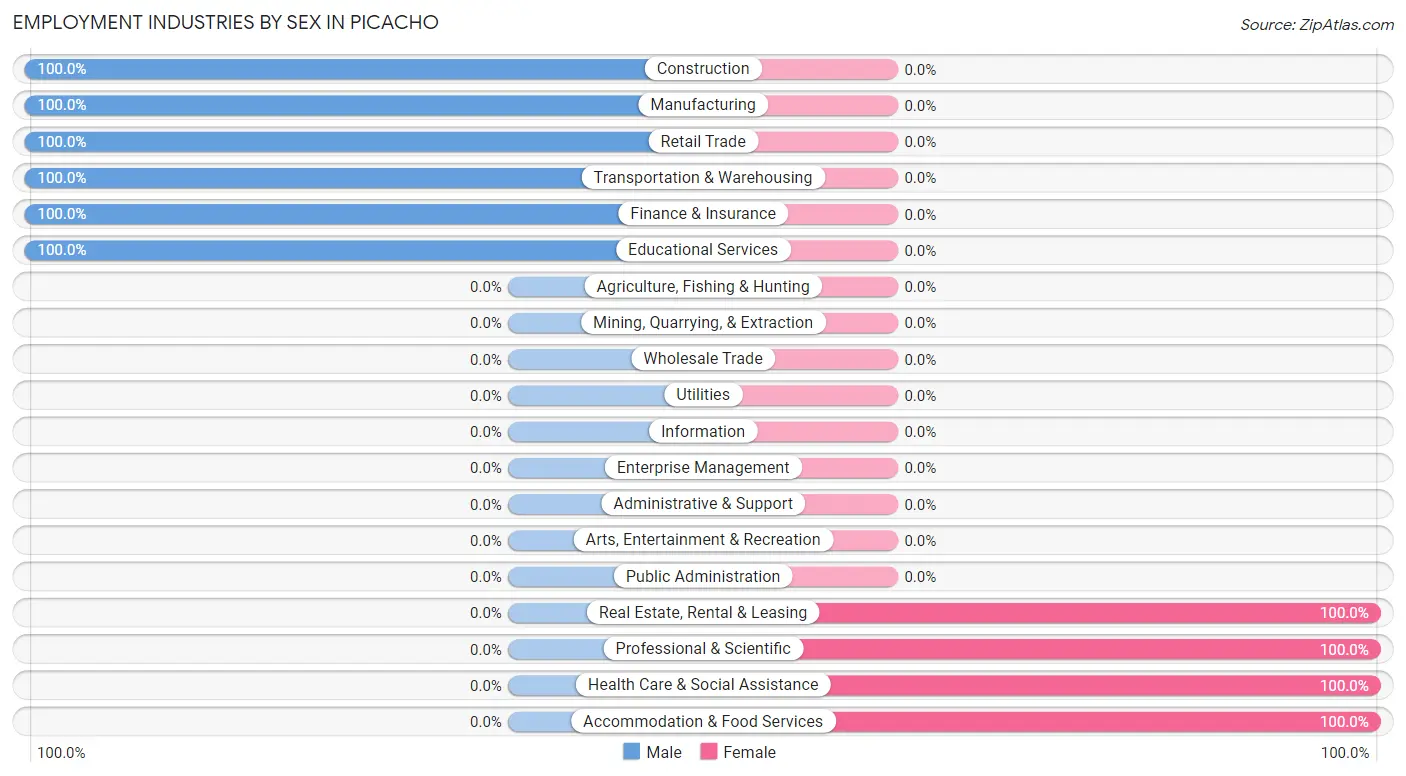
Employment Industries by Sex in Picacho
The Picacho industries that see more men than women are Construction (100.0%), Manufacturing (100.0%), and Retail Trade (100.0%), whereas the industries that tend to have a higher number of women are Real Estate, Rental & Leasing (100.0%), Professional & Scientific (100.0%), and Health Care & Social Assistance (100.0%).
| Industry | Male | Female |
| Agriculture, Fishing & Hunting | 0 (0.0%) | 0 (0.0%) |
| Mining, Quarrying, & Extraction | 0 (0.0%) | 0 (0.0%) |
| Construction | 7 (100.0%) | 0 (0.0%) |
| Manufacturing | 9 (100.0%) | 0 (0.0%) |
| Wholesale Trade | 0 (0.0%) | 0 (0.0%) |
| Retail Trade | 11 (100.0%) | 0 (0.0%) |
| Transportation & Warehousing | 20 (100.0%) | 0 (0.0%) |
| Utilities | 0 (0.0%) | 0 (0.0%) |
| Information | 0 (0.0%) | 0 (0.0%) |
| Finance & Insurance | 5 (100.0%) | 0 (0.0%) |
| Real Estate, Rental & Leasing | 0 (0.0%) | 4 (100.0%) |
| Professional & Scientific | 0 (0.0%) | 24 (100.0%) |
| Enterprise Management | 0 (0.0%) | 0 (0.0%) |
| Administrative & Support | 0 (0.0%) | 0 (0.0%) |
| Educational Services | 2 (100.0%) | 0 (0.0%) |
| Health Care & Social Assistance | 0 (0.0%) | 5 (100.0%) |
| Arts, Entertainment & Recreation | 0 (0.0%) | 0 (0.0%) |
| Accommodation & Food Services | 0 (0.0%) | 11 (100.0%) |
| Public Administration | 0 (0.0%) | 0 (0.0%) |
| Total | 54 (52.9%) | 48 (47.1%) |
Education in Picacho
School Enrollment in Picacho
The most common levels of schooling among the 28 students in Picacho are high school (10 | 35.7%), elementary school (9 | 32.1%), and middle school (5 | 17.9%).
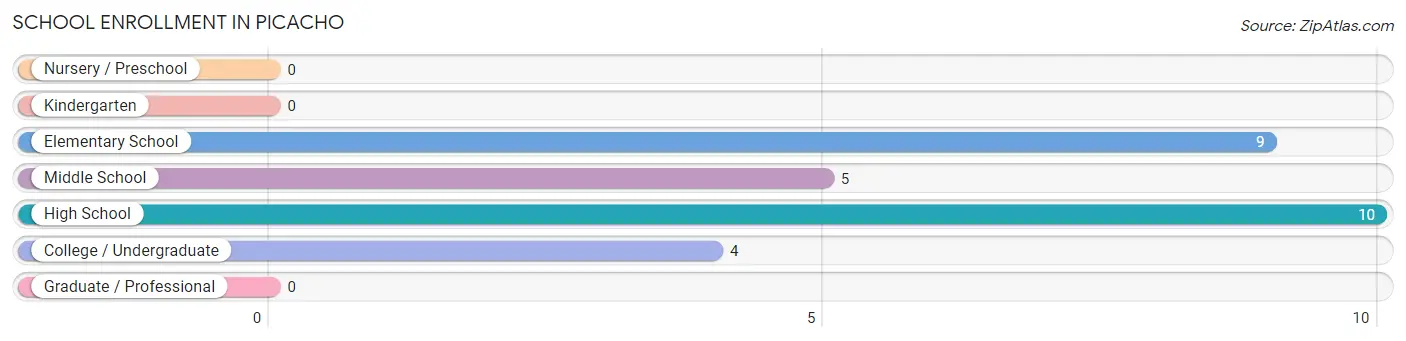
| School Level | # Students | % Students |
| Nursery / Preschool | 0 | 0.0% |
| Kindergarten | 0 | 0.0% |
| Elementary School | 9 | 32.1% |
| Middle School | 5 | 17.9% |
| High School | 10 | 35.7% |
| College / Undergraduate | 4 | 14.3% |
| Graduate / Professional | 0 | 0.0% |
| Total | 28 | 100.0% |
School Enrollment by Age by Funding Source in Picacho
Out of a total of 28 students who are enrolled in schools in Picacho, 5 (17.9%) attend a private institution, while the remaining 23 (82.1%) are enrolled in public schools. The age group of 10 to 14 year olds has the highest likelihood of being enrolled in private schools, with 5 (100.0% in the age bracket) enrolled. Conversely, the age group of 5 to 9 year old has the lowest likelihood of being enrolled in a private school, with 9 (100.0% in the age bracket) attending a public institution.
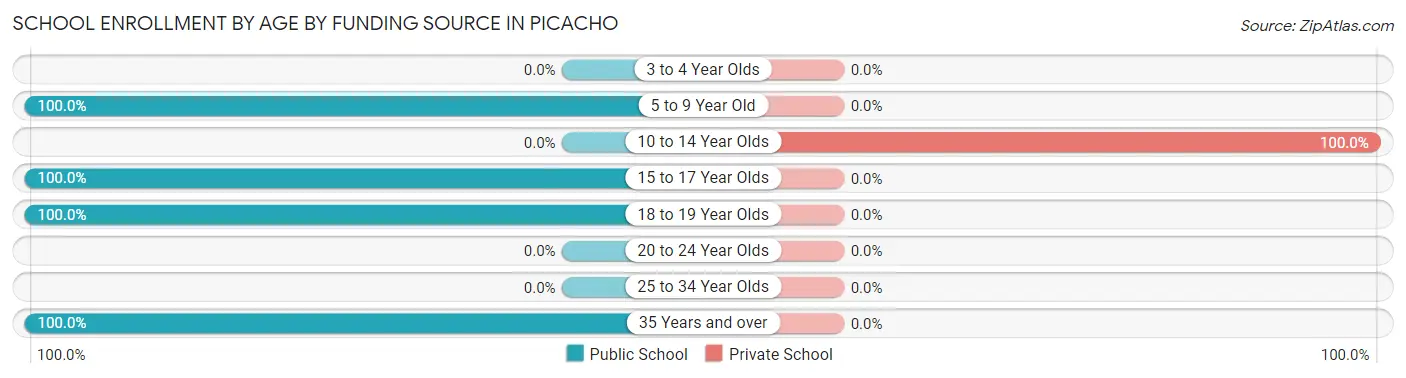
| Age Bracket | Public School | Private School |
| 3 to 4 Year Olds | 0 (0.0%) | 0 (0.0%) |
| 5 to 9 Year Old | 9 (100.0%) | 0 (0.0%) |
| 10 to 14 Year Olds | 0 (0.0%) | 5 (100.0%) |
| 15 to 17 Year Olds | 7 (100.0%) | 0 (0.0%) |
| 18 to 19 Year Olds | 3 (100.0%) | 0 (0.0%) |
| 20 to 24 Year Olds | 0 (0.0%) | 0 (0.0%) |
| 25 to 34 Year Olds | 0 (0.0%) | 0 (0.0%) |
| 35 Years and over | 4 (100.0%) | 0 (0.0%) |
| Total | 23 (82.1%) | 5 (17.9%) |
Educational Attainment by Field of Study in Picacho
Arts & humanities (5 | 62.5%), and education (3 | 37.5%) are the most common fields of study among 8 individuals in Picacho who have obtained a bachelor's degree or higher.
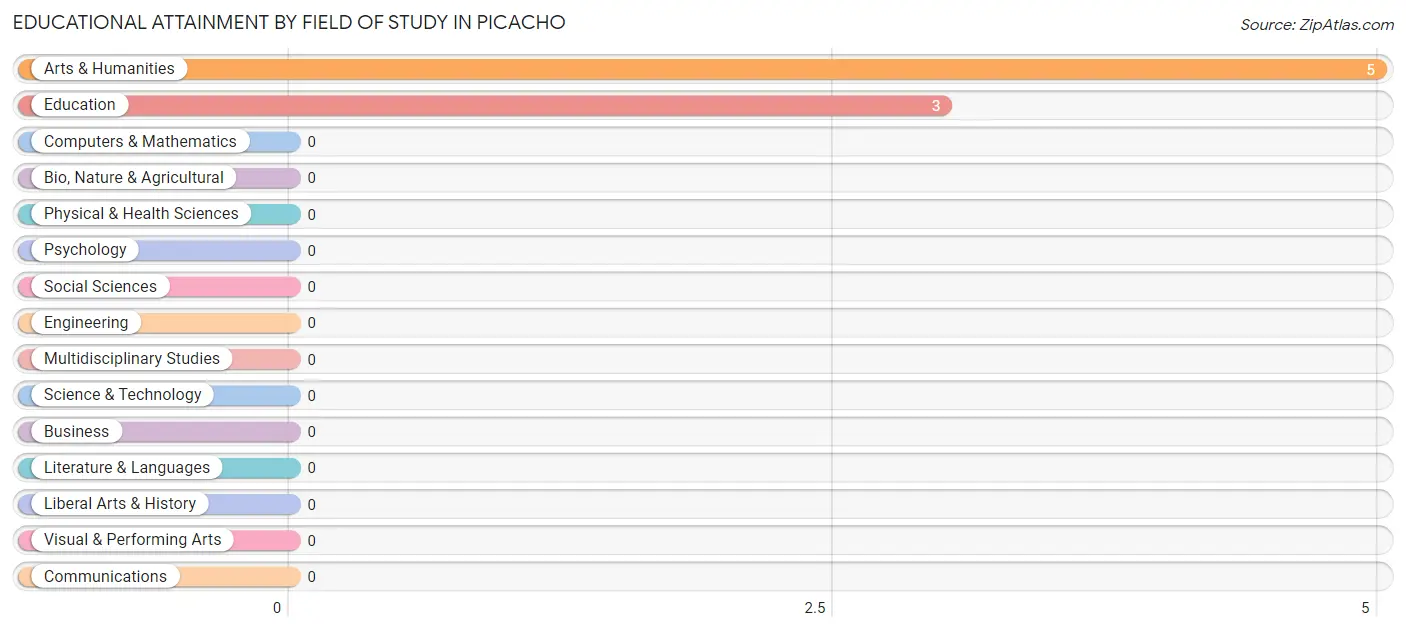
| Field of Study | # Graduates | % Graduates |
| Computers & Mathematics | 0 | 0.0% |
| Bio, Nature & Agricultural | 0 | 0.0% |
| Physical & Health Sciences | 0 | 0.0% |
| Psychology | 0 | 0.0% |
| Social Sciences | 0 | 0.0% |
| Engineering | 0 | 0.0% |
| Multidisciplinary Studies | 0 | 0.0% |
| Science & Technology | 0 | 0.0% |
| Business | 0 | 0.0% |
| Education | 3 | 37.5% |
| Literature & Languages | 0 | 0.0% |
| Liberal Arts & History | 0 | 0.0% |
| Visual & Performing Arts | 0 | 0.0% |
| Communications | 0 | 0.0% |
| Arts & Humanities | 5 | 62.5% |
| Total | 8 | 100.0% |
Transportation & Commute in Picacho
Vehicle Availability by Sex in Picacho
The most prevalent vehicle ownership categories in Picacho are males with 2 vehicles (22, accounting for 42.3%) and females with 2 vehicles (9, making up 50.0%).
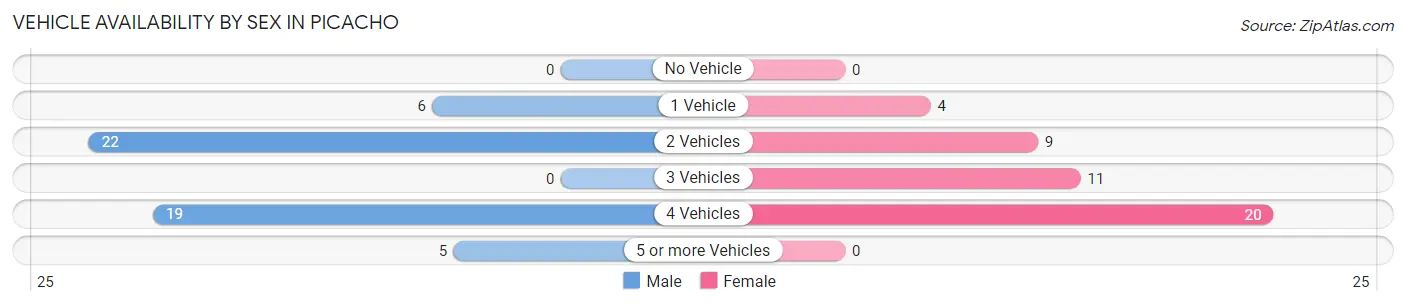
| Vehicles Available | Male | Female |
| No Vehicle | 0 (0.0%) | 0 (0.0%) |
| 1 Vehicle | 6 (11.5%) | 4 (9.1%) |
| 2 Vehicles | 22 (42.3%) | 9 (20.4%) |
| 3 Vehicles | 0 (0.0%) | 11 (25.0%) |
| 4 Vehicles | 19 (36.5%) | 20 (45.5%) |
| 5 or more Vehicles | 5 (9.6%) | 0 (0.0%) |
| Total | 52 (100.0%) | 44 (100.0%) |
Commute Time in Picacho
The most frequently occuring commute durations in Picacho are 30 to 34 minutes (24 commuters, 25.0%), 45 to 59 minutes (20 commuters, 20.8%), and 60 to 89 minutes (12 commuters, 12.5%).
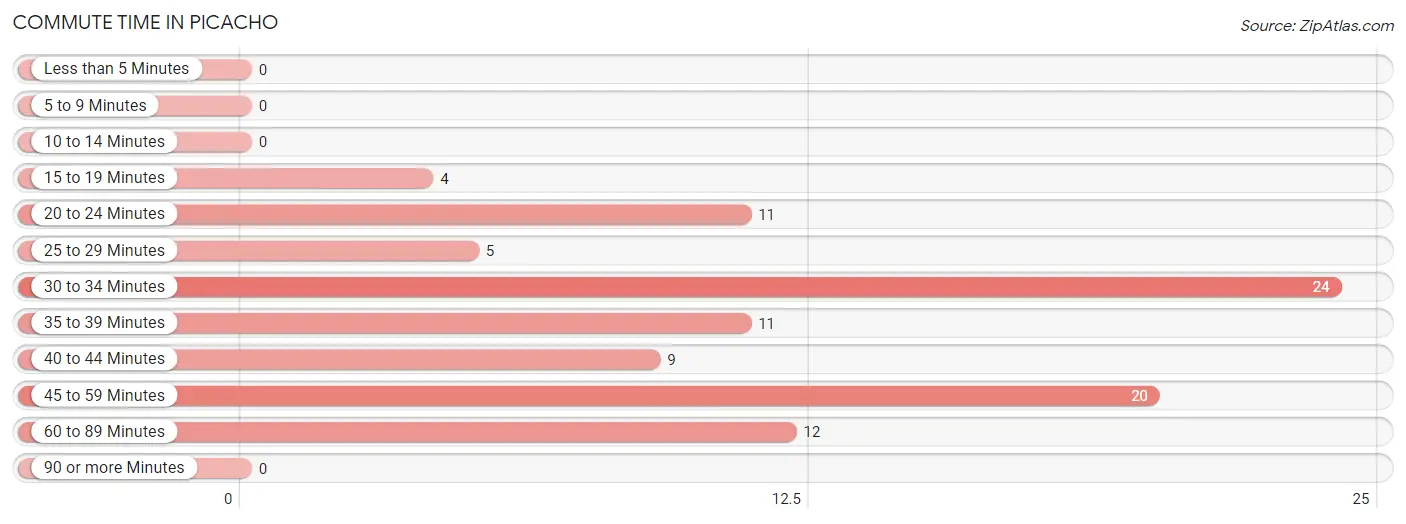
| Commute Time | # Commuters | % Commuters |
| Less than 5 Minutes | 0 | 0.0% |
| 5 to 9 Minutes | 0 | 0.0% |
| 10 to 14 Minutes | 0 | 0.0% |
| 15 to 19 Minutes | 4 | 4.2% |
| 20 to 24 Minutes | 11 | 11.5% |
| 25 to 29 Minutes | 5 | 5.2% |
| 30 to 34 Minutes | 24 | 25.0% |
| 35 to 39 Minutes | 11 | 11.5% |
| 40 to 44 Minutes | 9 | 9.4% |
| 45 to 59 Minutes | 20 | 20.8% |
| 60 to 89 Minutes | 12 | 12.5% |
| 90 or more Minutes | 0 | 0.0% |
Commute Time by Sex in Picacho
The most common commute times in Picacho are 30 to 34 minutes (23 commuters, 44.2%) for males and 45 to 59 minutes (20 commuters, 45.5%) for females.
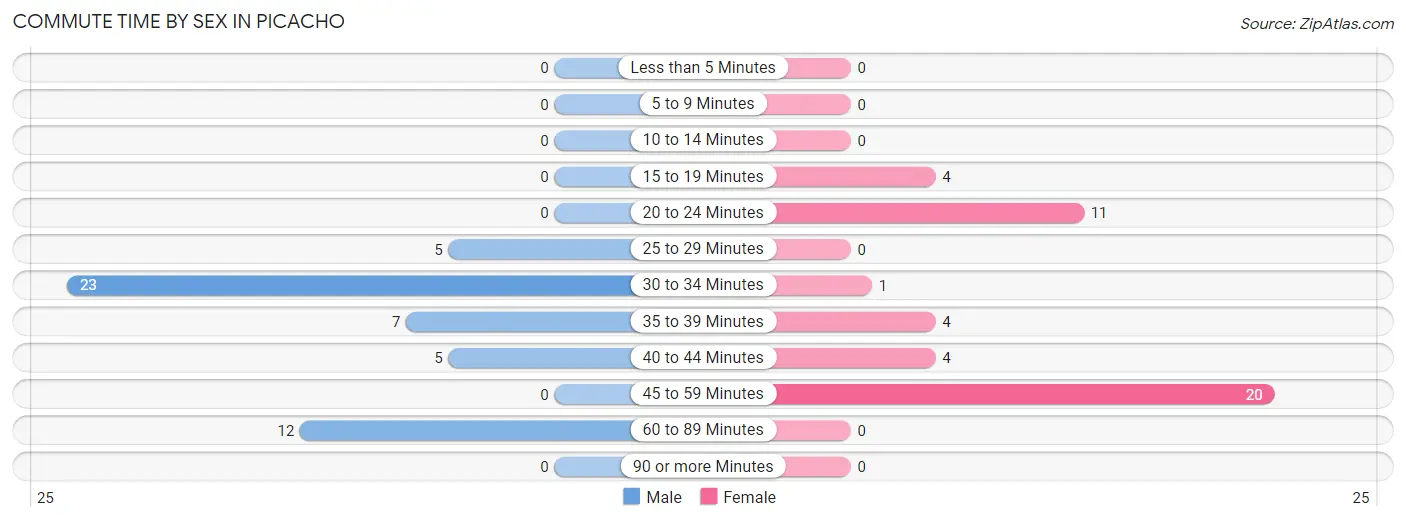
| Commute Time | Male | Female |
| Less than 5 Minutes | 0 (0.0%) | 0 (0.0%) |
| 5 to 9 Minutes | 0 (0.0%) | 0 (0.0%) |
| 10 to 14 Minutes | 0 (0.0%) | 0 (0.0%) |
| 15 to 19 Minutes | 0 (0.0%) | 4 (9.1%) |
| 20 to 24 Minutes | 0 (0.0%) | 11 (25.0%) |
| 25 to 29 Minutes | 5 (9.6%) | 0 (0.0%) |
| 30 to 34 Minutes | 23 (44.2%) | 1 (2.3%) |
| 35 to 39 Minutes | 7 (13.5%) | 4 (9.1%) |
| 40 to 44 Minutes | 5 (9.6%) | 4 (9.1%) |
| 45 to 59 Minutes | 0 (0.0%) | 20 (45.5%) |
| 60 to 89 Minutes | 12 (23.1%) | 0 (0.0%) |
| 90 or more Minutes | 0 (0.0%) | 0 (0.0%) |
Time of Departure to Work by Sex in Picacho
The most frequent times of departure to work in Picacho are 7:00 AM to 7:29 AM (20, 38.5%) for males and 7:30 AM to 7:59 AM (20, 45.5%) for females.
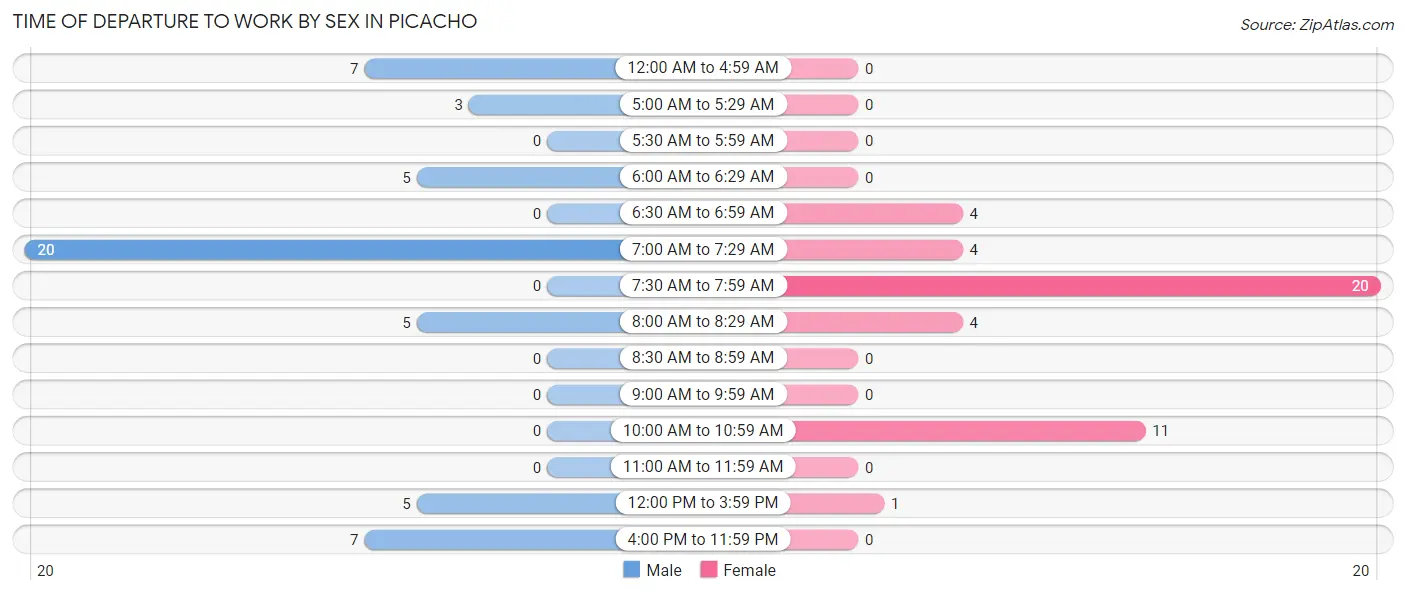
| Time of Departure | Male | Female |
| 12:00 AM to 4:59 AM | 7 (13.5%) | 0 (0.0%) |
| 5:00 AM to 5:29 AM | 3 (5.8%) | 0 (0.0%) |
| 5:30 AM to 5:59 AM | 0 (0.0%) | 0 (0.0%) |
| 6:00 AM to 6:29 AM | 5 (9.6%) | 0 (0.0%) |
| 6:30 AM to 6:59 AM | 0 (0.0%) | 4 (9.1%) |
| 7:00 AM to 7:29 AM | 20 (38.5%) | 4 (9.1%) |
| 7:30 AM to 7:59 AM | 0 (0.0%) | 20 (45.5%) |
| 8:00 AM to 8:29 AM | 5 (9.6%) | 4 (9.1%) |
| 8:30 AM to 8:59 AM | 0 (0.0%) | 0 (0.0%) |
| 9:00 AM to 9:59 AM | 0 (0.0%) | 0 (0.0%) |
| 10:00 AM to 10:59 AM | 0 (0.0%) | 11 (25.0%) |
| 11:00 AM to 11:59 AM | 0 (0.0%) | 0 (0.0%) |
| 12:00 PM to 3:59 PM | 5 (9.6%) | 1 (2.3%) |
| 4:00 PM to 11:59 PM | 7 (13.5%) | 0 (0.0%) |
| Total | 52 (100.0%) | 44 (100.0%) |
Housing Occupancy in Picacho
Occupancy by Ownership in Picacho
Of the total 133 dwellings in Picacho, owner-occupied units account for 119 (89.5%), while renter-occupied units make up 14 (10.5%).
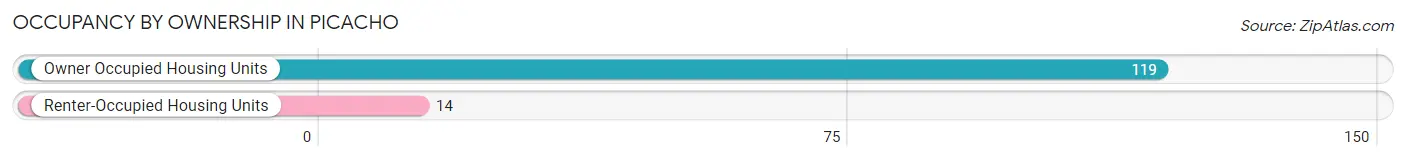
| Occupancy | # Housing Units | % Housing Units |
| Owner Occupied Housing Units | 119 | 89.5% |
| Renter-Occupied Housing Units | 14 | 10.5% |
| Total Occupied Housing Units | 133 | 100.0% |
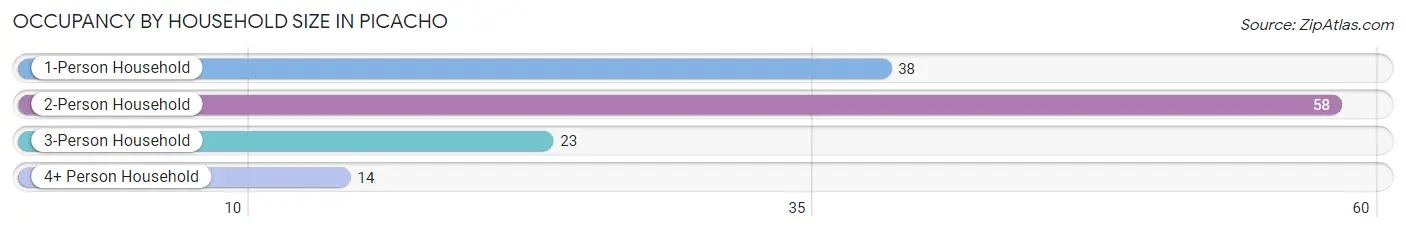
Occupancy by Household Size in Picacho
| Household Size | # Housing Units | % Housing Units |
| 1-Person Household | 38 | 28.6% |
| 2-Person Household | 58 | 43.6% |
| 3-Person Household | 23 | 17.3% |
| 4+ Person Household | 14 | 10.5% |
| Total Housing Units | 133 | 100.0% |
Occupancy by Ownership by Household Size in Picacho
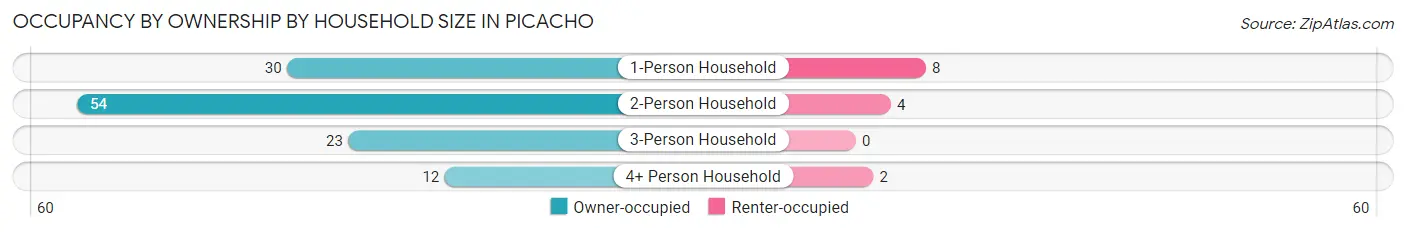
| Household Size | Owner-occupied | Renter-occupied |
| 1-Person Household | 30 (78.9%) | 8 (21.0%) |
| 2-Person Household | 54 (93.1%) | 4 (6.9%) |
| 3-Person Household | 23 (100.0%) | 0 (0.0%) |
| 4+ Person Household | 12 (85.7%) | 2 (14.3%) |
| Total Housing Units | 119 (89.5%) | 14 (10.5%) |
Occupancy by Educational Attainment in Picacho
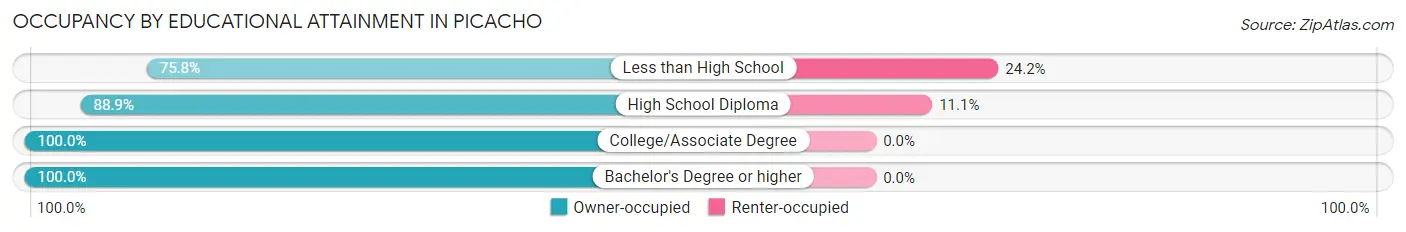
| Household Size | Owner-occupied | Renter-occupied |
| Less than High School | 25 (75.8%) | 8 (24.2%) |
| High School Diploma | 48 (88.9%) | 6 (11.1%) |
| College/Associate Degree | 38 (100.0%) | 0 (0.0%) |
| Bachelor's Degree or higher | 8 (100.0%) | 0 (0.0%) |
Occupancy by Age of Householder in Picacho
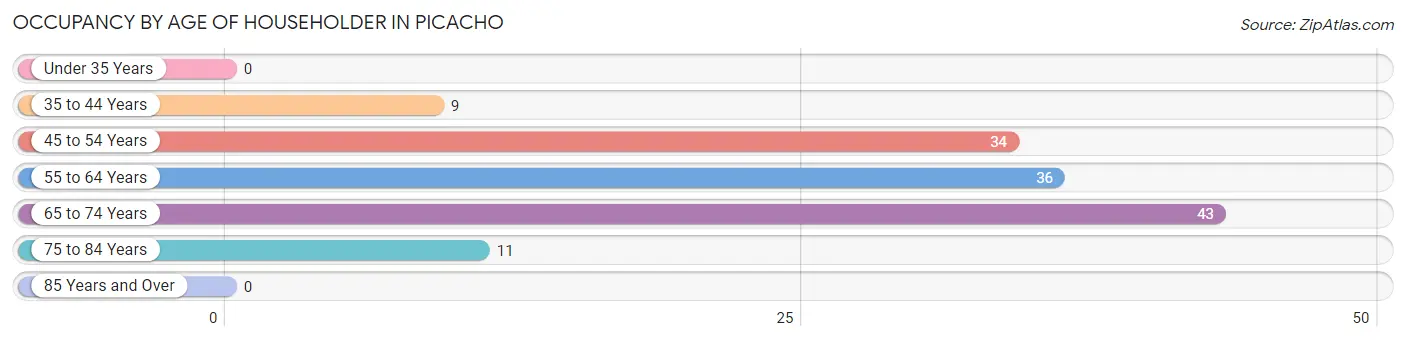
| Age Bracket | # Households | % Households |
| Under 35 Years | 0 | 0.0% |
| 35 to 44 Years | 9 | 6.8% |
| 45 to 54 Years | 34 | 25.6% |
| 55 to 64 Years | 36 | 27.1% |
| 65 to 74 Years | 43 | 32.3% |
| 75 to 84 Years | 11 | 8.3% |
| 85 Years and Over | 0 | 0.0% |
| Total | 133 | 100.0% |
Housing Finances in Picacho
Median Income by Occupancy in Picacho
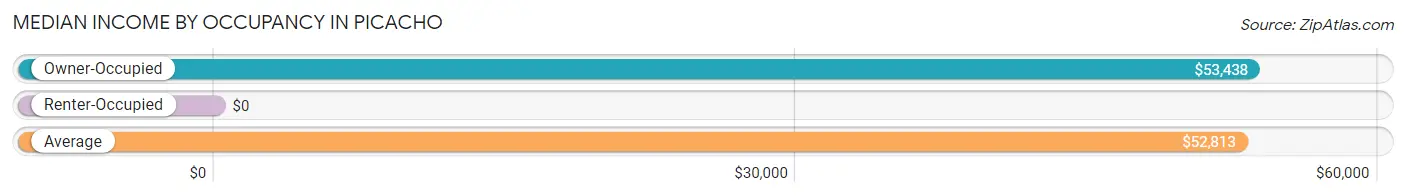
| Occupancy Type | # Households | Median Income |
| Owner-Occupied | 119 (89.5%) | $53,438 |
| Renter-Occupied | 14 (10.5%) | $0 |
| Average | 133 (100.0%) | $52,813 |
Occupancy by Householder Income Bracket in Picacho
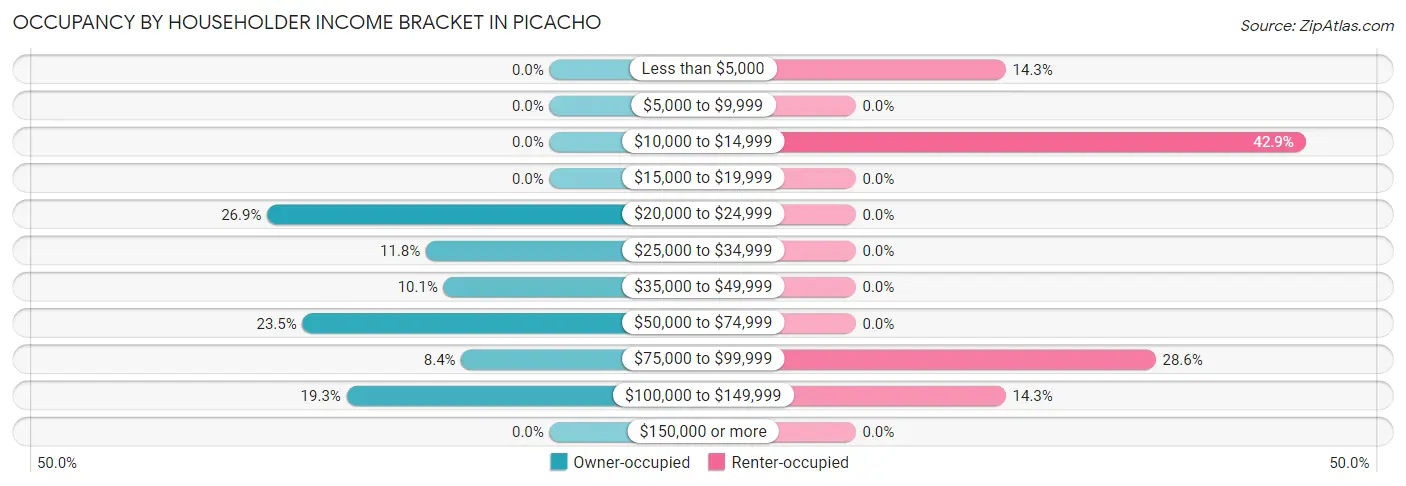
| Income Bracket | Owner-occupied | Renter-occupied |
| Less than $5,000 | 0 (0.0%) | 2 (14.3%) |
| $5,000 to $9,999 | 0 (0.0%) | 0 (0.0%) |
| $10,000 to $14,999 | 0 (0.0%) | 6 (42.9%) |
| $15,000 to $19,999 | 0 (0.0%) | 0 (0.0%) |
| $20,000 to $24,999 | 32 (26.9%) | 0 (0.0%) |
| $25,000 to $34,999 | 14 (11.8%) | 0 (0.0%) |
| $35,000 to $49,999 | 12 (10.1%) | 0 (0.0%) |
| $50,000 to $74,999 | 28 (23.5%) | 0 (0.0%) |
| $75,000 to $99,999 | 10 (8.4%) | 4 (28.6%) |
| $100,000 to $149,999 | 23 (19.3%) | 2 (14.3%) |
| $150,000 or more | 0 (0.0%) | 0 (0.0%) |
| Total | 119 (100.0%) | 14 (100.0%) |
Monthly Housing Cost Tiers in Picacho
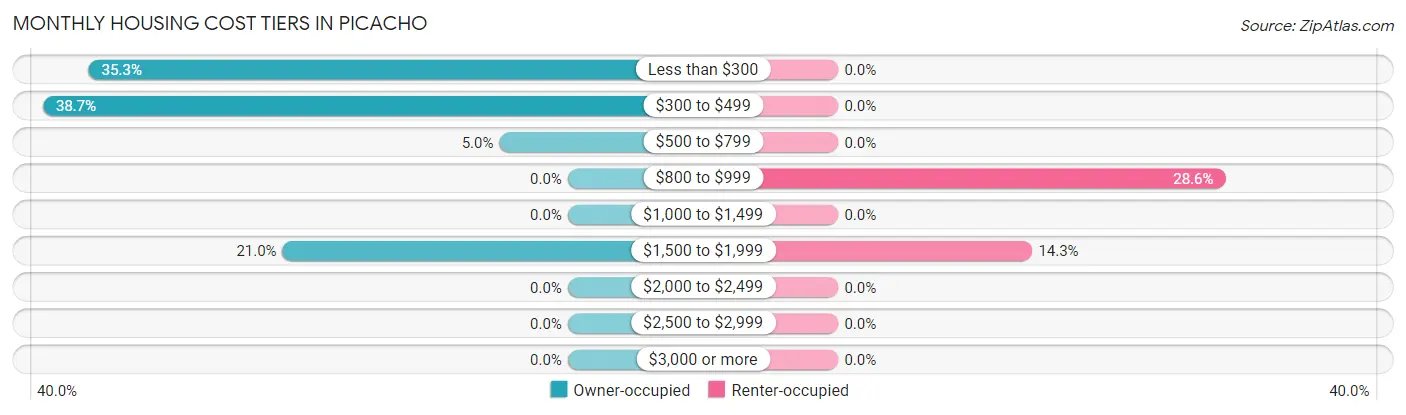
| Monthly Cost | Owner-occupied | Renter-occupied |
| Less than $300 | 42 (35.3%) | 0 (0.0%) |
| $300 to $499 | 46 (38.7%) | 0 (0.0%) |
| $500 to $799 | 6 (5.0%) | 0 (0.0%) |
| $800 to $999 | 0 (0.0%) | 4 (28.6%) |
| $1,000 to $1,499 | 0 (0.0%) | 0 (0.0%) |
| $1,500 to $1,999 | 25 (21.0%) | 2 (14.3%) |
| $2,000 to $2,499 | 0 (0.0%) | 0 (0.0%) |
| $2,500 to $2,999 | 0 (0.0%) | 0 (0.0%) |
| $3,000 or more | 0 (0.0%) | 0 (0.0%) |
| Total | 119 (100.0%) | 14 (100.0%) |
Physical Housing Characteristics in Picacho
Housing Structures in Picacho
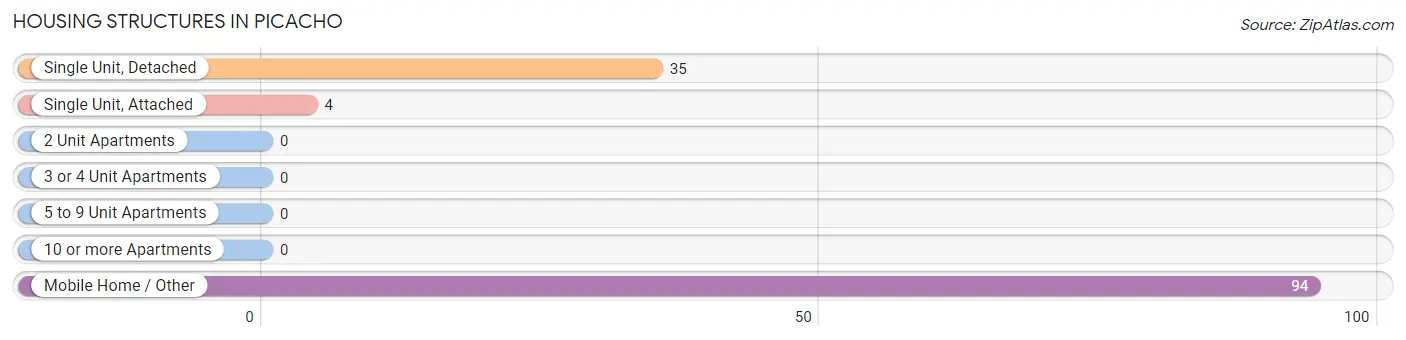
| Structure Type | # Housing Units | % Housing Units |
| Single Unit, Detached | 35 | 26.3% |
| Single Unit, Attached | 4 | 3.0% |
| 2 Unit Apartments | 0 | 0.0% |
| 3 or 4 Unit Apartments | 0 | 0.0% |
| 5 to 9 Unit Apartments | 0 | 0.0% |
| 10 or more Apartments | 0 | 0.0% |
| Mobile Home / Other | 94 | 70.7% |
| Total | 133 | 100.0% |
Housing Structures by Occupancy in Picacho
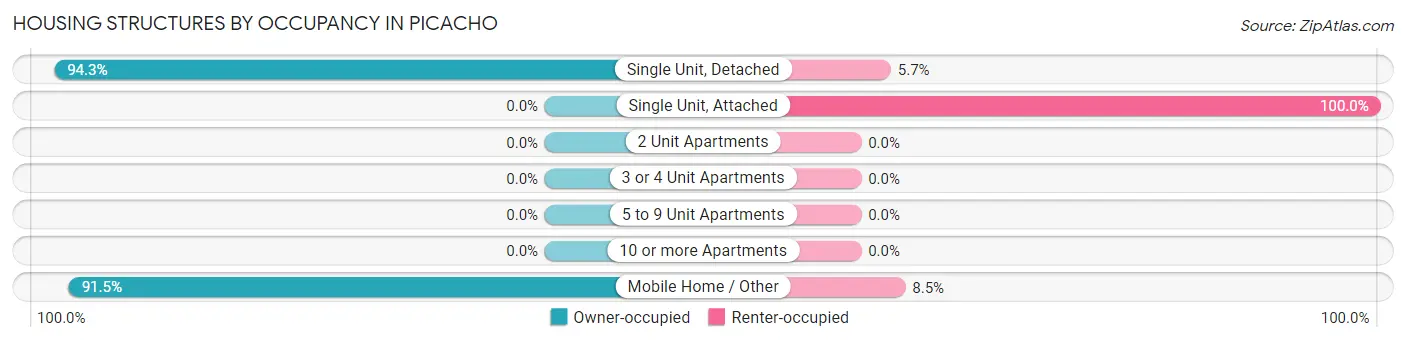
| Structure Type | Owner-occupied | Renter-occupied |
| Single Unit, Detached | 33 (94.3%) | 2 (5.7%) |
| Single Unit, Attached | 0 (0.0%) | 4 (100.0%) |
| 2 Unit Apartments | 0 (0.0%) | 0 (0.0%) |
| 3 or 4 Unit Apartments | 0 (0.0%) | 0 (0.0%) |
| 5 to 9 Unit Apartments | 0 (0.0%) | 0 (0.0%) |
| 10 or more Apartments | 0 (0.0%) | 0 (0.0%) |
| Mobile Home / Other | 86 (91.5%) | 8 (8.5%) |
| Total | 119 (89.5%) | 14 (10.5%) |
Housing Structures by Number of Rooms in Picacho
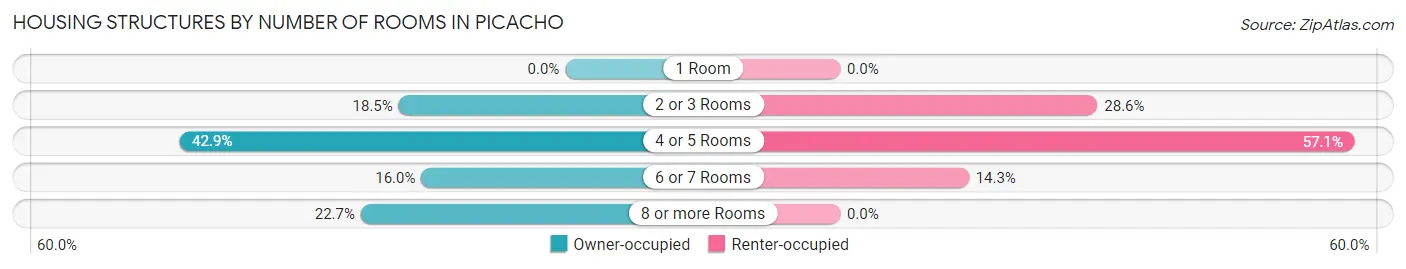
| Number of Rooms | Owner-occupied | Renter-occupied |
| 1 Room | 0 (0.0%) | 0 (0.0%) |
| 2 or 3 Rooms | 22 (18.5%) | 4 (28.6%) |
| 4 or 5 Rooms | 51 (42.9%) | 8 (57.1%) |
| 6 or 7 Rooms | 19 (16.0%) | 2 (14.3%) |
| 8 or more Rooms | 27 (22.7%) | 0 (0.0%) |
| Total | 119 (100.0%) | 14 (100.0%) |
Housing Structure by Heating Type in Picacho
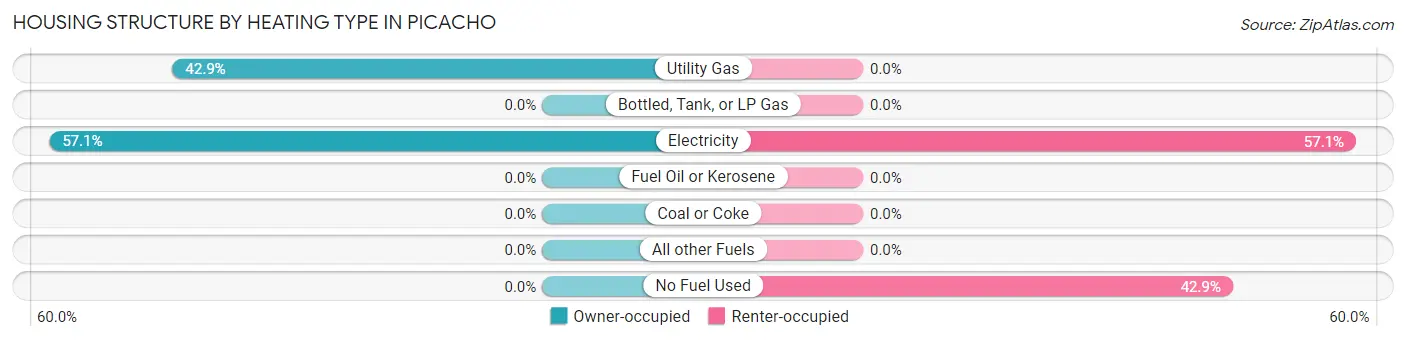
| Heating Type | Owner-occupied | Renter-occupied |
| Utility Gas | 51 (42.9%) | 0 (0.0%) |
| Bottled, Tank, or LP Gas | 0 (0.0%) | 0 (0.0%) |
| Electricity | 68 (57.1%) | 8 (57.1%) |
| Fuel Oil or Kerosene | 0 (0.0%) | 0 (0.0%) |
| Coal or Coke | 0 (0.0%) | 0 (0.0%) |
| All other Fuels | 0 (0.0%) | 0 (0.0%) |
| No Fuel Used | 0 (0.0%) | 6 (42.9%) |
| Total | 119 (100.0%) | 14 (100.0%) |
Household Vehicle Usage in Picacho
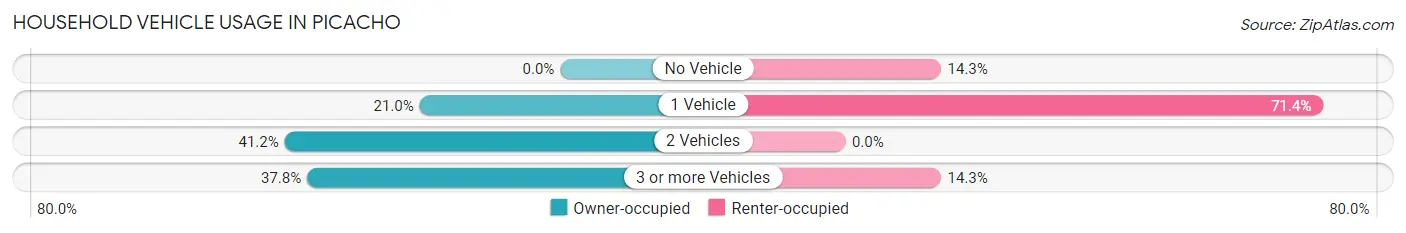
| Vehicles per Household | Owner-occupied | Renter-occupied |
| No Vehicle | 0 (0.0%) | 2 (14.3%) |
| 1 Vehicle | 25 (21.0%) | 10 (71.4%) |
| 2 Vehicles | 49 (41.2%) | 0 (0.0%) |
| 3 or more Vehicles | 45 (37.8%) | 2 (14.3%) |
| Total | 119 (100.0%) | 14 (100.0%) |
Real Estate & Mortgages in Picacho
Real Estate and Mortgage Overview in Picacho
| Characteristic | Without Mortgage | With Mortgage |
| Housing Units | 110 | 9 |
| Median Property Value | - | - |
| Median Household Income | $53,125 | $0 |
| Monthly Housing Costs | $376 | $0 |
| Real Estate Taxes | $353 | $0 |
Property Value by Mortgage Status in Picacho
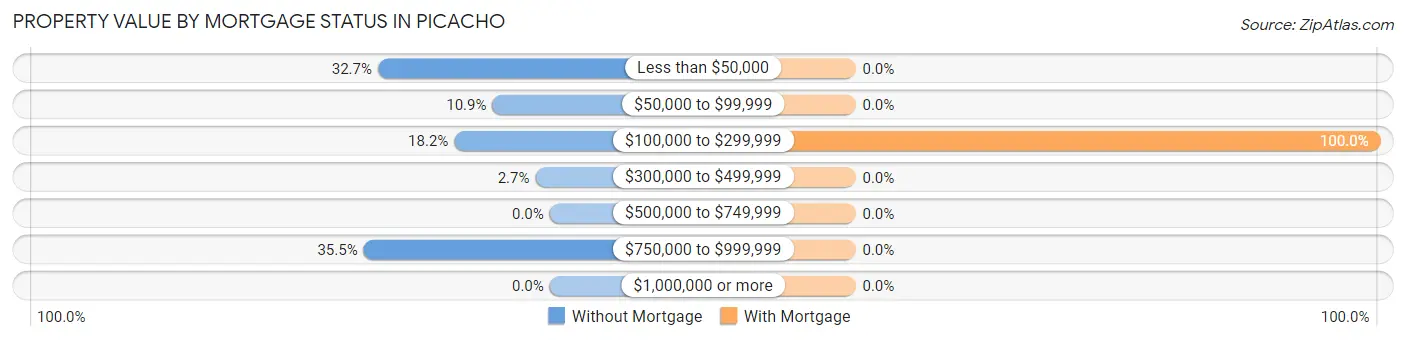
| Property Value | Without Mortgage | With Mortgage |
| Less than $50,000 | 36 (32.7%) | 0 (0.0%) |
| $50,000 to $99,999 | 12 (10.9%) | 0 (0.0%) |
| $100,000 to $299,999 | 20 (18.2%) | 9 (100.0%) |
| $300,000 to $499,999 | 3 (2.7%) | 0 (0.0%) |
| $500,000 to $749,999 | 0 (0.0%) | 0 (0.0%) |
| $750,000 to $999,999 | 39 (35.4%) | 0 (0.0%) |
| $1,000,000 or more | 0 (0.0%) | 0 (0.0%) |
| Total | 110 (100.0%) | 9 (100.0%) |
Household Income by Mortgage Status in Picacho
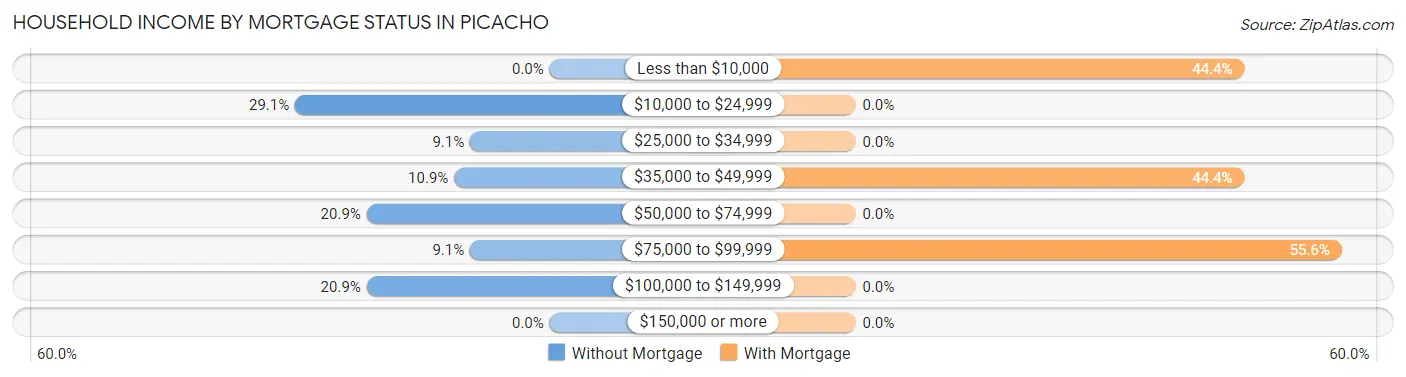
| Household Income | Without Mortgage | With Mortgage |
| Less than $10,000 | 0 (0.0%) | 4 (44.4%) |
| $10,000 to $24,999 | 32 (29.1%) | 0 (0.0%) |
| $25,000 to $34,999 | 10 (9.1%) | 0 (0.0%) |
| $35,000 to $49,999 | 12 (10.9%) | 4 (44.4%) |
| $50,000 to $74,999 | 23 (20.9%) | 0 (0.0%) |
| $75,000 to $99,999 | 10 (9.1%) | 5 (55.6%) |
| $100,000 to $149,999 | 23 (20.9%) | 0 (0.0%) |
| $150,000 or more | 0 (0.0%) | 0 (0.0%) |
| Total | 110 (100.0%) | 9 (100.0%) |
Property Value to Household Income Ratio in Picacho
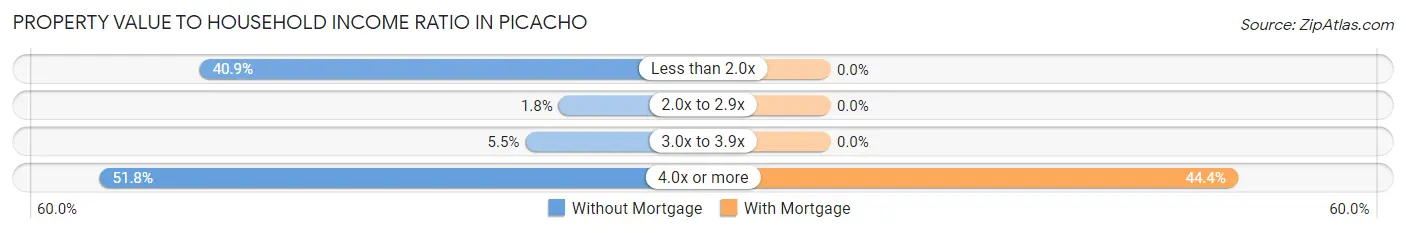
| Value-to-Income Ratio | Without Mortgage | With Mortgage |
| Less than 2.0x | 45 (40.9%) | 0 (0.0%) |
| 2.0x to 2.9x | 2 (1.8%) | 0 (0.0%) |
| 3.0x to 3.9x | 6 (5.4%) | 0 (0.0%) |
| 4.0x or more | 57 (51.8%) | 4 (44.4%) |
| Total | 110 (100.0%) | 9 (100.0%) |
Real Estate Taxes by Mortgage Status in Picacho
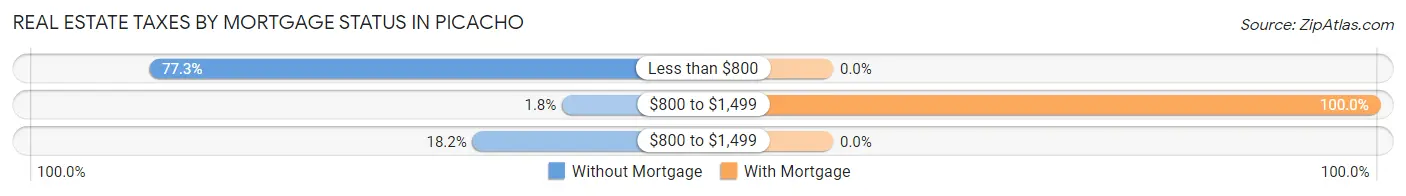
| Property Taxes | Without Mortgage | With Mortgage |
| Less than $800 | 85 (77.3%) | 0 (0.0%) |
| $800 to $1,499 | 2 (1.8%) | 9 (100.0%) |
| $800 to $1,499 | 20 (18.2%) | 0 (0.0%) |
| Total | 110 (100.0%) | 9 (100.0%) |
Health & Disability in Picacho
Health Insurance Coverage by Age in Picacho
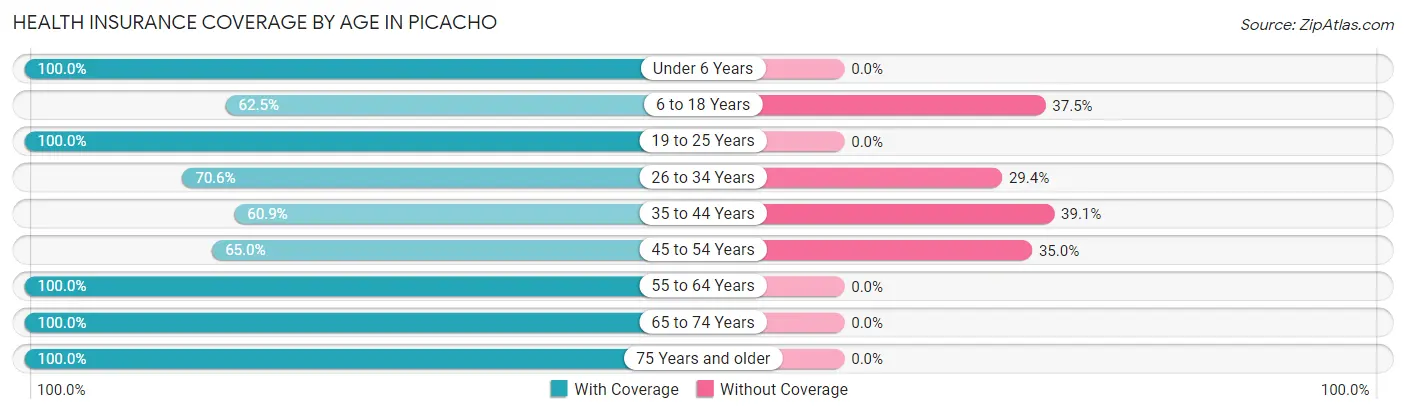
| Age Bracket | With Coverage | Without Coverage |
| Under 6 Years | 4 (100.0%) | 0 (0.0%) |
| 6 to 18 Years | 15 (62.5%) | 9 (37.5%) |
| 19 to 25 Years | 16 (100.0%) | 0 (0.0%) |
| 26 to 34 Years | 12 (70.6%) | 5 (29.4%) |
| 35 to 44 Years | 14 (60.9%) | 9 (39.1%) |
| 45 to 54 Years | 26 (65.0%) | 14 (35.0%) |
| 55 to 64 Years | 74 (100.0%) | 0 (0.0%) |
| 65 to 74 Years | 60 (100.0%) | 0 (0.0%) |
| 75 Years and older | 31 (100.0%) | 0 (0.0%) |
| Total | 252 (87.2%) | 37 (12.8%) |
Health Insurance Coverage by Citizenship Status in Picacho
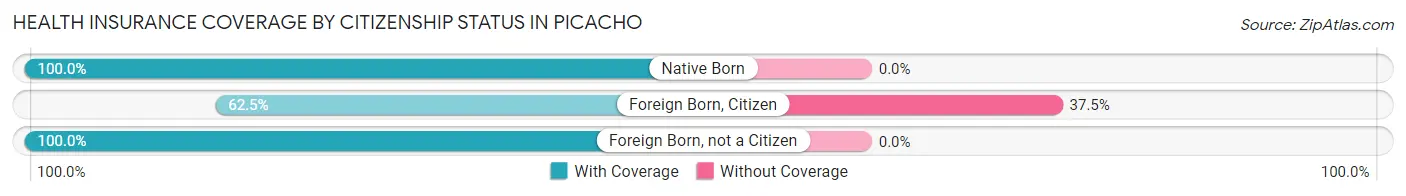
| Citizenship Status | With Coverage | Without Coverage |
| Native Born | 4 (100.0%) | 0 (0.0%) |
| Foreign Born, Citizen | 15 (62.5%) | 9 (37.5%) |
| Foreign Born, not a Citizen | 16 (100.0%) | 0 (0.0%) |
Health Insurance Coverage by Household Income in Picacho
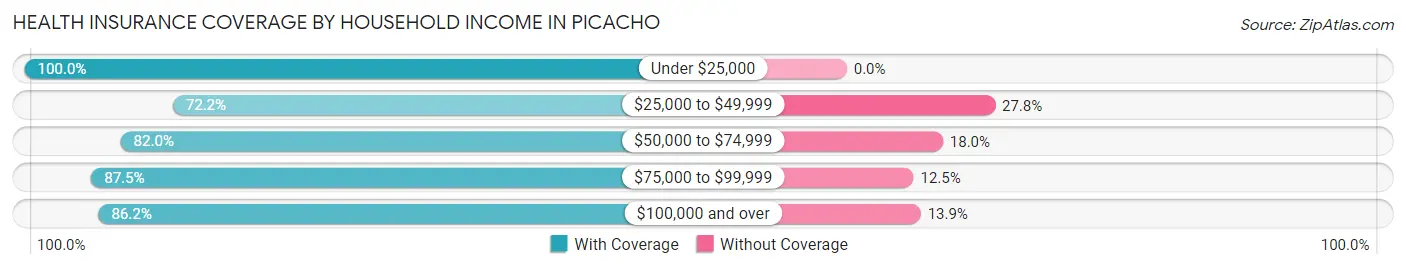
| Household Income | With Coverage | Without Coverage |
| Under $25,000 | 82 (100.0%) | 0 (0.0%) |
| $25,000 to $49,999 | 39 (72.2%) | 15 (27.8%) |
| $50,000 to $74,999 | 41 (82.0%) | 9 (18.0%) |
| $75,000 to $99,999 | 28 (87.5%) | 4 (12.5%) |
| $100,000 and over | 56 (86.2%) | 9 (13.9%) |
Public vs Private Health Insurance Coverage by Age in Picacho
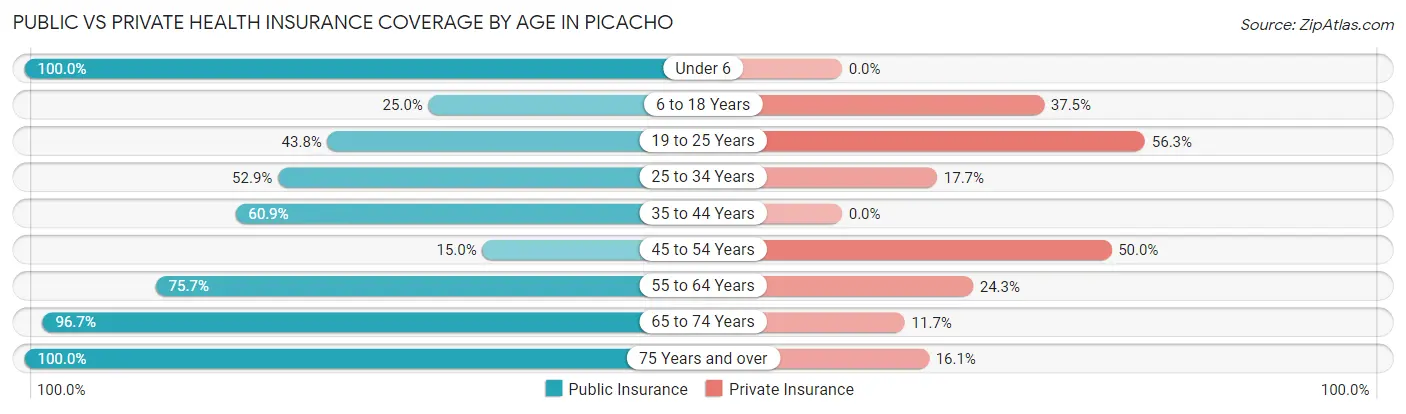
| Age Bracket | Public Insurance | Private Insurance |
| Under 6 | 4 (100.0%) | 0 (0.0%) |
| 6 to 18 Years | 6 (25.0%) | 9 (37.5%) |
| 19 to 25 Years | 7 (43.8%) | 9 (56.2%) |
| 25 to 34 Years | 9 (52.9%) | 3 (17.6%) |
| 35 to 44 Years | 14 (60.9%) | 0 (0.0%) |
| 45 to 54 Years | 6 (15.0%) | 20 (50.0%) |
| 55 to 64 Years | 56 (75.7%) | 18 (24.3%) |
| 65 to 74 Years | 58 (96.7%) | 7 (11.7%) |
| 75 Years and over | 31 (100.0%) | 5 (16.1%) |
| Total | 191 (66.1%) | 71 (24.6%) |
Disability Status by Sex by Age in Picacho
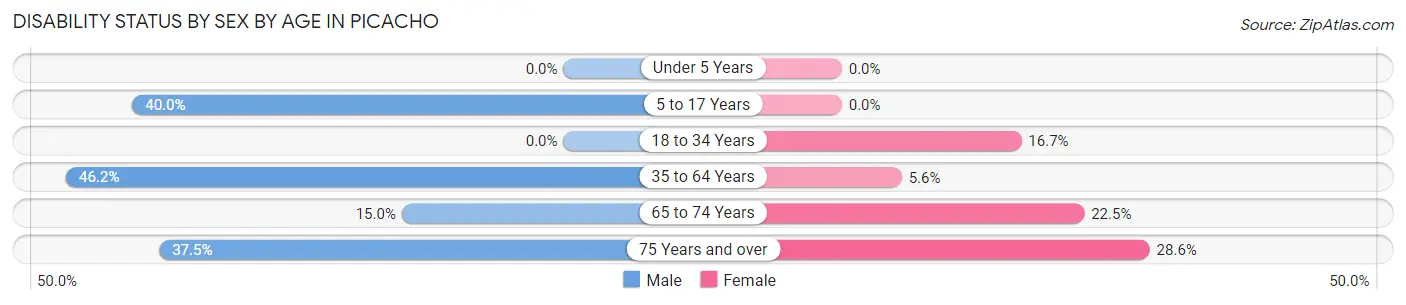
| Age Bracket | Male | Female |
| Under 5 Years | 0 (0.0%) | 0 (0.0%) |
| 5 to 17 Years | 4 (40.0%) | 0 (0.0%) |
| 18 to 34 Years | 0 (0.0%) | 4 (16.7%) |
| 35 to 64 Years | 30 (46.2%) | 4 (5.6%) |
| 65 to 74 Years | 3 (15.0%) | 9 (22.5%) |
| 75 Years and over | 9 (37.5%) | 2 (28.6%) |
Disability Class by Sex by Age in Picacho
Disability Class: Hearing Difficulty
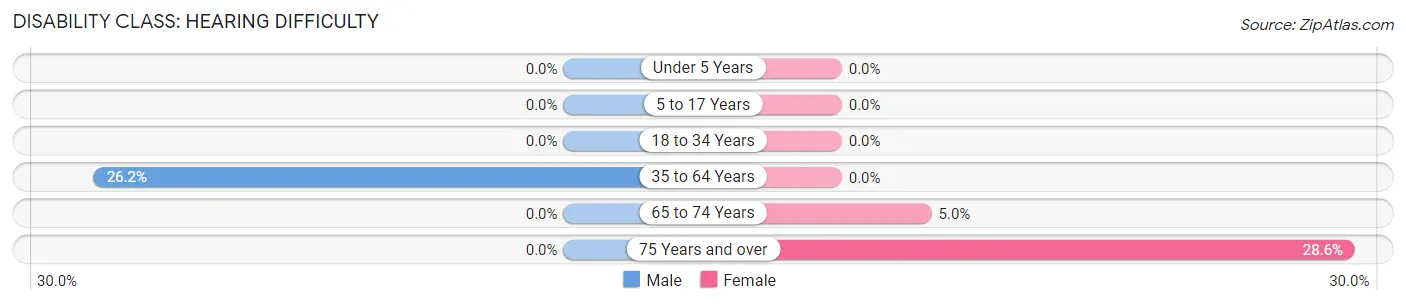
| Age Bracket | Male | Female |
| Under 5 Years | 0 (0.0%) | 0 (0.0%) |
| 5 to 17 Years | 0 (0.0%) | 0 (0.0%) |
| 18 to 34 Years | 0 (0.0%) | 0 (0.0%) |
| 35 to 64 Years | 17 (26.2%) | 0 (0.0%) |
| 65 to 74 Years | 0 (0.0%) | 2 (5.0%) |
| 75 Years and over | 0 (0.0%) | 2 (28.6%) |
Disability Class: Vision Difficulty
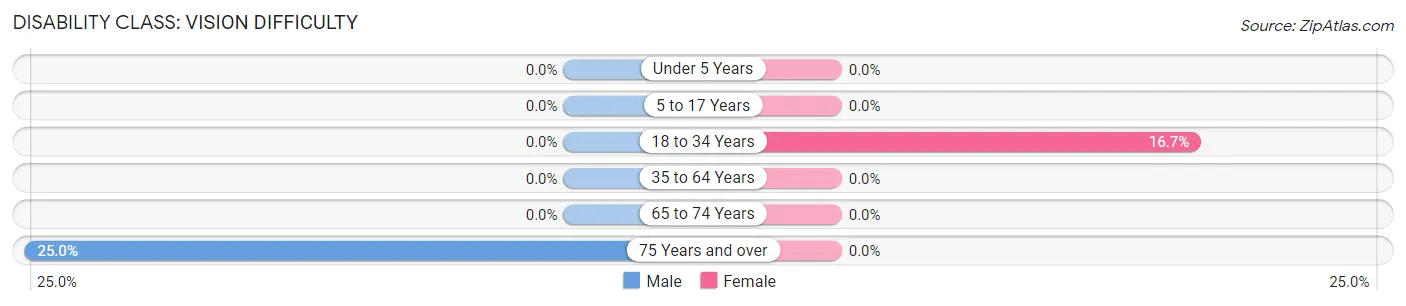
| Age Bracket | Male | Female |
| Under 5 Years | 0 (0.0%) | 0 (0.0%) |
| 5 to 17 Years | 0 (0.0%) | 0 (0.0%) |
| 18 to 34 Years | 0 (0.0%) | 4 (16.7%) |
| 35 to 64 Years | 0 (0.0%) | 0 (0.0%) |
| 65 to 74 Years | 0 (0.0%) | 0 (0.0%) |
| 75 Years and over | 6 (25.0%) | 0 (0.0%) |
Disability Class: Cognitive Difficulty
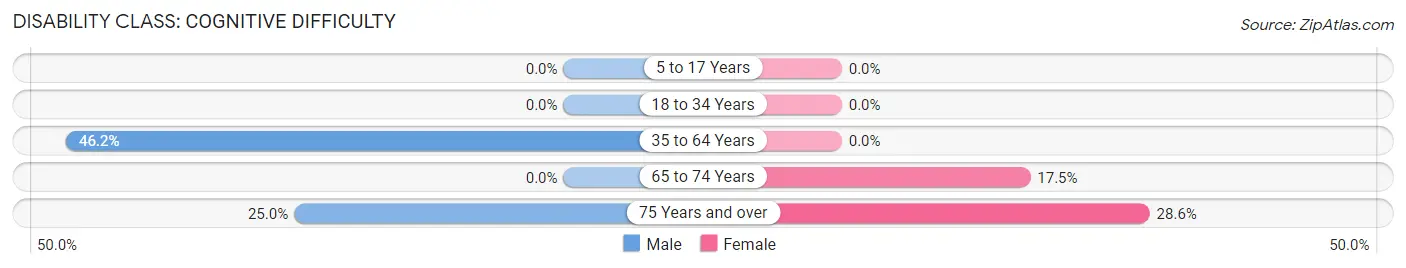
| Age Bracket | Male | Female |
| 5 to 17 Years | 0 (0.0%) | 0 (0.0%) |
| 18 to 34 Years | 0 (0.0%) | 0 (0.0%) |
| 35 to 64 Years | 30 (46.2%) | 0 (0.0%) |
| 65 to 74 Years | 0 (0.0%) | 7 (17.5%) |
| 75 Years and over | 6 (25.0%) | 2 (28.6%) |
Disability Class: Ambulatory Difficulty
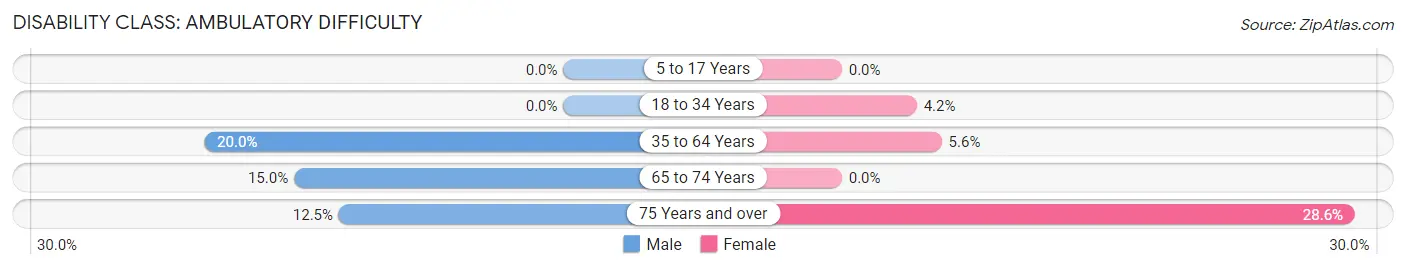
| Age Bracket | Male | Female |
| 5 to 17 Years | 0 (0.0%) | 0 (0.0%) |
| 18 to 34 Years | 0 (0.0%) | 1 (4.2%) |
| 35 to 64 Years | 13 (20.0%) | 4 (5.6%) |
| 65 to 74 Years | 3 (15.0%) | 0 (0.0%) |
| 75 Years and over | 3 (12.5%) | 2 (28.6%) |
Disability Class: Self-Care Difficulty
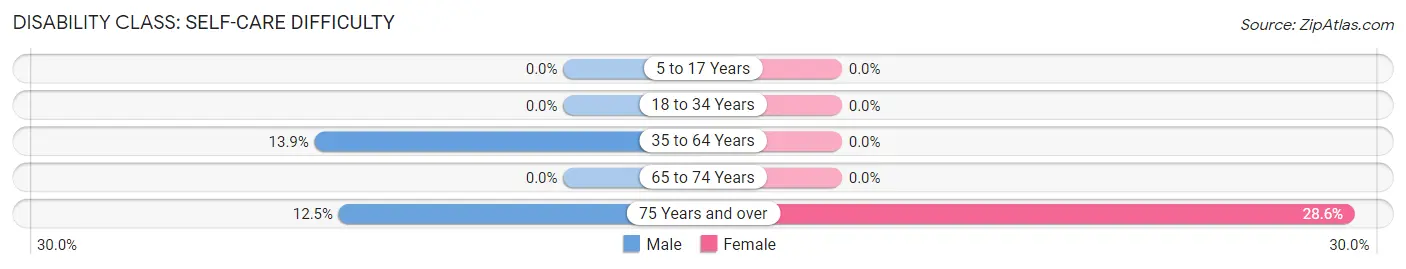
| Age Bracket | Male | Female |
| 5 to 17 Years | 0 (0.0%) | 0 (0.0%) |
| 18 to 34 Years | 0 (0.0%) | 0 (0.0%) |
| 35 to 64 Years | 9 (13.9%) | 0 (0.0%) |
| 65 to 74 Years | 0 (0.0%) | 0 (0.0%) |
| 75 Years and over | 3 (12.5%) | 2 (28.6%) |
Technology Access in Picacho
Computing Device Access in Picacho
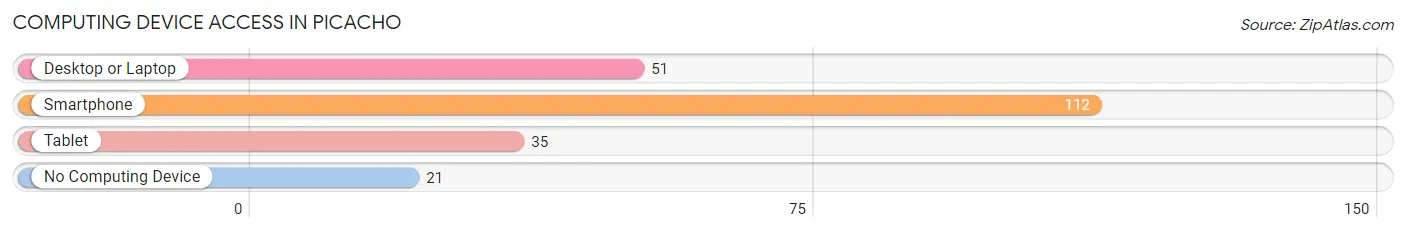
| Device Type | # Households | % Households |
| Desktop or Laptop | 51 | 38.4% |
| Smartphone | 112 | 84.2% |
| Tablet | 35 | 26.3% |
| No Computing Device | 21 | 15.8% |
| Total | 133 | 100.0% |
Internet Access in Picacho
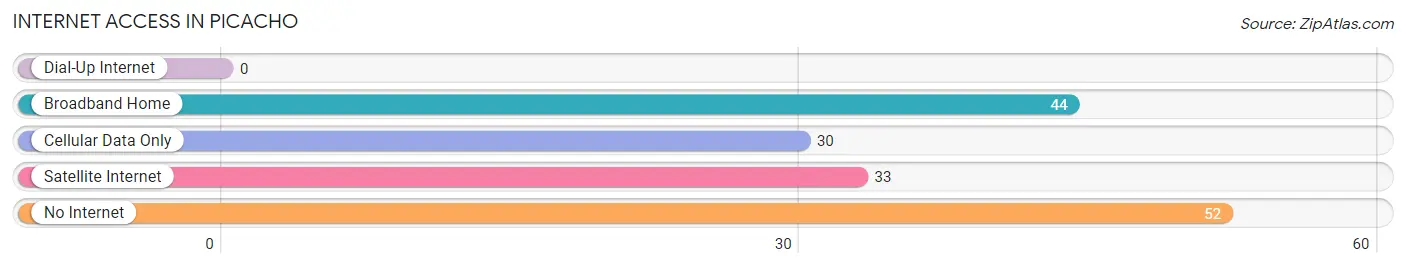
| Internet Type | # Households | % Households |
| Dial-Up Internet | 0 | 0.0% |
| Broadband Home | 44 | 33.1% |
| Cellular Data Only | 30 | 22.6% |
| Satellite Internet | 33 | 24.8% |
| No Internet | 52 | 39.1% |
| Total | 133 | 100.0% |
Picacho Summary
Picacho, Arizona is a small unincorporated community located in Pinal County, Arizona. It is situated along Interstate 10, approximately halfway between Phoenix and Tucson. The town is located in the Sonoran Desert and is surrounded by the Picacho Mountains. The population of Picacho was estimated to be around 1,000 in 2020.
History
Picacho was first settled in the late 1800s by ranchers and farmers. The town was originally known as Picacho Station, as it was a stop on the Southern Pacific Railroad. The town was officially established in 1881 and was named after the nearby Picacho Mountains.
In the early 1900s, Picacho was a thriving agricultural community. The town was home to several cotton gins, a flour mill, and a creamery. The town also had a post office, a school, and a hotel.
In the 1950s, the town began to decline as the railroad stopped running and the agricultural industry shifted away from the area. The town was nearly abandoned by the 1970s.
Geography
Picacho is located in the Sonoran Desert, at an elevation of 1,845 feet. The town is surrounded by the Picacho Mountains, which are part of the Sonoran Desert. The town is located along Interstate 10, approximately halfway between Phoenix and Tucson.
The climate in Picacho is hot and dry, with temperatures ranging from the mid-90s in the summer to the mid-50s in the winter. The town receives an average of 8 inches of rain per year.
Economy
Picacho is a small, rural community with a limited economy. The town is home to several small businesses, including a gas station, a convenience store, and a restaurant. The town also has a few small farms and ranches.
The town is also home to a few tourist attractions, including the Picacho Peak State Park and the Picacho Peak Recreation Area. The town is also home to the Picacho Peak Speedway, which hosts several racing events throughout the year.
Demographics
The population of Picacho was estimated to be around 1,000 in 2020. The town is predominantly white, with a small Hispanic population. The median household income in Picacho is $37,000, and the median home value is $125,000.
Conclusion
Picacho, Arizona is a small unincorporated community located in Pinal County, Arizona. It is situated along Interstate 10, approximately halfway between Phoenix and Tucson. The town is located in the Sonoran Desert and is surrounded by the Picacho Mountains. The population of Picacho was estimated to be around 1,000 in 2020. The town is predominantly white, with a small Hispanic population. The economy of Picacho is limited, with a few small businesses, farms, and ranches. The town is also home to several tourist attractions, including the Picacho Peak State Park and the Picacho Peak Recreation Area.
Common Questions
What is Per Capita Income in Picacho?
Per Capita income in Picacho is $28,812.
What is the Median Household income in Picacho?
Median Household Income in Picacho is $52,813.
What is Inequality or Gini Index in Picacho?
Inequality or Gini Index in Picacho is 0.38.
What is the Total Population of Picacho?
Total Population of Picacho is 289.
What is the Total Male Population of Picacho?
Total Male Population of Picacho is 135.
What is the Total Female Population of Picacho?
Total Female Population of Picacho is 154.
What is the Ratio of Males per 100 Females in Picacho?
There are 87.66 Males per 100 Females in Picacho.
What is the Ratio of Females per 100 Males in Picacho?
There are 114.07 Females per 100 Males in Picacho.
What is the Median Population Age in Picacho?
Median Population Age in Picacho is 61.2 Years.
What is the Average Family Size in Picacho
Average Family Size in Picacho is 2.4 People.
What is the Average Household Size in Picacho
Average Household Size in Picacho is 2.1 People.
How Large is the Labor Force in Picacho?
There are 123 People in the Labor Forcein in Picacho.
What is the Percentage of People in the Labor Force in Picacho?
46.6% of People are in the Labor Force in Picacho.
What is the Unemployment Rate in Picacho?
Unemployment Rate in Picacho is 17.1%.