Zip Codes with the Highest Percentage of Population Employed in Professional & Scientific Services in Phoenix, AZ
RELATED REPORTS & OPTIONS
Professional & Scientific Services
Phoenix
Compare Zip Codes
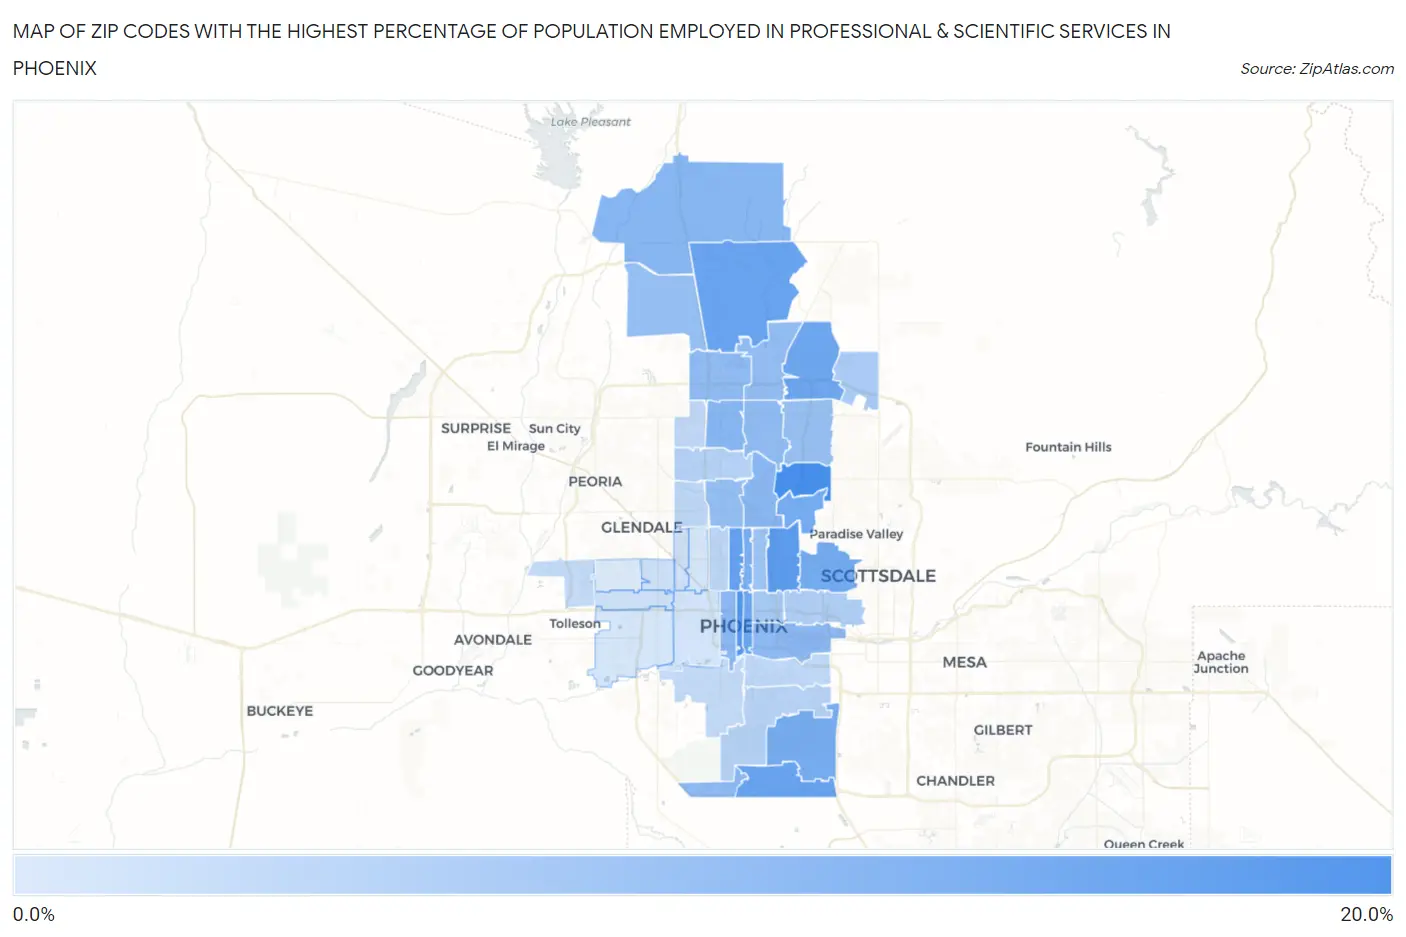
Map of Zip Codes with the Highest Percentage of Population Employed in Professional & Scientific Services in Phoenix
2.1%
16.5%
Zip Codes with the Highest Percentage of Population Employed in Professional & Scientific Services in Phoenix, AZ
| Zip Code | % Employed | vs State | vs National | |
| 1. | 85028 | 16.5% | 7.0%(+9.53)#7 | 7.8%(+8.69)#1,475 |
| 2. | 85003 | 15.2% | 7.0%(+8.14)#14 | 7.8%(+7.31)#1,845 |
| 3. | 85016 | 14.3% | 7.0%(+7.30)#16 | 7.8%(+6.47)#2,150 |
| 4. | 85013 | 13.5% | 7.0%(+6.47)#17 | 7.8%(+5.64)#2,496 |
| 5. | 85085 | 13.1% | 7.0%(+6.11)#19 | 7.8%(+5.28)#2,654 |
| 6. | 85048 | 13.1% | 7.0%(+6.11)#20 | 7.8%(+5.28)#2,656 |
| 7. | 85004 | 12.8% | 7.0%(+5.83)#22 | 7.8%(+4.99)#2,773 |
| 8. | 85050 | 12.6% | 7.0%(+5.56)#25 | 7.8%(+4.73)#2,902 |
| 9. | 85018 | 12.0% | 7.0%(+4.97)#29 | 7.8%(+4.14)#3,218 |
| 10. | 85044 | 11.7% | 7.0%(+4.67)#30 | 7.8%(+3.84)#3,390 |
| 11. | 85012 | 11.1% | 7.0%(+4.12)#40 | 7.8%(+3.29)#3,732 |
| 12. | 85086 | 10.1% | 7.0%(+3.11)#54 | 7.8%(+2.28)#4,486 |
| 13. | 85023 | 10.0% | 7.0%(+3.03)#55 | 7.8%(+2.20)#4,535 |
| 14. | 85020 | 9.8% | 7.0%(+2.79)#60 | 7.8%(+1.96)#4,741 |
| 15. | 85007 | 9.6% | 7.0%(+2.63)#64 | 7.8%(+1.80)#4,889 |
| 16. | 85034 | 9.4% | 7.0%(+2.42)#67 | 7.8%(+1.59)#5,057 |
| 17. | 85045 | 9.4% | 7.0%(+2.35)#71 | 7.8%(+1.52)#5,131 |
| 18. | 85027 | 9.2% | 7.0%(+2.19)#73 | 7.8%(+1.36)#5,286 |
| 19. | 85022 | 9.1% | 7.0%(+2.07)#76 | 7.8%(+1.24)#5,434 |
| 20. | 85024 | 8.8% | 7.0%(+1.83)#81 | 7.8%(+1.00)#5,656 |
| 21. | 85083 | 8.8% | 7.0%(+1.80)#82 | 7.8%(+0.966)#5,688 |
| 22. | 85021 | 8.6% | 7.0%(+1.63)#85 | 7.8%(+0.794)#5,878 |
| 23. | 85032 | 8.5% | 7.0%(+1.53)#86 | 7.8%(+0.697)#5,978 |
| 24. | 85014 | 7.7% | 7.0%(+0.729)#100 | 7.8%(-0.102)#6,997 |
| 25. | 85006 | 7.1% | 7.0%(+0.051)#121 | 7.8%(-0.780)#8,056 |
| 26. | 85054 | 6.7% | 7.0%(-0.356)#129 | 7.8%(-1.19)#8,739 |
| 27. | 85008 | 6.4% | 7.0%(-0.630)#138 | 7.8%(-1.46)#9,227 |
| 28. | 85029 | 5.7% | 7.0%(-1.36)#155 | 7.8%(-2.20)#10,704 |
| 29. | 85042 | 5.4% | 7.0%(-1.63)#163 | 7.8%(-2.46)#11,342 |
| 30. | 85015 | 5.0% | 7.0%(-2.06)#177 | 7.8%(-2.89)#12,427 |
| 31. | 85040 | 4.7% | 7.0%(-2.28)#185 | 7.8%(-3.11)#13,006 |
| 32. | 85051 | 4.7% | 7.0%(-2.31)#186 | 7.8%(-3.14)#13,089 |
| 33. | 85053 | 4.5% | 7.0%(-2.53)#193 | 7.8%(-3.36)#13,711 |
| 34. | 85037 | 4.4% | 7.0%(-2.63)#201 | 7.8%(-3.47)#14,010 |
| 35. | 85041 | 4.4% | 7.0%(-2.66)#203 | 7.8%(-3.50)#14,077 |
| 36. | 85035 | 3.4% | 7.0%(-3.63)#235 | 7.8%(-4.47)#17,128 |
| 37. | 85019 | 3.3% | 7.0%(-3.68)#239 | 7.8%(-4.52)#17,301 |
| 38. | 85031 | 3.2% | 7.0%(-3.79)#241 | 7.8%(-4.62)#17,631 |
| 39. | 85009 | 2.9% | 7.0%(-4.08)#249 | 7.8%(-4.91)#18,664 |
| 40. | 85043 | 2.7% | 7.0%(-4.30)#258 | 7.8%(-5.13)#19,441 |
| 41. | 85017 | 2.7% | 7.0%(-4.33)#260 | 7.8%(-5.16)#19,550 |
| 42. | 85033 | 2.1% | 7.0%(-4.96)#274 | 7.8%(-5.79)#21,713 |
1
Common Questions
What are the Top 10 Zip Codes with the Highest Percentage of Population Employed in Professional & Scientific Services in Phoenix, AZ?
Top 10 Zip Codes with the Highest Percentage of Population Employed in Professional & Scientific Services in Phoenix, AZ are:
What zip code has the Highest Percentage of Population Employed in Professional & Scientific Services in Phoenix, AZ?
85028 has the Highest Percentage of Population Employed in Professional & Scientific Services in Phoenix, AZ with 16.5%.
What is the Percentage of Population Employed in Professional & Scientific Services in Phoenix, AZ?
Percentage of Population Employed in Professional & Scientific Services in Phoenix is 7.7%.
What is the Percentage of Population Employed in Professional & Scientific Services in Arizona?
Percentage of Population Employed in Professional & Scientific Services in Arizona is 7.0%.
What is the Percentage of Population Employed in Professional & Scientific Services in the United States?
Percentage of Population Employed in Professional & Scientific Services in the United States is 7.8%.