Zip Codes with the Highest Percentage of Households Heated by Bottled Gas / Liquid Propane in Phoenix, AZ
RELATED REPORTS & OPTIONS
Bottled Gas / LP Heating
Phoenix
Compare Zip Codes
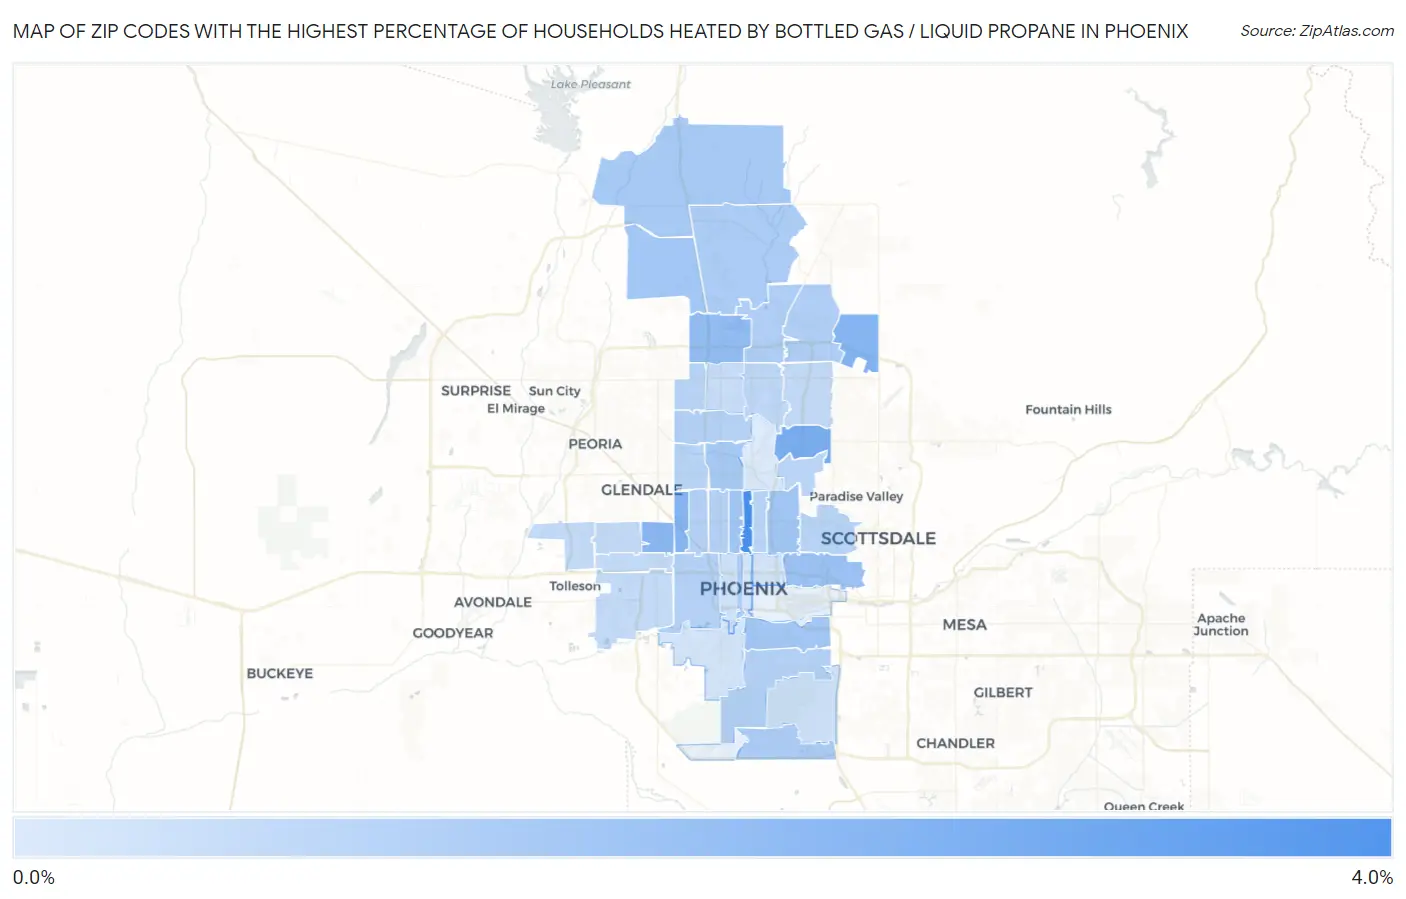
Map of Zip Codes with the Highest Percentage of Households Heated by Bottled Gas / Liquid Propane in Phoenix
0.0%
4.0%
Zip Codes with the Highest Percentage of Households Heated by Bottled Gas / Liquid Propane in Phoenix, AZ
| Zip Code | Bottled Gas / LP Heating | vs State | vs National | |
| 1. | 85012 | 3.2% | 2.8%(+0.400)#186 | 4.9%(-1.70)#20,741 |
| 2. | 85028 | 2.1% | 2.8%(-0.700)#216 | 4.9%(-2.80)#22,949 |
| 3. | 85019 | 1.9% | 2.8%(-0.900)#221 | 4.9%(-3.00)#23,471 |
| 4. | 85054 | 1.9% | 2.8%(-0.900)#223 | 4.9%(-3.00)#23,577 |
| 5. | 85031 | 1.8% | 2.8%(-1.000)#226 | 4.9%(-3.10)#23,732 |
| 6. | 85027 | 1.6% | 2.8%(-1.20)#232 | 4.9%(-3.30)#24,332 |
| 7. | 85008 | 1.4% | 2.8%(-1.40)#237 | 4.9%(-3.50)#24,972 |
| 8. | 85016 | 1.3% | 2.8%(-1.50)#245 | 4.9%(-3.60)#25,412 |
| 9. | 85040 | 1.3% | 2.8%(-1.50)#247 | 4.9%(-3.60)#25,425 |
| 10. | 85013 | 1.3% | 2.8%(-1.50)#248 | 4.9%(-3.60)#25,555 |
| 11. | 85083 | 1.3% | 2.8%(-1.50)#250 | 4.9%(-3.60)#25,562 |
| 12. | 85086 | 1.2% | 2.8%(-1.60)#259 | 4.9%(-3.70)#25,787 |
| 13. | 85021 | 1.2% | 2.8%(-1.60)#260 | 4.9%(-3.70)#25,797 |
| 14. | 85048 | 1.1% | 2.8%(-1.70)#273 | 4.9%(-3.80)#26,226 |
| 15. | 85085 | 1.1% | 2.8%(-1.70)#274 | 4.9%(-3.80)#26,271 |
| 16. | 85050 | 1.0% | 2.8%(-1.80)#279 | 4.9%(-3.90)#26,646 |
| 17. | 85024 | 1.0% | 2.8%(-1.80)#281 | 4.9%(-3.90)#26,712 |
| 18. | 85003 | 1.0% | 2.8%(-1.80)#283 | 4.9%(-3.90)#26,844 |
| 19. | 85009 | 0.90% | 2.8%(-1.90)#286 | 4.9%(-4.00)#26,960 |
| 20. | 85029 | 0.90% | 2.8%(-1.90)#287 | 4.9%(-4.00)#26,968 |
| 21. | 85042 | 0.90% | 2.8%(-1.90)#289 | 4.9%(-4.00)#26,983 |
| 22. | 85017 | 0.90% | 2.8%(-1.90)#290 | 4.9%(-4.00)#26,996 |
| 23. | 85015 | 0.90% | 2.8%(-1.90)#291 | 4.9%(-4.00)#27,003 |
| 24. | 85051 | 0.80% | 2.8%(-2.00)#301 | 4.9%(-4.10)#27,396 |
| 25. | 85018 | 0.80% | 2.8%(-2.00)#303 | 4.9%(-4.10)#27,423 |
| 26. | 85053 | 0.80% | 2.8%(-2.00)#307 | 4.9%(-4.10)#27,502 |
| 27. | 85014 | 0.80% | 2.8%(-2.00)#308 | 4.9%(-4.10)#27,521 |
| 28. | 85022 | 0.70% | 2.8%(-2.10)#312 | 4.9%(-4.20)#27,761 |
| 29. | 85032 | 0.60% | 2.8%(-2.20)#319 | 4.9%(-4.30)#28,100 |
| 30. | 85033 | 0.60% | 2.8%(-2.20)#320 | 4.9%(-4.30)#28,109 |
| 31. | 85035 | 0.60% | 2.8%(-2.20)#321 | 4.9%(-4.30)#28,117 |
| 32. | 85037 | 0.60% | 2.8%(-2.20)#322 | 4.9%(-4.30)#28,126 |
| 33. | 85043 | 0.60% | 2.8%(-2.20)#326 | 4.9%(-4.30)#28,172 |
| 34. | 85023 | 0.50% | 2.8%(-2.30)#337 | 4.9%(-4.40)#28,542 |
| 35. | 85044 | 0.40% | 2.8%(-2.40)#342 | 4.9%(-4.50)#28,853 |
| 36. | 85007 | 0.40% | 2.8%(-2.40)#346 | 4.9%(-4.50)#28,999 |
| 37. | 85041 | 0.30% | 2.8%(-2.50)#347 | 4.9%(-4.60)#29,090 |
| 38. | 85006 | 0.30% | 2.8%(-2.50)#351 | 4.9%(-4.60)#29,175 |
| 39. | 85004 | 0.30% | 2.8%(-2.50)#354 | 4.9%(-4.60)#29,265 |
| 40. | 85020 | 0.10% | 2.8%(-2.70)#362 | 4.9%(-4.80)#29,543 |
1
Common Questions
What are the Top 10 Zip Codes with the Highest Percentage of Households Heated by Bottled Gas / Liquid Propane in Phoenix, AZ?
Top 10 Zip Codes with the Highest Percentage of Households Heated by Bottled Gas / Liquid Propane in Phoenix, AZ are:
What zip code has the Highest Percentage of Households Heated by Bottled Gas / Liquid Propane in Phoenix, AZ?
85012 has the Highest Percentage of Households Heated by Bottled Gas / Liquid Propane in Phoenix, AZ with 3.2%.
What is the Percentage of Households Heated by Bottled Gas / Liquid Propane in Phoenix, AZ?
Percentage of Households Heated by Bottled Gas / Liquid Propane in Phoenix is 1.0%.
What is the Percentage of Households Heated by Bottled Gas / Liquid Propane in Arizona?
Percentage of Households Heated by Bottled Gas / Liquid Propane in Arizona is 2.8%.
What is the Percentage of Households Heated by Bottled Gas / Liquid Propane in the United States?
Percentage of Households Heated by Bottled Gas / Liquid Propane in the United States is 4.9%.