Zip Codes with the Highest Percentage of Population Employed in Farming, Fishing & Forestry in Phoenix, AZ
RELATED REPORTS & OPTIONS
Farming, Fishing & Forestry
Phoenix
Compare Zip Codes
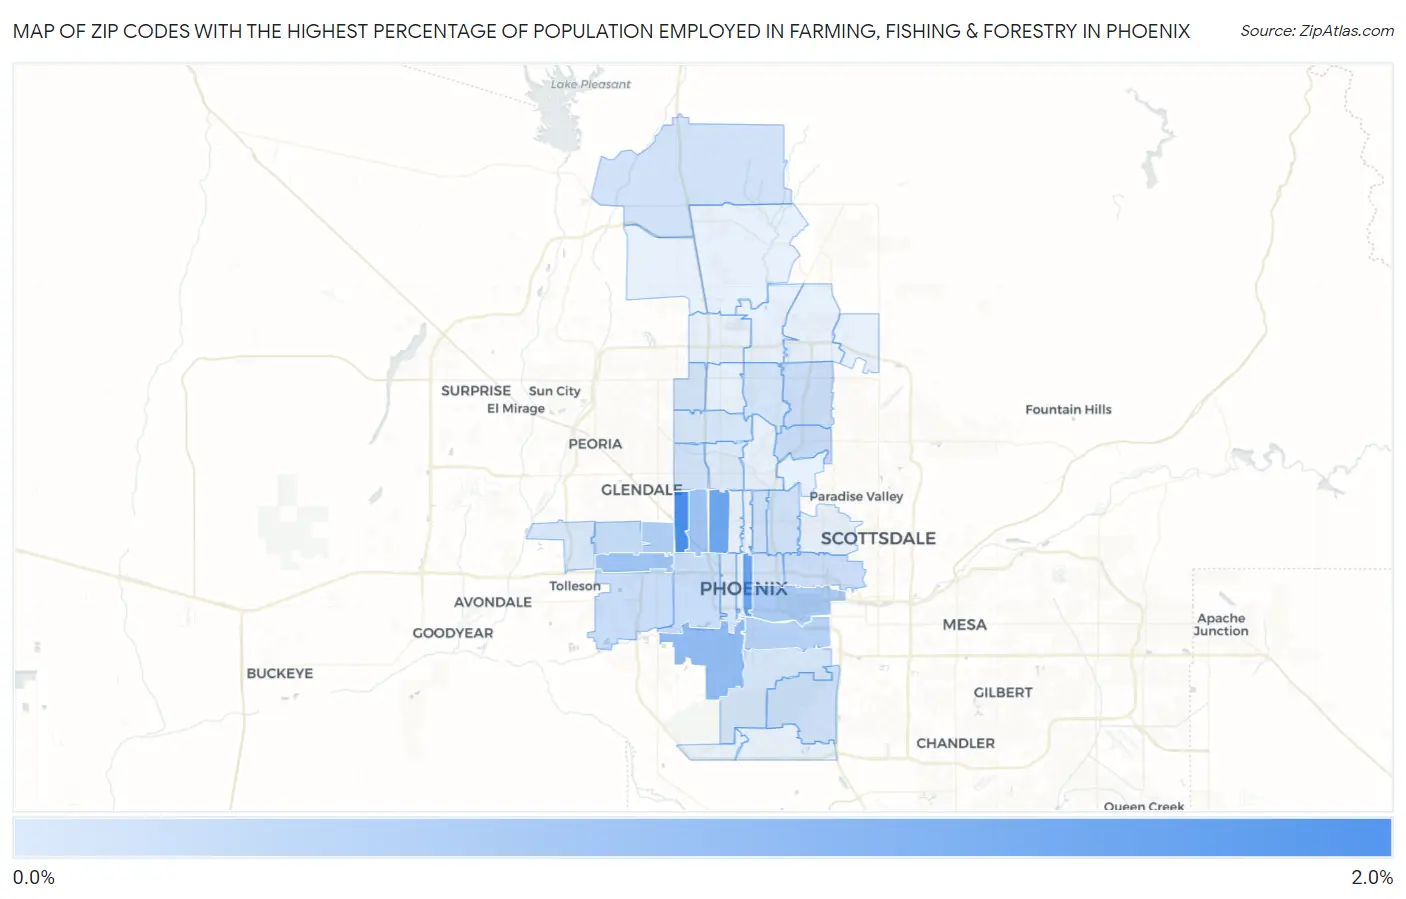
Map of Zip Codes with the Highest Percentage of Population Employed in Farming, Fishing & Forestry in Phoenix
0.0%
2.0%
Zip Codes with the Highest Percentage of Population Employed in Farming, Fishing & Forestry in Phoenix, AZ
| Zip Code | % Employed | vs State | vs National | |
| 1. | 85019 | 2.0% | 0.51%(+1.49)#48 | 0.61%(+1.39)#6,576 |
| 2. | 85004 | 1.5% | 0.51%(+1.02)#55 | 0.61%(+0.924)#7,801 |
| 3. | 85015 | 1.5% | 0.51%(+0.967)#56 | 0.61%(+0.869)#7,960 |
| 4. | 85041 | 1.0% | 0.51%(+0.499)#74 | 0.61%(+0.400)#9,719 |
| 5. | 85035 | 0.82% | 0.51%(+0.318)#81 | 0.61%(+0.219)#10,637 |
| 6. | 85017 | 0.79% | 0.51%(+0.283)#84 | 0.61%(+0.185)#10,841 |
| 7. | 85034 | 0.67% | 0.51%(+0.162)#91 | 0.61%(+0.063)#11,591 |
| 8. | 85031 | 0.59% | 0.51%(+0.087)#97 | 0.61%(-0.012)#12,078 |
| 9. | 85040 | 0.53% | 0.51%(+0.021)#106 | 0.61%(-0.077)#12,616 |
| 10. | 85033 | 0.30% | 0.51%(-0.203)#128 | 0.61%(-0.302)#14,781 |
| 11. | 85009 | 0.30% | 0.51%(-0.210)#131 | 0.61%(-0.309)#14,870 |
| 12. | 85043 | 0.28% | 0.51%(-0.230)#134 | 0.61%(-0.329)#15,105 |
| 13. | 85028 | 0.27% | 0.51%(-0.235)#135 | 0.61%(-0.333)#15,149 |
| 14. | 85008 | 0.26% | 0.51%(-0.243)#138 | 0.61%(-0.341)#15,231 |
| 15. | 85032 | 0.26% | 0.51%(-0.244)#142 | 0.61%(-0.343)#15,249 |
| 16. | 85044 | 0.22% | 0.51%(-0.282)#152 | 0.61%(-0.381)#15,774 |
| 17. | 85014 | 0.20% | 0.51%(-0.308)#159 | 0.61%(-0.407)#16,149 |
| 18. | 85016 | 0.18% | 0.51%(-0.325)#161 | 0.61%(-0.424)#16,395 |
| 19. | 85086 | 0.18% | 0.51%(-0.331)#163 | 0.61%(-0.429)#16,486 |
| 20. | 85006 | 0.17% | 0.51%(-0.336)#164 | 0.61%(-0.435)#16,570 |
| 21. | 85051 | 0.16% | 0.51%(-0.342)#167 | 0.61%(-0.441)#16,663 |
| 22. | 85053 | 0.16% | 0.51%(-0.351)#169 | 0.61%(-0.450)#16,816 |
| 23. | 85022 | 0.12% | 0.51%(-0.384)#178 | 0.61%(-0.482)#17,379 |
| 24. | 85042 | 0.11% | 0.51%(-0.394)#180 | 0.61%(-0.493)#17,544 |
| 25. | 85029 | 0.091% | 0.51%(-0.416)#184 | 0.61%(-0.515)#17,910 |
| 26. | 85037 | 0.079% | 0.51%(-0.428)#193 | 0.61%(-0.527)#18,143 |
| 27. | 85007 | 0.079% | 0.51%(-0.428)#194 | 0.61%(-0.527)#18,149 |
| 28. | 85021 | 0.011% | 0.51%(-0.496)#208 | 0.61%(-0.595)#19,160 |
1
Common Questions
What are the Top 10 Zip Codes with the Highest Percentage of Population Employed in Farming, Fishing & Forestry in Phoenix, AZ?
Top 10 Zip Codes with the Highest Percentage of Population Employed in Farming, Fishing & Forestry in Phoenix, AZ are:
What zip code has the Highest Percentage of Population Employed in Farming, Fishing & Forestry in Phoenix, AZ?
85019 has the Highest Percentage of Population Employed in Farming, Fishing & Forestry in Phoenix, AZ with 2.0%.
What is the Percentage of Population Employed in Farming, Fishing & Forestry in Phoenix, AZ?
Percentage of Population Employed in Farming, Fishing & Forestry in Phoenix is 0.30%.
What is the Percentage of Population Employed in Farming, Fishing & Forestry in Arizona?
Percentage of Population Employed in Farming, Fishing & Forestry in Arizona is 0.51%.
What is the Percentage of Population Employed in Farming, Fishing & Forestry in the United States?
Percentage of Population Employed in Farming, Fishing & Forestry in the United States is 0.61%.