Oracle, AZ Map & Demographics
Oracle Map

Oracle Overview
$52,145
PER CAPITA INCOME
$70,273
AVG FAMILY INCOME
$64,247
AVG HOUSEHOLD INCOME
0.60
INEQUALITY / GINI INDEX
3,146
TOTAL POPULATION
1,608
MALE POPULATION
1,538
FEMALE POPULATION
104.55
MALES / 100 FEMALES
95.65
FEMALES / 100 MALES
51.2
MEDIAN AGE
2.9
AVG FAMILY SIZE
2.2
AVG HOUSEHOLD SIZE
1,395
LABOR FORCE [ PEOPLE ]
53.5%
PERCENT IN LABOR FORCE
1.7%
UNEMPLOYMENT RATE
Oracle Zip Codes
Oracle Area Codes
Income in Oracle
Income Overview in Oracle
Per Capita Income in Oracle is $52,145, while median incomes of families and households are $70,273 and $64,247 respectively.
| Characteristic | Number | Measure |
| Per Capita Income | 3,146 | $52,145 |
| Median Family Income | 839 | $70,273 |
| Mean Family Income | 839 | $86,278 |
| Median Household Income | 1,410 | $64,247 |
| Mean Household Income | 1,410 | $113,220 |
| Income Deficit | 839 | $0 |
| Wage / Income Gap (%) | 3,146 | 0.00% |
| Wage / Income Gap ($) | 3,146 | 100.00¢ per $1 |
| Gini / Inequality Index | 3,146 | 0.60 |
Earnings by Sex in Oracle
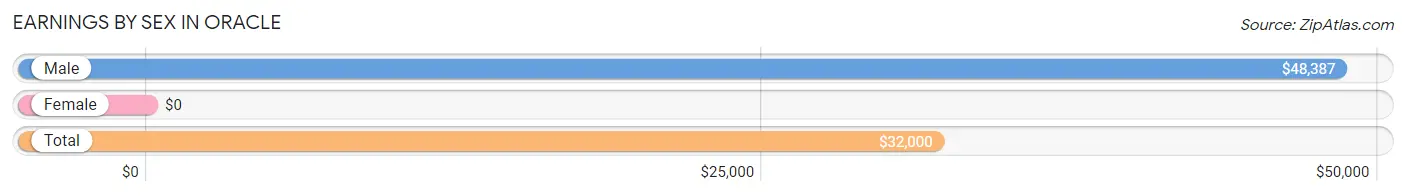
| Sex | Number | Average Earnings |
| Male | 757 (53.5%) | $48,387 |
| Female | 657 (46.5%) | $0 |
| Total | 1,414 (100.0%) | $32,000 |
Earnings by Sex by Income Bracket in Oracle
The most common earnings brackets in Oracle are $45,000 to $49,999 for men (124 | 16.4%) and $15,000 to $17,499 for women (201 | 30.6%).
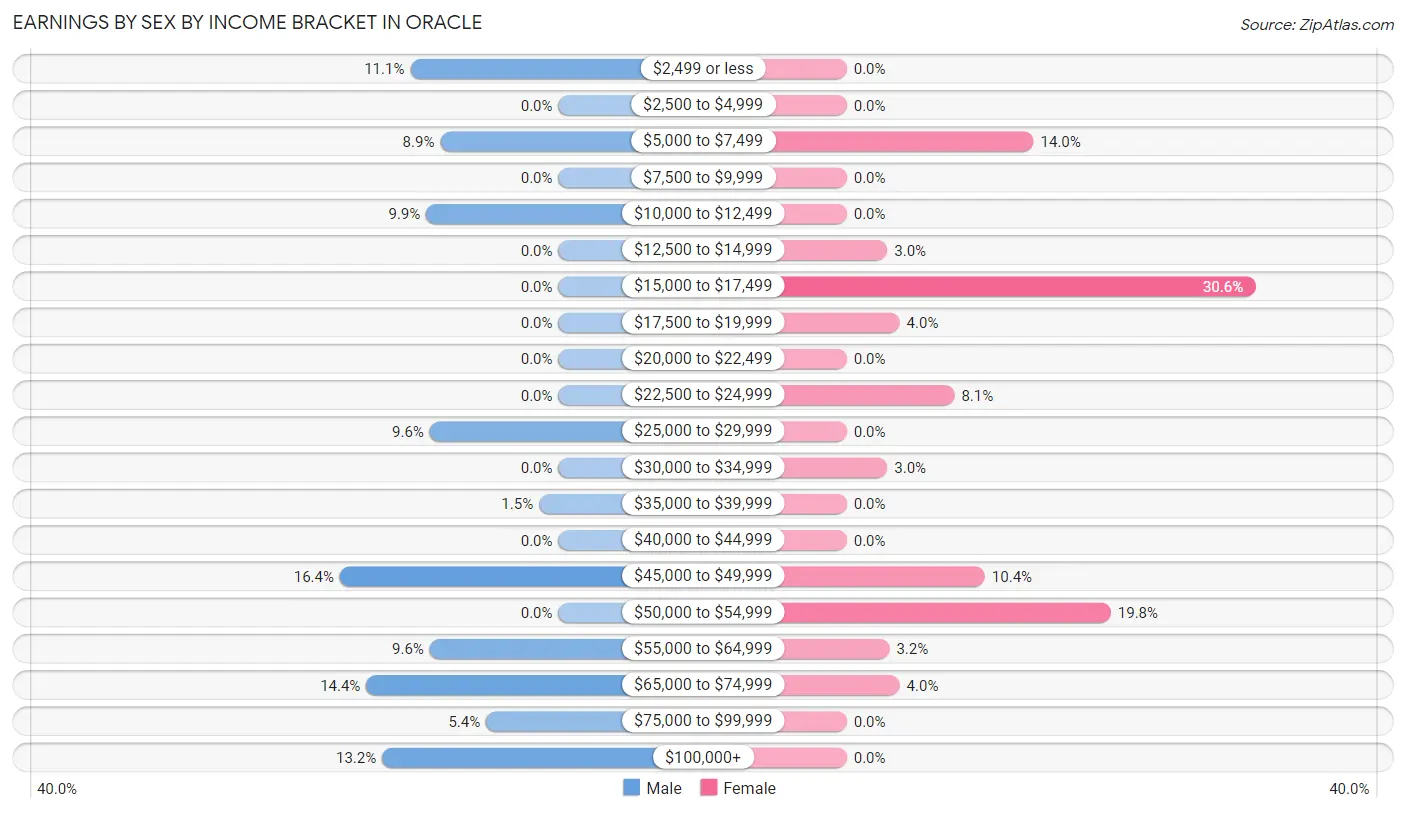
| Income | Male | Female |
| $2,499 or less | 84 (11.1%) | 0 (0.0%) |
| $2,500 to $4,999 | 0 (0.0%) | 0 (0.0%) |
| $5,000 to $7,499 | 67 (8.8%) | 92 (14.0%) |
| $7,500 to $9,999 | 0 (0.0%) | 0 (0.0%) |
| $10,000 to $12,499 | 75 (9.9%) | 0 (0.0%) |
| $12,500 to $14,999 | 0 (0.0%) | 20 (3.0%) |
| $15,000 to $17,499 | 0 (0.0%) | 201 (30.6%) |
| $17,500 to $19,999 | 0 (0.0%) | 26 (4.0%) |
| $20,000 to $22,499 | 0 (0.0%) | 0 (0.0%) |
| $22,500 to $24,999 | 0 (0.0%) | 53 (8.1%) |
| $25,000 to $29,999 | 73 (9.6%) | 0 (0.0%) |
| $30,000 to $34,999 | 0 (0.0%) | 20 (3.0%) |
| $35,000 to $39,999 | 11 (1.5%) | 0 (0.0%) |
| $40,000 to $44,999 | 0 (0.0%) | 0 (0.0%) |
| $45,000 to $49,999 | 124 (16.4%) | 68 (10.3%) |
| $50,000 to $54,999 | 0 (0.0%) | 130 (19.8%) |
| $55,000 to $64,999 | 73 (9.6%) | 21 (3.2%) |
| $65,000 to $74,999 | 109 (14.4%) | 26 (4.0%) |
| $75,000 to $99,999 | 41 (5.4%) | 0 (0.0%) |
| $100,000+ | 100 (13.2%) | 0 (0.0%) |
| Total | 757 (100.0%) | 657 (100.0%) |
Earnings by Sex by Educational Attainment in Oracle
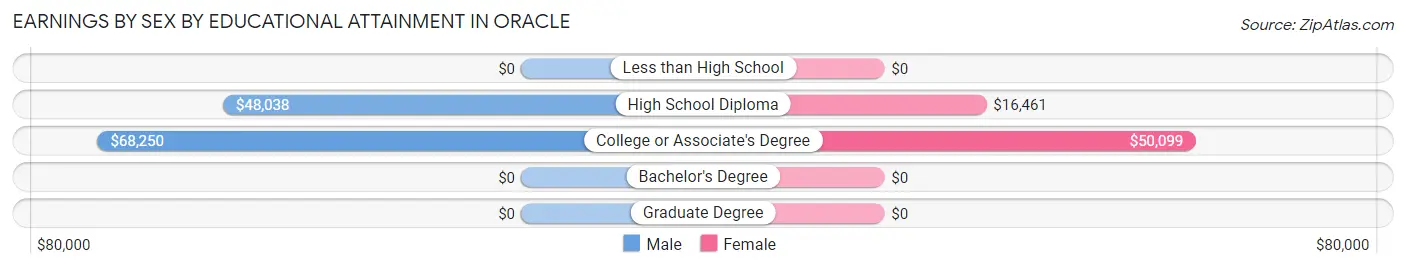
| Educational Attainment | Male Income | Female Income |
| Less than High School | - | - |
| High School Diploma | $48,038 | $16,461 |
| College or Associate's Degree | $68,250 | $50,099 |
| Bachelor's Degree | - | - |
| Graduate Degree | - | - |
| Total | $48,939 | $0 |
Family Income in Oracle
Family Income Brackets in Oracle
According to the Oracle family income data, there are 322 families falling into the $50,000 to $74,999 income range, which is the most common income bracket and makes up 38.4% of all families.
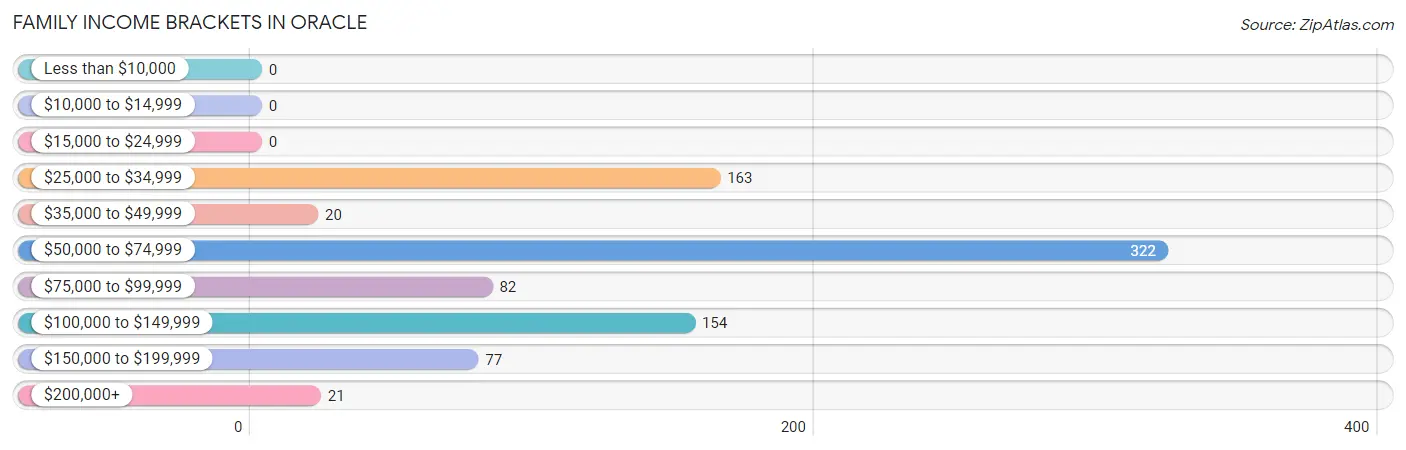
| Income Bracket | # Families | % Families |
| Less than $10,000 | 0 | 0.0% |
| $10,000 to $14,999 | 0 | 0.0% |
| $15,000 to $24,999 | 0 | 0.0% |
| $25,000 to $34,999 | 163 | 19.4% |
| $35,000 to $49,999 | 20 | 2.4% |
| $50,000 to $74,999 | 322 | 38.4% |
| $75,000 to $99,999 | 82 | 9.8% |
| $100,000 to $149,999 | 154 | 18.4% |
| $150,000 to $199,999 | 77 | 9.2% |
| $200,000+ | 21 | 2.5% |
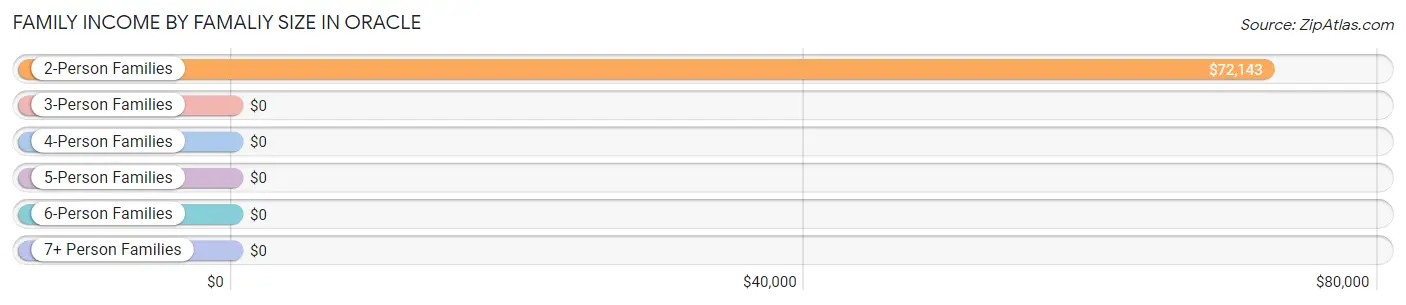
Family Income by Famaliy Size in Oracle
2-person families (478 | 57.0%) account for the highest median family income in Oracle with $72,143 per family, while 2-person families (478 | 57.0%) have the highest median income of $36,072 per family member.
| Income Bracket | # Families | Median Income |
| 2-Person Families | 478 (57.0%) | $72,143 |
| 3-Person Families | 206 (24.5%) | $0 |
| 4-Person Families | 21 (2.5%) | $0 |
| 5-Person Families | 69 (8.2%) | $0 |
| 6-Person Families | 47 (5.6%) | $0 |
| 7+ Person Families | 18 (2.1%) | $0 |
| Total | 839 (100.0%) | $70,273 |
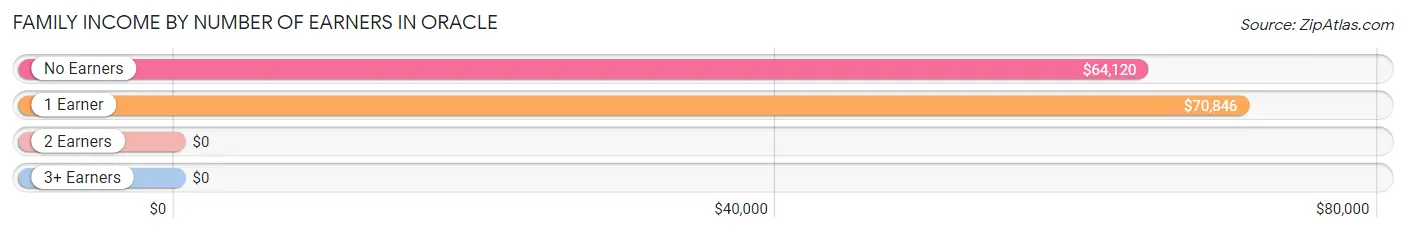
Family Income by Number of Earners in Oracle
| Number of Earners | # Families | Median Income |
| No Earners | 164 (19.6%) | $64,120 |
| 1 Earner | 247 (29.4%) | $70,846 |
| 2 Earners | 428 (51.0%) | $0 |
| 3+ Earners | 0 (0.0%) | $0 |
| Total | 839 (100.0%) | $70,273 |
Household Income in Oracle
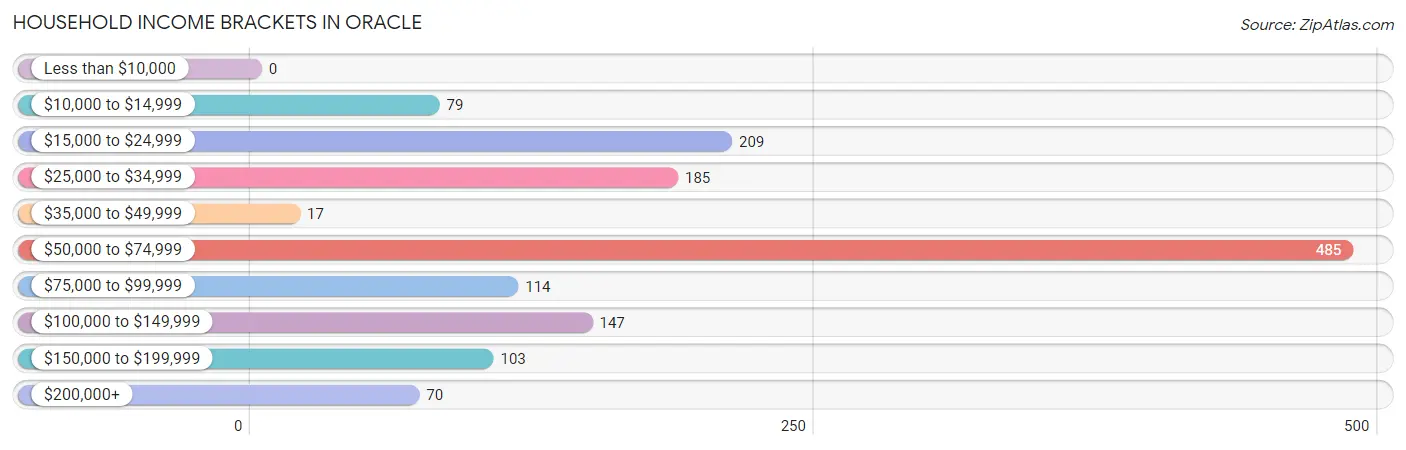
Household Income Brackets in Oracle
With 485 households falling in the category, the $50,000 to $74,999 income range is the most frequent in Oracle, accounting for 34.4% of all households.
| Income Bracket | # Households | % Households |
| Less than $10,000 | 0 | 0.0% |
| $10,000 to $14,999 | 79 | 5.6% |
| $15,000 to $24,999 | 209 | 14.8% |
| $25,000 to $34,999 | 185 | 13.1% |
| $35,000 to $49,999 | 17 | 1.2% |
| $50,000 to $74,999 | 485 | 34.4% |
| $75,000 to $99,999 | 114 | 8.1% |
| $100,000 to $149,999 | 147 | 10.4% |
| $150,000 to $199,999 | 103 | 7.3% |
| $200,000+ | 70 | 5.0% |
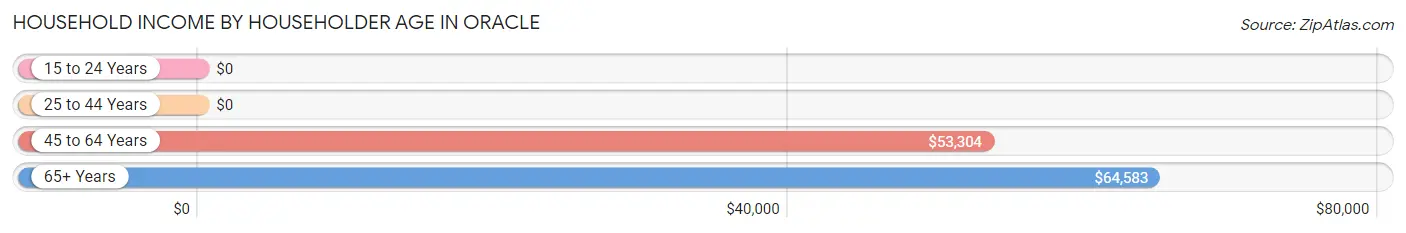
Household Income by Householder Age in Oracle
The median household income in Oracle is $64,247, with the highest median household income of $64,583 found in the 65+ years age bracket for the primary householder. A total of 794 households (56.3%) fall into this category. Meanwhile, the 15 to 24 years age bracket for the primary householder has the lowest median household income of $0, with 20 households (1.4%) in this group.
| Income Bracket | # Households | Median Income |
| 15 to 24 Years | 20 (1.4%) | $0 |
| 25 to 44 Years | 193 (13.7%) | $0 |
| 45 to 64 Years | 403 (28.6%) | $53,304 |
| 65+ Years | 794 (56.3%) | $64,583 |
| Total | 1,410 (100.0%) | $64,247 |
Poverty in Oracle
Income Below Poverty by Sex and Age in Oracle
With 9.4% poverty level for males and 7.6% for females among the residents of Oracle, 16 and 17 year old males and 6 to 11 year old females are the most vulnerable to poverty, with 18 males (100.0%) and 37 females (45.7%) in their respective age groups living below the poverty level.
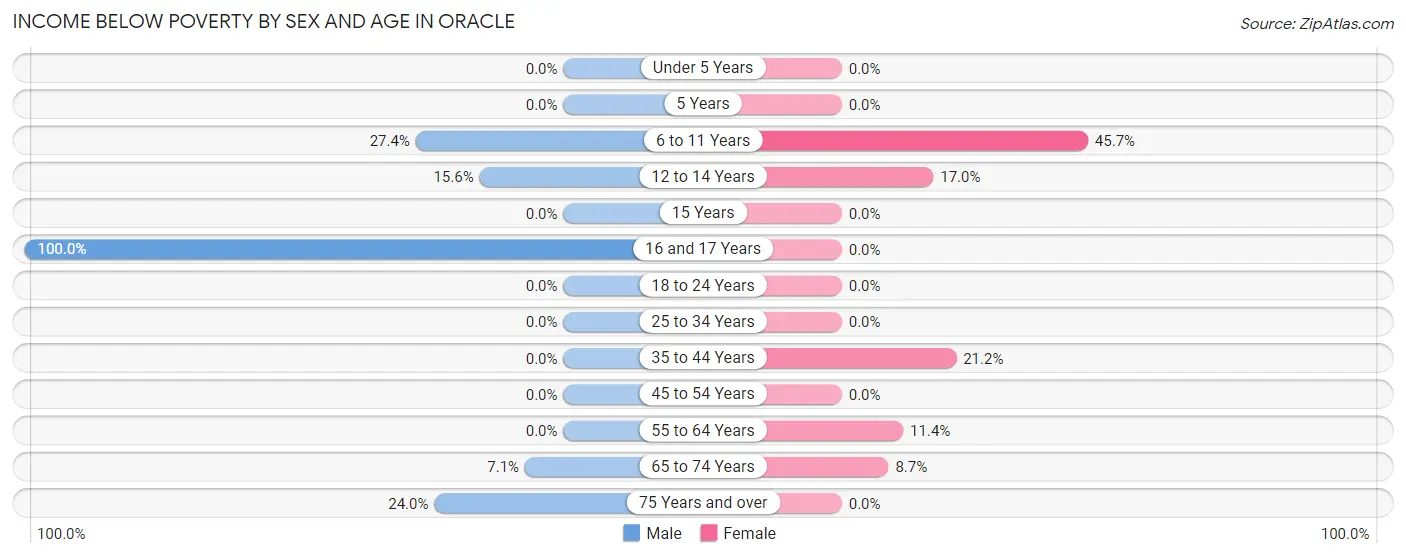
| Age Bracket | Male | Female |
| Under 5 Years | 0 (0.0%) | 0 (0.0%) |
| 5 Years | 0 (0.0%) | 0 (0.0%) |
| 6 to 11 Years | 37 (27.4%) | 37 (45.7%) |
| 12 to 14 Years | 19 (15.6%) | 18 (17.0%) |
| 15 Years | 0 (0.0%) | 0 (0.0%) |
| 16 and 17 Years | 18 (100.0%) | 0 (0.0%) |
| 18 to 24 Years | 0 (0.0%) | 0 (0.0%) |
| 25 to 34 Years | 0 (0.0%) | 0 (0.0%) |
| 35 to 44 Years | 0 (0.0%) | 24 (21.2%) |
| 45 to 54 Years | 0 (0.0%) | 0 (0.0%) |
| 55 to 64 Years | 0 (0.0%) | 18 (11.4%) |
| 65 to 74 Years | 31 (7.1%) | 20 (8.7%) |
| 75 Years and over | 46 (24.0%) | 0 (0.0%) |
| Total | 151 (9.4%) | 117 (7.6%) |
Income Above Poverty by Sex and Age in Oracle
According to the poverty statistics in Oracle, males aged 18 to 24 years and females aged under 5 years are the age groups that are most secure financially, with 100.0% of males and 100.0% of females in these age groups living above the poverty line.
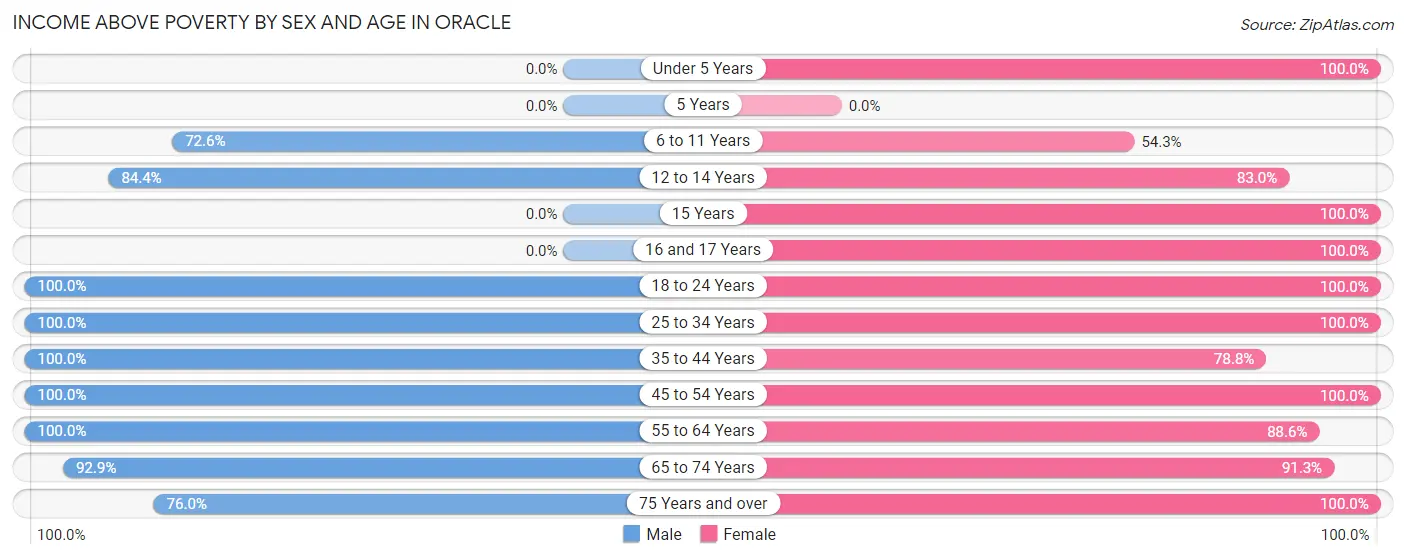
| Age Bracket | Male | Female |
| Under 5 Years | 0 (0.0%) | 46 (100.0%) |
| 5 Years | 0 (0.0%) | 0 (0.0%) |
| 6 to 11 Years | 98 (72.6%) | 44 (54.3%) |
| 12 to 14 Years | 103 (84.4%) | 88 (83.0%) |
| 15 Years | 0 (0.0%) | 48 (100.0%) |
| 16 and 17 Years | 0 (0.0%) | 39 (100.0%) |
| 18 to 24 Years | 20 (100.0%) | 100 (100.0%) |
| 25 to 34 Years | 25 (100.0%) | 201 (100.0%) |
| 35 to 44 Years | 222 (100.0%) | 89 (78.8%) |
| 45 to 54 Years | 217 (100.0%) | 176 (100.0%) |
| 55 to 64 Years | 222 (100.0%) | 140 (88.6%) |
| 65 to 74 Years | 404 (92.9%) | 211 (91.3%) |
| 75 Years and over | 146 (76.0%) | 239 (100.0%) |
| Total | 1,457 (90.6%) | 1,421 (92.4%) |
Income Below Poverty Among Married-Couple Families in Oracle
The poverty statistics for married-couple families in Oracle show that 2.3% or 18 of the total 793 families live below the poverty line. Families with 5 or more children have the highest poverty rate of 100.0%, comprising of 18 families. On the other hand, families with no children have the lowest poverty rate of 0.0%, which includes 0 families.

| Children | Above Poverty | Below Poverty |
| No Children | 549 (100.0%) | 0 (0.0%) |
| 1 or 2 Children | 110 (100.0%) | 0 (0.0%) |
| 3 or 4 Children | 116 (100.0%) | 0 (0.0%) |
| 5 or more Children | 0 (0.0%) | 18 (100.0%) |
| Total | 775 (97.7%) | 18 (2.3%) |
Income Below Poverty Among Single-Parent Households in Oracle
| Children | Single Father | Single Mother |
| No Children | 0 (0.0%) | 0 (0.0%) |
| 1 or 2 Children | 0 (0.0%) | 0 (0.0%) |
| 3 or 4 Children | 0 (0.0%) | 0 (0.0%) |
| 5 or more Children | 0 (0.0%) | 0 (0.0%) |
| Total | 0 (0.0%) | 0 (0.0%) |
Income Below Poverty Among Married-Couple vs Single-Parent Households in Oracle
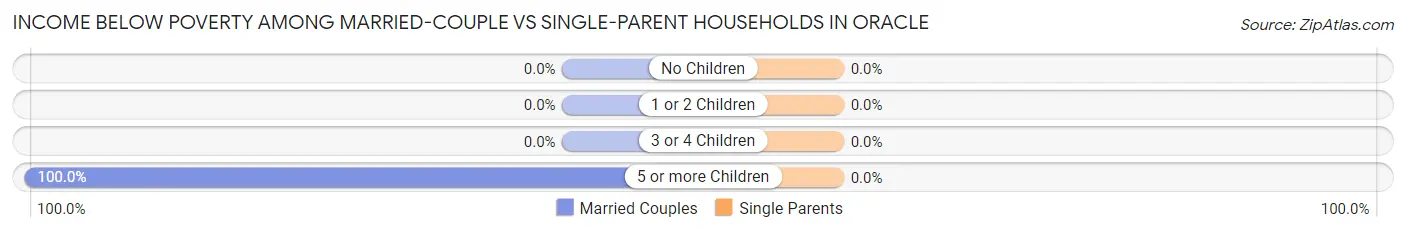
| Children | Married-Couple Families | Single-Parent Households |
| No Children | 0 (0.0%) | 0 (0.0%) |
| 1 or 2 Children | 0 (0.0%) | 0 (0.0%) |
| 3 or 4 Children | 0 (0.0%) | 0 (0.0%) |
| 5 or more Children | 18 (100.0%) | 0 (0.0%) |
| Total | 18 (2.3%) | 0 (0.0%) |
Race in Oracle
The most populous races in Oracle are White / Caucasian (2,167 | 68.9%), Hispanic or Latino (950 | 30.2%), and Two or more Races (547 | 17.4%).
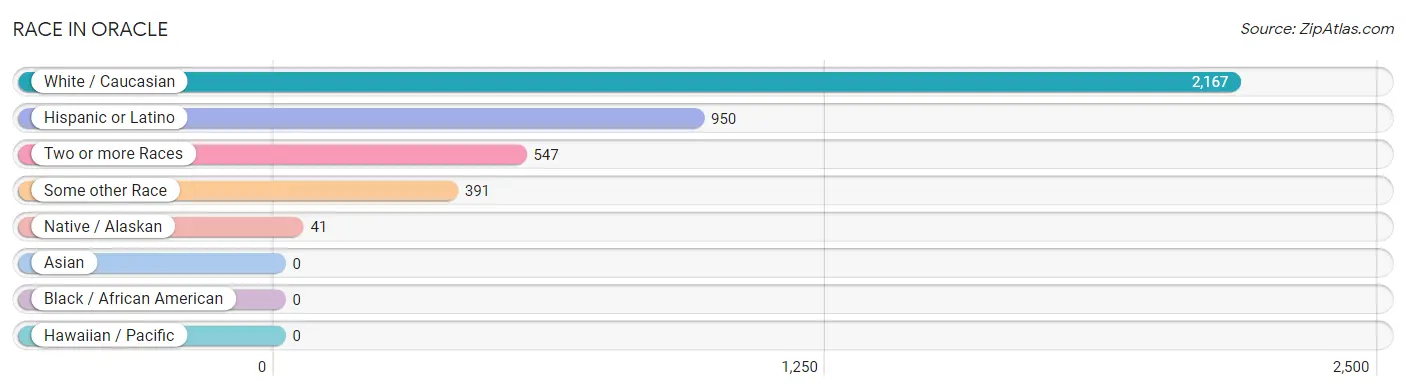
| Race | # Population | % Population |
| Asian | 0 | 0.0% |
| Black / African American | 0 | 0.0% |
| Hawaiian / Pacific | 0 | 0.0% |
| Hispanic or Latino | 950 | 30.2% |
| Native / Alaskan | 41 | 1.3% |
| White / Caucasian | 2,167 | 68.9% |
| Two or more Races | 547 | 17.4% |
| Some other Race | 391 | 12.4% |
| Total | 3,146 | 100.0% |
Ancestry in Oracle
The most populous ancestries reported in Oracle are Mexican (891 | 28.3%), Irish (503 | 16.0%), English (484 | 15.4%), German (447 | 14.2%), and Norwegian (224 | 7.1%), together accounting for 81.0% of all Oracle residents.
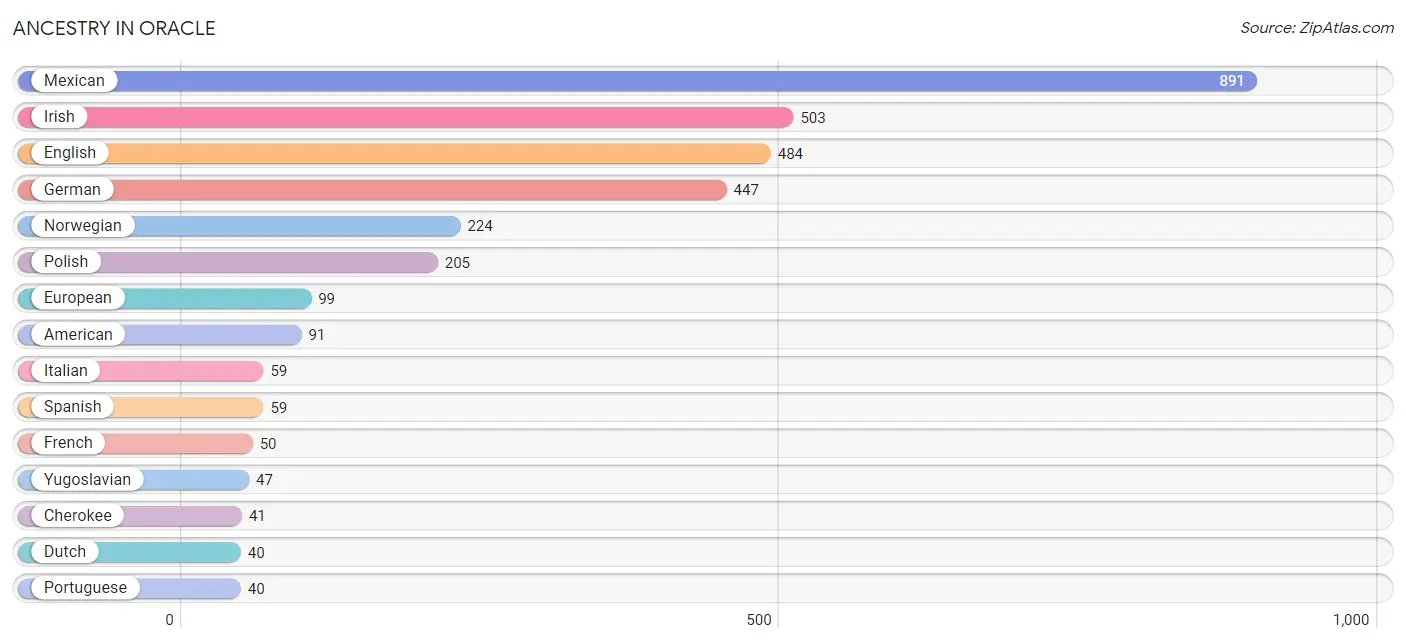
| Ancestry | # Population | % Population |
| American | 91 | 2.9% |
| Cherokee | 41 | 1.3% |
| Danish | 19 | 0.6% |
| Dutch | 40 | 1.3% |
| English | 484 | 15.4% |
| European | 99 | 3.2% |
| French | 50 | 1.6% |
| German | 447 | 14.2% |
| Irish | 503 | 16.0% |
| Italian | 59 | 1.9% |
| Mexican | 891 | 28.3% |
| Norwegian | 224 | 7.1% |
| Polish | 205 | 6.5% |
| Portuguese | 40 | 1.3% |
| Scotch-Irish | 29 | 0.9% |
| Spanish | 59 | 1.9% |
| Swiss | 13 | 0.4% |
| Yugoslavian | 47 | 1.5% | View All 18 Rows |
Immigrants in Oracle
The most numerous immigrant groups reported in Oracle came from Central America (171 | 5.4%), Latin America (171 | 5.4%), Mexico (171 | 5.4%), Fiji (55 | 1.8%), and Oceania (55 | 1.8%), together accounting for 19.8% of all Oracle residents.
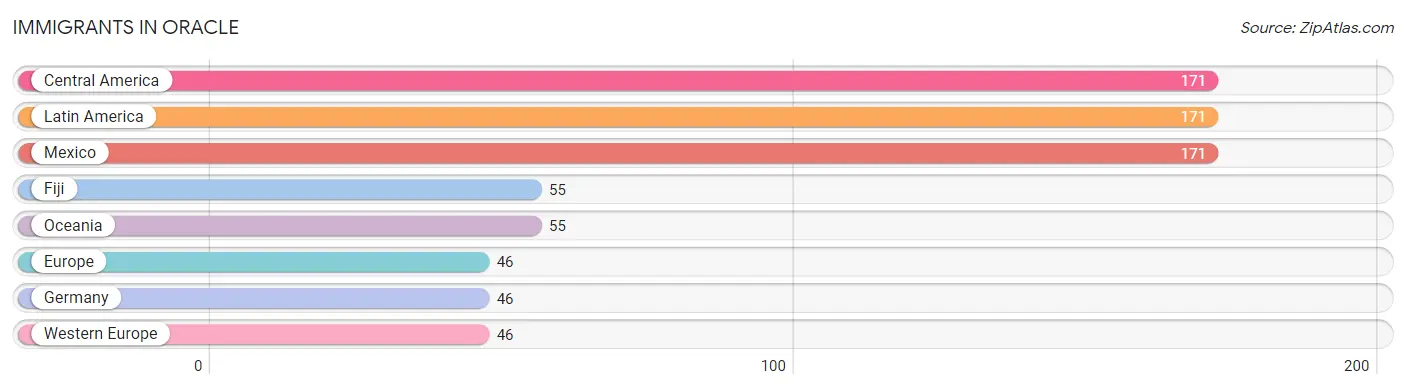
| Immigration Origin | # Population | % Population |
| Central America | 171 | 5.4% |
| Europe | 46 | 1.5% |
| Fiji | 55 | 1.8% |
| Germany | 46 | 1.5% |
| Latin America | 171 | 5.4% |
| Mexico | 171 | 5.4% |
| Oceania | 55 | 1.8% |
| Western Europe | 46 | 1.5% | View All 8 Rows |
Sex and Age in Oracle
Sex and Age in Oracle
The most populous age groups in Oracle are 65 to 69 Years (313 | 19.5%) for men and 60 to 64 Years (158 | 10.3%) for women.
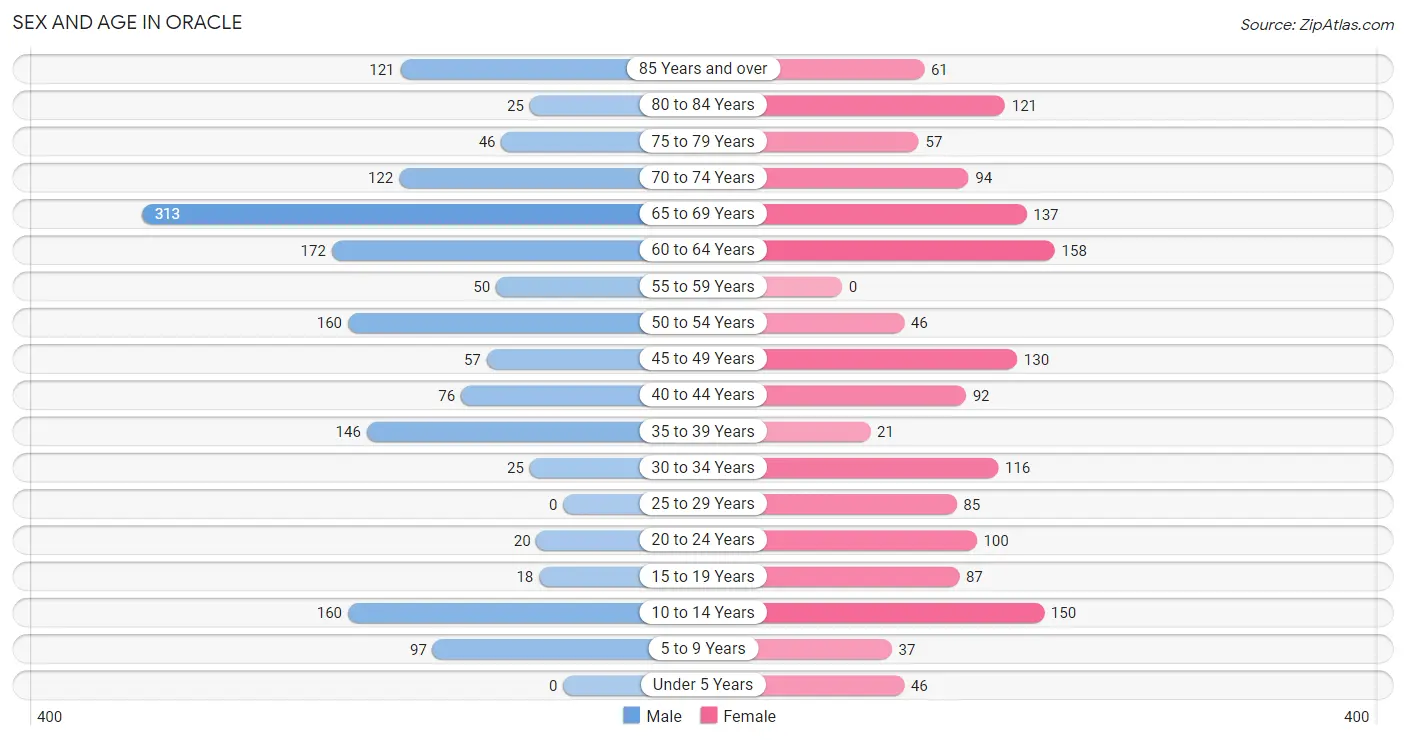
| Age Bracket | Male | Female |
| Under 5 Years | 0 (0.0%) | 46 (3.0%) |
| 5 to 9 Years | 97 (6.0%) | 37 (2.4%) |
| 10 to 14 Years | 160 (10.0%) | 150 (9.8%) |
| 15 to 19 Years | 18 (1.1%) | 87 (5.7%) |
| 20 to 24 Years | 20 (1.2%) | 100 (6.5%) |
| 25 to 29 Years | 0 (0.0%) | 85 (5.5%) |
| 30 to 34 Years | 25 (1.5%) | 116 (7.5%) |
| 35 to 39 Years | 146 (9.1%) | 21 (1.4%) |
| 40 to 44 Years | 76 (4.7%) | 92 (6.0%) |
| 45 to 49 Years | 57 (3.5%) | 130 (8.5%) |
| 50 to 54 Years | 160 (10.0%) | 46 (3.0%) |
| 55 to 59 Years | 50 (3.1%) | 0 (0.0%) |
| 60 to 64 Years | 172 (10.7%) | 158 (10.3%) |
| 65 to 69 Years | 313 (19.5%) | 137 (8.9%) |
| 70 to 74 Years | 122 (7.6%) | 94 (6.1%) |
| 75 to 79 Years | 46 (2.9%) | 57 (3.7%) |
| 80 to 84 Years | 25 (1.5%) | 121 (7.9%) |
| 85 Years and over | 121 (7.5%) | 61 (4.0%) |
| Total | 1,608 (100.0%) | 1,538 (100.0%) |
Families and Households in Oracle
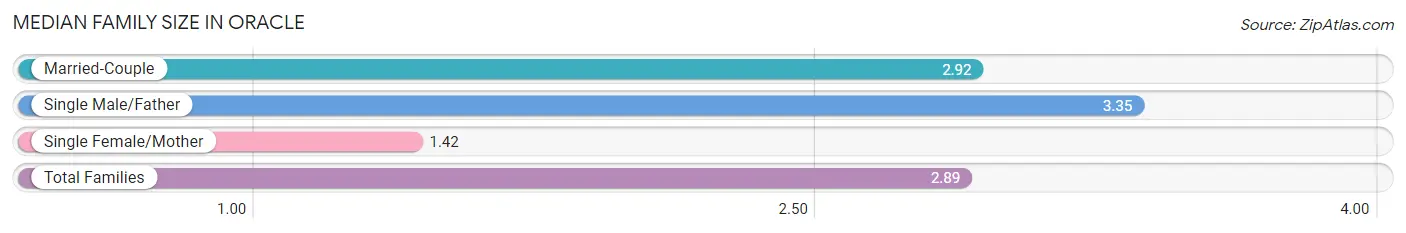
Median Family Size in Oracle
The median family size in Oracle is 2.89 persons per family, with single male/father families (20 | 2.4%) accounting for the largest median family size of 3.35 persons per family. On the other hand, single female/mother families (26 | 3.1%) represent the smallest median family size with 1.42 persons per family.
| Family Type | # Families | Family Size |
| Married-Couple | 793 (94.5%) | 2.92 |
| Single Male/Father | 20 (2.4%) | 3.35 |
| Single Female/Mother | 26 (3.1%) | 1.42 |
| Total Families | 839 (100.0%) | 2.89 |
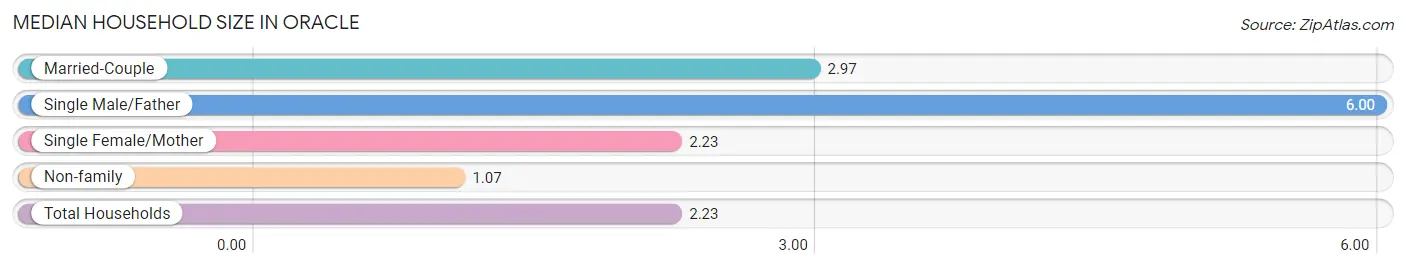
Median Household Size in Oracle
The median household size in Oracle is 2.23 persons per household, with single male/father households (20 | 1.4%) accounting for the largest median household size of 6 persons per household. non-family households (571 | 40.5%) represent the smallest median household size with 1.07 persons per household.
| Household Type | # Households | Household Size |
| Married-Couple | 793 (56.2%) | 2.97 |
| Single Male/Father | 20 (1.4%) | 6.00 |
| Single Female/Mother | 26 (1.8%) | 2.23 |
| Non-family | 571 (40.5%) | 1.07 |
| Total Households | 1,410 (100.0%) | 2.23 |
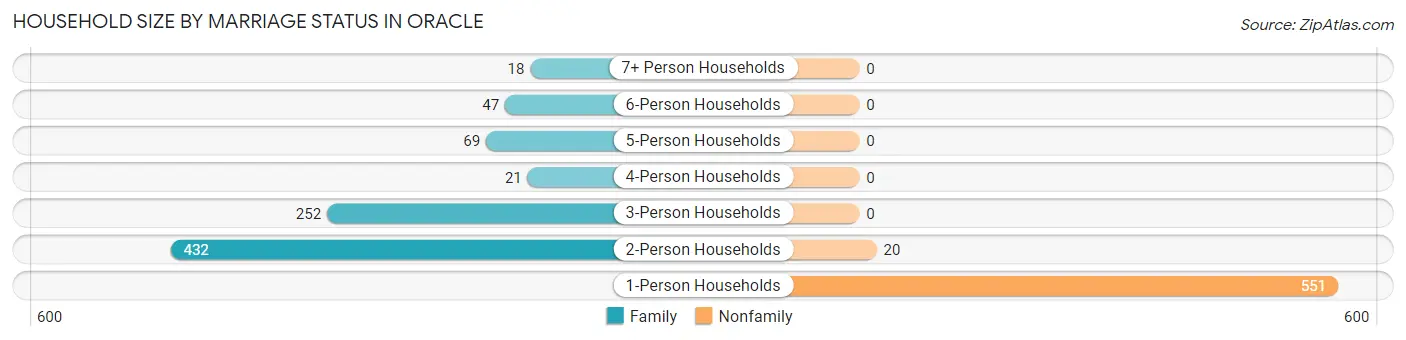
Household Size by Marriage Status in Oracle
Out of a total of 1,410 households in Oracle, 839 (59.5%) are family households, while 571 (40.5%) are nonfamily households. The most numerous type of family households are 2-person households, comprising 432, and the most common type of nonfamily households are 1-person households, comprising 551.
| Household Size | Family Households | Nonfamily Households |
| 1-Person Households | - | 551 (39.1%) |
| 2-Person Households | 432 (30.6%) | 20 (1.4%) |
| 3-Person Households | 252 (17.9%) | 0 (0.0%) |
| 4-Person Households | 21 (1.5%) | 0 (0.0%) |
| 5-Person Households | 69 (4.9%) | 0 (0.0%) |
| 6-Person Households | 47 (3.3%) | 0 (0.0%) |
| 7+ Person Households | 18 (1.3%) | 0 (0.0%) |
| Total | 839 (59.5%) | 571 (40.5%) |
Female Fertility in Oracle
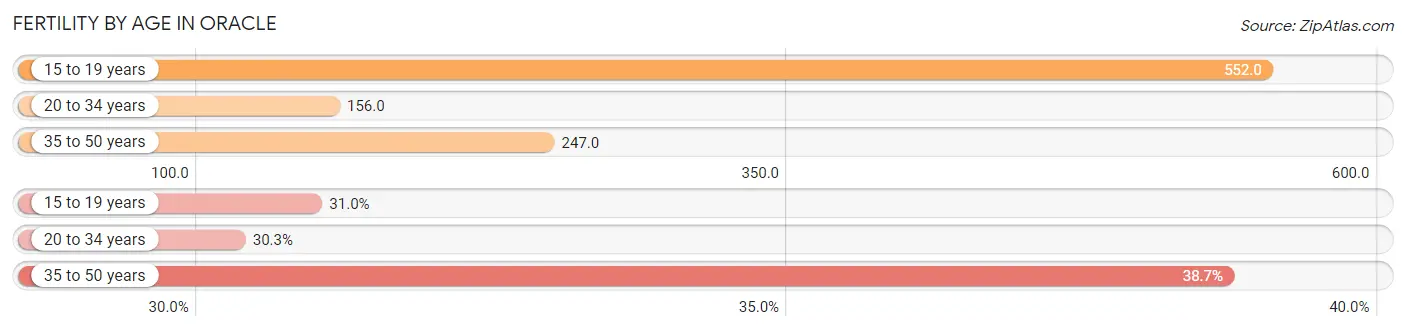
Fertility by Age in Oracle
Average fertility rate in Oracle is 246.0 births per 1,000 women. Women in the age bracket of 15 to 19 years have the highest fertility rate with 552.0 births per 1,000 women. Women in the age bracket of 35 to 50 years acount for 38.7% of all women with births.
| Age Bracket | Women with Births | Births / 1,000 Women |
| 15 to 19 years | 48 (31.0%) | 552.0 |
| 20 to 34 years | 47 (30.3%) | 156.0 |
| 35 to 50 years | 60 (38.7%) | 247.0 |
| Total | 155 (100.0%) | 246.0 |
Fertility by Age by Marriage Status in Oracle
69.0% of women with births (155) in Oracle are married. The highest percentage of unmarried women with births falls into 15 to 19 years age bracket with 100.0% of them unmarried at the time of birth, while the lowest percentage of unmarried women with births belong to 20 to 34 years age bracket with 0.0% of them unmarried.
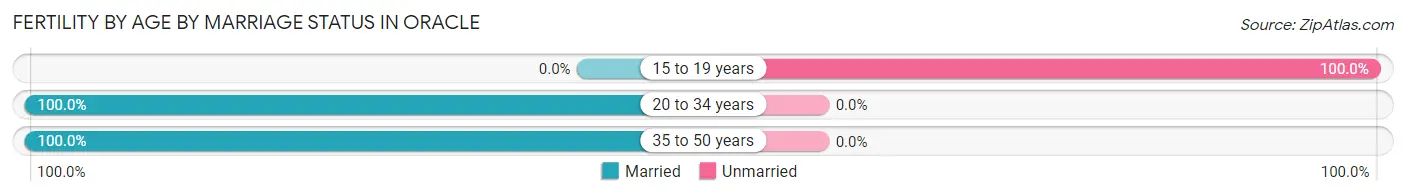
| Age Bracket | Married | Unmarried |
| 15 to 19 years | 0 (0.0%) | 48 (100.0%) |
| 20 to 34 years | 47 (100.0%) | 0 (0.0%) |
| 35 to 50 years | 60 (100.0%) | 0 (0.0%) |
| Total | 107 (69.0%) | 48 (31.0%) |
Fertility by Education in Oracle
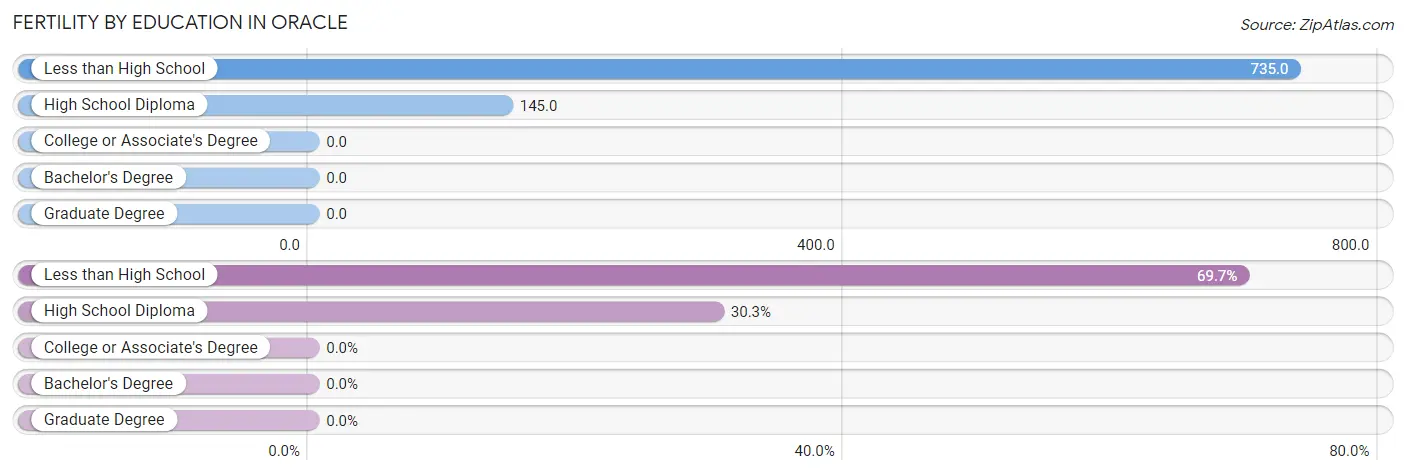
| Educational Attainment | Women with Births | Births / 1,000 Women |
| Less than High School | 108 (69.7%) | 735.0 |
| High School Diploma | 47 (30.3%) | 145.0 |
| College or Associate's Degree | 0 (0.0%) | 0.0 |
| Bachelor's Degree | 0 (0.0%) | 0.0 |
| Graduate Degree | 0 (0.0%) | 0.0 |
| Total | 155 (100.0%) | 246.0 |
Fertility by Education by Marriage Status in Oracle
31.0% of women with births in Oracle are unmarried. Women with the educational attainment of high school diploma are most likely to be married with 100.0% of them married at childbirth, while women with the educational attainment of less than high school are least likely to be married with 44.4% of them unmarried at childbirth.
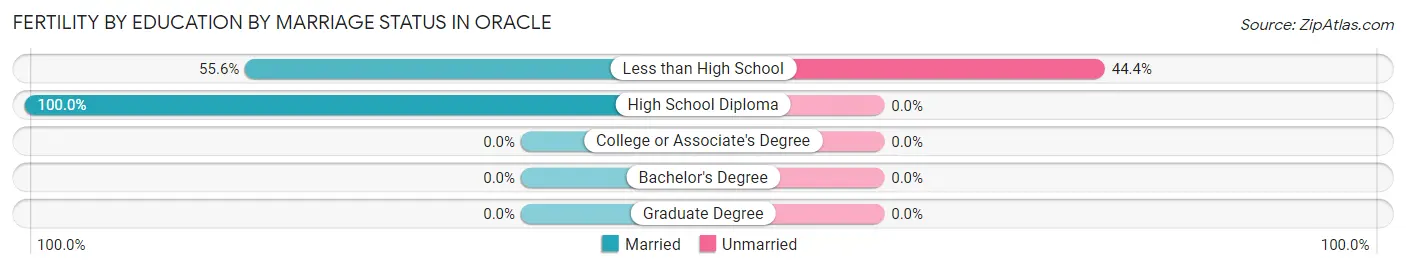
| Educational Attainment | Married | Unmarried |
| Less than High School | 60 (55.6%) | 48 (44.4%) |
| High School Diploma | 47 (100.0%) | 0 (0.0%) |
| College or Associate's Degree | 0 (0.0%) | 0 (0.0%) |
| Bachelor's Degree | 0 (0.0%) | 0 (0.0%) |
| Graduate Degree | 0 (0.0%) | 0 (0.0%) |
| Total | 107 (69.0%) | 48 (31.0%) |
Employment Characteristics in Oracle
Employment by Class of Employer in Oracle
Among the 1,350 employed individuals in Oracle, private company employees (961 | 71.2%), local government employees (182 | 13.5%), and self-employed (not incorporated) (166 | 12.3%) make up the most common classes of employment.
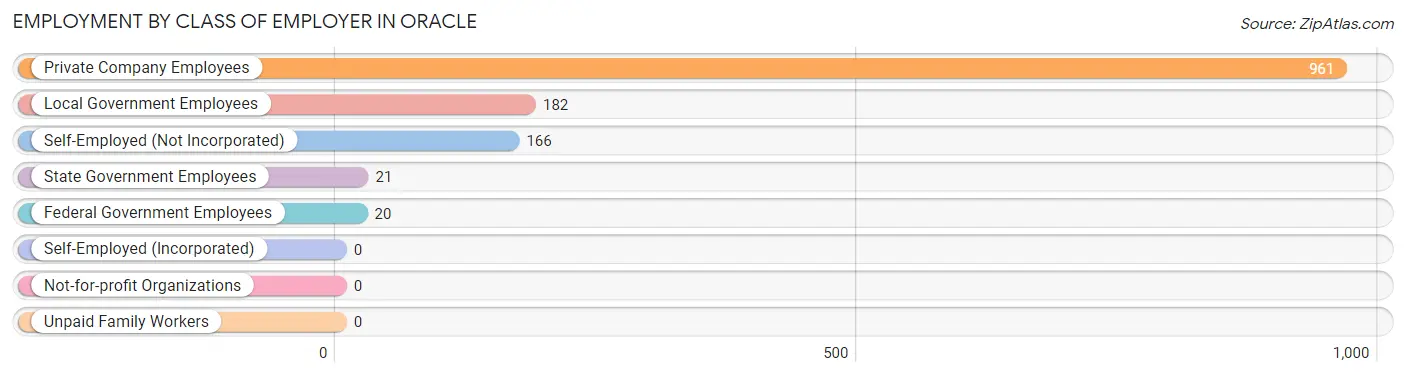
| Employer Class | # Employees | % Employees |
| Private Company Employees | 961 | 71.2% |
| Self-Employed (Incorporated) | 0 | 0.0% |
| Self-Employed (Not Incorporated) | 166 | 12.3% |
| Not-for-profit Organizations | 0 | 0.0% |
| Local Government Employees | 182 | 13.5% |
| State Government Employees | 21 | 1.6% |
| Federal Government Employees | 20 | 1.5% |
| Unpaid Family Workers | 0 | 0.0% |
| Total | 1,350 | 100.0% |
Employment Status by Age in Oracle
According to the labor force statistics for Oracle, out of the total population over 16 years of age (2,608), 53.5% or 1,395 individuals are in the labor force, with 1.7% or 24 of them unemployed. The age group with the highest labor force participation rate is 20 to 24 years, with 100.0% or 120 individuals in the labor force. Within the labor force, the 35 to 44 years age range has the highest percentage of unemployed individuals, with 7.2% or 24 of them being unemployed.
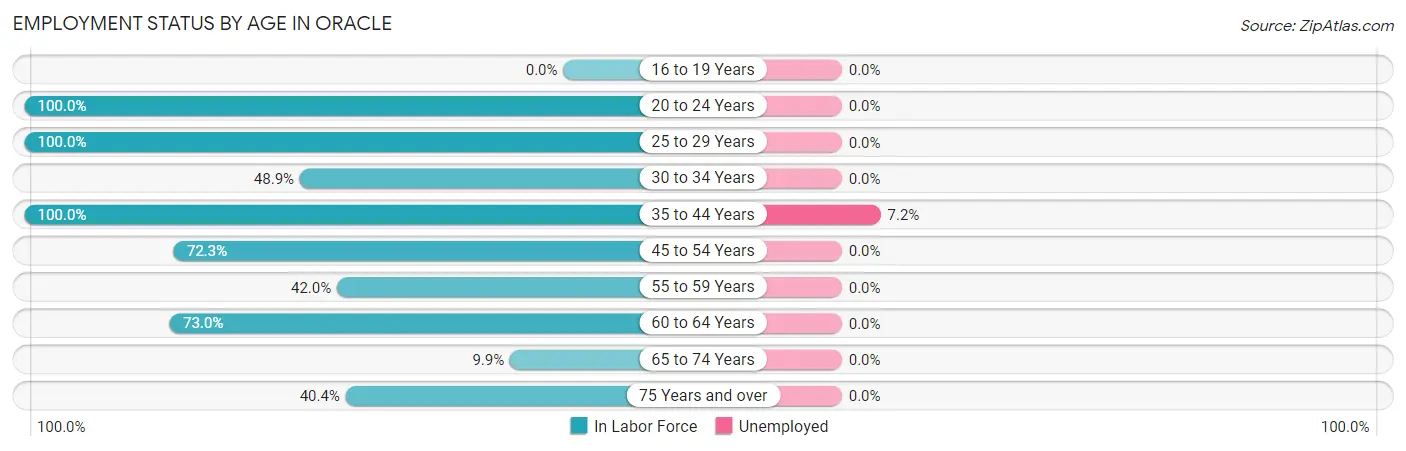
| Age Bracket | In Labor Force | Unemployed |
| 16 to 19 Years | 0 (0.0%) | 0 (0.0%) |
| 20 to 24 Years | 120 (100.0%) | 0 (0.0%) |
| 25 to 29 Years | 85 (100.0%) | 0 (0.0%) |
| 30 to 34 Years | 69 (48.9%) | 0 (0.0%) |
| 35 to 44 Years | 335 (100.0%) | 24 (7.2%) |
| 45 to 54 Years | 284 (72.3%) | 0 (0.0%) |
| 55 to 59 Years | 21 (42.0%) | 0 (0.0%) |
| 60 to 64 Years | 241 (73.0%) | 0 (0.0%) |
| 65 to 74 Years | 66 (9.9%) | 0 (0.0%) |
| 75 Years and over | 174 (40.4%) | 0 (0.0%) |
| Total | 1,395 (53.5%) | 24 (1.7%) |
Employment Status by Educational Attainment in Oracle
According to labor force statistics for Oracle, 77.6% of individuals (1,035) out of the total population between 25 and 64 years of age (1,334) are in the labor force, with 2.3% or 24 of them being unemployed. The group with the highest labor force participation rate are those with the educational attainment of bachelor's degree or higher, with 100.0% or 242 individuals in the labor force. Within the labor force, individuals with high school diploma education have the highest percentage of unemployment, with 7.1% or 24 of them being unemployed.
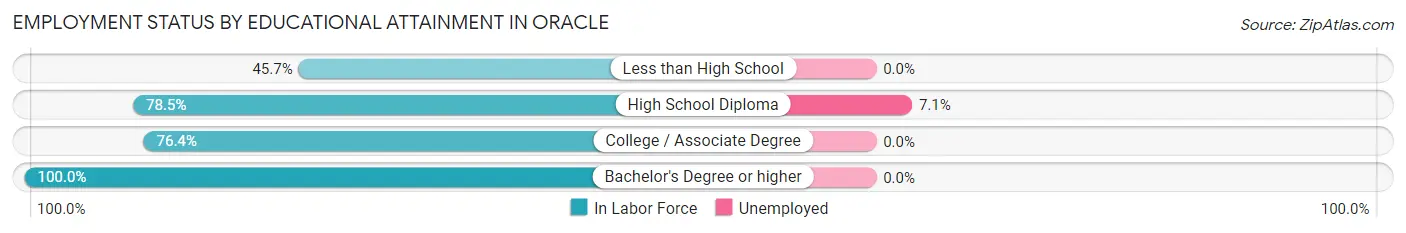
| Educational Attainment | In Labor Force | Unemployed |
| Less than High School | 75 (45.7%) | 0 (0.0%) |
| High School Diploma | 339 (78.5%) | 31 (7.1%) |
| College / Associate Degree | 379 (76.4%) | 0 (0.0%) |
| Bachelor's Degree or higher | 242 (100.0%) | 0 (0.0%) |
| Total | 1,035 (77.6%) | 31 (2.3%) |
Employment Occupations by Sex in Oracle
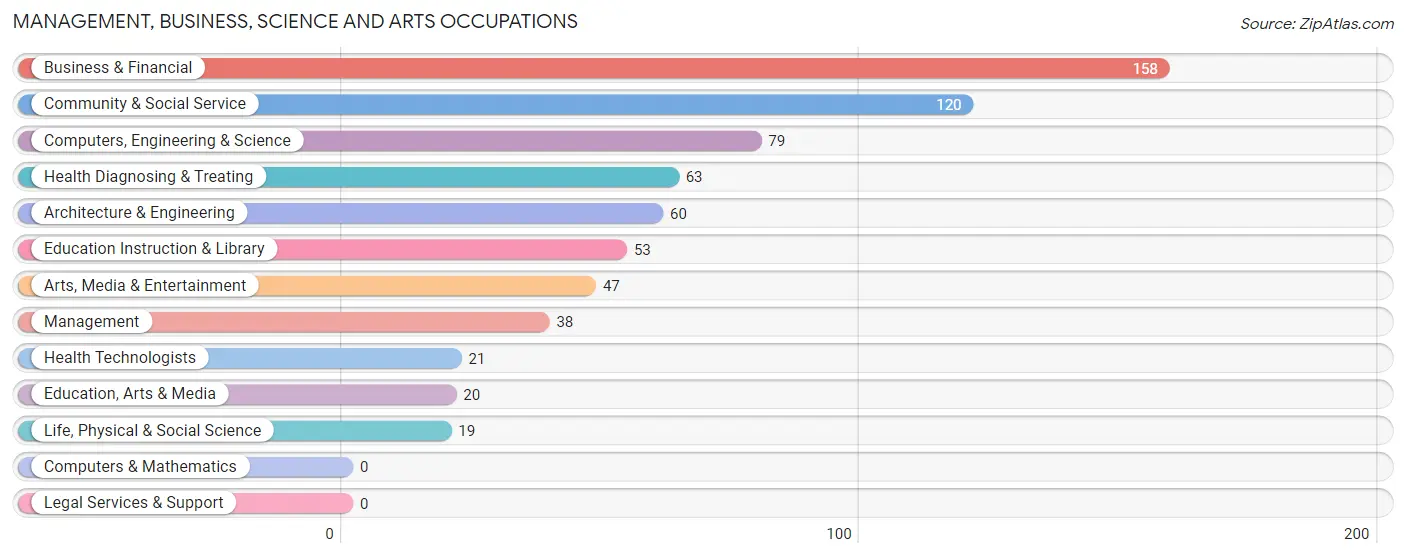
Management, Business, Science and Arts Occupations
The most common Management, Business, Science and Arts occupations in Oracle are Business & Financial (158 | 11.5%), Community & Social Service (120 | 8.7%), Computers, Engineering & Science (79 | 5.8%), Health Diagnosing & Treating (63 | 4.6%), and Architecture & Engineering (60 | 4.4%).
Management, Business, Science and Arts Occupations by Sex
Within the Management, Business, Science and Arts occupations in Oracle, the most male-oriented occupations are Management (100.0%), Computers, Engineering & Science (100.0%), and Architecture & Engineering (100.0%), while the most female-oriented occupations are Education, Arts & Media (100.0%), Arts, Media & Entertainment (100.0%), and Health Diagnosing & Treating (100.0%).
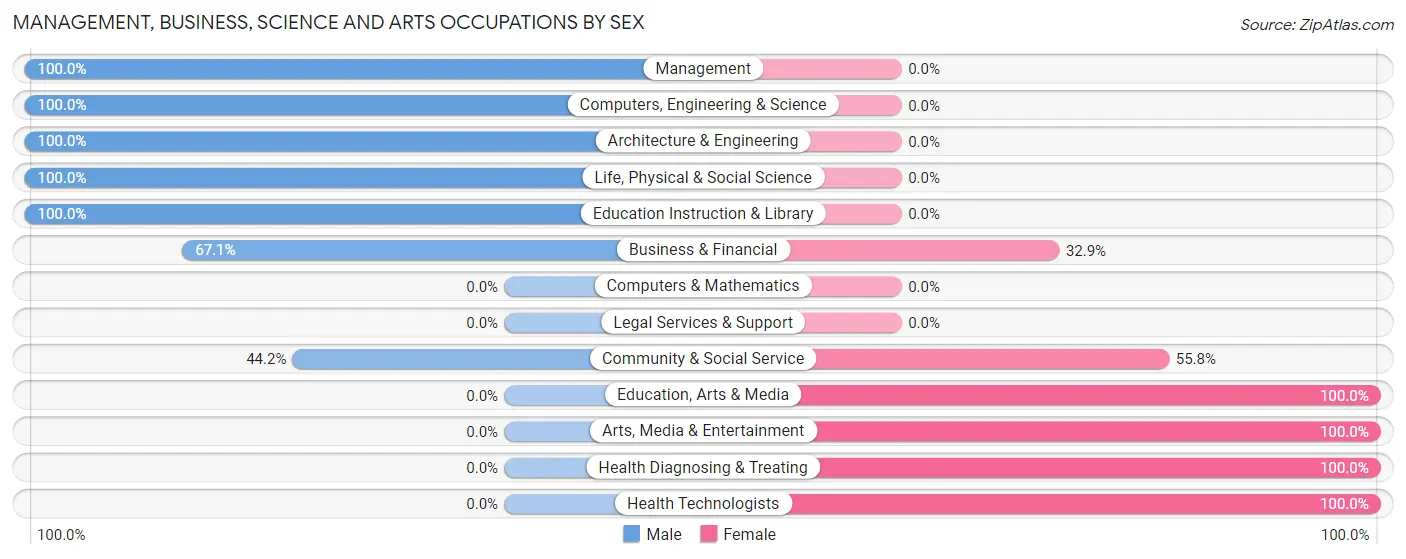
| Occupation | Male | Female |
| Management | 38 (100.0%) | 0 (0.0%) |
| Business & Financial | 106 (67.1%) | 52 (32.9%) |
| Computers, Engineering & Science | 79 (100.0%) | 0 (0.0%) |
| Computers & Mathematics | 0 (0.0%) | 0 (0.0%) |
| Architecture & Engineering | 60 (100.0%) | 0 (0.0%) |
| Life, Physical & Social Science | 19 (100.0%) | 0 (0.0%) |
| Community & Social Service | 53 (44.2%) | 67 (55.8%) |
| Education, Arts & Media | 0 (0.0%) | 20 (100.0%) |
| Legal Services & Support | 0 (0.0%) | 0 (0.0%) |
| Education Instruction & Library | 53 (100.0%) | 0 (0.0%) |
| Arts, Media & Entertainment | 0 (0.0%) | 47 (100.0%) |
| Health Diagnosing & Treating | 0 (0.0%) | 63 (100.0%) |
| Health Technologists | 0 (0.0%) | 21 (100.0%) |
| Total (Category) | 276 (60.3%) | 182 (39.7%) |
| Total (Overall) | 714 (52.1%) | 657 (47.9%) |
Services Occupations
The most common Services occupations in Oracle are , and Food Preparation & Serving (85 | 6.2%).
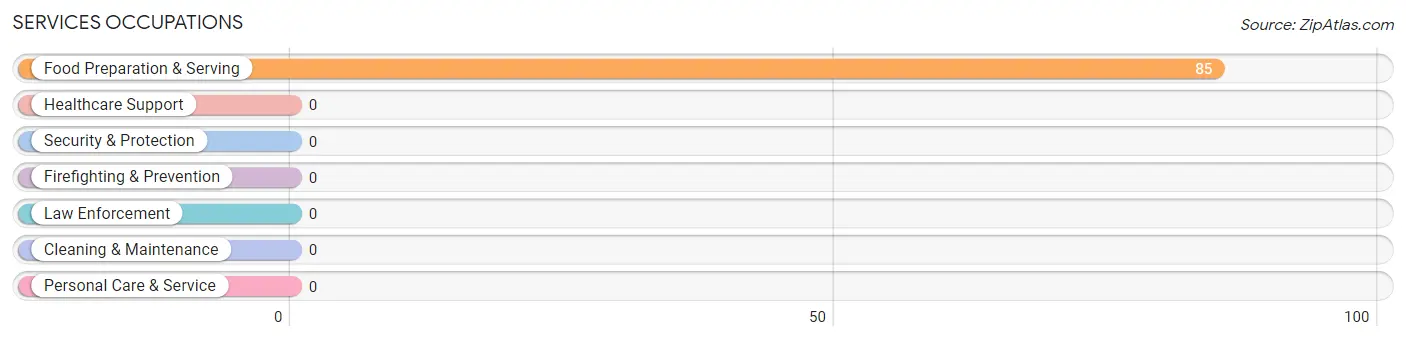
Services Occupations by Sex
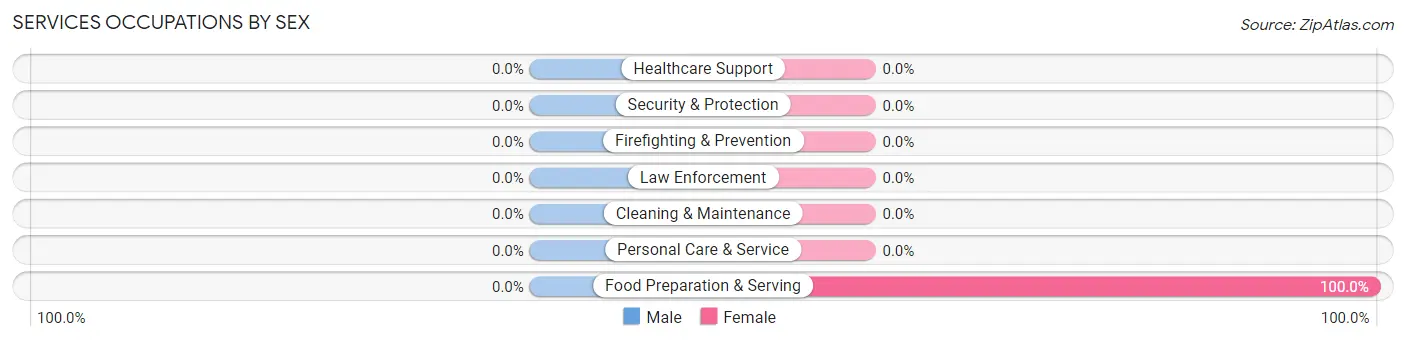
| Occupation | Male | Female |
| Healthcare Support | 0 (0.0%) | 0 (0.0%) |
| Security & Protection | 0 (0.0%) | 0 (0.0%) |
| Firefighting & Prevention | 0 (0.0%) | 0 (0.0%) |
| Law Enforcement | 0 (0.0%) | 0 (0.0%) |
| Food Preparation & Serving | 0 (0.0%) | 85 (100.0%) |
| Cleaning & Maintenance | 0 (0.0%) | 0 (0.0%) |
| Personal Care & Service | 0 (0.0%) | 0 (0.0%) |
| Total (Category) | 0 (0.0%) | 85 (100.0%) |
| Total (Overall) | 714 (52.1%) | 657 (47.9%) |
Sales and Office Occupations
The most common Sales and Office occupations in Oracle are Office & Administration (201 | 14.7%), and Sales & Related (98 | 7.1%).
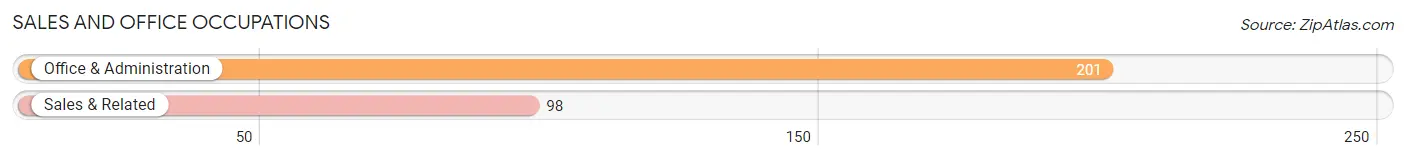
Sales and Office Occupations by Sex
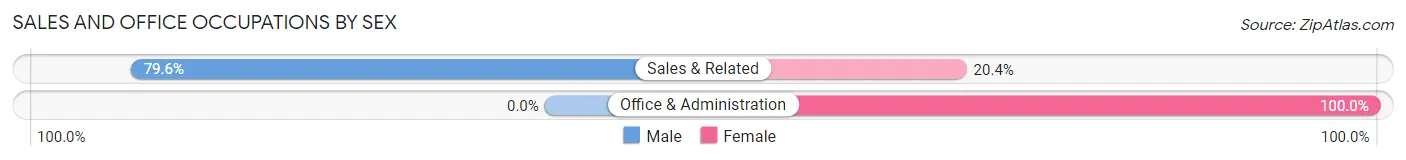
| Occupation | Male | Female |
| Sales & Related | 78 (79.6%) | 20 (20.4%) |
| Office & Administration | 0 (0.0%) | 201 (100.0%) |
| Total (Category) | 78 (26.1%) | 221 (73.9%) |
| Total (Overall) | 714 (52.1%) | 657 (47.9%) |
Natural Resources, Construction and Maintenance Occupations
The most common Natural Resources, Construction and Maintenance occupations in Oracle are Construction & Extraction (110 | 8.0%), and Installation, Maintenance & Repair (46 | 3.4%).
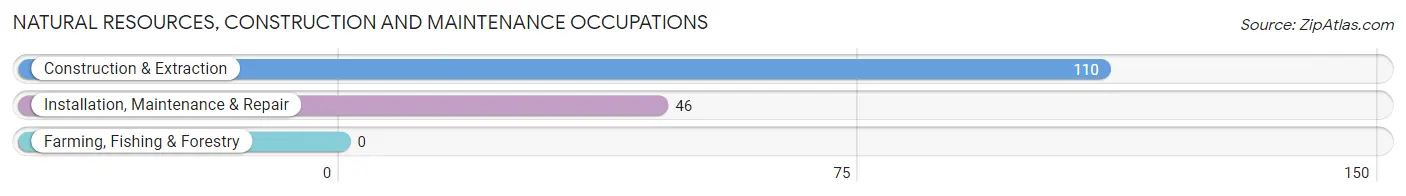
Natural Resources, Construction and Maintenance Occupations by Sex
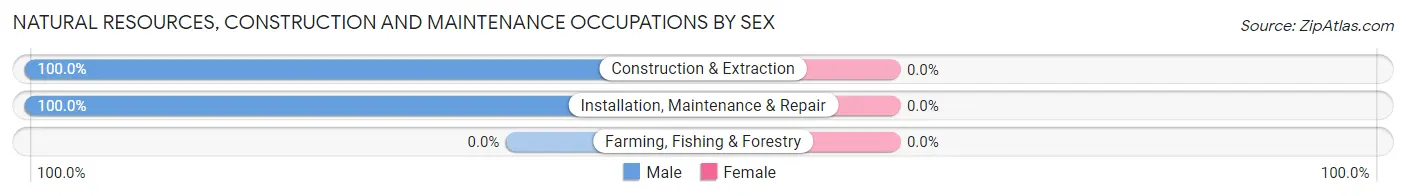
| Occupation | Male | Female |
| Farming, Fishing & Forestry | 0 (0.0%) | 0 (0.0%) |
| Construction & Extraction | 110 (100.0%) | 0 (0.0%) |
| Installation, Maintenance & Repair | 46 (100.0%) | 0 (0.0%) |
| Total (Category) | 156 (100.0%) | 0 (0.0%) |
| Total (Overall) | 714 (52.1%) | 657 (47.9%) |
Production, Transportation and Moving Occupations
The most common Production, Transportation and Moving occupations in Oracle are Transportation (185 | 13.5%), Production (162 | 11.8%), and Material Moving (26 | 1.9%).
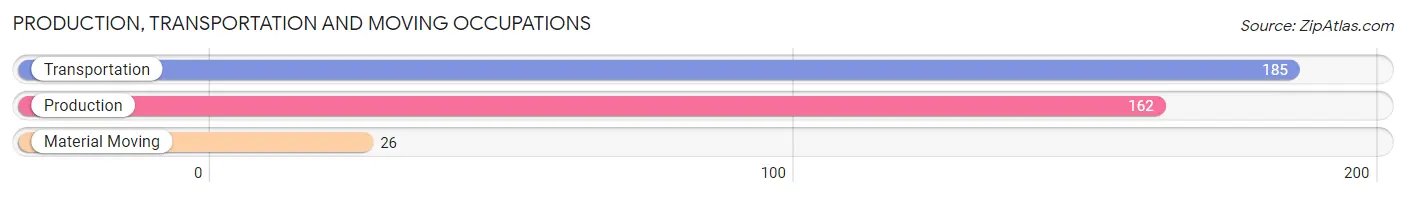
Production, Transportation and Moving Occupations by Sex
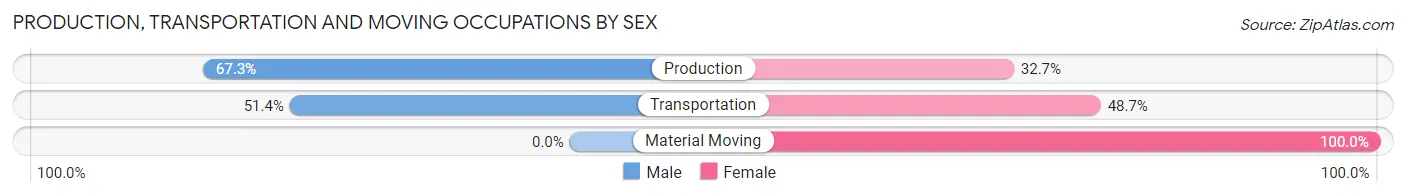
| Occupation | Male | Female |
| Production | 109 (67.3%) | 53 (32.7%) |
| Transportation | 95 (51.3%) | 90 (48.6%) |
| Material Moving | 0 (0.0%) | 26 (100.0%) |
| Total (Category) | 204 (54.7%) | 169 (45.3%) |
| Total (Overall) | 714 (52.1%) | 657 (47.9%) |
Employment Industries by Sex in Oracle
Employment Industries in Oracle
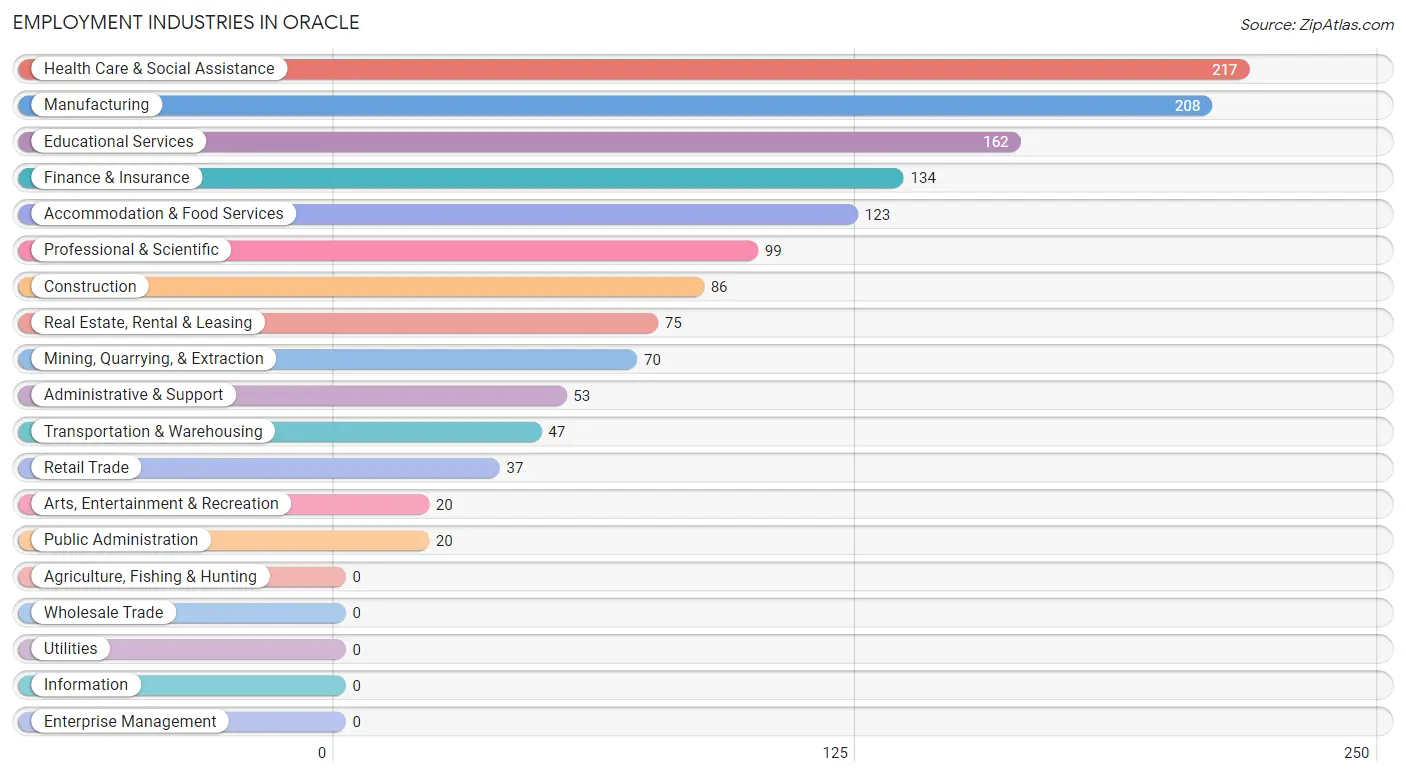
The major employment industries in Oracle include Health Care & Social Assistance (217 | 15.8%), Manufacturing (208 | 15.2%), Educational Services (162 | 11.8%), Finance & Insurance (134 | 9.8%), and Accommodation & Food Services (123 | 9.0%).
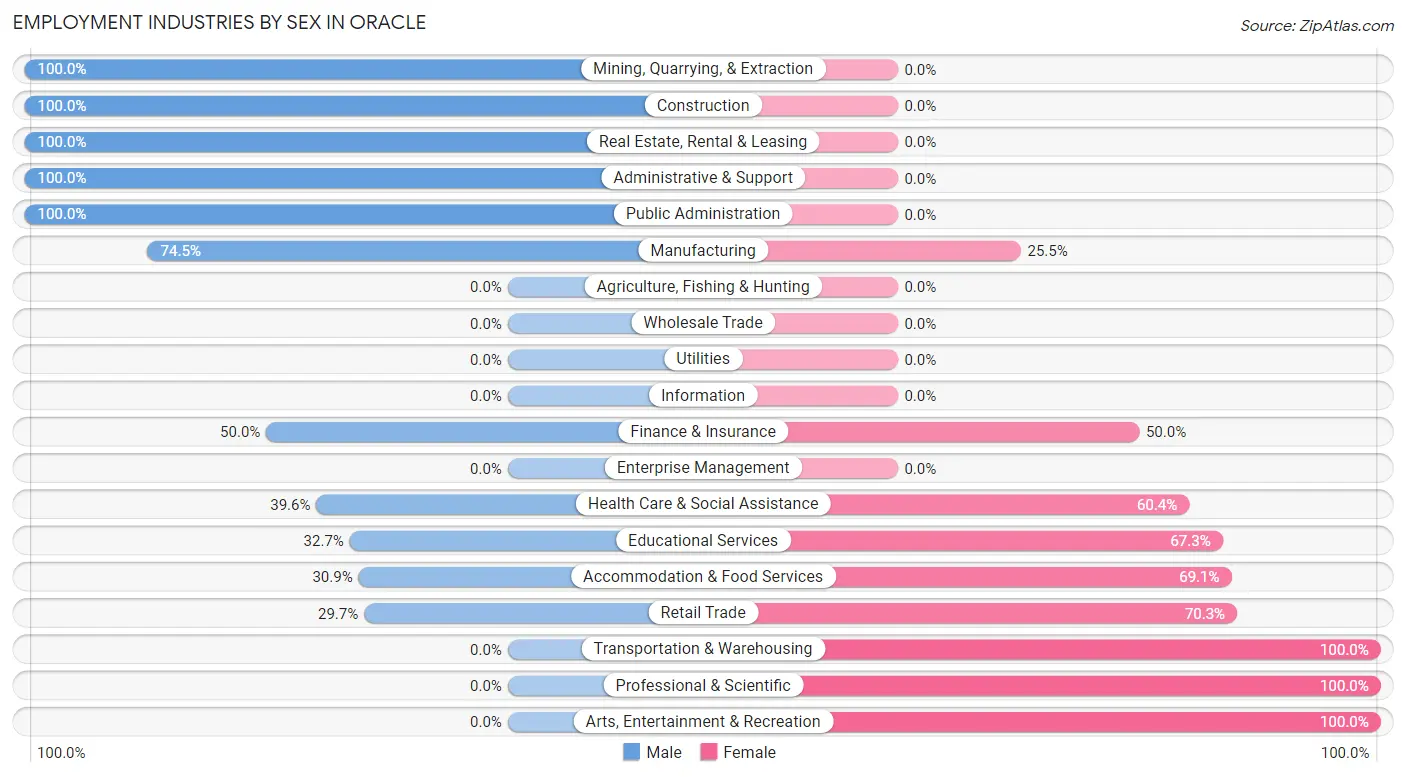
Employment Industries by Sex in Oracle
The Oracle industries that see more men than women are Mining, Quarrying, & Extraction (100.0%), Construction (100.0%), and Real Estate, Rental & Leasing (100.0%), whereas the industries that tend to have a higher number of women are Transportation & Warehousing (100.0%), Professional & Scientific (100.0%), and Arts, Entertainment & Recreation (100.0%).
| Industry | Male | Female |
| Agriculture, Fishing & Hunting | 0 (0.0%) | 0 (0.0%) |
| Mining, Quarrying, & Extraction | 70 (100.0%) | 0 (0.0%) |
| Construction | 86 (100.0%) | 0 (0.0%) |
| Manufacturing | 155 (74.5%) | 53 (25.5%) |
| Wholesale Trade | 0 (0.0%) | 0 (0.0%) |
| Retail Trade | 11 (29.7%) | 26 (70.3%) |
| Transportation & Warehousing | 0 (0.0%) | 47 (100.0%) |
| Utilities | 0 (0.0%) | 0 (0.0%) |
| Information | 0 (0.0%) | 0 (0.0%) |
| Finance & Insurance | 67 (50.0%) | 67 (50.0%) |
| Real Estate, Rental & Leasing | 75 (100.0%) | 0 (0.0%) |
| Professional & Scientific | 0 (0.0%) | 99 (100.0%) |
| Enterprise Management | 0 (0.0%) | 0 (0.0%) |
| Administrative & Support | 53 (100.0%) | 0 (0.0%) |
| Educational Services | 53 (32.7%) | 109 (67.3%) |
| Health Care & Social Assistance | 86 (39.6%) | 131 (60.4%) |
| Arts, Entertainment & Recreation | 0 (0.0%) | 20 (100.0%) |
| Accommodation & Food Services | 38 (30.9%) | 85 (69.1%) |
| Public Administration | 20 (100.0%) | 0 (0.0%) |
| Total | 714 (52.1%) | 657 (47.9%) |
Education in Oracle
School Enrollment in Oracle
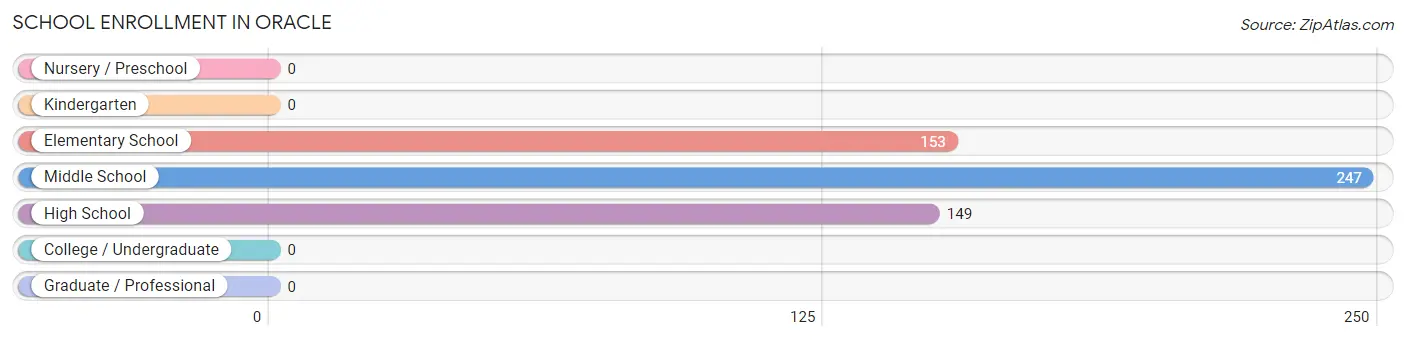
The most common levels of schooling among the 549 students in Oracle are middle school (247 | 45.0%), elementary school (153 | 27.9%), and high school (149 | 27.1%).
| School Level | # Students | % Students |
| Nursery / Preschool | 0 | 0.0% |
| Kindergarten | 0 | 0.0% |
| Elementary School | 153 | 27.9% |
| Middle School | 247 | 45.0% |
| High School | 149 | 27.1% |
| College / Undergraduate | 0 | 0.0% |
| Graduate / Professional | 0 | 0.0% |
| Total | 549 | 100.0% |
School Enrollment by Age by Funding Source in Oracle
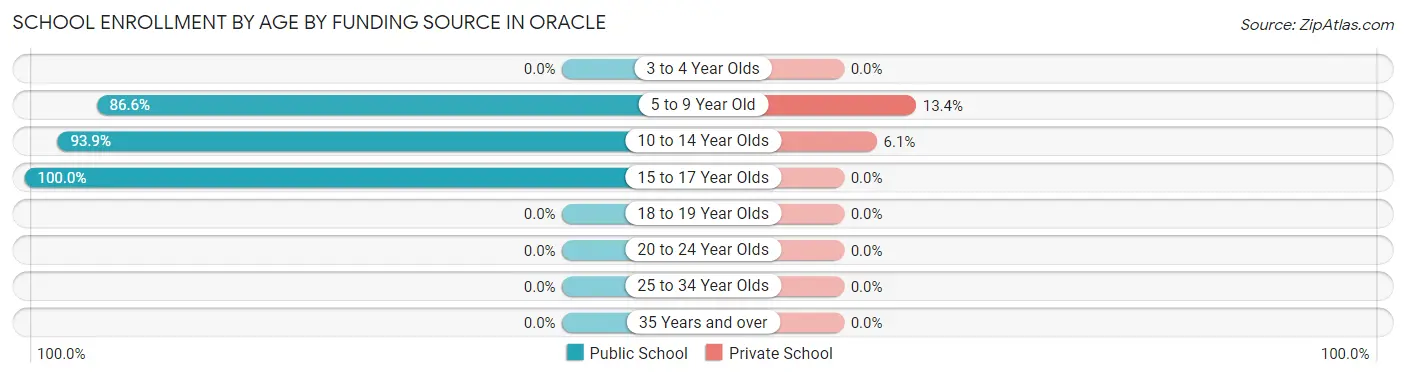
Out of a total of 549 students who are enrolled in schools in Oracle, 37 (6.7%) attend a private institution, while the remaining 512 (93.3%) are enrolled in public schools. The age group of 5 to 9 year old has the highest likelihood of being enrolled in private schools, with 18 (13.4% in the age bracket) enrolled. Conversely, the age group of 15 to 17 year olds has the lowest likelihood of being enrolled in a private school, with 105 (100.0% in the age bracket) attending a public institution.
| Age Bracket | Public School | Private School |
| 3 to 4 Year Olds | 0 (0.0%) | 0 (0.0%) |
| 5 to 9 Year Old | 116 (86.6%) | 18 (13.4%) |
| 10 to 14 Year Olds | 291 (93.9%) | 19 (6.1%) |
| 15 to 17 Year Olds | 105 (100.0%) | 0 (0.0%) |
| 18 to 19 Year Olds | 0 (0.0%) | 0 (0.0%) |
| 20 to 24 Year Olds | 0 (0.0%) | 0 (0.0%) |
| 25 to 34 Year Olds | 0 (0.0%) | 0 (0.0%) |
| 35 Years and over | 0 (0.0%) | 0 (0.0%) |
| Total | 512 (93.3%) | 37 (6.7%) |
Educational Attainment by Field of Study in Oracle
Engineering (169 | 31.1%), education (166 | 30.5%), liberal arts & history (87 | 16.0%), science & technology (42 | 7.7%), and visual & performing arts (29 | 5.3%) are the most common fields of study among 544 individuals in Oracle who have obtained a bachelor's degree or higher.
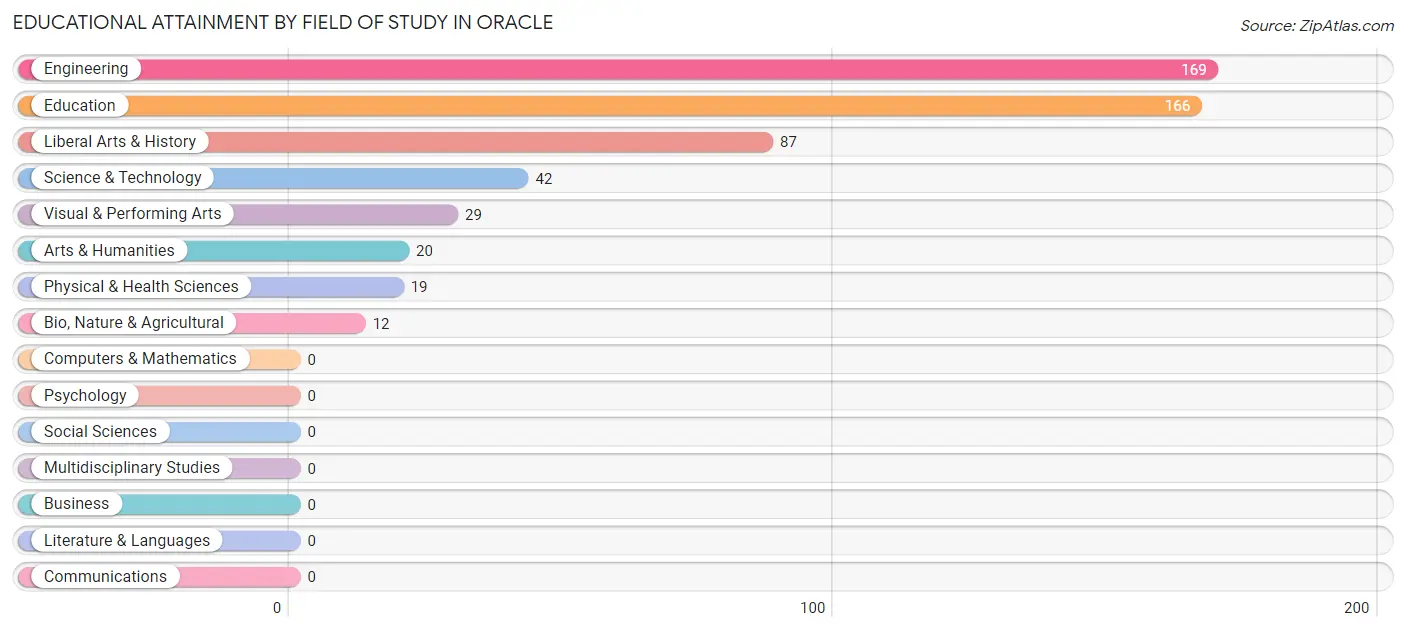
| Field of Study | # Graduates | % Graduates |
| Computers & Mathematics | 0 | 0.0% |
| Bio, Nature & Agricultural | 12 | 2.2% |
| Physical & Health Sciences | 19 | 3.5% |
| Psychology | 0 | 0.0% |
| Social Sciences | 0 | 0.0% |
| Engineering | 169 | 31.1% |
| Multidisciplinary Studies | 0 | 0.0% |
| Science & Technology | 42 | 7.7% |
| Business | 0 | 0.0% |
| Education | 166 | 30.5% |
| Literature & Languages | 0 | 0.0% |
| Liberal Arts & History | 87 | 16.0% |
| Visual & Performing Arts | 29 | 5.3% |
| Communications | 0 | 0.0% |
| Arts & Humanities | 20 | 3.7% |
| Total | 544 | 100.0% |
Transportation & Commute in Oracle
Vehicle Availability by Sex in Oracle
The most prevalent vehicle ownership categories in Oracle are males with 2 vehicles (409, accounting for 59.0%) and females with 2 vehicles (250, making up 62.3%).
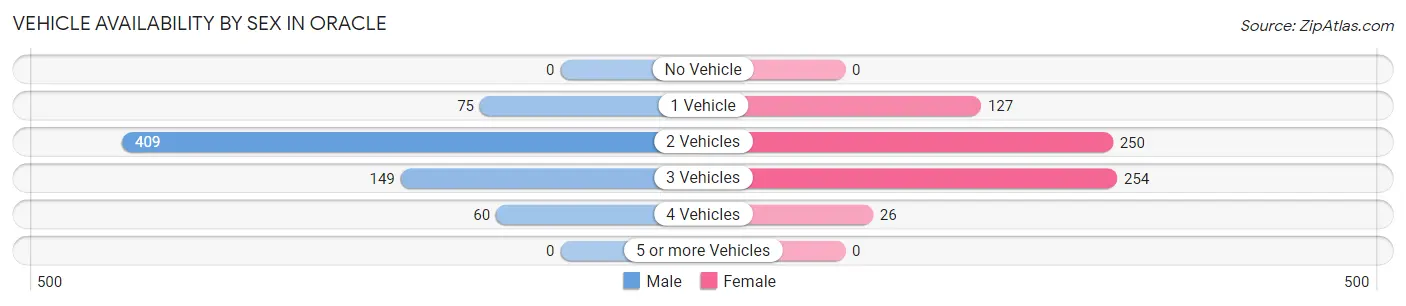
| Vehicles Available | Male | Female |
| No Vehicle | 0 (0.0%) | 0 (0.0%) |
| 1 Vehicle | 75 (10.8%) | 127 (19.3%) |
| 2 Vehicles | 409 (59.0%) | 250 (38.1%) |
| 3 Vehicles | 149 (21.5%) | 254 (38.7%) |
| 4 Vehicles | 60 (8.7%) | 26 (4.0%) |
| 5 or more Vehicles | 0 (0.0%) | 0 (0.0%) |
| Total | 693 (100.0%) | 657 (100.0%) |
Commute Time in Oracle
The most frequently occuring commute durations in Oracle are 60 to 89 minutes (264 commuters, 23.3%), 25 to 29 minutes (194 commuters, 17.2%), and 45 to 59 minutes (163 commuters, 14.4%).
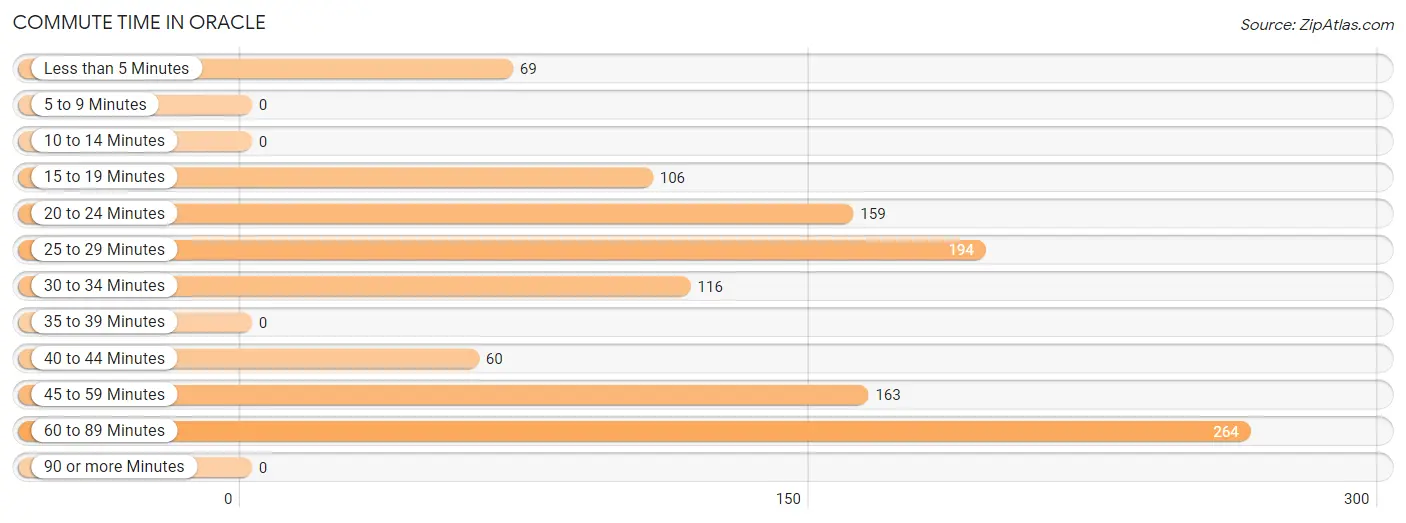
| Commute Time | # Commuters | % Commuters |
| Less than 5 Minutes | 69 | 6.1% |
| 5 to 9 Minutes | 0 | 0.0% |
| 10 to 14 Minutes | 0 | 0.0% |
| 15 to 19 Minutes | 106 | 9.4% |
| 20 to 24 Minutes | 159 | 14.1% |
| 25 to 29 Minutes | 194 | 17.2% |
| 30 to 34 Minutes | 116 | 10.3% |
| 35 to 39 Minutes | 0 | 0.0% |
| 40 to 44 Minutes | 60 | 5.3% |
| 45 to 59 Minutes | 163 | 14.4% |
| 60 to 89 Minutes | 264 | 23.3% |
| 90 or more Minutes | 0 | 0.0% |
Commute Time by Sex in Oracle
The most common commute times in Oracle are 60 to 89 minutes (264 commuters, 43.5%) for males and 25 to 29 minutes (141 commuters, 26.9%) for females.
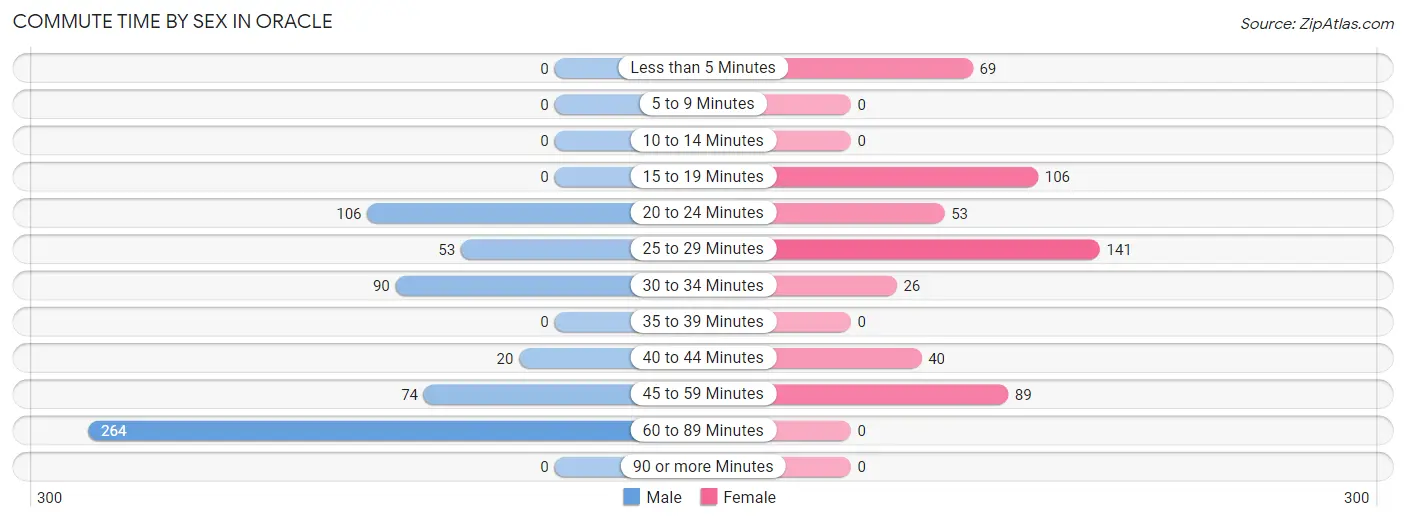
| Commute Time | Male | Female |
| Less than 5 Minutes | 0 (0.0%) | 69 (13.2%) |
| 5 to 9 Minutes | 0 (0.0%) | 0 (0.0%) |
| 10 to 14 Minutes | 0 (0.0%) | 0 (0.0%) |
| 15 to 19 Minutes | 0 (0.0%) | 106 (20.2%) |
| 20 to 24 Minutes | 106 (17.5%) | 53 (10.1%) |
| 25 to 29 Minutes | 53 (8.7%) | 141 (26.9%) |
| 30 to 34 Minutes | 90 (14.8%) | 26 (5.0%) |
| 35 to 39 Minutes | 0 (0.0%) | 0 (0.0%) |
| 40 to 44 Minutes | 20 (3.3%) | 40 (7.6%) |
| 45 to 59 Minutes | 74 (12.2%) | 89 (17.0%) |
| 60 to 89 Minutes | 264 (43.5%) | 0 (0.0%) |
| 90 or more Minutes | 0 (0.0%) | 0 (0.0%) |
Time of Departure to Work by Sex in Oracle
The most frequent times of departure to work in Oracle are 12:00 AM to 4:59 AM (176, 29.0%) for males and 6:30 AM to 6:59 AM (173, 33.0%) for females.
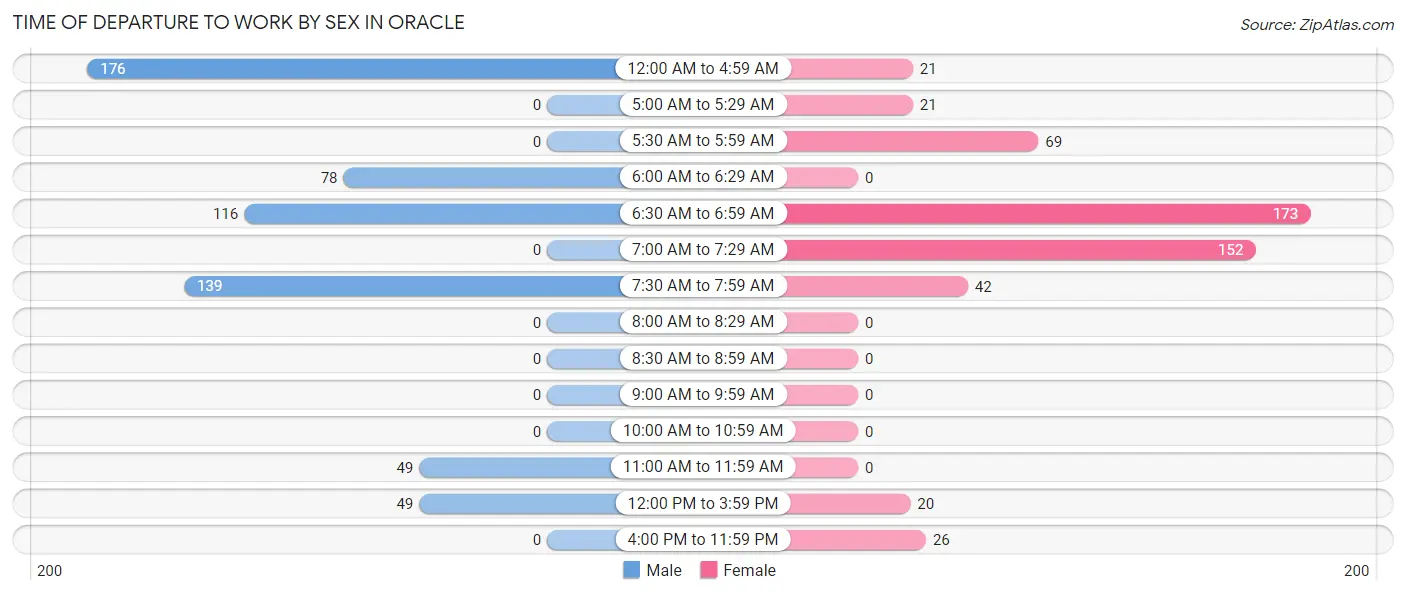
| Time of Departure | Male | Female |
| 12:00 AM to 4:59 AM | 176 (29.0%) | 21 (4.0%) |
| 5:00 AM to 5:29 AM | 0 (0.0%) | 21 (4.0%) |
| 5:30 AM to 5:59 AM | 0 (0.0%) | 69 (13.2%) |
| 6:00 AM to 6:29 AM | 78 (12.9%) | 0 (0.0%) |
| 6:30 AM to 6:59 AM | 116 (19.1%) | 173 (33.0%) |
| 7:00 AM to 7:29 AM | 0 (0.0%) | 152 (29.0%) |
| 7:30 AM to 7:59 AM | 139 (22.9%) | 42 (8.0%) |
| 8:00 AM to 8:29 AM | 0 (0.0%) | 0 (0.0%) |
| 8:30 AM to 8:59 AM | 0 (0.0%) | 0 (0.0%) |
| 9:00 AM to 9:59 AM | 0 (0.0%) | 0 (0.0%) |
| 10:00 AM to 10:59 AM | 0 (0.0%) | 0 (0.0%) |
| 11:00 AM to 11:59 AM | 49 (8.1%) | 0 (0.0%) |
| 12:00 PM to 3:59 PM | 49 (8.1%) | 20 (3.8%) |
| 4:00 PM to 11:59 PM | 0 (0.0%) | 26 (5.0%) |
| Total | 607 (100.0%) | 524 (100.0%) |
Housing Occupancy in Oracle
Occupancy by Ownership in Oracle
Of the total 1,410 dwellings in Oracle, owner-occupied units account for 1,282 (90.9%), while renter-occupied units make up 128 (9.1%).
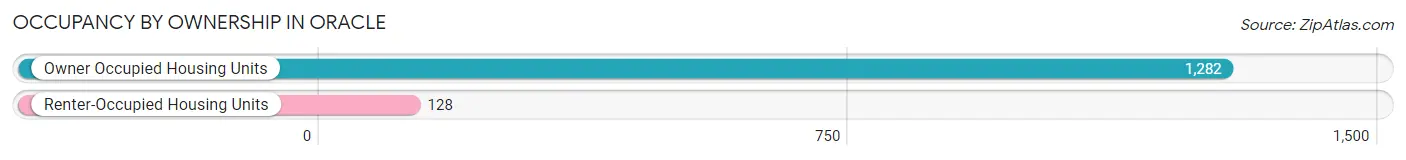
| Occupancy | # Housing Units | % Housing Units |
| Owner Occupied Housing Units | 1,282 | 90.9% |
| Renter-Occupied Housing Units | 128 | 9.1% |
| Total Occupied Housing Units | 1,410 | 100.0% |
Occupancy by Household Size in Oracle
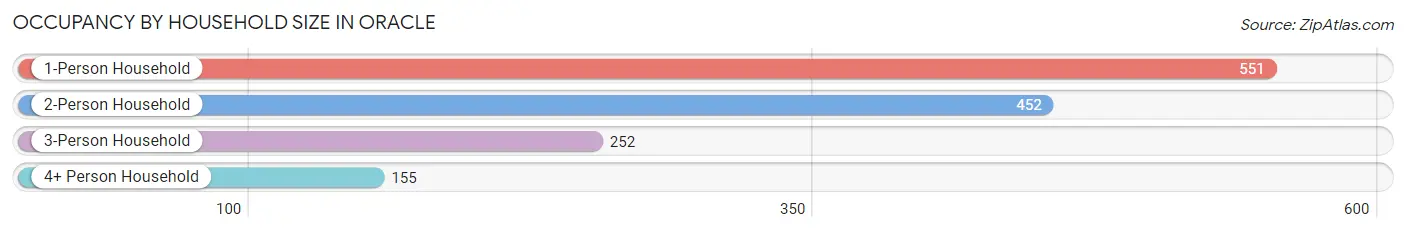
| Household Size | # Housing Units | % Housing Units |
| 1-Person Household | 551 | 39.1% |
| 2-Person Household | 452 | 32.1% |
| 3-Person Household | 252 | 17.9% |
| 4+ Person Household | 155 | 11.0% |
| Total Housing Units | 1,410 | 100.0% |
Occupancy by Ownership by Household Size in Oracle
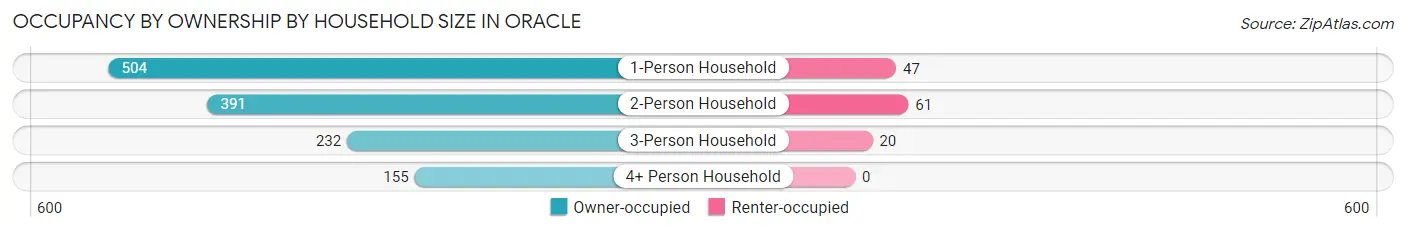
| Household Size | Owner-occupied | Renter-occupied |
| 1-Person Household | 504 (91.5%) | 47 (8.5%) |
| 2-Person Household | 391 (86.5%) | 61 (13.5%) |
| 3-Person Household | 232 (92.1%) | 20 (7.9%) |
| 4+ Person Household | 155 (100.0%) | 0 (0.0%) |
| Total Housing Units | 1,282 (90.9%) | 128 (9.1%) |
Occupancy by Educational Attainment in Oracle
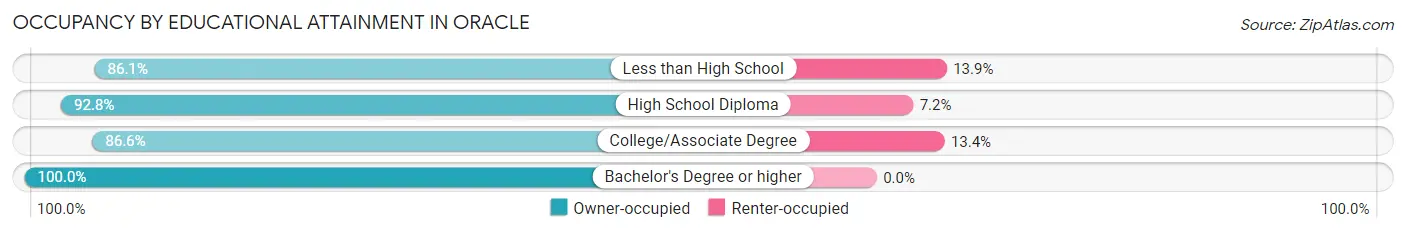
| Household Size | Owner-occupied | Renter-occupied |
| Less than High School | 124 (86.1%) | 20 (13.9%) |
| High School Diploma | 282 (92.8%) | 22 (7.2%) |
| College/Associate Degree | 554 (86.6%) | 86 (13.4%) |
| Bachelor's Degree or higher | 322 (100.0%) | 0 (0.0%) |
Occupancy by Age of Householder in Oracle
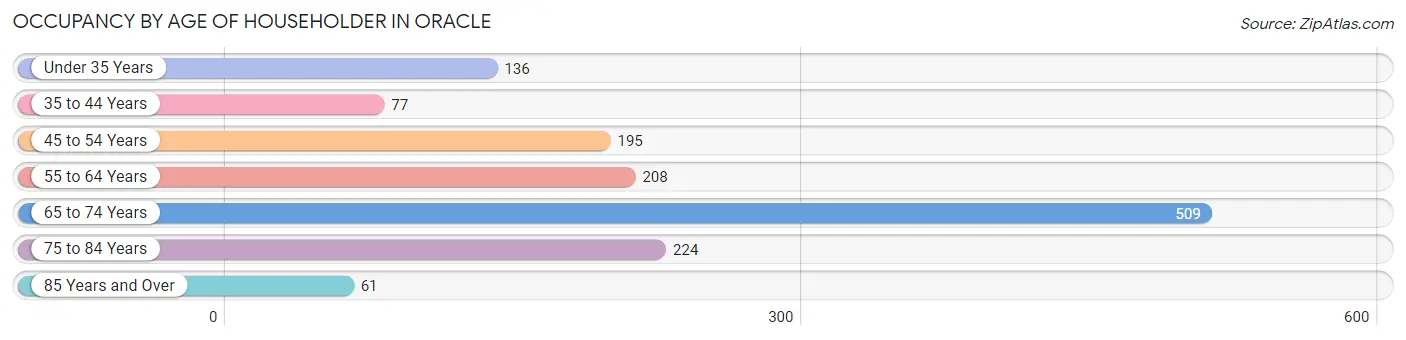
| Age Bracket | # Households | % Households |
| Under 35 Years | 136 | 9.7% |
| 35 to 44 Years | 77 | 5.5% |
| 45 to 54 Years | 195 | 13.8% |
| 55 to 64 Years | 208 | 14.7% |
| 65 to 74 Years | 509 | 36.1% |
| 75 to 84 Years | 224 | 15.9% |
| 85 Years and Over | 61 | 4.3% |
| Total | 1,410 | 100.0% |
Housing Finances in Oracle
Median Income by Occupancy in Oracle
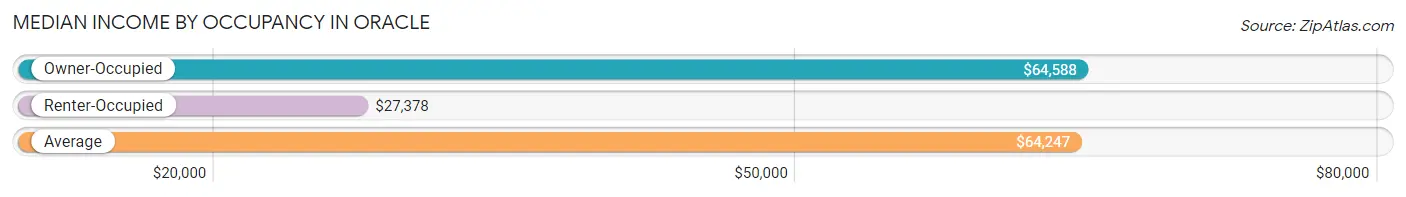
| Occupancy Type | # Households | Median Income |
| Owner-Occupied | 1,282 (90.9%) | $64,588 |
| Renter-Occupied | 128 (9.1%) | $27,378 |
| Average | 1,410 (100.0%) | $64,247 |
Occupancy by Householder Income Bracket in Oracle
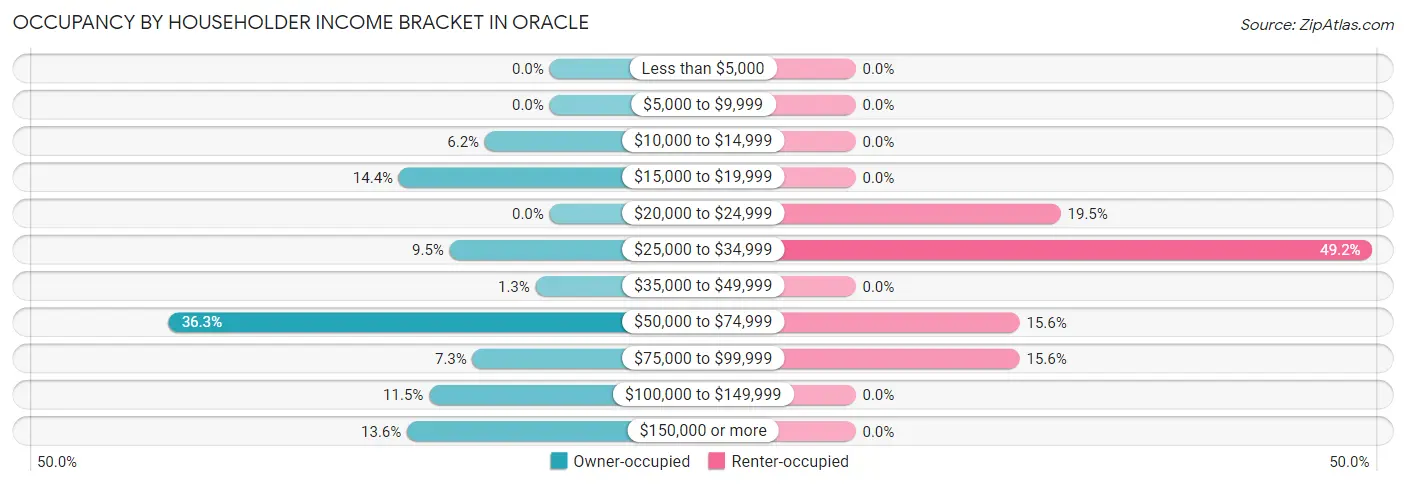
| Income Bracket | Owner-occupied | Renter-occupied |
| Less than $5,000 | 0 (0.0%) | 0 (0.0%) |
| $5,000 to $9,999 | 0 (0.0%) | 0 (0.0%) |
| $10,000 to $14,999 | 79 (6.2%) | 0 (0.0%) |
| $15,000 to $19,999 | 184 (14.3%) | 0 (0.0%) |
| $20,000 to $24,999 | 0 (0.0%) | 25 (19.5%) |
| $25,000 to $34,999 | 122 (9.5%) | 63 (49.2%) |
| $35,000 to $49,999 | 17 (1.3%) | 0 (0.0%) |
| $50,000 to $74,999 | 465 (36.3%) | 20 (15.6%) |
| $75,000 to $99,999 | 94 (7.3%) | 20 (15.6%) |
| $100,000 to $149,999 | 147 (11.5%) | 0 (0.0%) |
| $150,000 or more | 174 (13.6%) | 0 (0.0%) |
| Total | 1,282 (100.0%) | 128 (100.0%) |
Monthly Housing Cost Tiers in Oracle
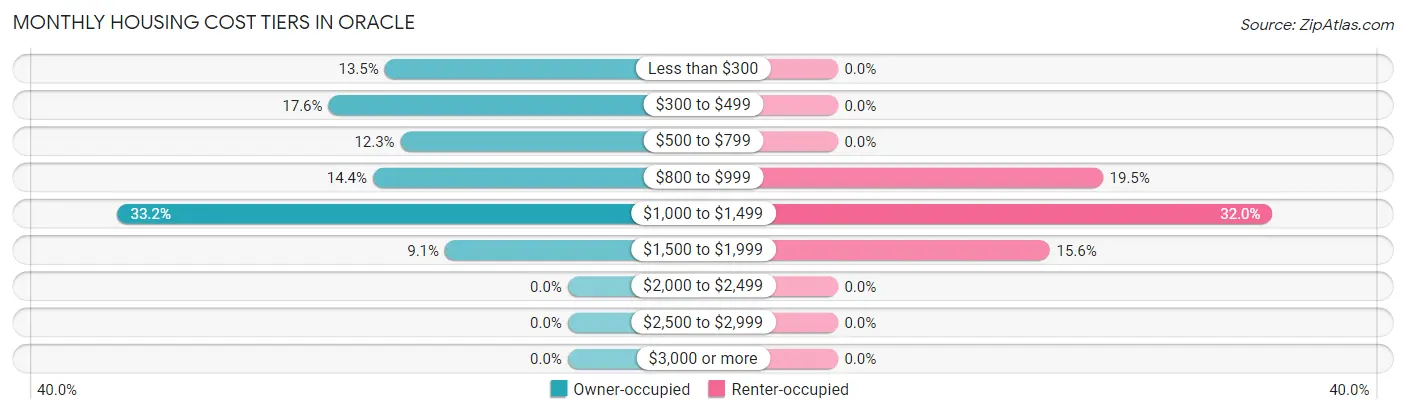
| Monthly Cost | Owner-occupied | Renter-occupied |
| Less than $300 | 173 (13.5%) | 0 (0.0%) |
| $300 to $499 | 226 (17.6%) | 0 (0.0%) |
| $500 to $799 | 158 (12.3%) | 0 (0.0%) |
| $800 to $999 | 184 (14.3%) | 25 (19.5%) |
| $1,000 to $1,499 | 425 (33.2%) | 41 (32.0%) |
| $1,500 to $1,999 | 116 (9.0%) | 20 (15.6%) |
| $2,000 to $2,499 | 0 (0.0%) | 0 (0.0%) |
| $2,500 to $2,999 | 0 (0.0%) | 0 (0.0%) |
| $3,000 or more | 0 (0.0%) | 0 (0.0%) |
| Total | 1,282 (100.0%) | 128 (100.0%) |
Physical Housing Characteristics in Oracle
Housing Structures in Oracle
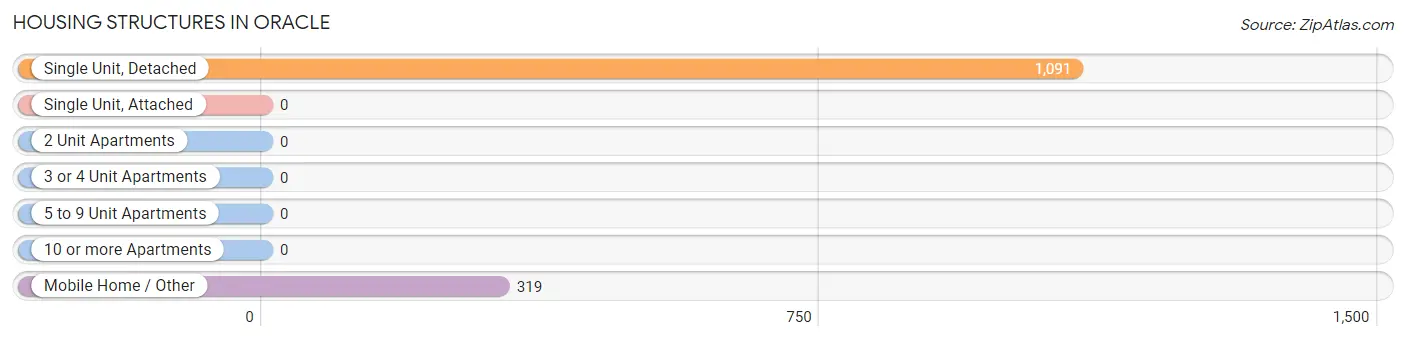
| Structure Type | # Housing Units | % Housing Units |
| Single Unit, Detached | 1,091 | 77.4% |
| Single Unit, Attached | 0 | 0.0% |
| 2 Unit Apartments | 0 | 0.0% |
| 3 or 4 Unit Apartments | 0 | 0.0% |
| 5 to 9 Unit Apartments | 0 | 0.0% |
| 10 or more Apartments | 0 | 0.0% |
| Mobile Home / Other | 319 | 22.6% |
| Total | 1,410 | 100.0% |
Housing Structures by Occupancy in Oracle
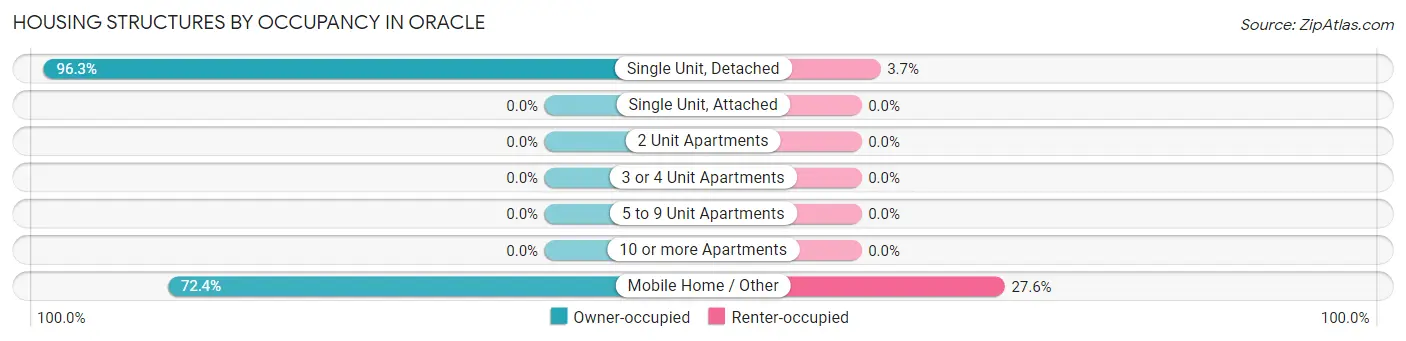
| Structure Type | Owner-occupied | Renter-occupied |
| Single Unit, Detached | 1,051 (96.3%) | 40 (3.7%) |
| Single Unit, Attached | 0 (0.0%) | 0 (0.0%) |
| 2 Unit Apartments | 0 (0.0%) | 0 (0.0%) |
| 3 or 4 Unit Apartments | 0 (0.0%) | 0 (0.0%) |
| 5 to 9 Unit Apartments | 0 (0.0%) | 0 (0.0%) |
| 10 or more Apartments | 0 (0.0%) | 0 (0.0%) |
| Mobile Home / Other | 231 (72.4%) | 88 (27.6%) |
| Total | 1,282 (90.9%) | 128 (9.1%) |
Housing Structures by Number of Rooms in Oracle
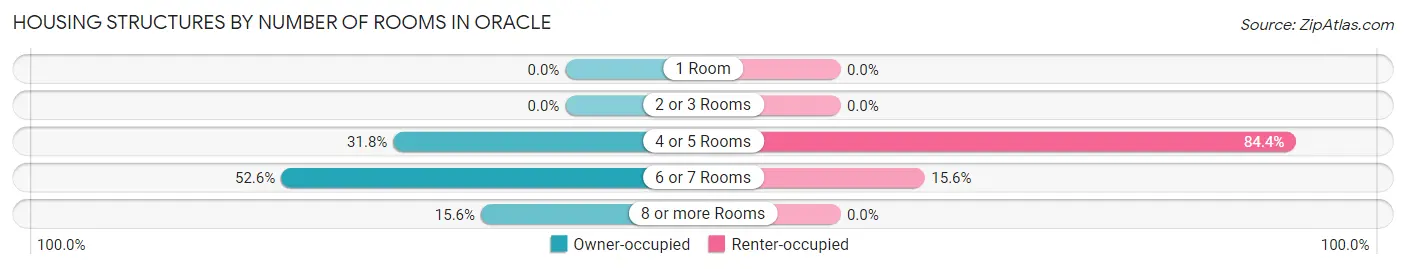
| Number of Rooms | Owner-occupied | Renter-occupied |
| 1 Room | 0 (0.0%) | 0 (0.0%) |
| 2 or 3 Rooms | 0 (0.0%) | 0 (0.0%) |
| 4 or 5 Rooms | 408 (31.8%) | 108 (84.4%) |
| 6 or 7 Rooms | 674 (52.6%) | 20 (15.6%) |
| 8 or more Rooms | 200 (15.6%) | 0 (0.0%) |
| Total | 1,282 (100.0%) | 128 (100.0%) |
Housing Structure by Heating Type in Oracle
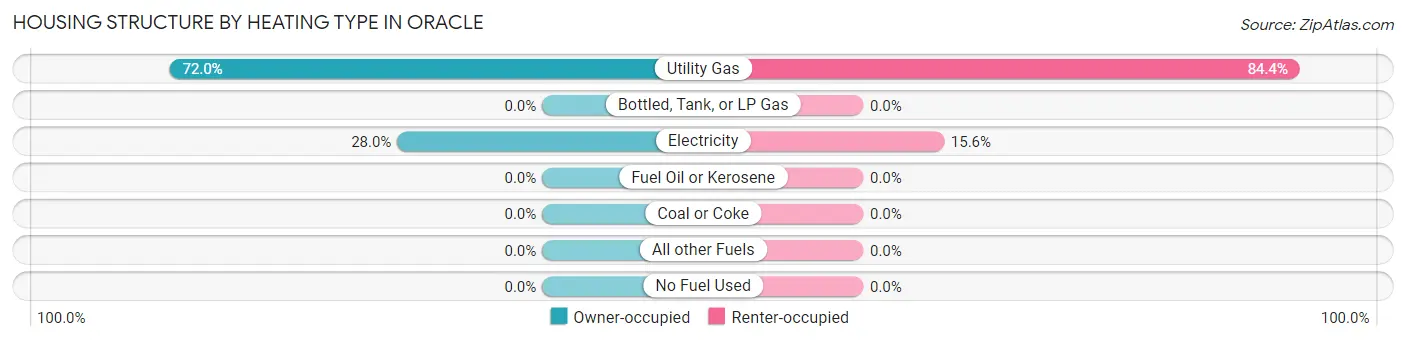
| Heating Type | Owner-occupied | Renter-occupied |
| Utility Gas | 923 (72.0%) | 108 (84.4%) |
| Bottled, Tank, or LP Gas | 0 (0.0%) | 0 (0.0%) |
| Electricity | 359 (28.0%) | 20 (15.6%) |
| Fuel Oil or Kerosene | 0 (0.0%) | 0 (0.0%) |
| Coal or Coke | 0 (0.0%) | 0 (0.0%) |
| All other Fuels | 0 (0.0%) | 0 (0.0%) |
| No Fuel Used | 0 (0.0%) | 0 (0.0%) |
| Total | 1,282 (100.0%) | 128 (100.0%) |
Household Vehicle Usage in Oracle
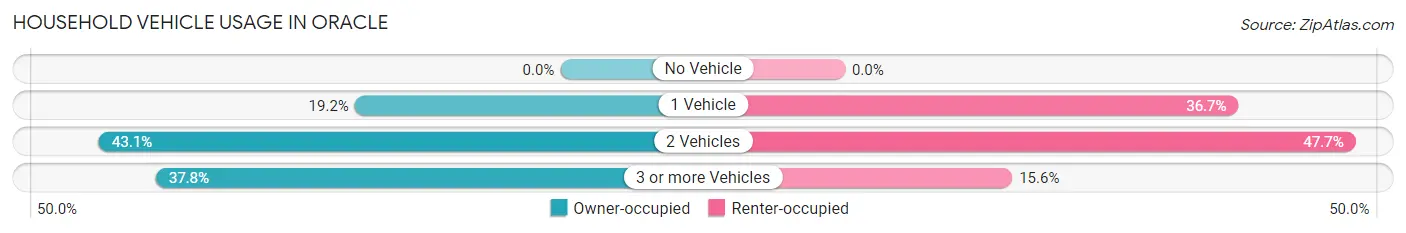
| Vehicles per Household | Owner-occupied | Renter-occupied |
| No Vehicle | 0 (0.0%) | 0 (0.0%) |
| 1 Vehicle | 246 (19.2%) | 47 (36.7%) |
| 2 Vehicles | 552 (43.1%) | 61 (47.7%) |
| 3 or more Vehicles | 484 (37.8%) | 20 (15.6%) |
| Total | 1,282 (100.0%) | 128 (100.0%) |
Real Estate & Mortgages in Oracle
Real Estate and Mortgage Overview in Oracle
| Characteristic | Without Mortgage | With Mortgage |
| Housing Units | 557 | 725 |
| Median Property Value | $209,000 | $180,600 |
| Median Household Income | $65,780 | $103 |
| Monthly Housing Costs | $398 | $0 |
| Real Estate Taxes | $1,060 | $0 |
Property Value by Mortgage Status in Oracle
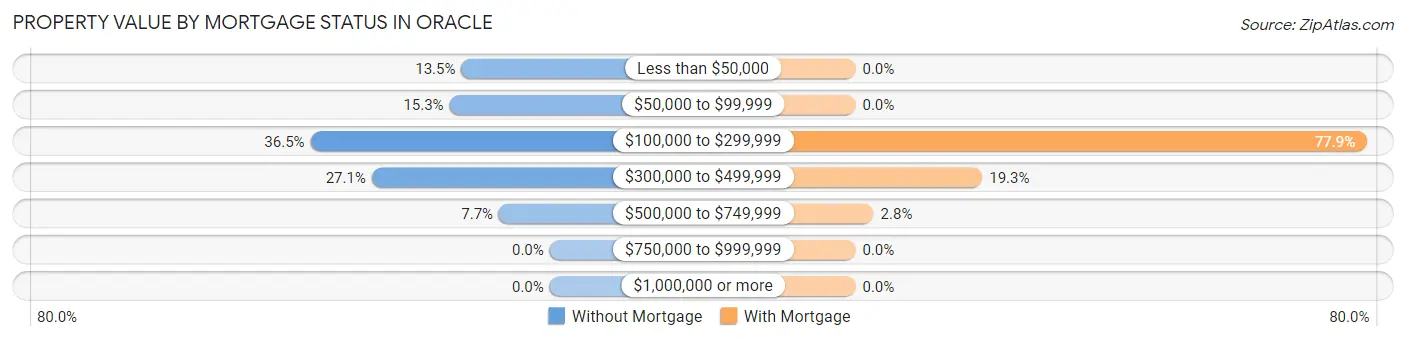
| Property Value | Without Mortgage | With Mortgage |
| Less than $50,000 | 75 (13.5%) | 0 (0.0%) |
| $50,000 to $99,999 | 85 (15.3%) | 0 (0.0%) |
| $100,000 to $299,999 | 203 (36.4%) | 565 (77.9%) |
| $300,000 to $499,999 | 151 (27.1%) | 140 (19.3%) |
| $500,000 to $749,999 | 43 (7.7%) | 20 (2.8%) |
| $750,000 to $999,999 | 0 (0.0%) | 0 (0.0%) |
| $1,000,000 or more | 0 (0.0%) | 0 (0.0%) |
| Total | 557 (100.0%) | 725 (100.0%) |
Household Income by Mortgage Status in Oracle
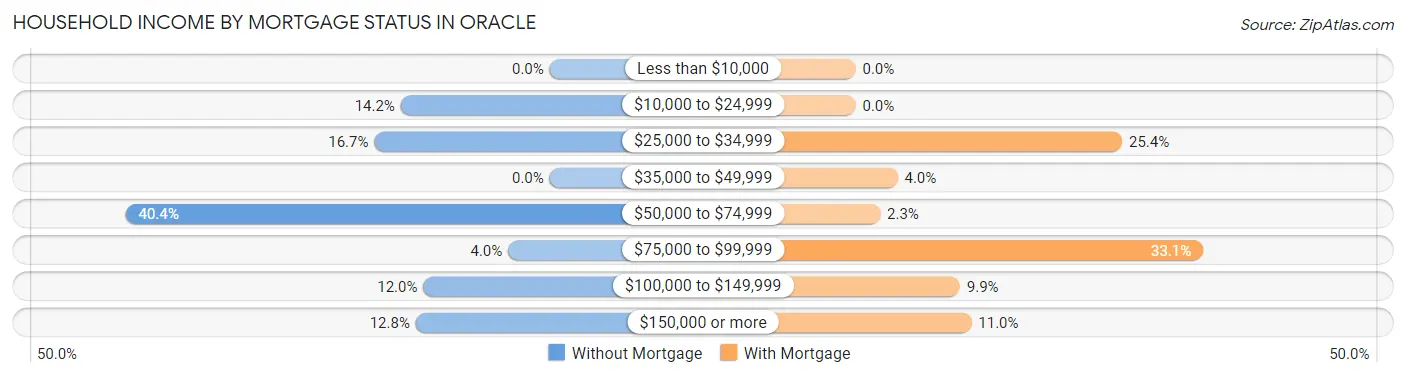
| Household Income | Without Mortgage | With Mortgage |
| Less than $10,000 | 0 (0.0%) | 0 (0.0%) |
| $10,000 to $24,999 | 79 (14.2%) | 0 (0.0%) |
| $25,000 to $34,999 | 93 (16.7%) | 184 (25.4%) |
| $35,000 to $49,999 | 0 (0.0%) | 29 (4.0%) |
| $50,000 to $74,999 | 225 (40.4%) | 17 (2.3%) |
| $75,000 to $99,999 | 22 (4.0%) | 240 (33.1%) |
| $100,000 to $149,999 | 67 (12.0%) | 72 (9.9%) |
| $150,000 or more | 71 (12.8%) | 80 (11.0%) |
| Total | 557 (100.0%) | 725 (100.0%) |
Property Value to Household Income Ratio in Oracle
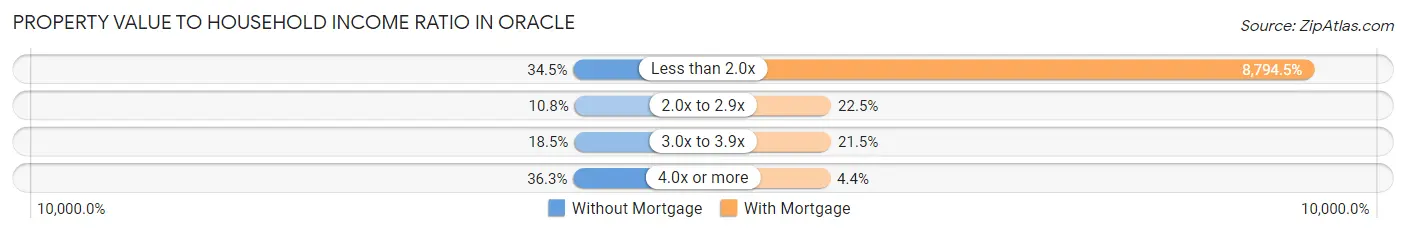
| Value-to-Income Ratio | Without Mortgage | With Mortgage |
| Less than 2.0x | 192 (34.5%) | 63,760 (8,794.5%) |
| 2.0x to 2.9x | 60 (10.8%) | 163 (22.5%) |
| 3.0x to 3.9x | 103 (18.5%) | 156 (21.5%) |
| 4.0x or more | 202 (36.3%) | 32 (4.4%) |
| Total | 557 (100.0%) | 725 (100.0%) |
Real Estate Taxes by Mortgage Status in Oracle
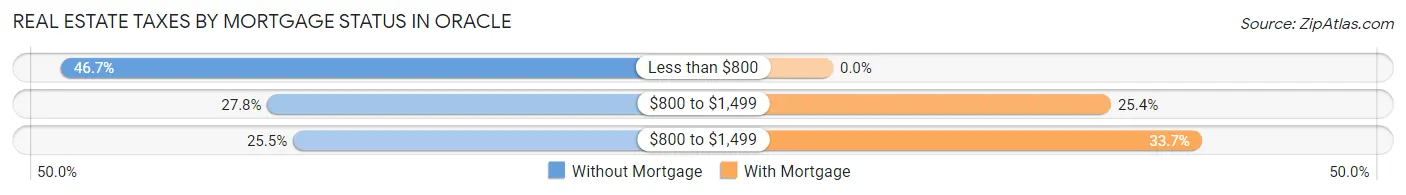
| Property Taxes | Without Mortgage | With Mortgage |
| Less than $800 | 260 (46.7%) | 0 (0.0%) |
| $800 to $1,499 | 155 (27.8%) | 184 (25.4%) |
| $800 to $1,499 | 142 (25.5%) | 244 (33.7%) |
| Total | 557 (100.0%) | 725 (100.0%) |
Health & Disability in Oracle
Health Insurance Coverage by Age in Oracle
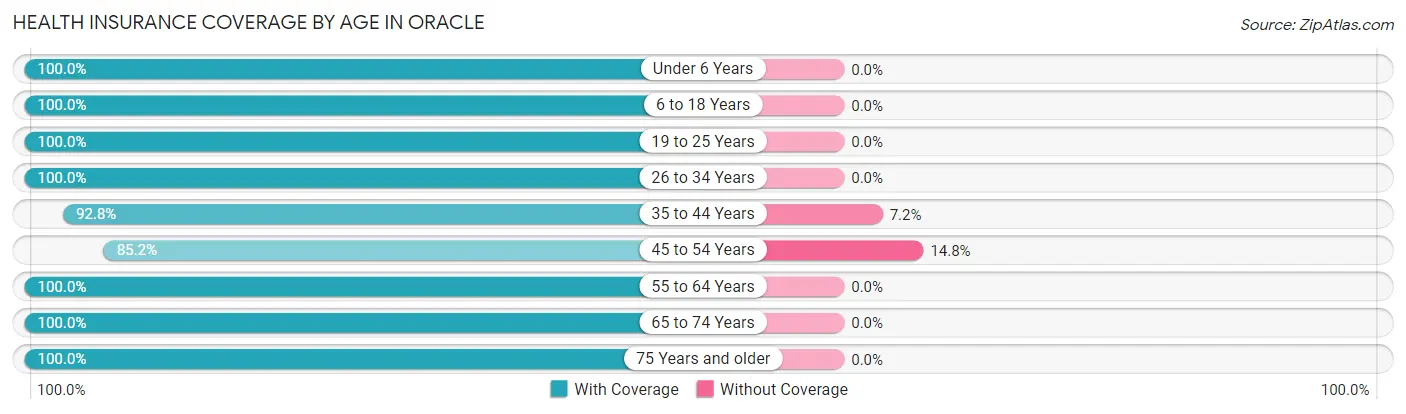
| Age Bracket | With Coverage | Without Coverage |
| Under 6 Years | 46 (100.0%) | 0 (0.0%) |
| 6 to 18 Years | 549 (100.0%) | 0 (0.0%) |
| 19 to 25 Years | 120 (100.0%) | 0 (0.0%) |
| 26 to 34 Years | 226 (100.0%) | 0 (0.0%) |
| 35 to 44 Years | 311 (92.8%) | 24 (7.2%) |
| 45 to 54 Years | 335 (85.2%) | 58 (14.8%) |
| 55 to 64 Years | 380 (100.0%) | 0 (0.0%) |
| 65 to 74 Years | 666 (100.0%) | 0 (0.0%) |
| 75 Years and older | 431 (100.0%) | 0 (0.0%) |
| Total | 3,064 (97.4%) | 82 (2.6%) |
Health Insurance Coverage by Citizenship Status in Oracle
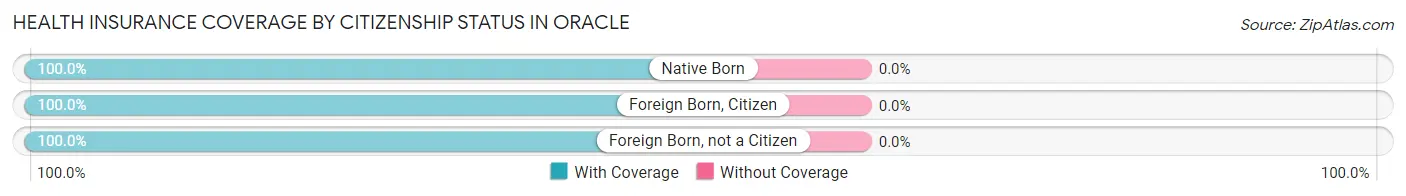
| Citizenship Status | With Coverage | Without Coverage |
| Native Born | 46 (100.0%) | 0 (0.0%) |
| Foreign Born, Citizen | 549 (100.0%) | 0 (0.0%) |
| Foreign Born, not a Citizen | 120 (100.0%) | 0 (0.0%) |
Health Insurance Coverage by Household Income in Oracle
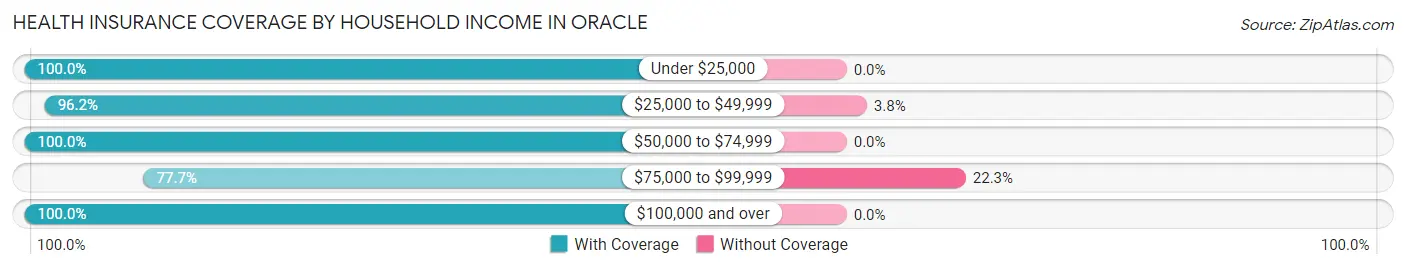
| Household Income | With Coverage | Without Coverage |
| Under $25,000 | 288 (100.0%) | 0 (0.0%) |
| $25,000 to $49,999 | 613 (96.2%) | 24 (3.8%) |
| $50,000 to $74,999 | 1,300 (100.0%) | 0 (0.0%) |
| $75,000 to $99,999 | 202 (77.7%) | 58 (22.3%) |
| $100,000 and over | 661 (100.0%) | 0 (0.0%) |
Public vs Private Health Insurance Coverage by Age in Oracle
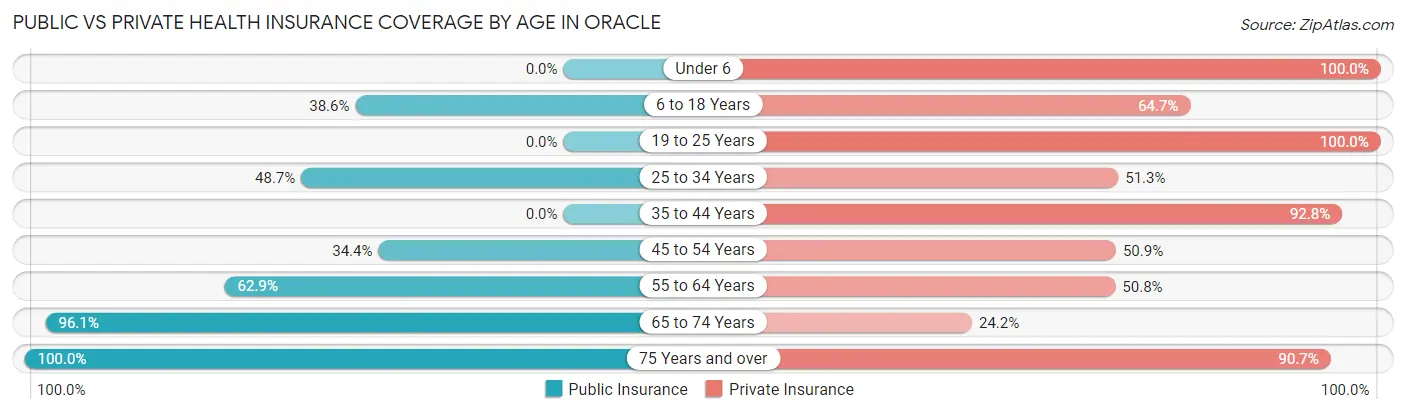
| Age Bracket | Public Insurance | Private Insurance |
| Under 6 | 0 (0.0%) | 46 (100.0%) |
| 6 to 18 Years | 212 (38.6%) | 355 (64.7%) |
| 19 to 25 Years | 0 (0.0%) | 120 (100.0%) |
| 25 to 34 Years | 110 (48.7%) | 116 (51.3%) |
| 35 to 44 Years | 0 (0.0%) | 311 (92.8%) |
| 45 to 54 Years | 135 (34.4%) | 200 (50.9%) |
| 55 to 64 Years | 239 (62.9%) | 193 (50.8%) |
| 65 to 74 Years | 640 (96.1%) | 161 (24.2%) |
| 75 Years and over | 431 (100.0%) | 391 (90.7%) |
| Total | 1,767 (56.2%) | 1,893 (60.2%) |
Disability Status by Sex by Age in Oracle
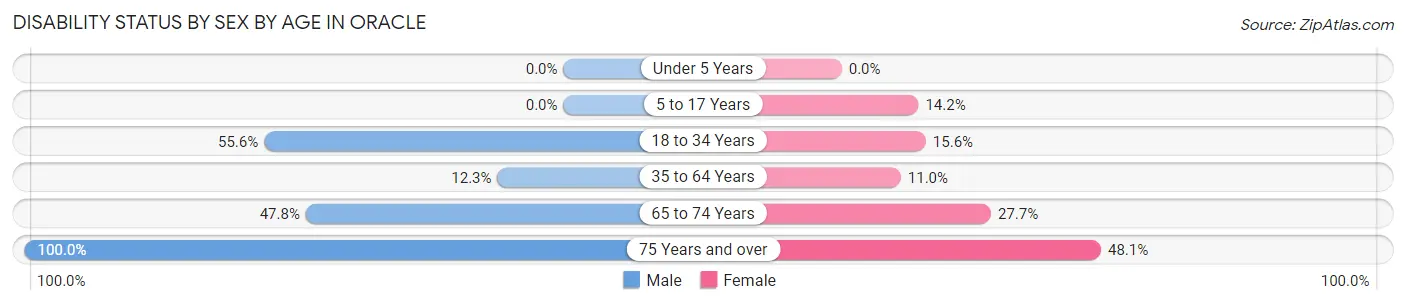
| Age Bracket | Male | Female |
| Under 5 Years | 0 (0.0%) | 0 (0.0%) |
| 5 to 17 Years | 0 (0.0%) | 39 (14.2%) |
| 18 to 34 Years | 25 (55.6%) | 47 (15.6%) |
| 35 to 64 Years | 81 (12.2%) | 49 (11.0%) |
| 65 to 74 Years | 208 (47.8%) | 64 (27.7%) |
| 75 Years and over | 192 (100.0%) | 115 (48.1%) |
Disability Class by Sex by Age in Oracle
Disability Class: Hearing Difficulty
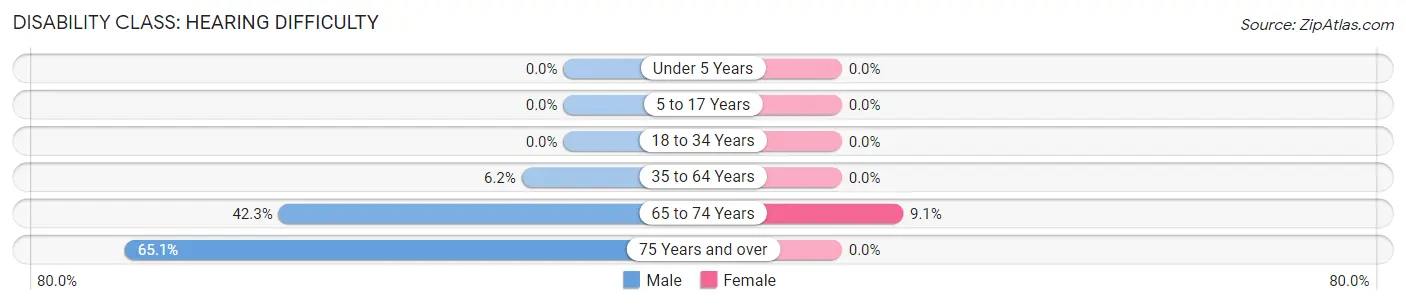
| Age Bracket | Male | Female |
| Under 5 Years | 0 (0.0%) | 0 (0.0%) |
| 5 to 17 Years | 0 (0.0%) | 0 (0.0%) |
| 18 to 34 Years | 0 (0.0%) | 0 (0.0%) |
| 35 to 64 Years | 41 (6.2%) | 0 (0.0%) |
| 65 to 74 Years | 184 (42.3%) | 21 (9.1%) |
| 75 Years and over | 125 (65.1%) | 0 (0.0%) |
Disability Class: Vision Difficulty
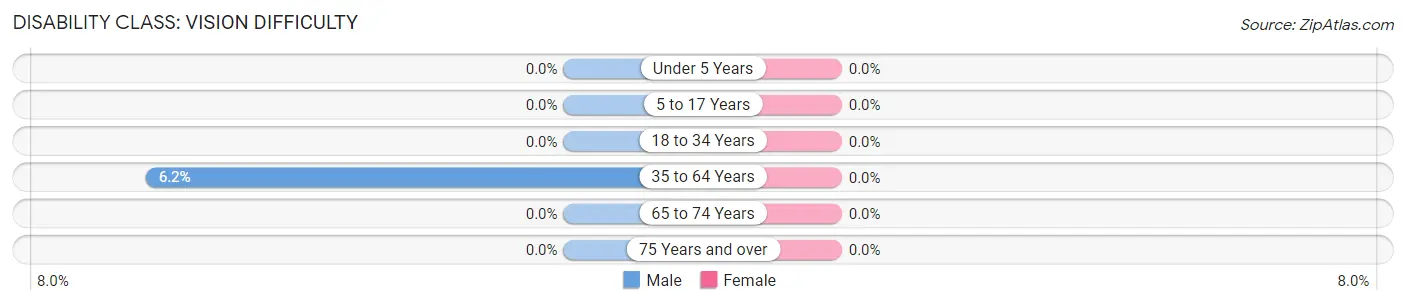
| Age Bracket | Male | Female |
| Under 5 Years | 0 (0.0%) | 0 (0.0%) |
| 5 to 17 Years | 0 (0.0%) | 0 (0.0%) |
| 18 to 34 Years | 0 (0.0%) | 0 (0.0%) |
| 35 to 64 Years | 41 (6.2%) | 0 (0.0%) |
| 65 to 74 Years | 0 (0.0%) | 0 (0.0%) |
| 75 Years and over | 0 (0.0%) | 0 (0.0%) |
Disability Class: Cognitive Difficulty
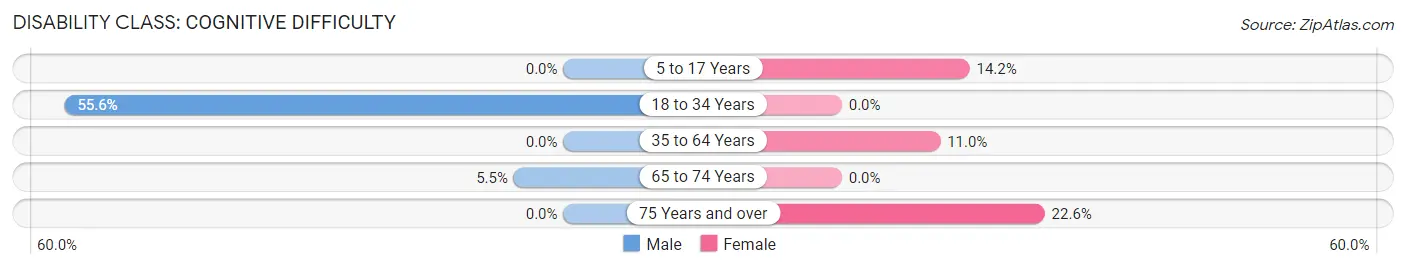
| Age Bracket | Male | Female |
| 5 to 17 Years | 0 (0.0%) | 39 (14.2%) |
| 18 to 34 Years | 25 (55.6%) | 0 (0.0%) |
| 35 to 64 Years | 0 (0.0%) | 49 (11.0%) |
| 65 to 74 Years | 24 (5.5%) | 0 (0.0%) |
| 75 Years and over | 0 (0.0%) | 54 (22.6%) |
Disability Class: Ambulatory Difficulty
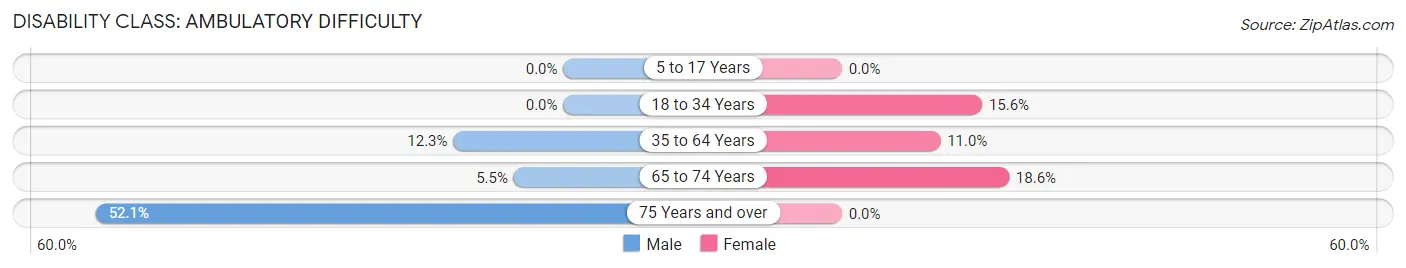
| Age Bracket | Male | Female |
| 5 to 17 Years | 0 (0.0%) | 0 (0.0%) |
| 18 to 34 Years | 0 (0.0%) | 47 (15.6%) |
| 35 to 64 Years | 81 (12.2%) | 49 (11.0%) |
| 65 to 74 Years | 24 (5.5%) | 43 (18.6%) |
| 75 Years and over | 100 (52.1%) | 0 (0.0%) |
Disability Class: Self-Care Difficulty
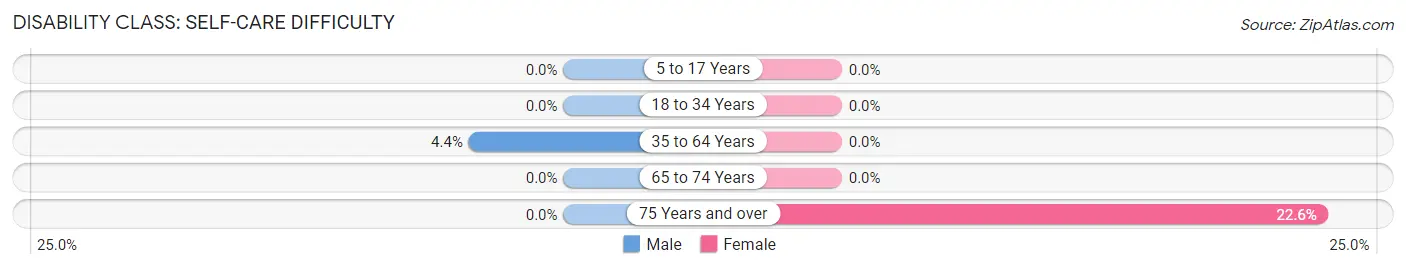
| Age Bracket | Male | Female |
| 5 to 17 Years | 0 (0.0%) | 0 (0.0%) |
| 18 to 34 Years | 0 (0.0%) | 0 (0.0%) |
| 35 to 64 Years | 29 (4.4%) | 0 (0.0%) |
| 65 to 74 Years | 0 (0.0%) | 0 (0.0%) |
| 75 Years and over | 0 (0.0%) | 54 (22.6%) |
Technology Access in Oracle
Computing Device Access in Oracle
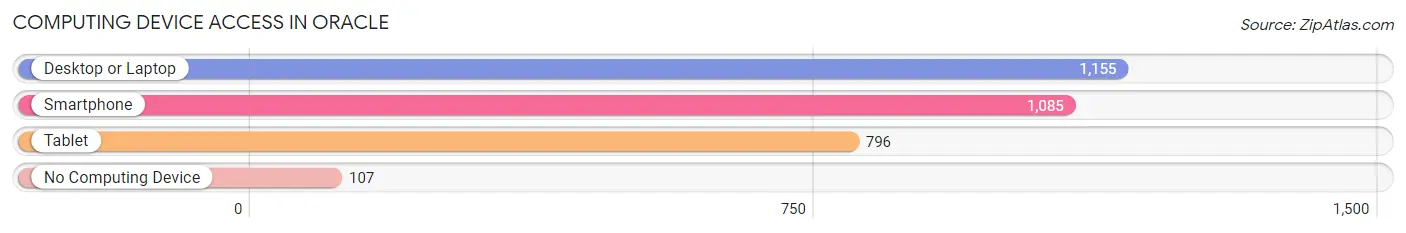
| Device Type | # Households | % Households |
| Desktop or Laptop | 1,155 | 81.9% |
| Smartphone | 1,085 | 76.9% |
| Tablet | 796 | 56.5% |
| No Computing Device | 107 | 7.6% |
| Total | 1,410 | 100.0% |
Internet Access in Oracle
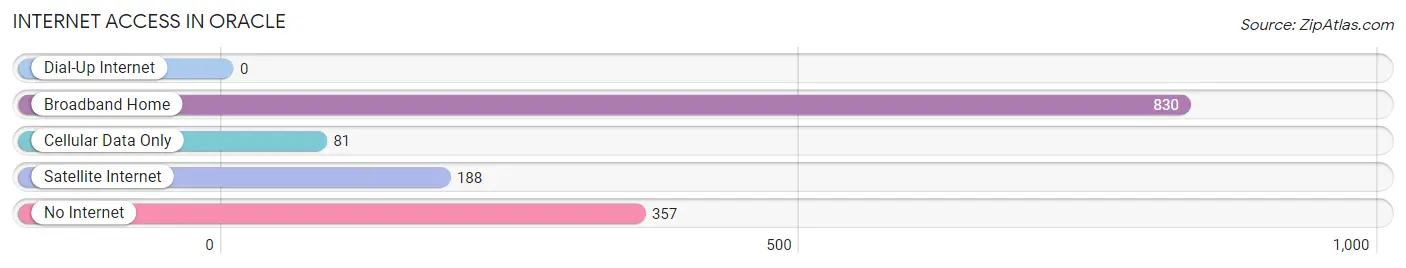
| Internet Type | # Households | % Households |
| Dial-Up Internet | 0 | 0.0% |
| Broadband Home | 830 | 58.9% |
| Cellular Data Only | 81 | 5.7% |
| Satellite Internet | 188 | 13.3% |
| No Internet | 357 | 25.3% |
| Total | 1,410 | 100.0% |
Oracle Summary
Oracle, Arizona is a small unincorporated community located in the foothills of the Santa Catalina Mountains in Pinal County, Arizona. It is situated at the junction of State Route 77 and State Route 79, approximately 40 miles north of Tucson. Oracle is a rural community with a population of approximately 3,500 people, and is known for its scenic beauty and outdoor recreational opportunities.
History
Oracle was founded in 1878 by a group of miners who were searching for silver and gold in the nearby hills. The town was originally called “Miners Camp”, but was later renamed “Oracle” after the nearby Oracle Mine. The mine was discovered in 1879 and was one of the most productive silver and gold mines in the area. The town grew rapidly and by the early 1900s, it had become a bustling mining town with a population of over 1,000 people.
The town’s economy was largely based on the mining industry, but it also had a thriving agricultural sector. The area was known for its citrus and apple orchards, as well as its cattle and sheep ranches. The town also had a number of stores, saloons, and other businesses.
In the early 1900s, the town began to decline as the mining industry began to decline. By the 1950s, the population had dropped to just over 500 people. In the 1970s, the town began to experience a resurgence as people began to move to the area for its scenic beauty and outdoor recreational opportunities.
Geography
Oracle is located in the foothills of the Santa Catalina Mountains in Pinal County, Arizona. It is situated at the junction of State Route 77 and State Route 79, approximately 40 miles north of Tucson. The town is surrounded by the Coronado National Forest and is located at an elevation of 4,500 feet.
The climate in Oracle is semi-arid, with hot summers and mild winters. The average annual temperature is approximately 70 degrees Fahrenheit. The area receives an average of 12 inches of precipitation per year, with most of it falling in the summer months.
Economy
Oracle’s economy is largely based on tourism and outdoor recreation. The town is home to several resorts and campgrounds, as well as a number of restaurants and other businesses catering to tourists. The town is also home to a number of art galleries and other businesses that cater to the local population.
The town is also home to a number of small businesses, including a grocery store, a hardware store, and a gas station. The town also has a post office and a library.
Demographics
As of the 2010 census, Oracle had a population of 3,686 people. The racial makeup of the town was 94.3% White, 0.7% African American, 0.7% Native American, 0.3% Asian, 0.1% Pacific Islander, 2.2% from other races, and 1.9% from two or more races. Hispanic or Latino of any race were 8.2% of the population.
The median income for a household in Oracle was $37,917, and the median income for a family was $41,250. The per capita income for the town was $17,945. About 11.2% of families and 14.2% of the population were below the poverty line, including 18.2% of those under age 18 and 8.3% of those age 65 or over.
Common Questions
What is Per Capita Income in Oracle?
Per Capita income in Oracle is $52,145.
What is the Median Family Income in Oracle?
Median Family Income in Oracle is $70,273.
What is the Median Household income in Oracle?
Median Household Income in Oracle is $64,247.
What is Inequality or Gini Index in Oracle?
Inequality or Gini Index in Oracle is 0.60.
What is the Total Population of Oracle?
Total Population of Oracle is 3,146.
What is the Total Male Population of Oracle?
Total Male Population of Oracle is 1,608.
What is the Total Female Population of Oracle?
Total Female Population of Oracle is 1,538.
What is the Ratio of Males per 100 Females in Oracle?
There are 104.55 Males per 100 Females in Oracle.
What is the Ratio of Females per 100 Males in Oracle?
There are 95.65 Females per 100 Males in Oracle.
What is the Median Population Age in Oracle?
Median Population Age in Oracle is 51.2 Years.
What is the Average Family Size in Oracle
Average Family Size in Oracle is 2.9 People.
What is the Average Household Size in Oracle
Average Household Size in Oracle is 2.2 People.
How Large is the Labor Force in Oracle?
There are 1,395 People in the Labor Forcein in Oracle.
What is the Percentage of People in the Labor Force in Oracle?
53.5% of People are in the Labor Force in Oracle.
What is the Unemployment Rate in Oracle?
Unemployment Rate in Oracle is 1.7%.