Mammoth, AZ Map & Demographics
Mammoth Map
Mammoth Overview
$21,101
PER CAPITA INCOME
$61,250
AVG FAMILY INCOME
$42,650
AVG HOUSEHOLD INCOME
0.44
INEQUALITY / GINI INDEX
1,014
TOTAL POPULATION
477
MALE POPULATION
537
FEMALE POPULATION
88.83
MALES / 100 FEMALES
112.58
FEMALES / 100 MALES
56.9
MEDIAN AGE
2.9
AVG FAMILY SIZE
2.4
AVG HOUSEHOLD SIZE
354
LABOR FORCE [ PEOPLE ]
40.4%
PERCENT IN LABOR FORCE
17.2%
UNEMPLOYMENT RATE
Mammoth Zip Codes
Mammoth Area Codes
Income in Mammoth
Income Overview in Mammoth
Per Capita Income in Mammoth is $21,101, while median incomes of families and households are $61,250 and $42,650 respectively.
| Characteristic | Number | Measure |
| Per Capita Income | 1,014 | $21,101 |
| Median Family Income | 257 | $61,250 |
| Mean Family Income | 257 | $64,875 |
| Median Household Income | 431 | $42,650 |
| Mean Household Income | 431 | $48,870 |
| Income Deficit | 257 | $0 |
| Wage / Income Gap (%) | 1,014 | 0.00% |
| Wage / Income Gap ($) | 1,014 | 100.00¢ per $1 |
| Gini / Inequality Index | 1,014 | 0.44 |
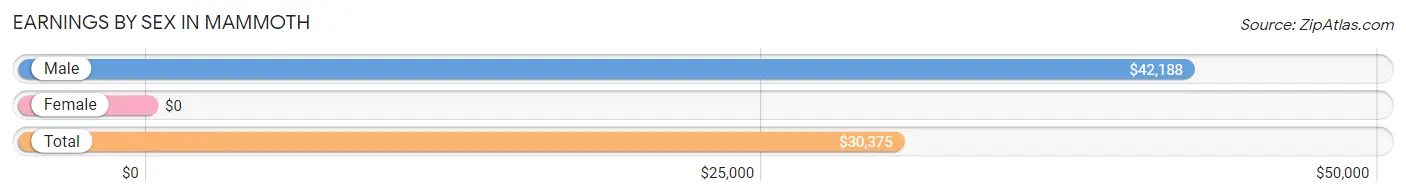
Earnings by Sex in Mammoth
| Sex | Number | Average Earnings |
| Male | 163 (47.8%) | $42,188 |
| Female | 178 (52.2%) | $0 |
| Total | 341 (100.0%) | $30,375 |
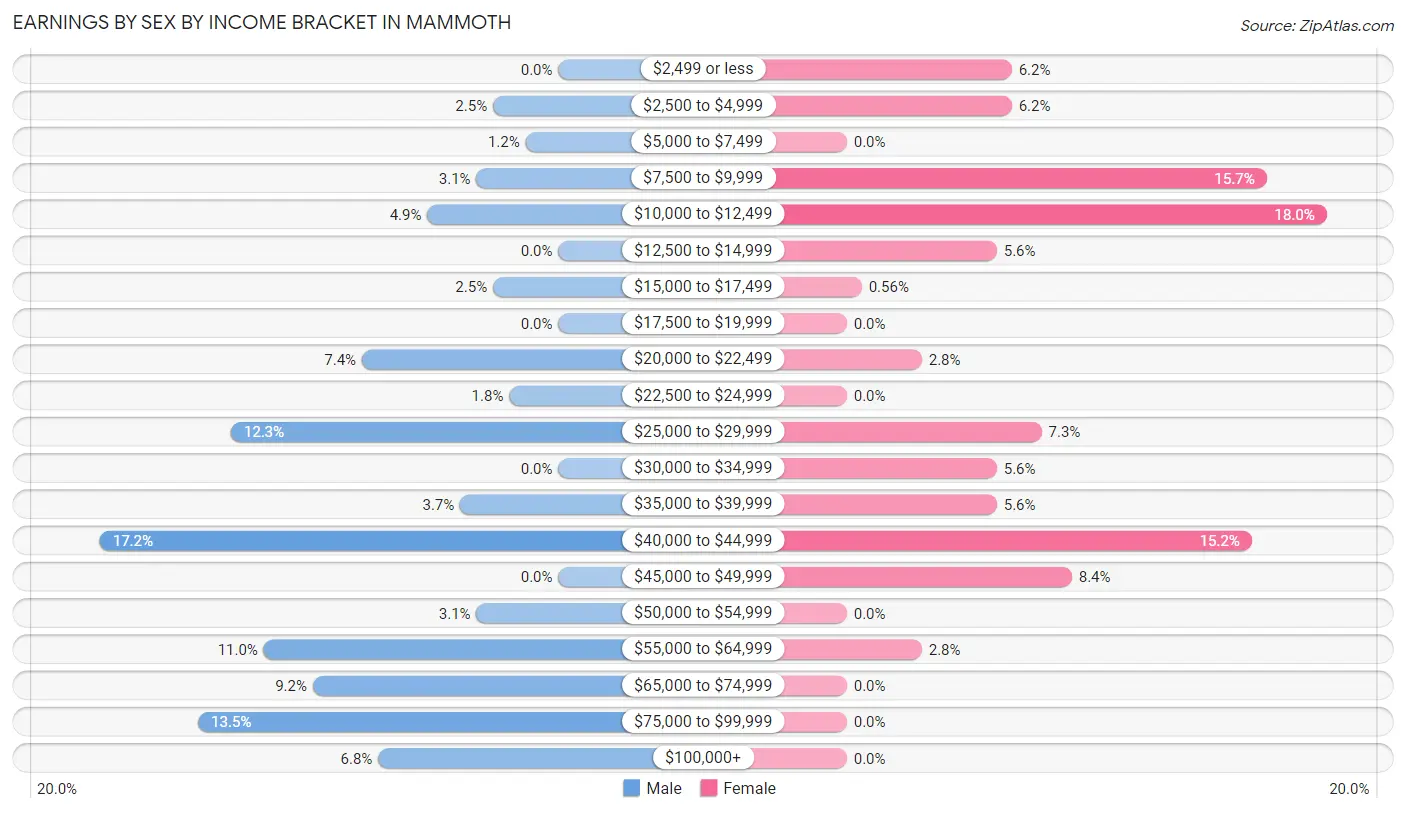
Earnings by Sex by Income Bracket in Mammoth
The most common earnings brackets in Mammoth are $40,000 to $44,999 for men (28 | 17.2%) and $10,000 to $12,499 for women (32 | 18.0%).
| Income | Male | Female |
| $2,499 or less | 0 (0.0%) | 11 (6.2%) |
| $2,500 to $4,999 | 4 (2.5%) | 11 (6.2%) |
| $5,000 to $7,499 | 2 (1.2%) | 0 (0.0%) |
| $7,500 to $9,999 | 5 (3.1%) | 28 (15.7%) |
| $10,000 to $12,499 | 8 (4.9%) | 32 (18.0%) |
| $12,500 to $14,999 | 0 (0.0%) | 10 (5.6%) |
| $15,000 to $17,499 | 4 (2.5%) | 1 (0.6%) |
| $17,500 to $19,999 | 0 (0.0%) | 0 (0.0%) |
| $20,000 to $22,499 | 12 (7.4%) | 5 (2.8%) |
| $22,500 to $24,999 | 3 (1.8%) | 0 (0.0%) |
| $25,000 to $29,999 | 20 (12.3%) | 13 (7.3%) |
| $30,000 to $34,999 | 0 (0.0%) | 10 (5.6%) |
| $35,000 to $39,999 | 6 (3.7%) | 10 (5.6%) |
| $40,000 to $44,999 | 28 (17.2%) | 27 (15.2%) |
| $45,000 to $49,999 | 0 (0.0%) | 15 (8.4%) |
| $50,000 to $54,999 | 5 (3.1%) | 0 (0.0%) |
| $55,000 to $64,999 | 18 (11.0%) | 5 (2.8%) |
| $65,000 to $74,999 | 15 (9.2%) | 0 (0.0%) |
| $75,000 to $99,999 | 22 (13.5%) | 0 (0.0%) |
| $100,000+ | 11 (6.8%) | 0 (0.0%) |
| Total | 163 (100.0%) | 178 (100.0%) |
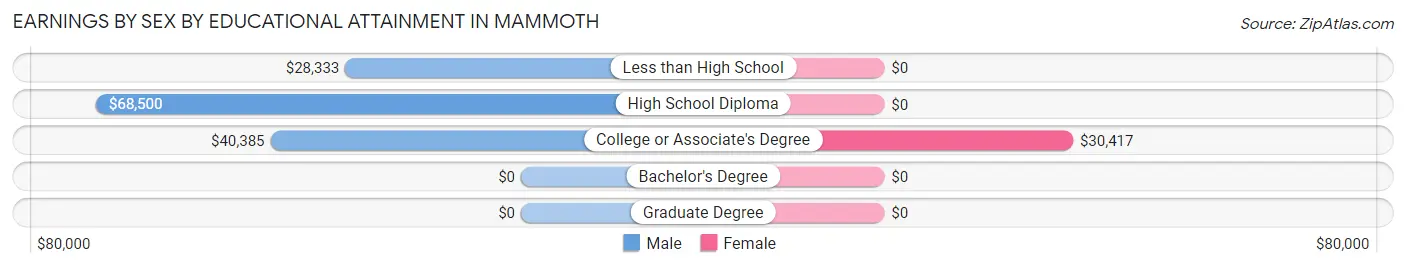
Earnings by Sex by Educational Attainment in Mammoth
| Educational Attainment | Male Income | Female Income |
| Less than High School | $28,333 | $0 |
| High School Diploma | $68,500 | $0 |
| College or Associate's Degree | $40,385 | $30,417 |
| Bachelor's Degree | - | - |
| Graduate Degree | - | - |
| Total | $42,313 | $0 |
Family Income in Mammoth
Family Income Brackets in Mammoth
According to the Mammoth family income data, there are 66 families falling into the $75,000 to $99,999 income range, which is the most common income bracket and makes up 25.7% of all families.
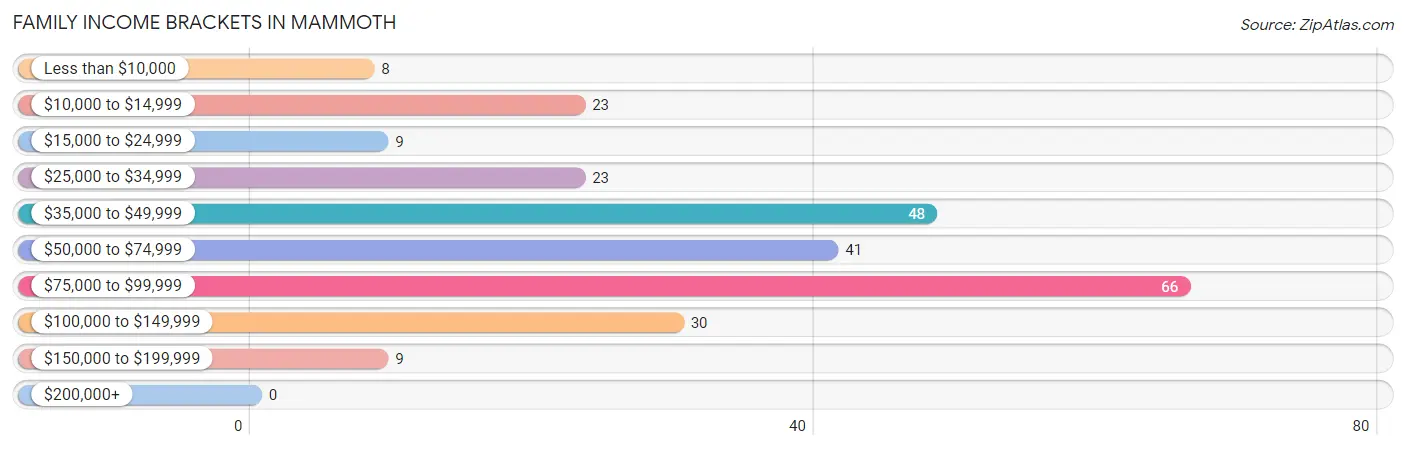
| Income Bracket | # Families | % Families |
| Less than $10,000 | 8 | 3.1% |
| $10,000 to $14,999 | 23 | 8.9% |
| $15,000 to $24,999 | 9 | 3.5% |
| $25,000 to $34,999 | 23 | 8.9% |
| $35,000 to $49,999 | 48 | 18.7% |
| $50,000 to $74,999 | 41 | 16.0% |
| $75,000 to $99,999 | 66 | 25.7% |
| $100,000 to $149,999 | 30 | 11.7% |
| $150,000 to $199,999 | 9 | 3.5% |
| $200,000+ | 0 | 0.0% |
Family Income by Famaliy Size in Mammoth
4-person families (20 | 7.8%) account for the highest median family income in Mammoth with $90,577 per family, while 2-person families (117 | 45.5%) have the highest median income of $24,760 per family member.
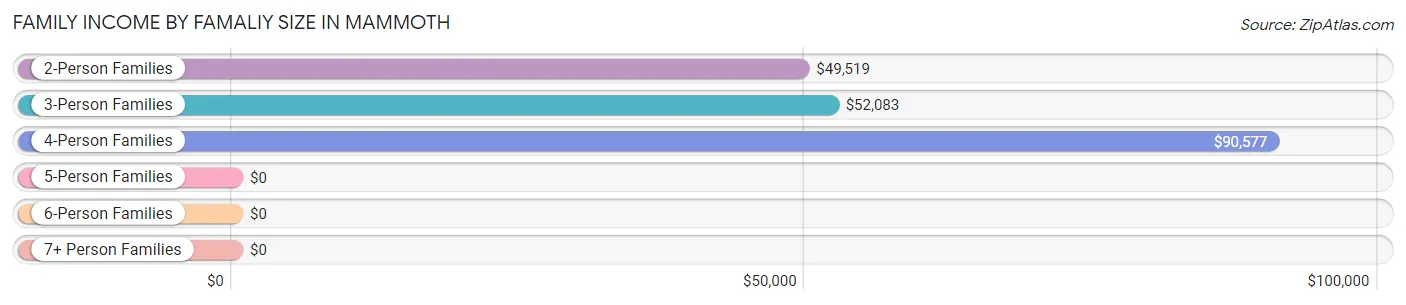
| Income Bracket | # Families | Median Income |
| 2-Person Families | 117 (45.5%) | $49,519 |
| 3-Person Families | 86 (33.5%) | $52,083 |
| 4-Person Families | 20 (7.8%) | $90,577 |
| 5-Person Families | 33 (12.8%) | $0 |
| 6-Person Families | 1 (0.4%) | $0 |
| 7+ Person Families | 0 (0.0%) | $0 |
| Total | 257 (100.0%) | $61,250 |
Family Income by Number of Earners in Mammoth
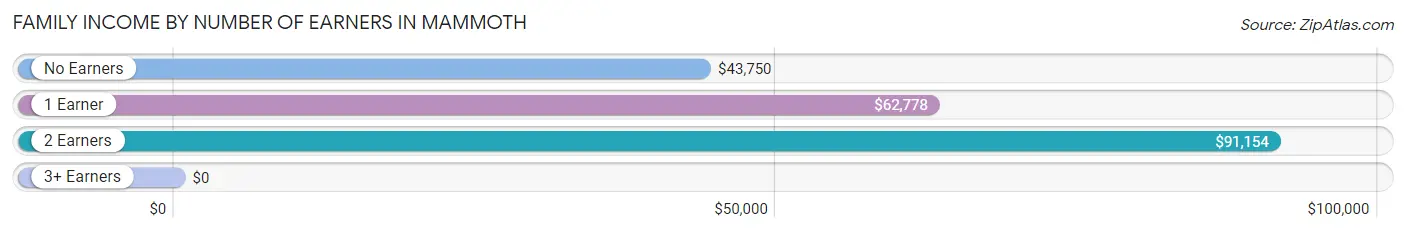
| Number of Earners | # Families | Median Income |
| No Earners | 87 (33.9%) | $43,750 |
| 1 Earner | 100 (38.9%) | $62,778 |
| 2 Earners | 52 (20.2%) | $91,154 |
| 3+ Earners | 18 (7.0%) | $0 |
| Total | 257 (100.0%) | $61,250 |
Household Income in Mammoth
Household Income Brackets in Mammoth
With 78 households falling in the category, the $35,000 to $49,999 income range is the most frequent in Mammoth, accounting for 18.1% of all households.
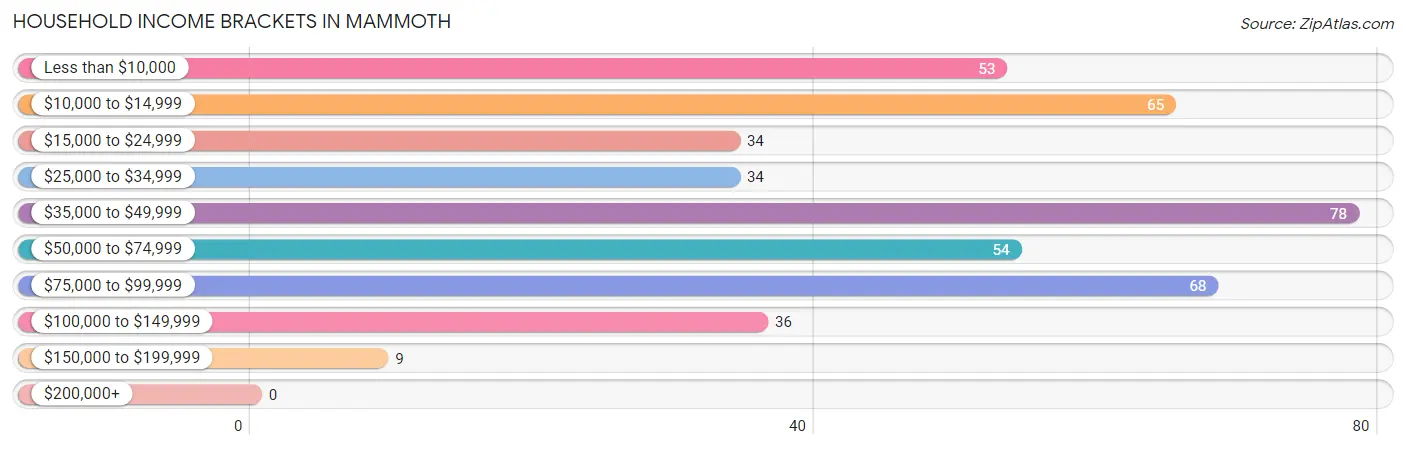
| Income Bracket | # Households | % Households |
| Less than $10,000 | 53 | 12.3% |
| $10,000 to $14,999 | 65 | 15.1% |
| $15,000 to $24,999 | 34 | 7.9% |
| $25,000 to $34,999 | 34 | 7.9% |
| $35,000 to $49,999 | 78 | 18.1% |
| $50,000 to $74,999 | 54 | 12.5% |
| $75,000 to $99,999 | 68 | 15.8% |
| $100,000 to $149,999 | 36 | 8.4% |
| $150,000 to $199,999 | 9 | 2.1% |
| $200,000+ | 0 | 0.0% |
Household Income by Householder Age in Mammoth
The median household income in Mammoth is $42,650, with the highest median household income of $43,333 found in the 45 to 64 years age bracket for the primary householder. A total of 144 households (33.4%) fall into this category.
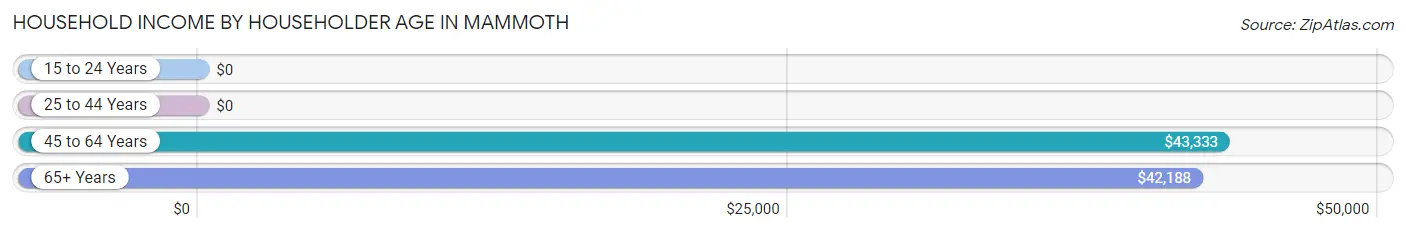
| Income Bracket | # Households | Median Income |
| 15 to 24 Years | 0 (0.0%) | $0 |
| 25 to 44 Years | 100 (23.2%) | $0 |
| 45 to 64 Years | 144 (33.4%) | $43,333 |
| 65+ Years | 187 (43.4%) | $42,188 |
| Total | 431 (100.0%) | $42,650 |
Poverty in Mammoth
Income Below Poverty by Sex and Age in Mammoth
With 24.7% poverty level for males and 30.9% for females among the residents of Mammoth, 15 year old males and 25 to 34 year old females are the most vulnerable to poverty, with 11 males (100.0%) and 28 females (73.7%) in their respective age groups living below the poverty level.
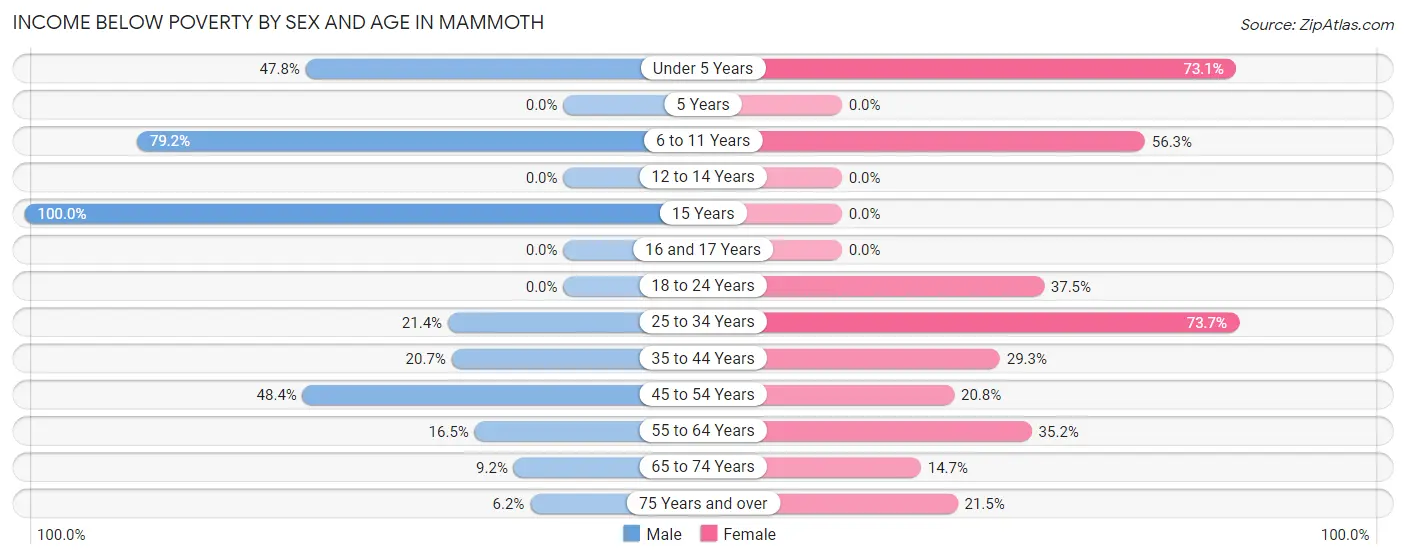
| Age Bracket | Male | Female |
| Under 5 Years | 11 (47.8%) | 19 (73.1%) |
| 5 Years | 0 (0.0%) | 0 (0.0%) |
| 6 to 11 Years | 19 (79.2%) | 9 (56.2%) |
| 12 to 14 Years | 0 (0.0%) | 0 (0.0%) |
| 15 Years | 11 (100.0%) | 0 (0.0%) |
| 16 and 17 Years | 0 (0.0%) | 0 (0.0%) |
| 18 to 24 Years | 0 (0.0%) | 9 (37.5%) |
| 25 to 34 Years | 6 (21.4%) | 28 (73.7%) |
| 35 to 44 Years | 17 (20.7%) | 22 (29.3%) |
| 45 to 54 Years | 30 (48.4%) | 5 (20.8%) |
| 55 to 64 Years | 13 (16.5%) | 37 (35.2%) |
| 65 to 74 Years | 7 (9.2%) | 11 (14.7%) |
| 75 Years and over | 4 (6.1%) | 26 (21.5%) |
| Total | 118 (24.7%) | 166 (30.9%) |
Income Above Poverty by Sex and Age in Mammoth
According to the poverty statistics in Mammoth, males aged 5 years and females aged 12 to 14 years are the age groups that are most secure financially, with 100.0% of males and 100.0% of females in these age groups living above the poverty line.
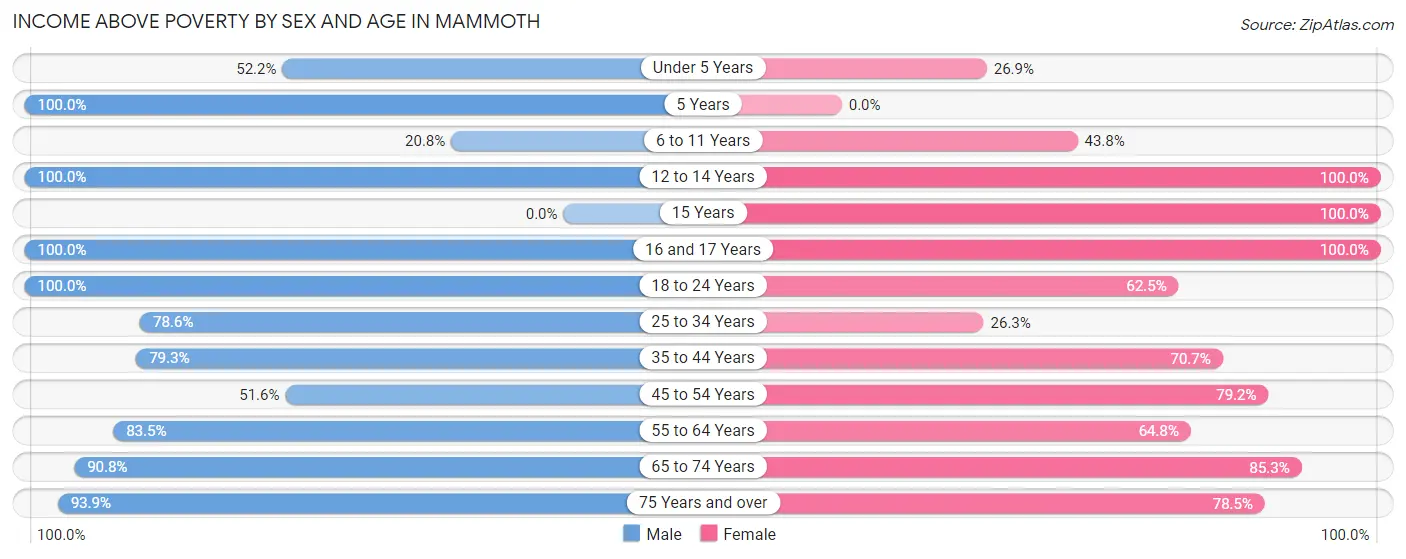
| Age Bracket | Male | Female |
| Under 5 Years | 12 (52.2%) | 7 (26.9%) |
| 5 Years | 4 (100.0%) | 0 (0.0%) |
| 6 to 11 Years | 5 (20.8%) | 7 (43.8%) |
| 12 to 14 Years | 16 (100.0%) | 13 (100.0%) |
| 15 Years | 0 (0.0%) | 4 (100.0%) |
| 16 and 17 Years | 4 (100.0%) | 16 (100.0%) |
| 18 to 24 Years | 3 (100.0%) | 15 (62.5%) |
| 25 to 34 Years | 22 (78.6%) | 10 (26.3%) |
| 35 to 44 Years | 65 (79.3%) | 53 (70.7%) |
| 45 to 54 Years | 32 (51.6%) | 19 (79.2%) |
| 55 to 64 Years | 66 (83.5%) | 68 (64.8%) |
| 65 to 74 Years | 69 (90.8%) | 64 (85.3%) |
| 75 Years and over | 61 (93.9%) | 95 (78.5%) |
| Total | 359 (75.3%) | 371 (69.1%) |
Income Below Poverty Among Married-Couple Families in Mammoth
The poverty statistics for married-couple families in Mammoth show that 12.2% or 18 of the total 148 families live below the poverty line. Families with 3 or 4 children have the highest poverty rate of 58.3%, comprising of 7 families. On the other hand, families with 1 or 2 children have the lowest poverty rate of 0.0%, which includes 0 families.
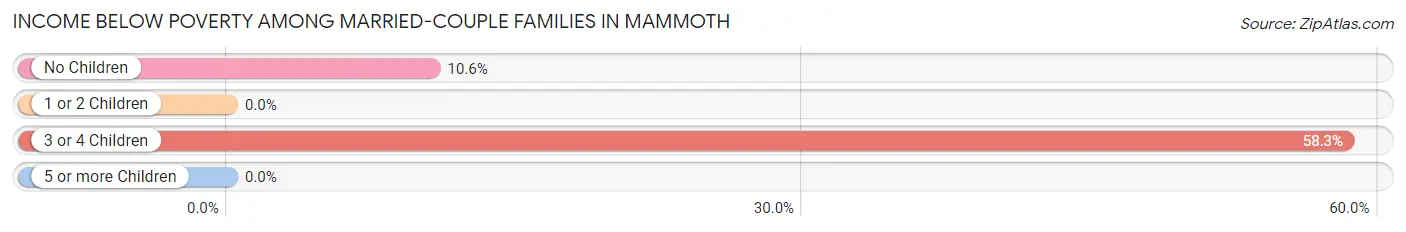
| Children | Above Poverty | Below Poverty |
| No Children | 93 (89.4%) | 11 (10.6%) |
| 1 or 2 Children | 32 (100.0%) | 0 (0.0%) |
| 3 or 4 Children | 5 (41.7%) | 7 (58.3%) |
| 5 or more Children | 0 (0.0%) | 0 (0.0%) |
| Total | 130 (87.8%) | 18 (12.2%) |
Income Below Poverty Among Single-Parent Households in Mammoth
According to the poverty data in Mammoth, 25.0% or 17 single-father households and 26.8% or 11 single-mother households are living below the poverty line. Among single-father households, those with 1 or 2 children have the highest poverty rate, with 17 households (43.6%) experiencing poverty. Likewise, among single-mother households, those with 1 or 2 children have the highest poverty rate, with 11 households (47.8%) falling below the poverty line.
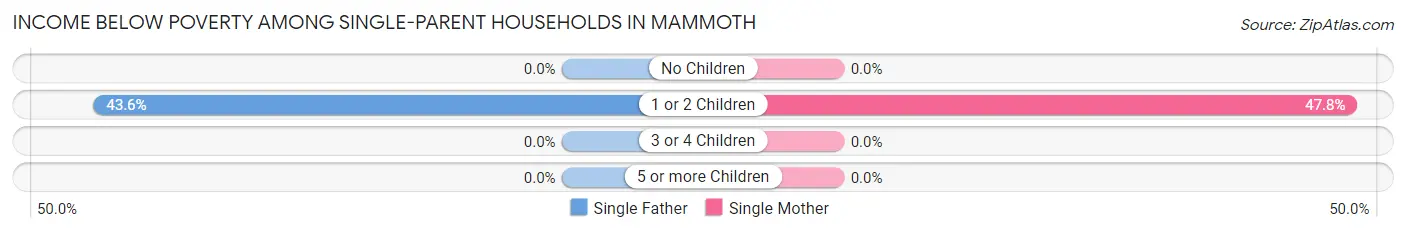
| Children | Single Father | Single Mother |
| No Children | 0 (0.0%) | 0 (0.0%) |
| 1 or 2 Children | 17 (43.6%) | 11 (47.8%) |
| 3 or 4 Children | 0 (0.0%) | 0 (0.0%) |
| 5 or more Children | 0 (0.0%) | 0 (0.0%) |
| Total | 17 (25.0%) | 11 (26.8%) |
Income Below Poverty Among Married-Couple vs Single-Parent Households in Mammoth
The poverty data for Mammoth shows that 18 of the married-couple family households (12.2%) and 28 of the single-parent households (25.7%) are living below the poverty level. Within the married-couple family households, those with 3 or 4 children have the highest poverty rate, with 7 households (58.3%) falling below the poverty line. Among the single-parent households, those with 1 or 2 children have the highest poverty rate, with 28 household (45.2%) living below poverty.
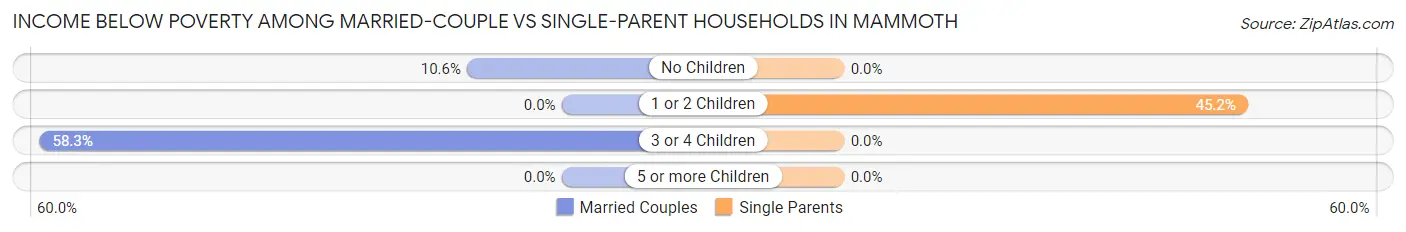
| Children | Married-Couple Families | Single-Parent Households |
| No Children | 11 (10.6%) | 0 (0.0%) |
| 1 or 2 Children | 0 (0.0%) | 28 (45.2%) |
| 3 or 4 Children | 7 (58.3%) | 0 (0.0%) |
| 5 or more Children | 0 (0.0%) | 0 (0.0%) |
| Total | 18 (12.2%) | 28 (25.7%) |
Race in Mammoth
The most populous races in Mammoth are White / Caucasian (836 | 82.5%), Hispanic or Latino (735 | 72.5%), and Two or more Races (87 | 8.6%).
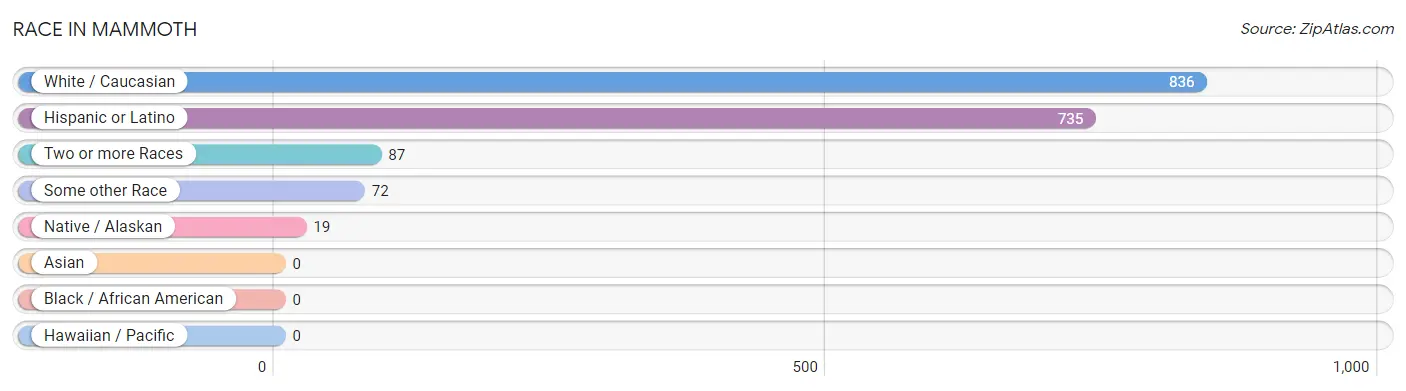
| Race | # Population | % Population |
| Asian | 0 | 0.0% |
| Black / African American | 0 | 0.0% |
| Hawaiian / Pacific | 0 | 0.0% |
| Hispanic or Latino | 735 | 72.5% |
| Native / Alaskan | 19 | 1.9% |
| White / Caucasian | 836 | 82.5% |
| Two or more Races | 87 | 8.6% |
| Some other Race | 72 | 7.1% |
| Total | 1,014 | 100.0% |
Ancestry in Mammoth
The most populous ancestries reported in Mammoth are Mexican (717 | 70.7%), German (88 | 8.7%), English (79 | 7.8%), Irish (34 | 3.4%), and Swedish (34 | 3.4%), together accounting for 93.9% of all Mammoth residents.
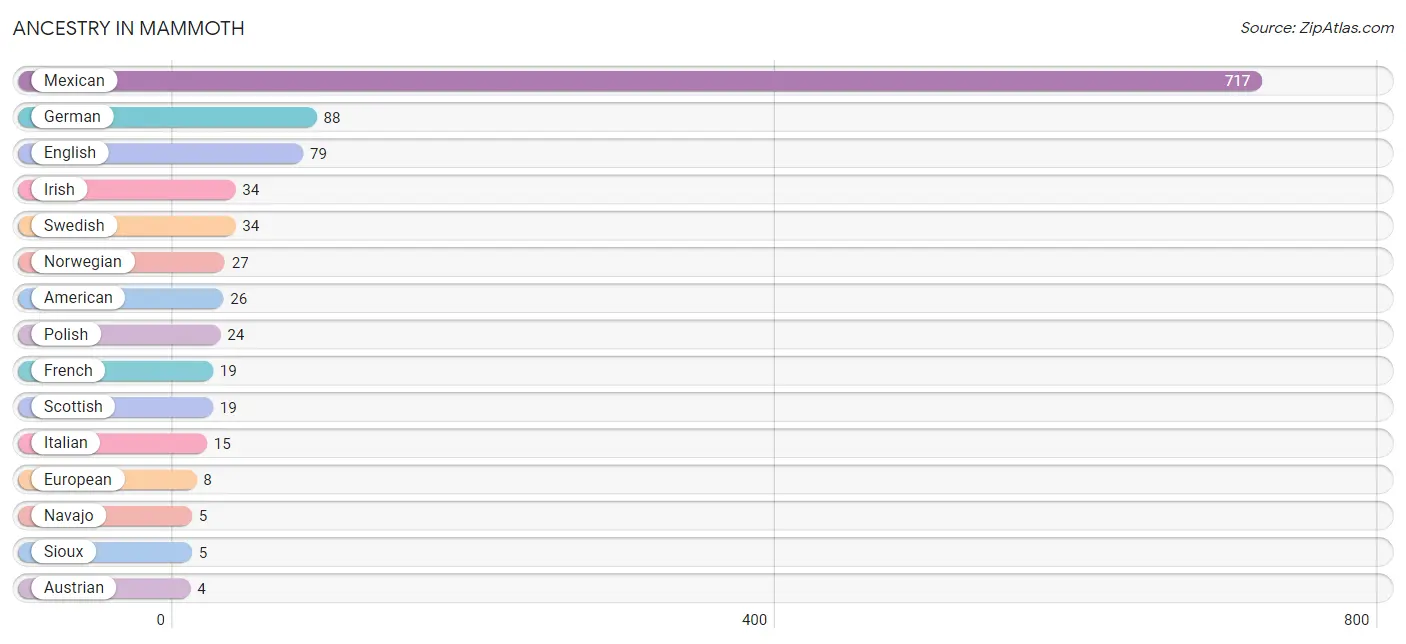
| Ancestry | # Population | % Population |
| American | 26 | 2.6% |
| Austrian | 4 | 0.4% |
| Cherokee | 4 | 0.4% |
| Choctaw | 4 | 0.4% |
| English | 79 | 7.8% |
| European | 8 | 0.8% |
| French | 19 | 1.9% |
| German | 88 | 8.7% |
| Hungarian | 4 | 0.4% |
| Irish | 34 | 3.4% |
| Italian | 15 | 1.5% |
| Mexican | 717 | 70.7% |
| Navajo | 5 | 0.5% |
| Norwegian | 27 | 2.7% |
| Polish | 24 | 2.4% |
| Portuguese | 4 | 0.4% |
| Scottish | 19 | 1.9% |
| Sioux | 5 | 0.5% |
| Slovak | 4 | 0.4% |
| Swedish | 34 | 3.4% |
| Welsh | 4 | 0.4% | View All 21 Rows |
Immigrants in Mammoth
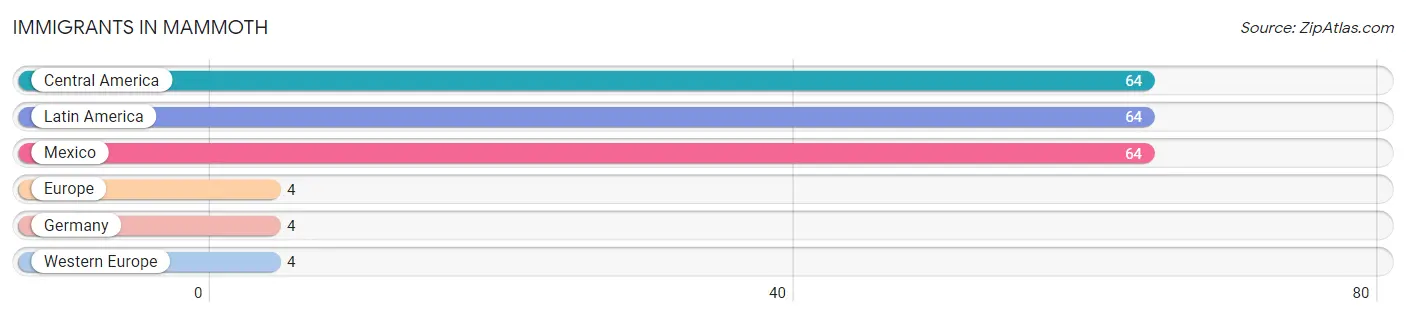
The most numerous immigrant groups reported in Mammoth came from Central America (64 | 6.3%), Latin America (64 | 6.3%), Mexico (64 | 6.3%), Europe (4 | 0.4%), and Germany (4 | 0.4%), together accounting for 19.7% of all Mammoth residents.
| Immigration Origin | # Population | % Population |
| Central America | 64 | 6.3% |
| Europe | 4 | 0.4% |
| Germany | 4 | 0.4% |
| Latin America | 64 | 6.3% |
| Mexico | 64 | 6.3% |
| Western Europe | 4 | 0.4% | View All 6 Rows |
Sex and Age in Mammoth
Sex and Age in Mammoth
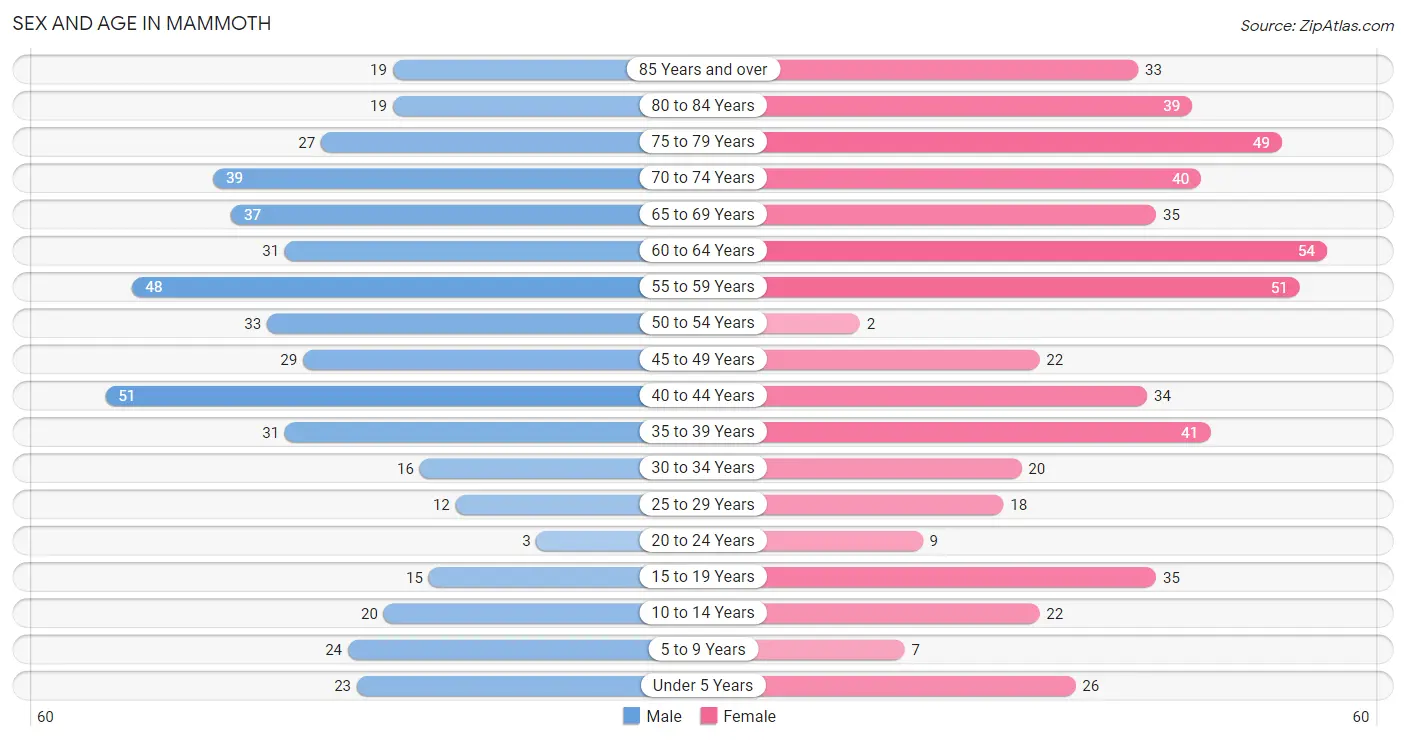
The most populous age groups in Mammoth are 40 to 44 Years (51 | 10.7%) for men and 60 to 64 Years (54 | 10.1%) for women.
| Age Bracket | Male | Female |
| Under 5 Years | 23 (4.8%) | 26 (4.8%) |
| 5 to 9 Years | 24 (5.0%) | 7 (1.3%) |
| 10 to 14 Years | 20 (4.2%) | 22 (4.1%) |
| 15 to 19 Years | 15 (3.1%) | 35 (6.5%) |
| 20 to 24 Years | 3 (0.6%) | 9 (1.7%) |
| 25 to 29 Years | 12 (2.5%) | 18 (3.4%) |
| 30 to 34 Years | 16 (3.4%) | 20 (3.7%) |
| 35 to 39 Years | 31 (6.5%) | 41 (7.6%) |
| 40 to 44 Years | 51 (10.7%) | 34 (6.3%) |
| 45 to 49 Years | 29 (6.1%) | 22 (4.1%) |
| 50 to 54 Years | 33 (6.9%) | 2 (0.4%) |
| 55 to 59 Years | 48 (10.1%) | 51 (9.5%) |
| 60 to 64 Years | 31 (6.5%) | 54 (10.1%) |
| 65 to 69 Years | 37 (7.8%) | 35 (6.5%) |
| 70 to 74 Years | 39 (8.2%) | 40 (7.4%) |
| 75 to 79 Years | 27 (5.7%) | 49 (9.1%) |
| 80 to 84 Years | 19 (4.0%) | 39 (7.3%) |
| 85 Years and over | 19 (4.0%) | 33 (6.1%) |
| Total | 477 (100.0%) | 537 (100.0%) |
Families and Households in Mammoth
Median Family Size in Mammoth
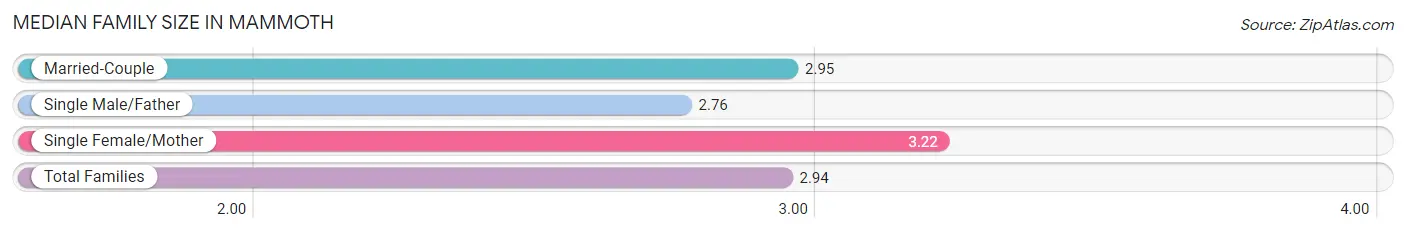
The median family size in Mammoth is 2.94 persons per family, with single female/mother families (41 | 16.0%) accounting for the largest median family size of 3.22 persons per family. On the other hand, single male/father families (68 | 26.5%) represent the smallest median family size with 2.76 persons per family.
| Family Type | # Families | Family Size |
| Married-Couple | 148 (57.6%) | 2.95 |
| Single Male/Father | 68 (26.5%) | 2.76 |
| Single Female/Mother | 41 (16.0%) | 3.22 |
| Total Families | 257 (100.0%) | 2.94 |
Median Household Size in Mammoth
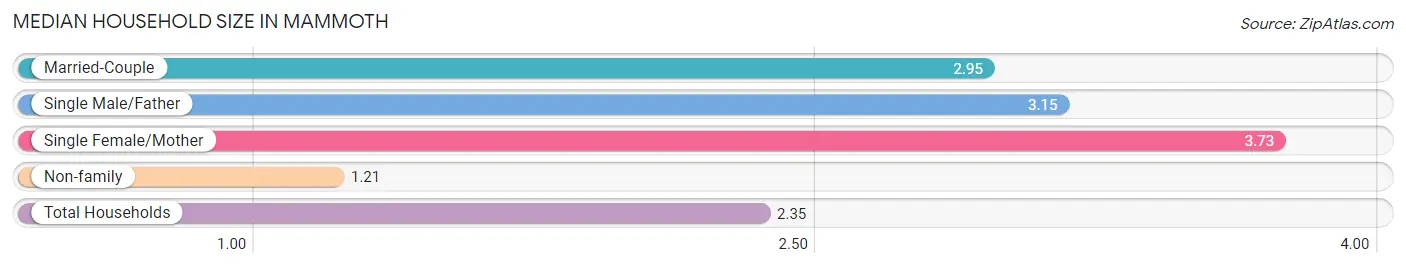
The median household size in Mammoth is 2.35 persons per household, with single female/mother households (41 | 9.5%) accounting for the largest median household size of 3.73 persons per household. non-family households (174 | 40.4%) represent the smallest median household size with 1.21 persons per household.
| Household Type | # Households | Household Size |
| Married-Couple | 148 (34.3%) | 2.95 |
| Single Male/Father | 68 (15.8%) | 3.15 |
| Single Female/Mother | 41 (9.5%) | 3.73 |
| Non-family | 174 (40.4%) | 1.21 |
| Total Households | 431 (100.0%) | 2.35 |
Household Size by Marriage Status in Mammoth
Out of a total of 431 households in Mammoth, 257 (59.6%) are family households, while 174 (40.4%) are nonfamily households. The most numerous type of family households are 2-person households, comprising 116, and the most common type of nonfamily households are 1-person households, comprising 135.
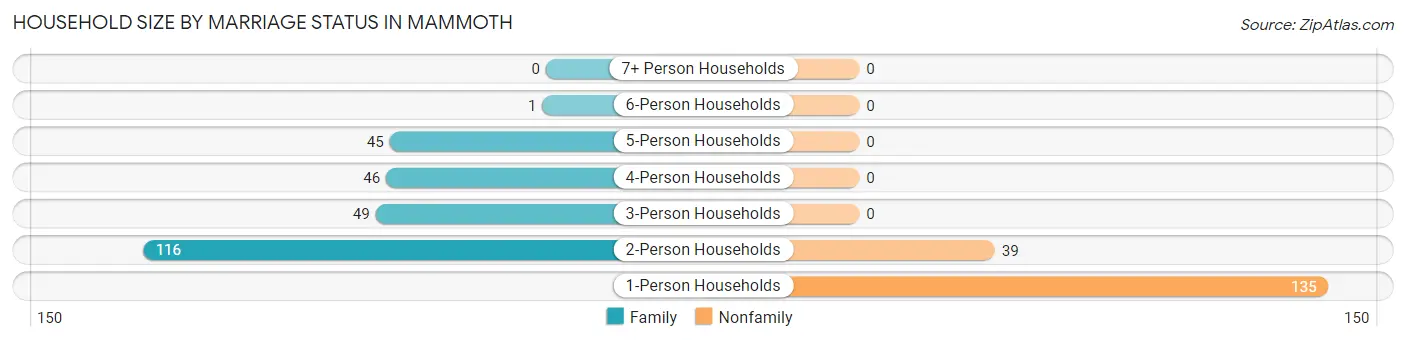
| Household Size | Family Households | Nonfamily Households |
| 1-Person Households | - | 135 (31.3%) |
| 2-Person Households | 116 (26.9%) | 39 (9.0%) |
| 3-Person Households | 49 (11.4%) | 0 (0.0%) |
| 4-Person Households | 46 (10.7%) | 0 (0.0%) |
| 5-Person Households | 45 (10.4%) | 0 (0.0%) |
| 6-Person Households | 1 (0.2%) | 0 (0.0%) |
| 7+ Person Households | 0 (0.0%) | 0 (0.0%) |
| Total | 257 (59.6%) | 174 (40.4%) |
Female Fertility in Mammoth
Fertility by Age in Mammoth
Average fertility rate in Mammoth is 67.0 births per 1,000 women. Women in the age bracket of 20 to 34 years have the highest fertility rate with 255.0 births per 1,000 women. Women in the age bracket of 20 to 34 years acount for 100.0% of all women with births.
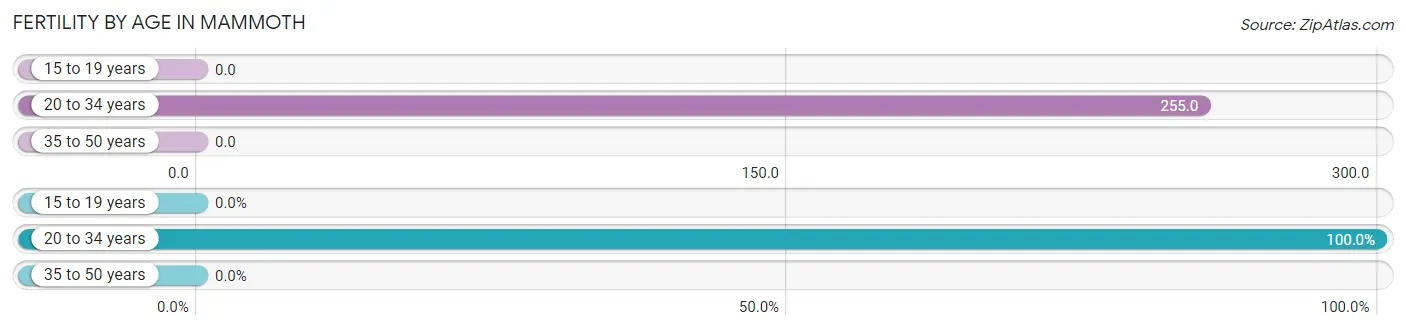
| Age Bracket | Women with Births | Births / 1,000 Women |
| 15 to 19 years | 0 (0.0%) | 0.0 |
| 20 to 34 years | 12 (100.0%) | 255.0 |
| 35 to 50 years | 0 (0.0%) | 0.0 |
| Total | 12 (100.0%) | 67.0 |
Fertility by Age by Marriage Status in Mammoth
58.3% of women with births (12) in Mammoth are married. The highest percentage of unmarried women with births falls into 20 to 34 years age bracket with 41.7% of them unmarried at the time of birth, while the lowest percentage of unmarried women with births belong to 20 to 34 years age bracket with 41.7% of them unmarried.
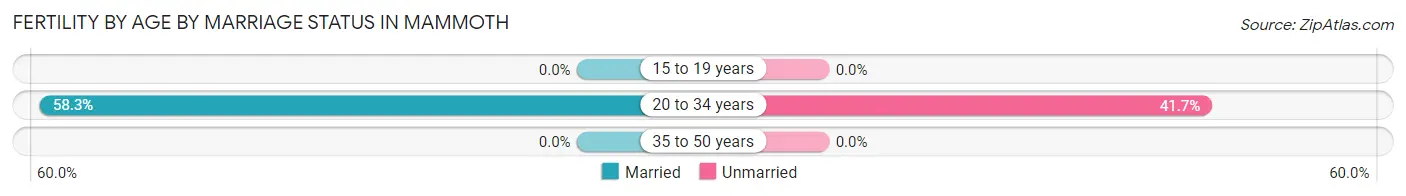
| Age Bracket | Married | Unmarried |
| 15 to 19 years | 0 (0.0%) | 0 (0.0%) |
| 20 to 34 years | 7 (58.3%) | 5 (41.7%) |
| 35 to 50 years | 0 (0.0%) | 0 (0.0%) |
| Total | 7 (58.3%) | 5 (41.7%) |
Fertility by Education in Mammoth
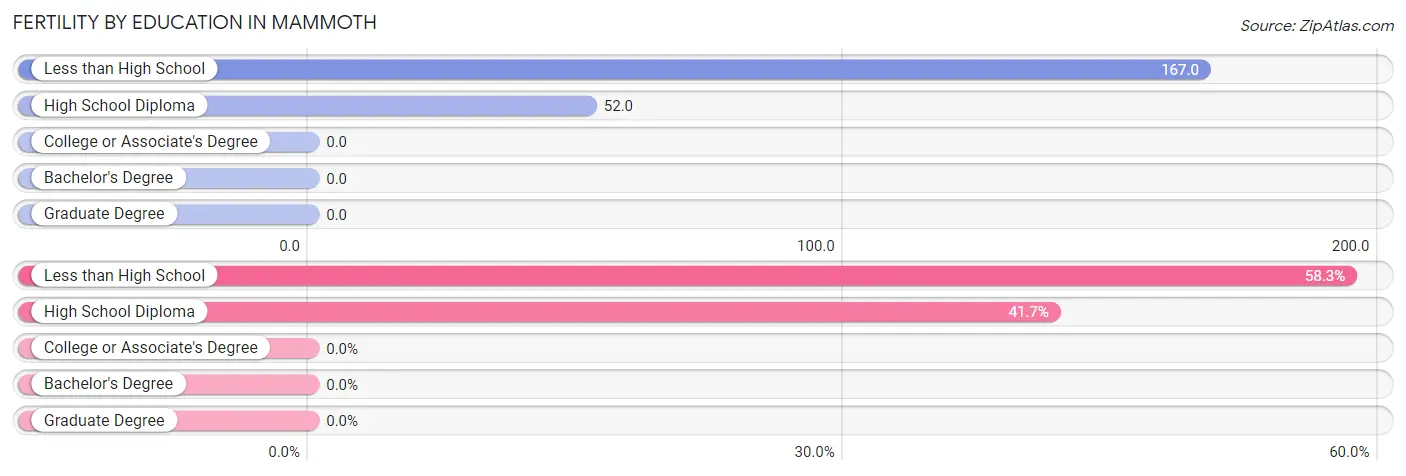
| Educational Attainment | Women with Births | Births / 1,000 Women |
| Less than High School | 7 (58.3%) | 167.0 |
| High School Diploma | 5 (41.7%) | 52.0 |
| College or Associate's Degree | 0 (0.0%) | 0.0 |
| Bachelor's Degree | 0 (0.0%) | 0.0 |
| Graduate Degree | 0 (0.0%) | 0.0 |
| Total | 12 (100.0%) | 67.0 |
Fertility by Education by Marriage Status in Mammoth
41.7% of women with births in Mammoth are unmarried. Women with the educational attainment of less than high school are most likely to be married with 100.0% of them married at childbirth, while women with the educational attainment of high school diploma are least likely to be married with 100.0% of them unmarried at childbirth.
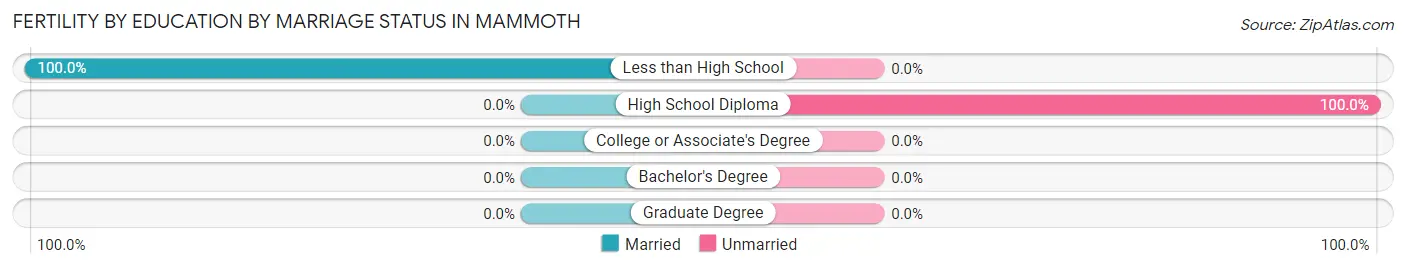
| Educational Attainment | Married | Unmarried |
| Less than High School | 7 (100.0%) | 0 (0.0%) |
| High School Diploma | 0 (0.0%) | 5 (100.0%) |
| College or Associate's Degree | 0 (0.0%) | 0 (0.0%) |
| Bachelor's Degree | 0 (0.0%) | 0 (0.0%) |
| Graduate Degree | 0 (0.0%) | 0 (0.0%) |
| Total | 7 (58.3%) | 5 (41.7%) |
Employment Characteristics in Mammoth
Employment by Class of Employer in Mammoth
Among the 282 employed individuals in Mammoth, private company employees (200 | 70.9%), local government employees (37 | 13.1%), and state government employees (26 | 9.2%) make up the most common classes of employment.
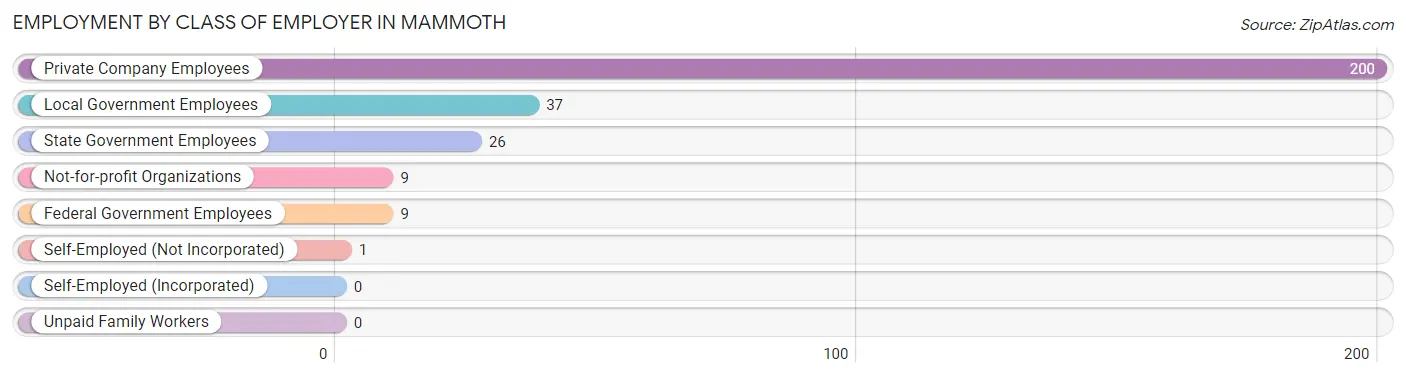
| Employer Class | # Employees | % Employees |
| Private Company Employees | 200 | 70.9% |
| Self-Employed (Incorporated) | 0 | 0.0% |
| Self-Employed (Not Incorporated) | 1 | 0.4% |
| Not-for-profit Organizations | 9 | 3.2% |
| Local Government Employees | 37 | 13.1% |
| State Government Employees | 26 | 9.2% |
| Federal Government Employees | 9 | 3.2% |
| Unpaid Family Workers | 0 | 0.0% |
| Total | 282 | 100.0% |
Employment Status by Age in Mammoth
According to the labor force statistics for Mammoth, out of the total population over 16 years of age (877), 40.4% or 354 individuals are in the labor force, with 17.2% or 61 of them unemployed. The age group with the highest labor force participation rate is 25 to 29 years, with 100.0% or 30 individuals in the labor force. Within the labor force, the 20 to 24 years age range has the highest percentage of unemployed individuals, with 50.0% or 1 of them being unemployed.
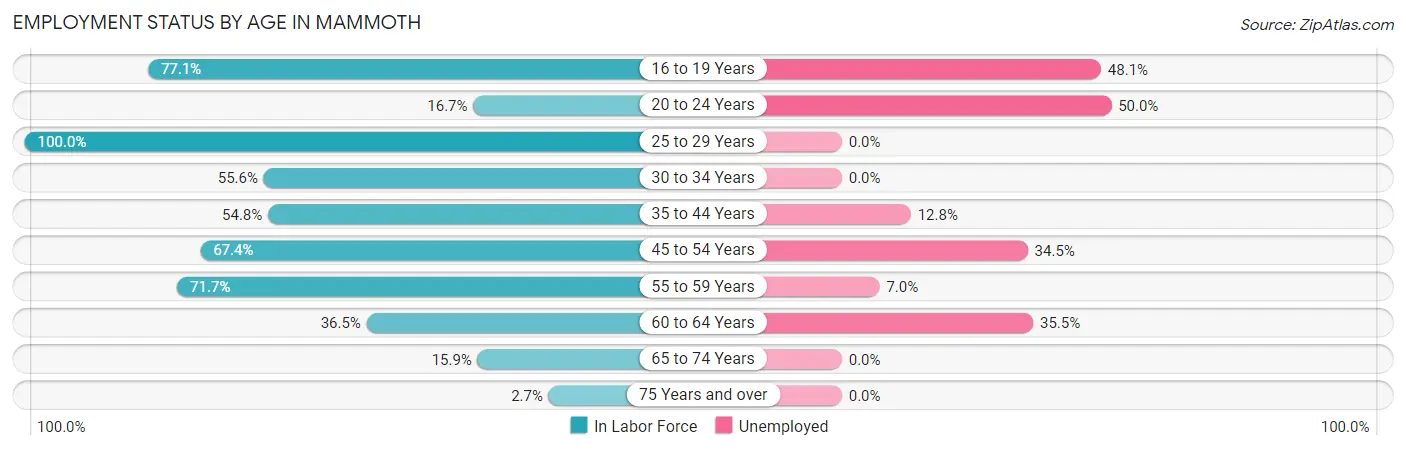
| Age Bracket | In Labor Force | Unemployed |
| 16 to 19 Years | 27 (77.1%) | 13 (48.1%) |
| 20 to 24 Years | 2 (16.7%) | 1 (50.0%) |
| 25 to 29 Years | 30 (100.0%) | 0 (0.0%) |
| 30 to 34 Years | 20 (55.6%) | 0 (0.0%) |
| 35 to 44 Years | 86 (54.8%) | 11 (12.8%) |
| 45 to 54 Years | 58 (67.4%) | 20 (34.5%) |
| 55 to 59 Years | 71 (71.7%) | 5 (7.0%) |
| 60 to 64 Years | 31 (36.5%) | 11 (35.5%) |
| 65 to 74 Years | 24 (15.9%) | 0 (0.0%) |
| 75 Years and over | 5 (2.7%) | 0 (0.0%) |
| Total | 354 (40.4%) | 61 (17.2%) |
Employment Status by Educational Attainment in Mammoth
According to labor force statistics for Mammoth, 60.0% of individuals (296) out of the total population between 25 and 64 years of age (493) are in the labor force, with 15.9% or 47 of them being unemployed. The group with the highest labor force participation rate are those with the educational attainment of bachelor's degree or higher, with 80.0% or 12 individuals in the labor force. Within the labor force, individuals with bachelor's degree or higher education have the highest percentage of unemployment, with 91.7% or 11 of them being unemployed.
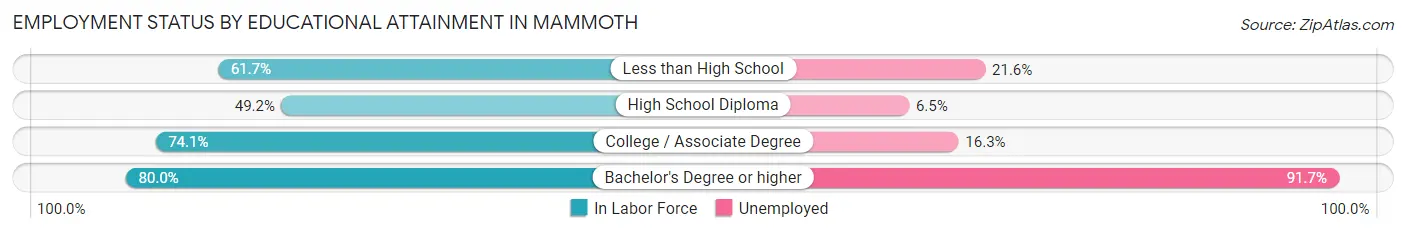
| Educational Attainment | In Labor Force | Unemployed |
| Less than High School | 37 (61.7%) | 13 (21.6%) |
| High School Diploma | 124 (49.2%) | 16 (6.5%) |
| College / Associate Degree | 123 (74.1%) | 27 (16.3%) |
| Bachelor's Degree or higher | 12 (80.0%) | 14 (91.7%) |
| Total | 296 (60.0%) | 78 (15.9%) |
Employment Occupations by Sex in Mammoth
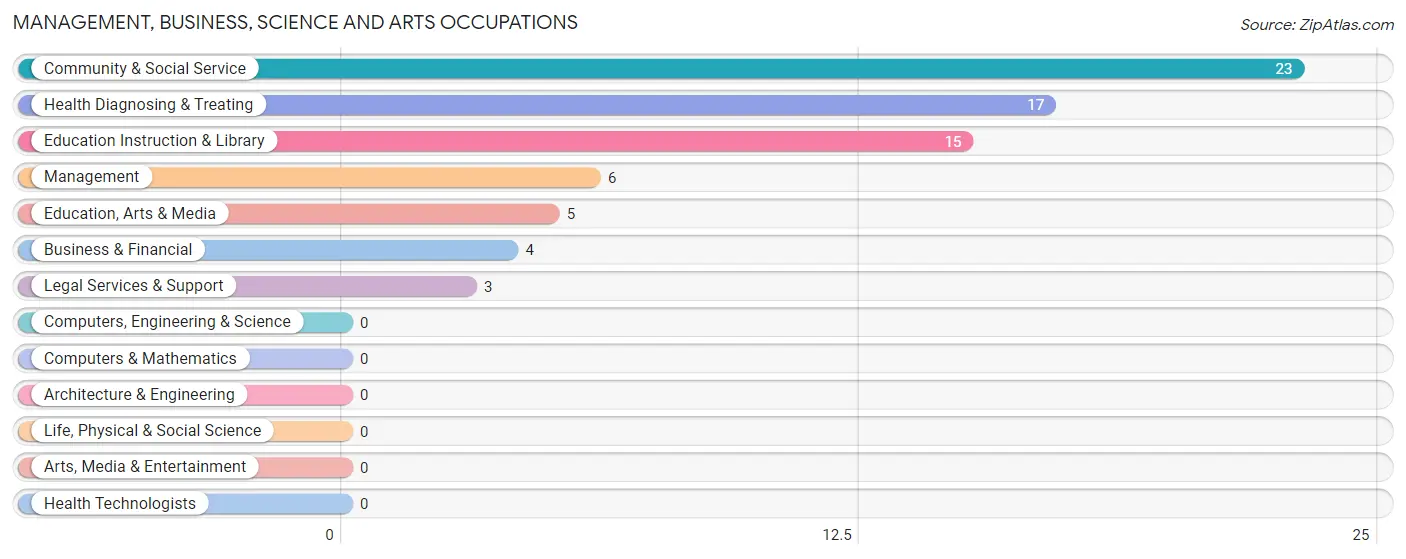
Management, Business, Science and Arts Occupations
The most common Management, Business, Science and Arts occupations in Mammoth are Community & Social Service (23 | 7.9%), Health Diagnosing & Treating (17 | 5.8%), Education Instruction & Library (15 | 5.1%), Management (6 | 2.1%), and Education, Arts & Media (5 | 1.7%).
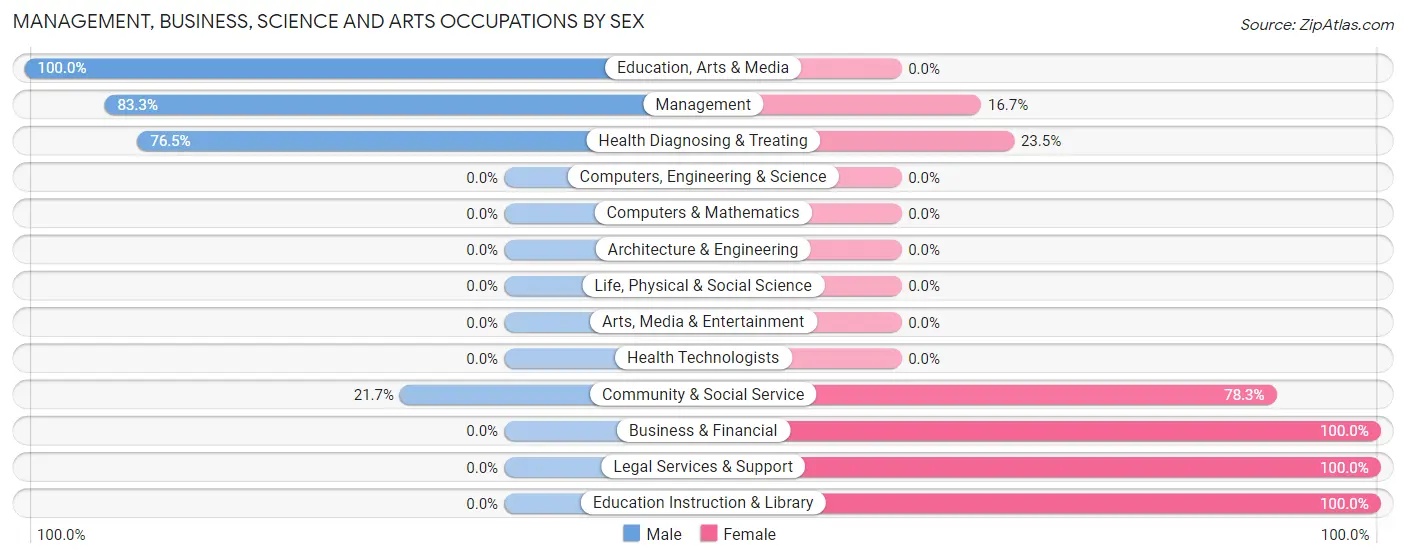
Management, Business, Science and Arts Occupations by Sex
Within the Management, Business, Science and Arts occupations in Mammoth, the most male-oriented occupations are Education, Arts & Media (100.0%), Management (83.3%), and Health Diagnosing & Treating (76.5%), while the most female-oriented occupations are Business & Financial (100.0%), Legal Services & Support (100.0%), and Education Instruction & Library (100.0%).
| Occupation | Male | Female |
| Management | 5 (83.3%) | 1 (16.7%) |
| Business & Financial | 0 (0.0%) | 4 (100.0%) |
| Computers, Engineering & Science | 0 (0.0%) | 0 (0.0%) |
| Computers & Mathematics | 0 (0.0%) | 0 (0.0%) |
| Architecture & Engineering | 0 (0.0%) | 0 (0.0%) |
| Life, Physical & Social Science | 0 (0.0%) | 0 (0.0%) |
| Community & Social Service | 5 (21.7%) | 18 (78.3%) |
| Education, Arts & Media | 5 (100.0%) | 0 (0.0%) |
| Legal Services & Support | 0 (0.0%) | 3 (100.0%) |
| Education Instruction & Library | 0 (0.0%) | 15 (100.0%) |
| Arts, Media & Entertainment | 0 (0.0%) | 0 (0.0%) |
| Health Diagnosing & Treating | 13 (76.5%) | 4 (23.5%) |
| Health Technologists | 0 (0.0%) | 0 (0.0%) |
| Total (Category) | 23 (46.0%) | 27 (54.0%) |
| Total (Overall) | 135 (46.1%) | 158 (53.9%) |
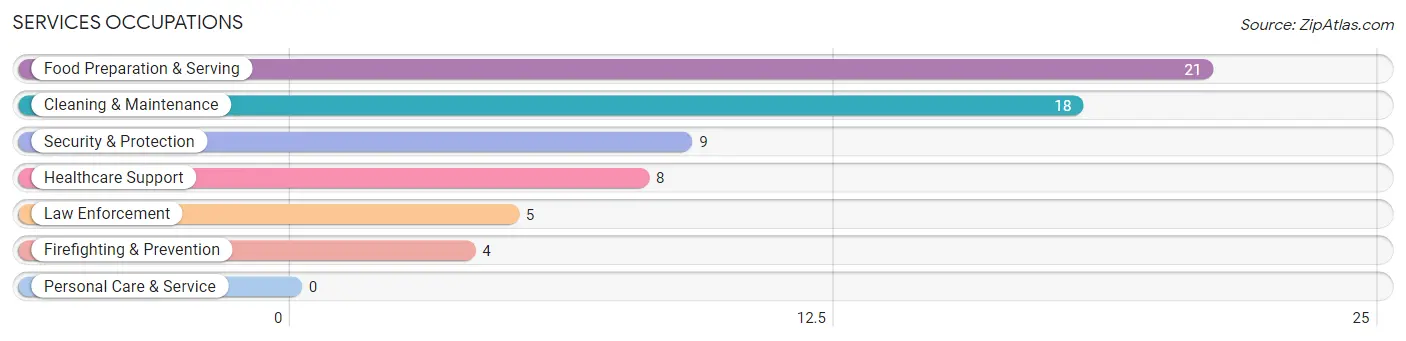
Services Occupations
The most common Services occupations in Mammoth are Food Preparation & Serving (21 | 7.2%), Cleaning & Maintenance (18 | 6.1%), Security & Protection (9 | 3.1%), Healthcare Support (8 | 2.7%), and Law Enforcement (5 | 1.7%).
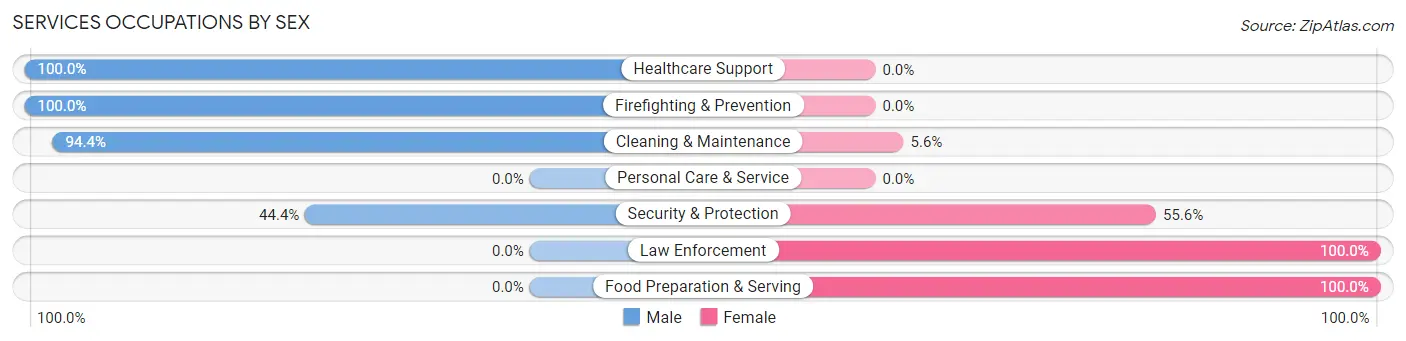
Services Occupations by Sex
Within the Services occupations in Mammoth, the most male-oriented occupations are Healthcare Support (100.0%), Firefighting & Prevention (100.0%), and Cleaning & Maintenance (94.4%), while the most female-oriented occupations are Law Enforcement (100.0%), Food Preparation & Serving (100.0%), and Security & Protection (55.6%).
| Occupation | Male | Female |
| Healthcare Support | 8 (100.0%) | 0 (0.0%) |
| Security & Protection | 4 (44.4%) | 5 (55.6%) |
| Firefighting & Prevention | 4 (100.0%) | 0 (0.0%) |
| Law Enforcement | 0 (0.0%) | 5 (100.0%) |
| Food Preparation & Serving | 0 (0.0%) | 21 (100.0%) |
| Cleaning & Maintenance | 17 (94.4%) | 1 (5.6%) |
| Personal Care & Service | 0 (0.0%) | 0 (0.0%) |
| Total (Category) | 29 (51.8%) | 27 (48.2%) |
| Total (Overall) | 135 (46.1%) | 158 (53.9%) |
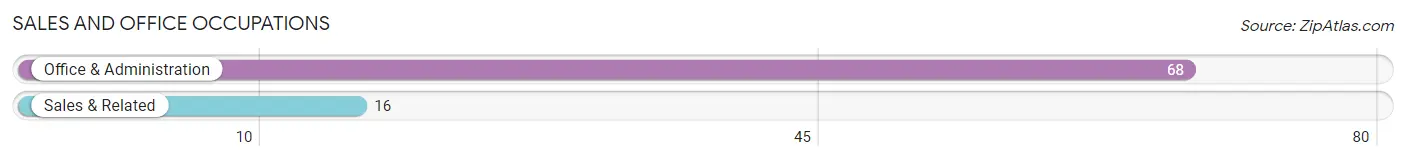
Sales and Office Occupations
The most common Sales and Office occupations in Mammoth are Office & Administration (68 | 23.2%), and Sales & Related (16 | 5.5%).
Sales and Office Occupations by Sex
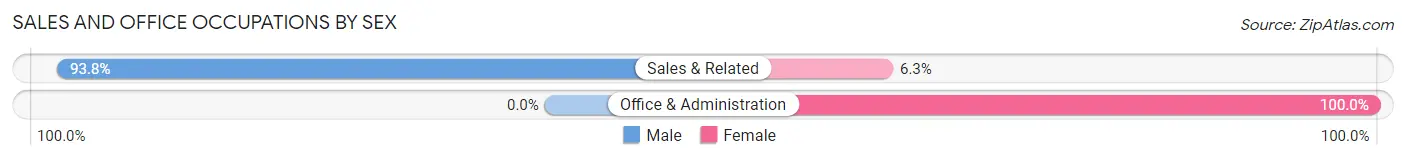
| Occupation | Male | Female |
| Sales & Related | 15 (93.8%) | 1 (6.2%) |
| Office & Administration | 0 (0.0%) | 68 (100.0%) |
| Total (Category) | 15 (17.9%) | 69 (82.1%) |
| Total (Overall) | 135 (46.1%) | 158 (53.9%) |
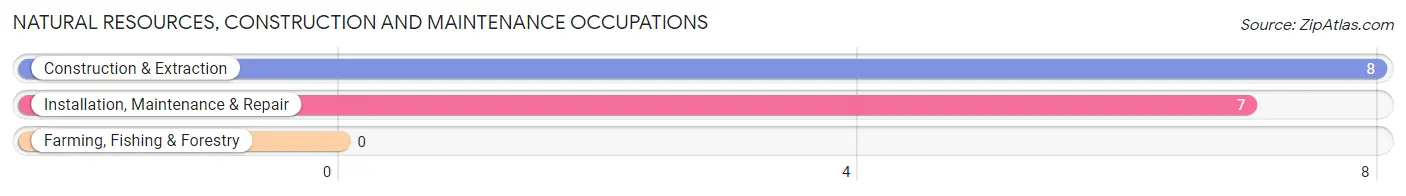
Natural Resources, Construction and Maintenance Occupations
The most common Natural Resources, Construction and Maintenance occupations in Mammoth are Construction & Extraction (8 | 2.7%), and Installation, Maintenance & Repair (7 | 2.4%).
Natural Resources, Construction and Maintenance Occupations by Sex
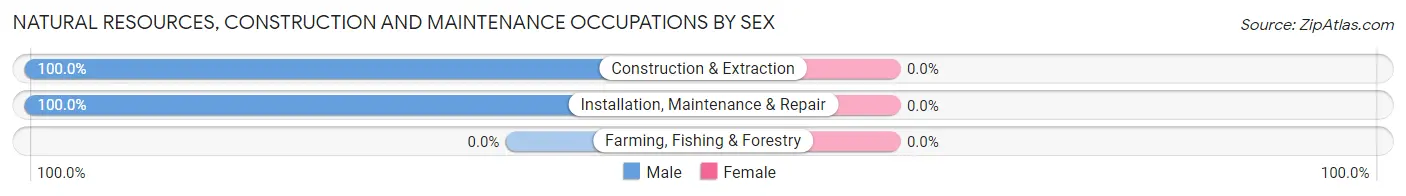
| Occupation | Male | Female |
| Farming, Fishing & Forestry | 0 (0.0%) | 0 (0.0%) |
| Construction & Extraction | 8 (100.0%) | 0 (0.0%) |
| Installation, Maintenance & Repair | 7 (100.0%) | 0 (0.0%) |
| Total (Category) | 15 (100.0%) | 0 (0.0%) |
| Total (Overall) | 135 (46.1%) | 158 (53.9%) |
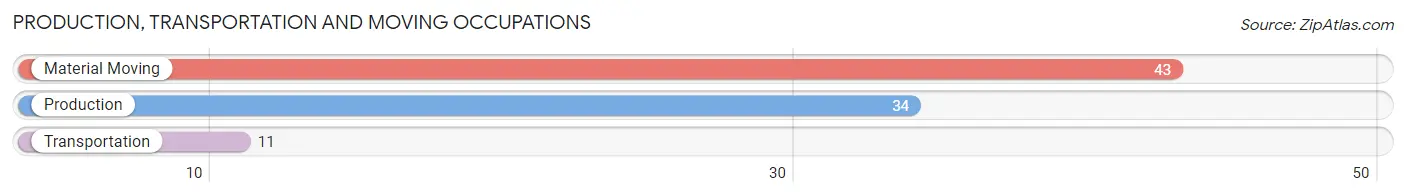
Production, Transportation and Moving Occupations
The most common Production, Transportation and Moving occupations in Mammoth are Material Moving (43 | 14.7%), Production (34 | 11.6%), and Transportation (11 | 3.7%).
Production, Transportation and Moving Occupations by Sex
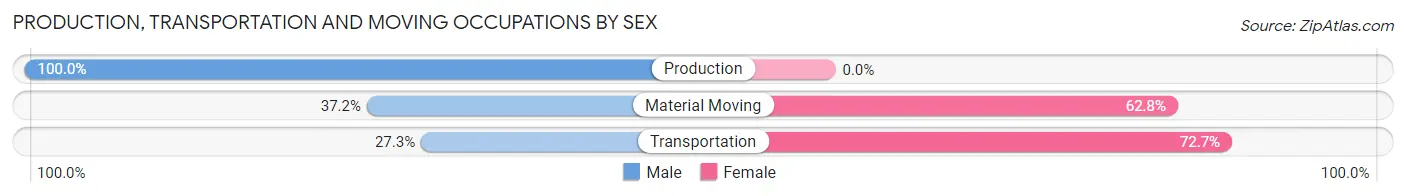
| Occupation | Male | Female |
| Production | 34 (100.0%) | 0 (0.0%) |
| Transportation | 3 (27.3%) | 8 (72.7%) |
| Material Moving | 16 (37.2%) | 27 (62.8%) |
| Total (Category) | 53 (60.2%) | 35 (39.8%) |
| Total (Overall) | 135 (46.1%) | 158 (53.9%) |
Employment Industries by Sex in Mammoth
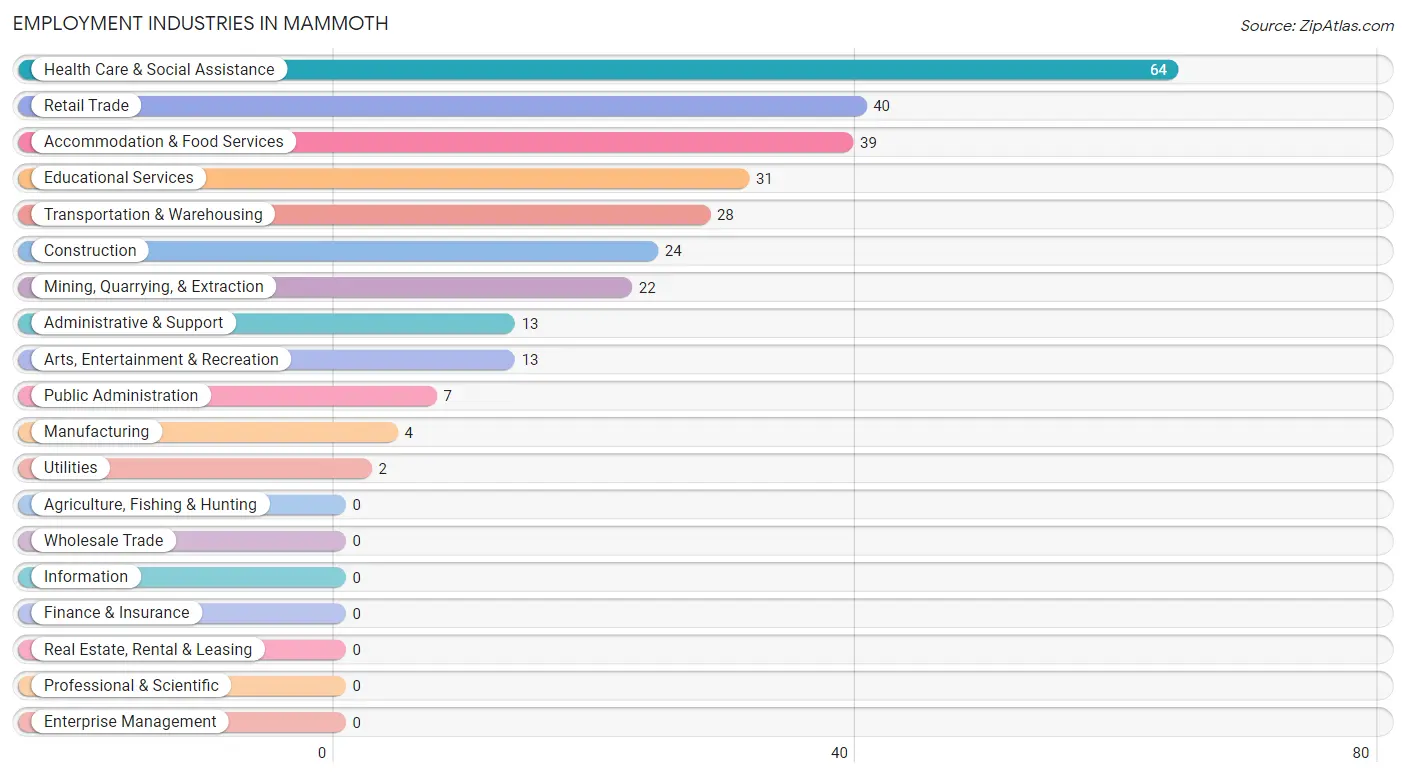
Employment Industries in Mammoth
The major employment industries in Mammoth include Health Care & Social Assistance (64 | 21.8%), Retail Trade (40 | 13.7%), Accommodation & Food Services (39 | 13.3%), Educational Services (31 | 10.6%), and Transportation & Warehousing (28 | 9.6%).
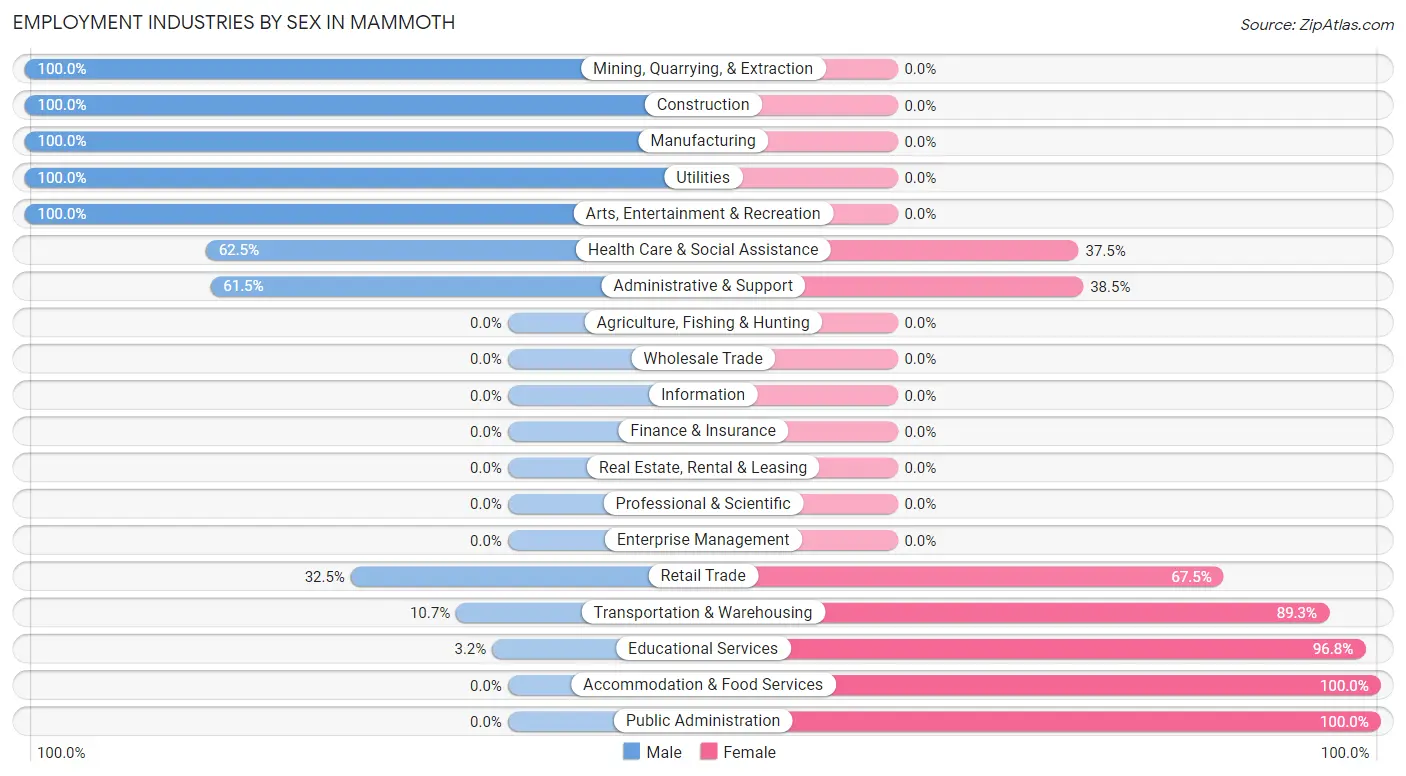
Employment Industries by Sex in Mammoth
The Mammoth industries that see more men than women are Mining, Quarrying, & Extraction (100.0%), Construction (100.0%), and Manufacturing (100.0%), whereas the industries that tend to have a higher number of women are Accommodation & Food Services (100.0%), Public Administration (100.0%), and Educational Services (96.8%).
| Industry | Male | Female |
| Agriculture, Fishing & Hunting | 0 (0.0%) | 0 (0.0%) |
| Mining, Quarrying, & Extraction | 22 (100.0%) | 0 (0.0%) |
| Construction | 24 (100.0%) | 0 (0.0%) |
| Manufacturing | 4 (100.0%) | 0 (0.0%) |
| Wholesale Trade | 0 (0.0%) | 0 (0.0%) |
| Retail Trade | 13 (32.5%) | 27 (67.5%) |
| Transportation & Warehousing | 3 (10.7%) | 25 (89.3%) |
| Utilities | 2 (100.0%) | 0 (0.0%) |
| Information | 0 (0.0%) | 0 (0.0%) |
| Finance & Insurance | 0 (0.0%) | 0 (0.0%) |
| Real Estate, Rental & Leasing | 0 (0.0%) | 0 (0.0%) |
| Professional & Scientific | 0 (0.0%) | 0 (0.0%) |
| Enterprise Management | 0 (0.0%) | 0 (0.0%) |
| Administrative & Support | 8 (61.5%) | 5 (38.5%) |
| Educational Services | 1 (3.2%) | 30 (96.8%) |
| Health Care & Social Assistance | 40 (62.5%) | 24 (37.5%) |
| Arts, Entertainment & Recreation | 13 (100.0%) | 0 (0.0%) |
| Accommodation & Food Services | 0 (0.0%) | 39 (100.0%) |
| Public Administration | 0 (0.0%) | 7 (100.0%) |
| Total | 135 (46.1%) | 158 (53.9%) |
Education in Mammoth
School Enrollment in Mammoth
The most common levels of schooling among the 151 students in Mammoth are high school (52 | 34.4%), middle school (42 | 27.8%), and graduate / professional (19 | 12.6%).
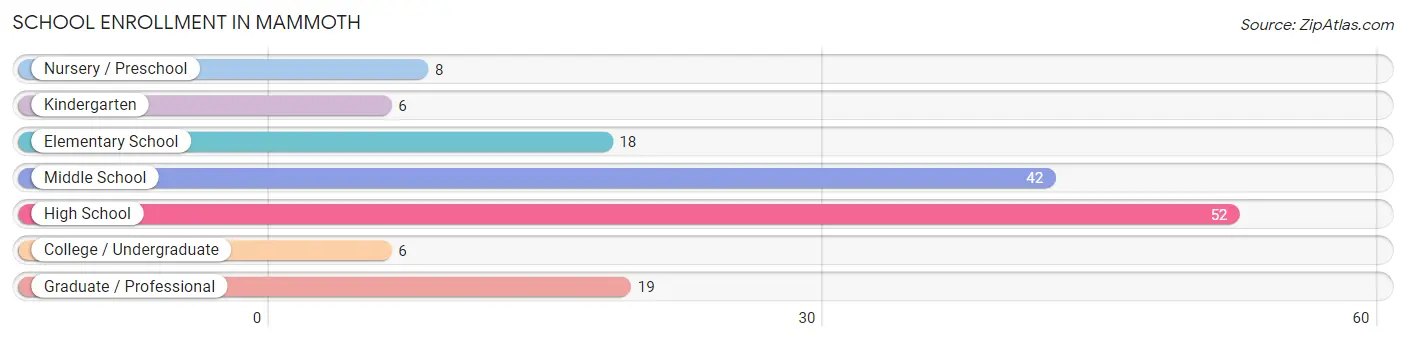
| School Level | # Students | % Students |
| Nursery / Preschool | 8 | 5.3% |
| Kindergarten | 6 | 4.0% |
| Elementary School | 18 | 11.9% |
| Middle School | 42 | 27.8% |
| High School | 52 | 34.4% |
| College / Undergraduate | 6 | 4.0% |
| Graduate / Professional | 19 | 12.6% |
| Total | 151 | 100.0% |
School Enrollment by Age by Funding Source in Mammoth
Out of a total of 151 students who are enrolled in schools in Mammoth, 37 (24.5%) attend a private institution, while the remaining 114 (75.5%) are enrolled in public schools. The age group of 35 years and over has the highest likelihood of being enrolled in private schools, with 11 (73.3% in the age bracket) enrolled. Conversely, the age group of 3 to 4 year olds has the lowest likelihood of being enrolled in a private school, with 8 (100.0% in the age bracket) attending a public institution.
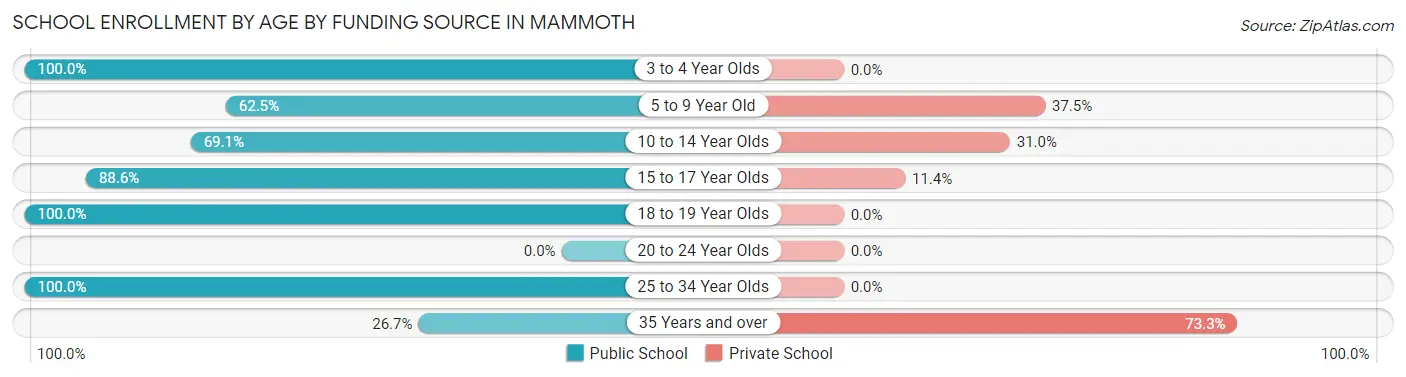
| Age Bracket | Public School | Private School |
| 3 to 4 Year Olds | 8 (100.0%) | 0 (0.0%) |
| 5 to 9 Year Old | 15 (62.5%) | 9 (37.5%) |
| 10 to 14 Year Olds | 29 (69.1%) | 13 (30.9%) |
| 15 to 17 Year Olds | 31 (88.6%) | 4 (11.4%) |
| 18 to 19 Year Olds | 13 (100.0%) | 0 (0.0%) |
| 20 to 24 Year Olds | 0 (0.0%) | 0 (0.0%) |
| 25 to 34 Year Olds | 14 (100.0%) | 0 (0.0%) |
| 35 Years and over | 4 (26.7%) | 11 (73.3%) |
| Total | 114 (75.5%) | 37 (24.5%) |
Educational Attainment by Field of Study in Mammoth
Engineering (11 | 40.7%), psychology (4 | 14.8%), science & technology (4 | 14.8%), education (4 | 14.8%), and liberal arts & history (3 | 11.1%) are the most common fields of study among 27 individuals in Mammoth who have obtained a bachelor's degree or higher.
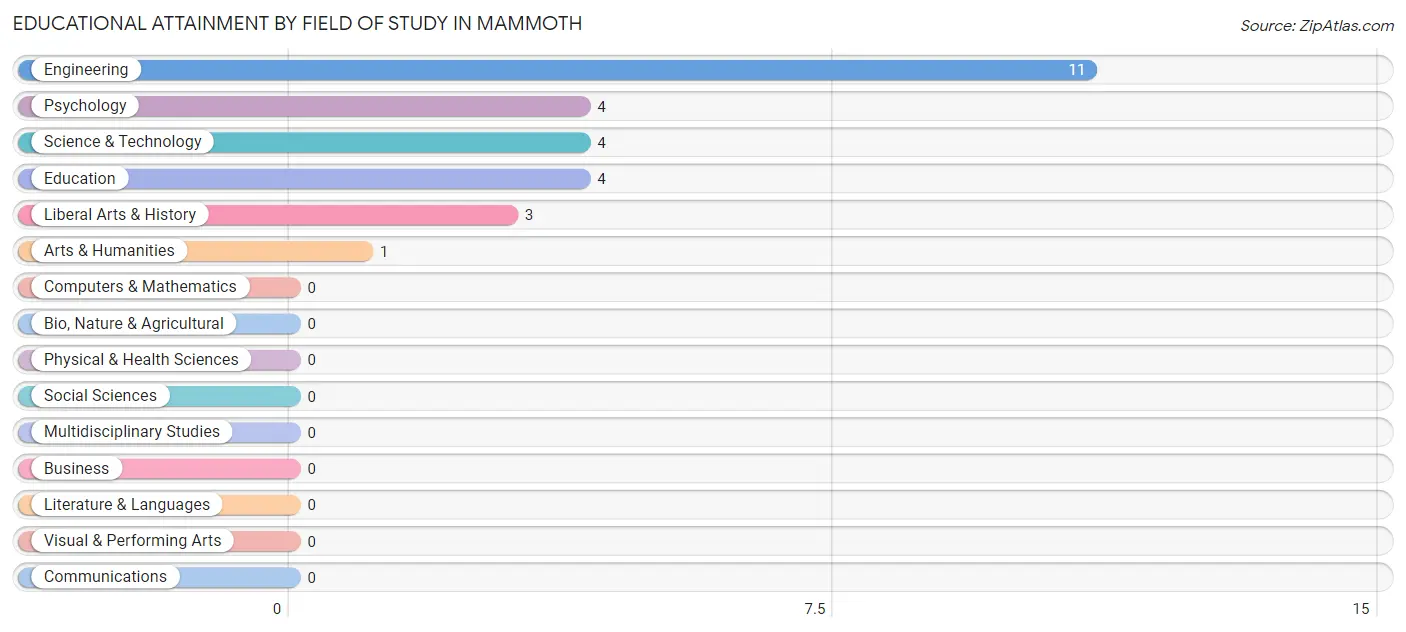
| Field of Study | # Graduates | % Graduates |
| Computers & Mathematics | 0 | 0.0% |
| Bio, Nature & Agricultural | 0 | 0.0% |
| Physical & Health Sciences | 0 | 0.0% |
| Psychology | 4 | 14.8% |
| Social Sciences | 0 | 0.0% |
| Engineering | 11 | 40.7% |
| Multidisciplinary Studies | 0 | 0.0% |
| Science & Technology | 4 | 14.8% |
| Business | 0 | 0.0% |
| Education | 4 | 14.8% |
| Literature & Languages | 0 | 0.0% |
| Liberal Arts & History | 3 | 11.1% |
| Visual & Performing Arts | 0 | 0.0% |
| Communications | 0 | 0.0% |
| Arts & Humanities | 1 | 3.7% |
| Total | 27 | 100.0% |
Transportation & Commute in Mammoth
Vehicle Availability by Sex in Mammoth
The most prevalent vehicle ownership categories in Mammoth are males with 2 vehicles (66, accounting for 51.2%) and females with 2 vehicles (78, making up 43.1%).
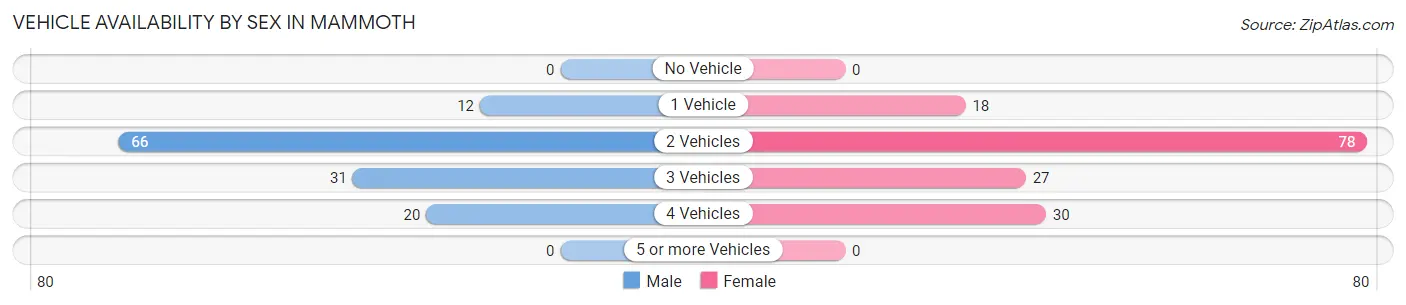
| Vehicles Available | Male | Female |
| No Vehicle | 0 (0.0%) | 0 (0.0%) |
| 1 Vehicle | 12 (9.3%) | 18 (11.8%) |
| 2 Vehicles | 66 (51.2%) | 78 (51.0%) |
| 3 Vehicles | 31 (24.0%) | 27 (17.6%) |
| 4 Vehicles | 20 (15.5%) | 30 (19.6%) |
| 5 or more Vehicles | 0 (0.0%) | 0 (0.0%) |
| Total | 129 (100.0%) | 153 (100.0%) |
Commute Time in Mammoth
The most frequently occuring commute durations in Mammoth are 15 to 19 minutes (59 commuters, 21.2%), 40 to 44 minutes (35 commuters, 12.6%), and 45 to 59 minutes (32 commuters, 11.5%).
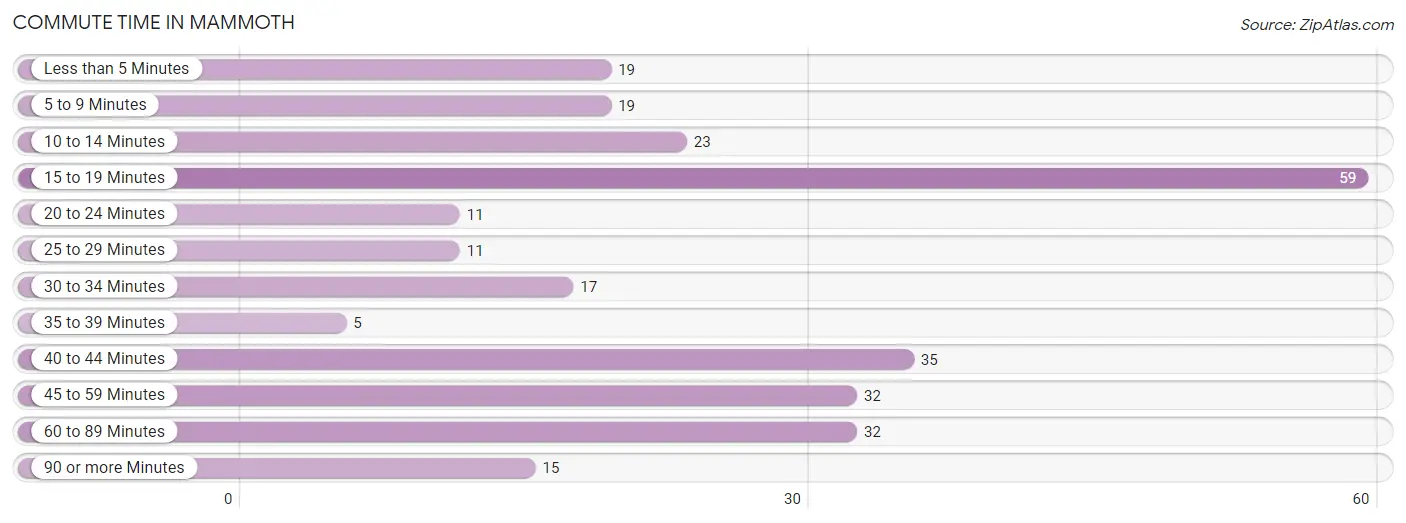
| Commute Time | # Commuters | % Commuters |
| Less than 5 Minutes | 19 | 6.8% |
| 5 to 9 Minutes | 19 | 6.8% |
| 10 to 14 Minutes | 23 | 8.3% |
| 15 to 19 Minutes | 59 | 21.2% |
| 20 to 24 Minutes | 11 | 4.0% |
| 25 to 29 Minutes | 11 | 4.0% |
| 30 to 34 Minutes | 17 | 6.1% |
| 35 to 39 Minutes | 5 | 1.8% |
| 40 to 44 Minutes | 35 | 12.6% |
| 45 to 59 Minutes | 32 | 11.5% |
| 60 to 89 Minutes | 32 | 11.5% |
| 90 or more Minutes | 15 | 5.4% |
Commute Time by Sex in Mammoth
The most common commute times in Mammoth are 60 to 89 minutes (28 commuters, 22.4%) for males and 15 to 19 minutes (52 commuters, 34.0%) for females.
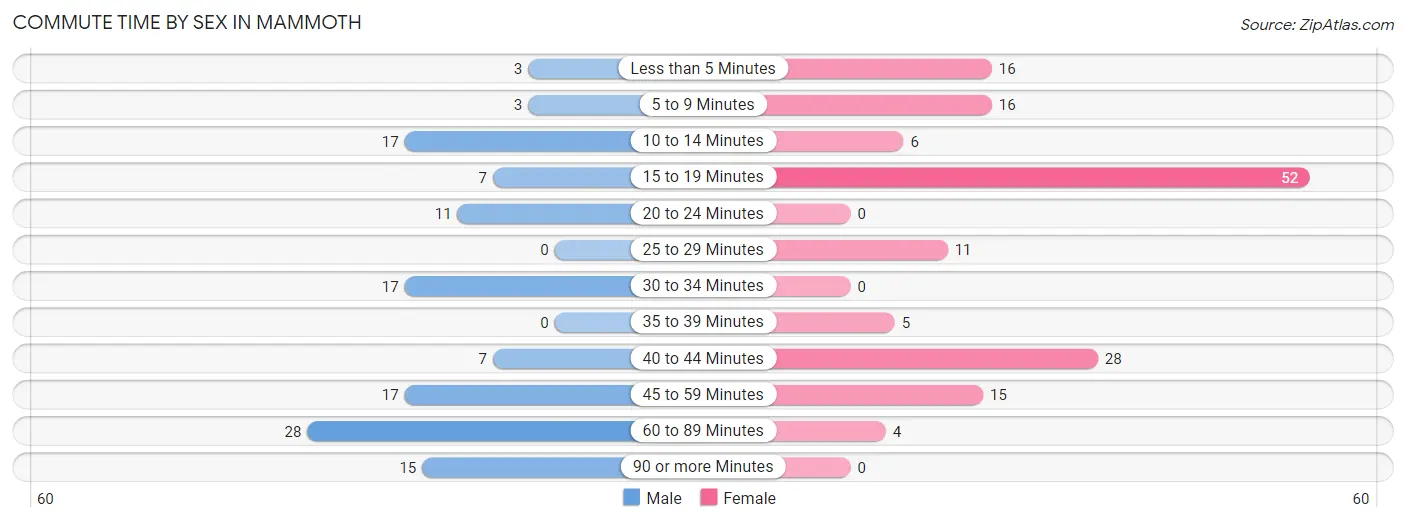
| Commute Time | Male | Female |
| Less than 5 Minutes | 3 (2.4%) | 16 (10.5%) |
| 5 to 9 Minutes | 3 (2.4%) | 16 (10.5%) |
| 10 to 14 Minutes | 17 (13.6%) | 6 (3.9%) |
| 15 to 19 Minutes | 7 (5.6%) | 52 (34.0%) |
| 20 to 24 Minutes | 11 (8.8%) | 0 (0.0%) |
| 25 to 29 Minutes | 0 (0.0%) | 11 (7.2%) |
| 30 to 34 Minutes | 17 (13.6%) | 0 (0.0%) |
| 35 to 39 Minutes | 0 (0.0%) | 5 (3.3%) |
| 40 to 44 Minutes | 7 (5.6%) | 28 (18.3%) |
| 45 to 59 Minutes | 17 (13.6%) | 15 (9.8%) |
| 60 to 89 Minutes | 28 (22.4%) | 4 (2.6%) |
| 90 or more Minutes | 15 (12.0%) | 0 (0.0%) |
Time of Departure to Work by Sex in Mammoth
The most frequent times of departure to work in Mammoth are 6:00 AM to 6:29 AM (63, 50.4%) for males and 6:00 AM to 6:29 AM (31, 20.3%) for females.
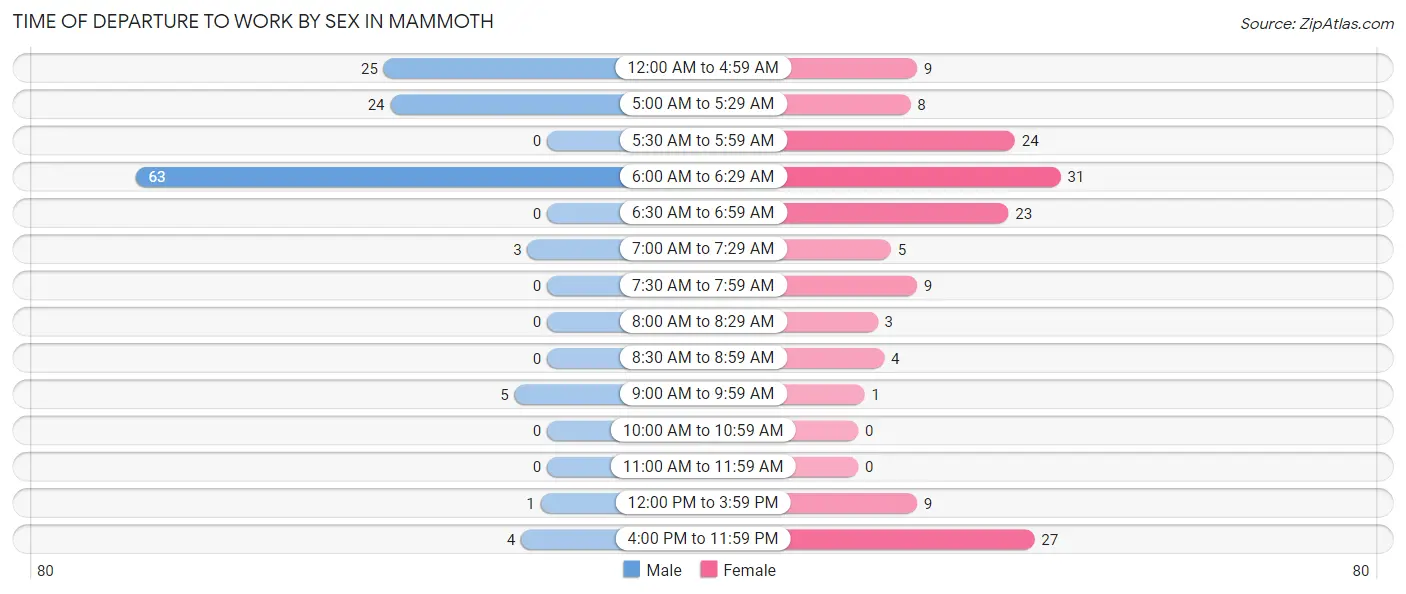
| Time of Departure | Male | Female |
| 12:00 AM to 4:59 AM | 25 (20.0%) | 9 (5.9%) |
| 5:00 AM to 5:29 AM | 24 (19.2%) | 8 (5.2%) |
| 5:30 AM to 5:59 AM | 0 (0.0%) | 24 (15.7%) |
| 6:00 AM to 6:29 AM | 63 (50.4%) | 31 (20.3%) |
| 6:30 AM to 6:59 AM | 0 (0.0%) | 23 (15.0%) |
| 7:00 AM to 7:29 AM | 3 (2.4%) | 5 (3.3%) |
| 7:30 AM to 7:59 AM | 0 (0.0%) | 9 (5.9%) |
| 8:00 AM to 8:29 AM | 0 (0.0%) | 3 (2.0%) |
| 8:30 AM to 8:59 AM | 0 (0.0%) | 4 (2.6%) |
| 9:00 AM to 9:59 AM | 5 (4.0%) | 1 (0.6%) |
| 10:00 AM to 10:59 AM | 0 (0.0%) | 0 (0.0%) |
| 11:00 AM to 11:59 AM | 0 (0.0%) | 0 (0.0%) |
| 12:00 PM to 3:59 PM | 1 (0.8%) | 9 (5.9%) |
| 4:00 PM to 11:59 PM | 4 (3.2%) | 27 (17.6%) |
| Total | 125 (100.0%) | 153 (100.0%) |
Housing Occupancy in Mammoth
Occupancy by Ownership in Mammoth
Of the total 431 dwellings in Mammoth, owner-occupied units account for 323 (74.9%), while renter-occupied units make up 108 (25.1%).
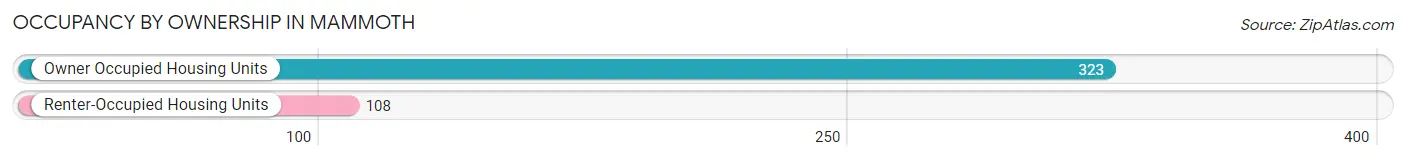
| Occupancy | # Housing Units | % Housing Units |
| Owner Occupied Housing Units | 323 | 74.9% |
| Renter-Occupied Housing Units | 108 | 25.1% |
| Total Occupied Housing Units | 431 | 100.0% |
Occupancy by Household Size in Mammoth
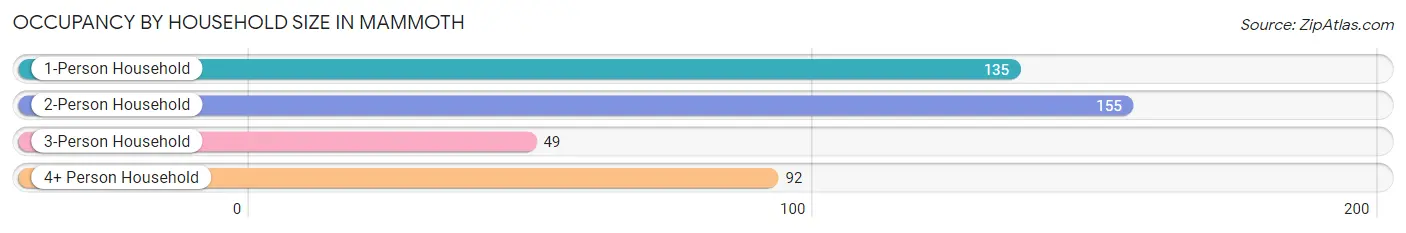
| Household Size | # Housing Units | % Housing Units |
| 1-Person Household | 135 | 31.3% |
| 2-Person Household | 155 | 36.0% |
| 3-Person Household | 49 | 11.4% |
| 4+ Person Household | 92 | 21.3% |
| Total Housing Units | 431 | 100.0% |
Occupancy by Ownership by Household Size in Mammoth
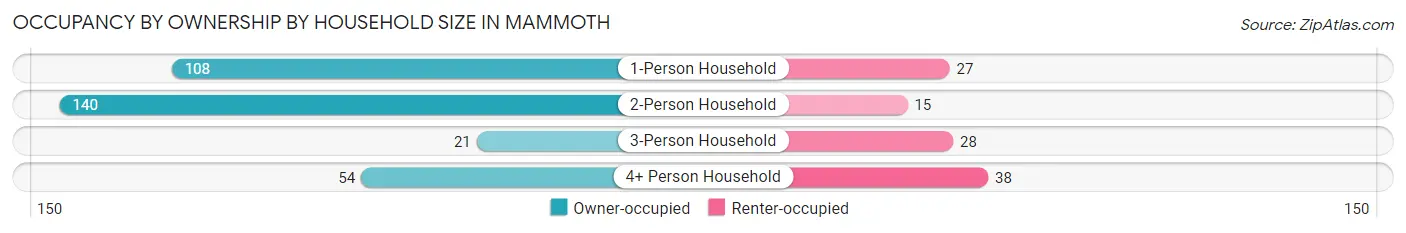
| Household Size | Owner-occupied | Renter-occupied |
| 1-Person Household | 108 (80.0%) | 27 (20.0%) |
| 2-Person Household | 140 (90.3%) | 15 (9.7%) |
| 3-Person Household | 21 (42.9%) | 28 (57.1%) |
| 4+ Person Household | 54 (58.7%) | 38 (41.3%) |
| Total Housing Units | 323 (74.9%) | 108 (25.1%) |
Occupancy by Educational Attainment in Mammoth
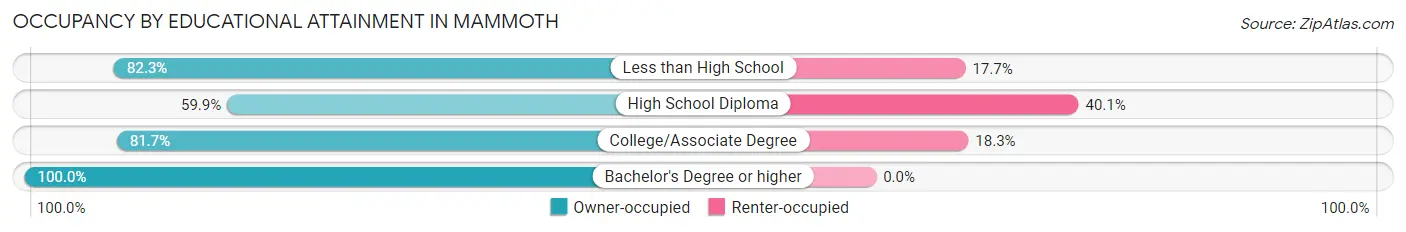
| Household Size | Owner-occupied | Renter-occupied |
| Less than High School | 79 (82.3%) | 17 (17.7%) |
| High School Diploma | 91 (59.9%) | 61 (40.1%) |
| College/Associate Degree | 134 (81.7%) | 30 (18.3%) |
| Bachelor's Degree or higher | 19 (100.0%) | 0 (0.0%) |
Occupancy by Age of Householder in Mammoth
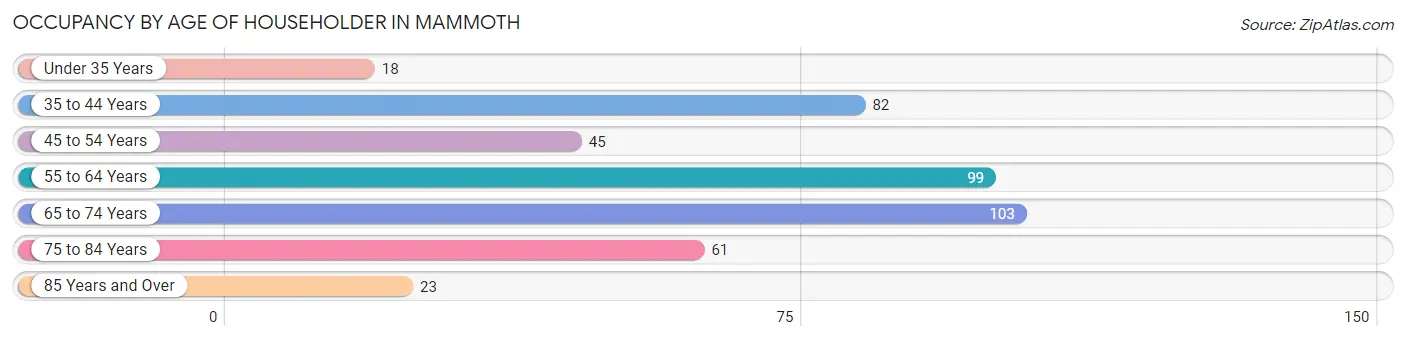
| Age Bracket | # Households | % Households |
| Under 35 Years | 18 | 4.2% |
| 35 to 44 Years | 82 | 19.0% |
| 45 to 54 Years | 45 | 10.4% |
| 55 to 64 Years | 99 | 23.0% |
| 65 to 74 Years | 103 | 23.9% |
| 75 to 84 Years | 61 | 14.1% |
| 85 Years and Over | 23 | 5.3% |
| Total | 431 | 100.0% |
Housing Finances in Mammoth
Median Income by Occupancy in Mammoth
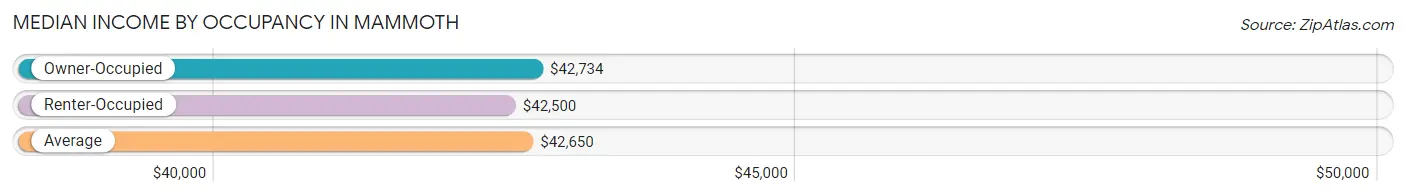
| Occupancy Type | # Households | Median Income |
| Owner-Occupied | 323 (74.9%) | $42,734 |
| Renter-Occupied | 108 (25.1%) | $42,500 |
| Average | 431 (100.0%) | $42,650 |
Occupancy by Householder Income Bracket in Mammoth
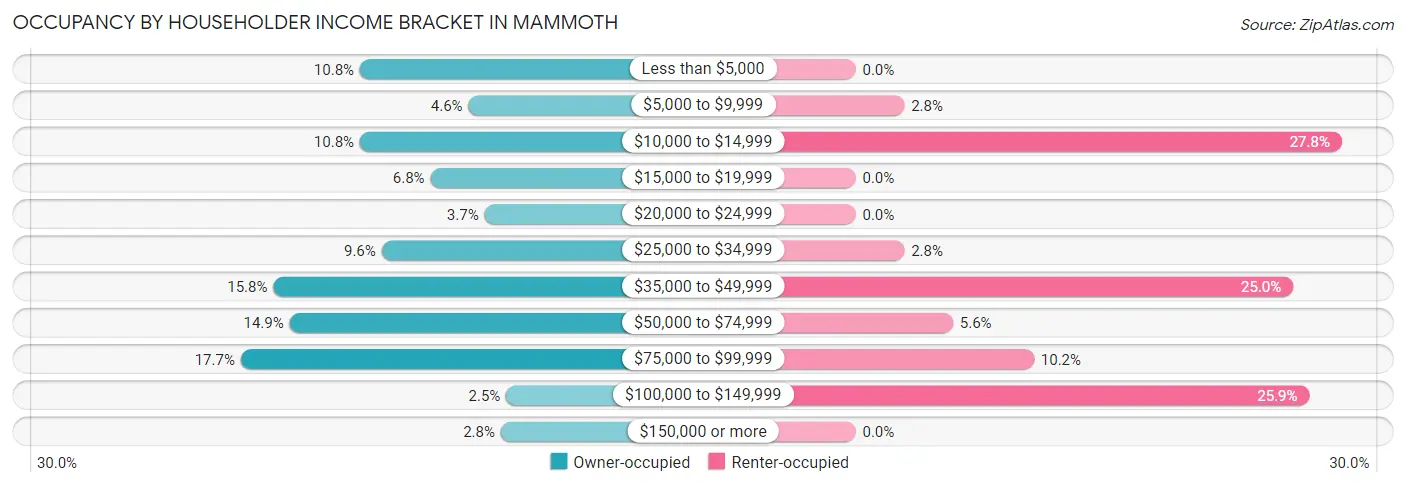
| Income Bracket | Owner-occupied | Renter-occupied |
| Less than $5,000 | 35 (10.8%) | 0 (0.0%) |
| $5,000 to $9,999 | 15 (4.6%) | 3 (2.8%) |
| $10,000 to $14,999 | 35 (10.8%) | 30 (27.8%) |
| $15,000 to $19,999 | 22 (6.8%) | 0 (0.0%) |
| $20,000 to $24,999 | 12 (3.7%) | 0 (0.0%) |
| $25,000 to $34,999 | 31 (9.6%) | 3 (2.8%) |
| $35,000 to $49,999 | 51 (15.8%) | 27 (25.0%) |
| $50,000 to $74,999 | 48 (14.9%) | 6 (5.6%) |
| $75,000 to $99,999 | 57 (17.6%) | 11 (10.2%) |
| $100,000 to $149,999 | 8 (2.5%) | 28 (25.9%) |
| $150,000 or more | 9 (2.8%) | 0 (0.0%) |
| Total | 323 (100.0%) | 108 (100.0%) |
Monthly Housing Cost Tiers in Mammoth
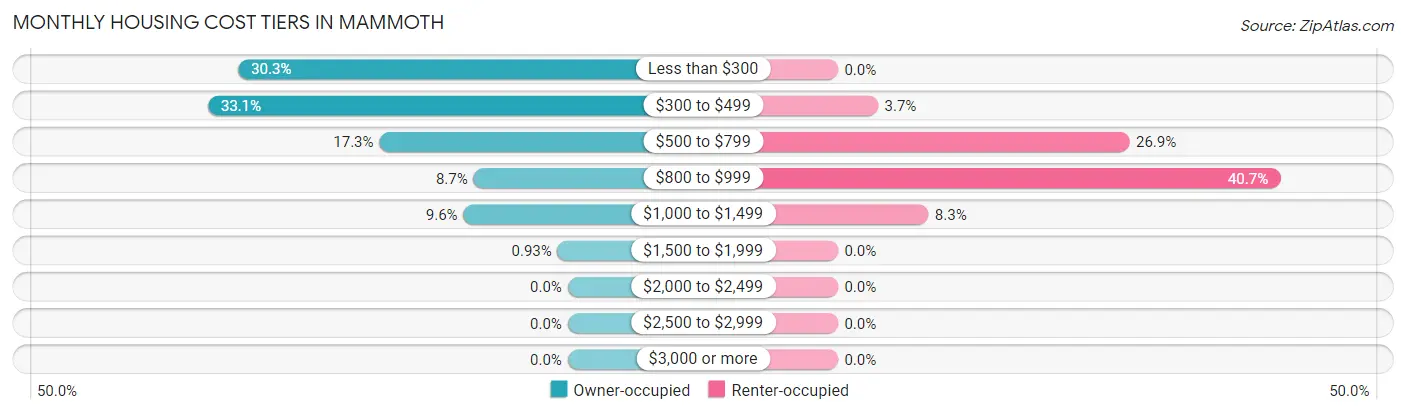
| Monthly Cost | Owner-occupied | Renter-occupied |
| Less than $300 | 98 (30.3%) | 0 (0.0%) |
| $300 to $499 | 107 (33.1%) | 4 (3.7%) |
| $500 to $799 | 56 (17.3%) | 29 (26.9%) |
| $800 to $999 | 28 (8.7%) | 44 (40.7%) |
| $1,000 to $1,499 | 31 (9.6%) | 9 (8.3%) |
| $1,500 to $1,999 | 3 (0.9%) | 0 (0.0%) |
| $2,000 to $2,499 | 0 (0.0%) | 0 (0.0%) |
| $2,500 to $2,999 | 0 (0.0%) | 0 (0.0%) |
| $3,000 or more | 0 (0.0%) | 0 (0.0%) |
| Total | 323 (100.0%) | 108 (100.0%) |
Physical Housing Characteristics in Mammoth
Housing Structures in Mammoth
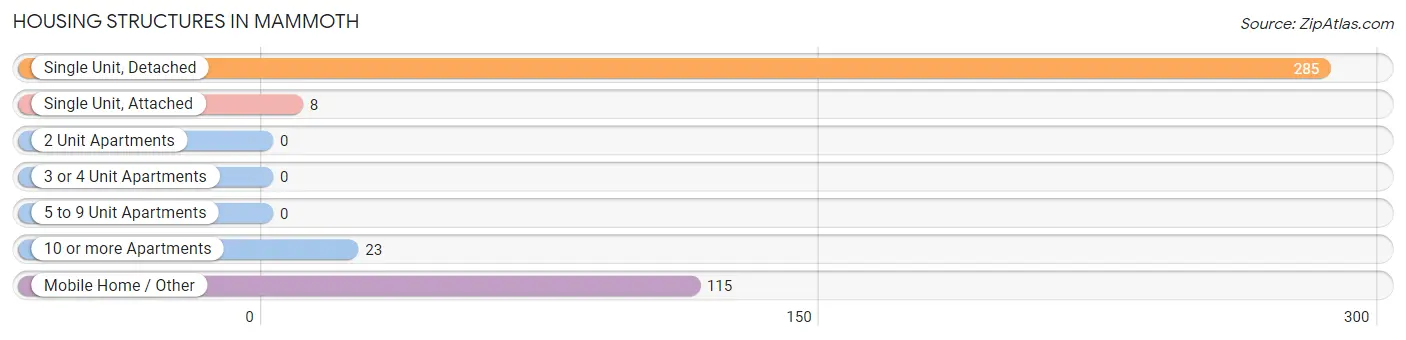
| Structure Type | # Housing Units | % Housing Units |
| Single Unit, Detached | 285 | 66.1% |
| Single Unit, Attached | 8 | 1.9% |
| 2 Unit Apartments | 0 | 0.0% |
| 3 or 4 Unit Apartments | 0 | 0.0% |
| 5 to 9 Unit Apartments | 0 | 0.0% |
| 10 or more Apartments | 23 | 5.3% |
| Mobile Home / Other | 115 | 26.7% |
| Total | 431 | 100.0% |
Housing Structures by Occupancy in Mammoth
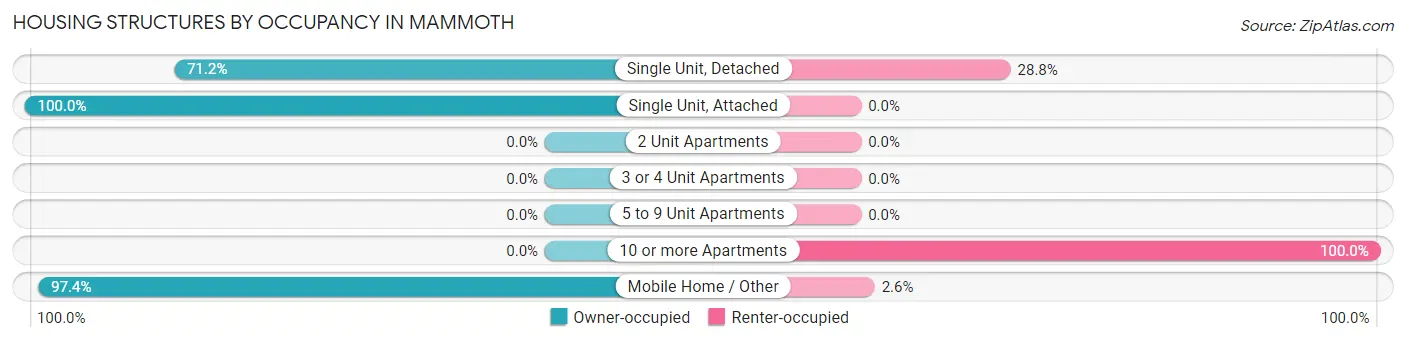
| Structure Type | Owner-occupied | Renter-occupied |
| Single Unit, Detached | 203 (71.2%) | 82 (28.8%) |
| Single Unit, Attached | 8 (100.0%) | 0 (0.0%) |
| 2 Unit Apartments | 0 (0.0%) | 0 (0.0%) |
| 3 or 4 Unit Apartments | 0 (0.0%) | 0 (0.0%) |
| 5 to 9 Unit Apartments | 0 (0.0%) | 0 (0.0%) |
| 10 or more Apartments | 0 (0.0%) | 23 (100.0%) |
| Mobile Home / Other | 112 (97.4%) | 3 (2.6%) |
| Total | 323 (74.9%) | 108 (25.1%) |
Housing Structures by Number of Rooms in Mammoth
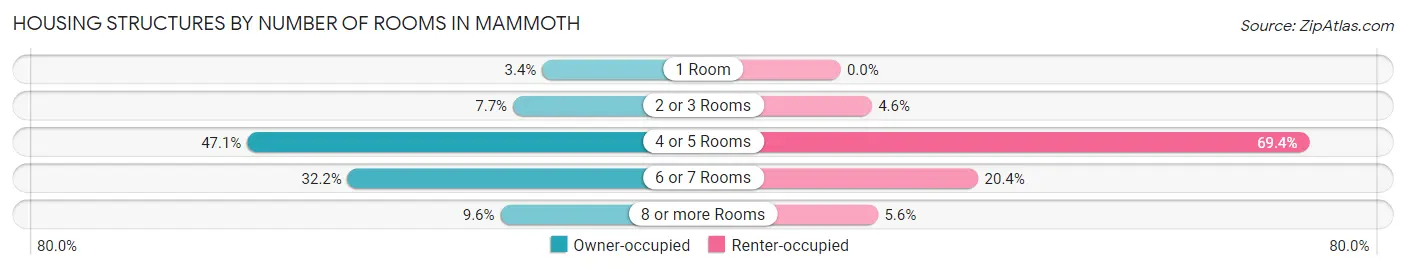
| Number of Rooms | Owner-occupied | Renter-occupied |
| 1 Room | 11 (3.4%) | 0 (0.0%) |
| 2 or 3 Rooms | 25 (7.7%) | 5 (4.6%) |
| 4 or 5 Rooms | 152 (47.1%) | 75 (69.4%) |
| 6 or 7 Rooms | 104 (32.2%) | 22 (20.4%) |
| 8 or more Rooms | 31 (9.6%) | 6 (5.6%) |
| Total | 323 (100.0%) | 108 (100.0%) |
Housing Structure by Heating Type in Mammoth
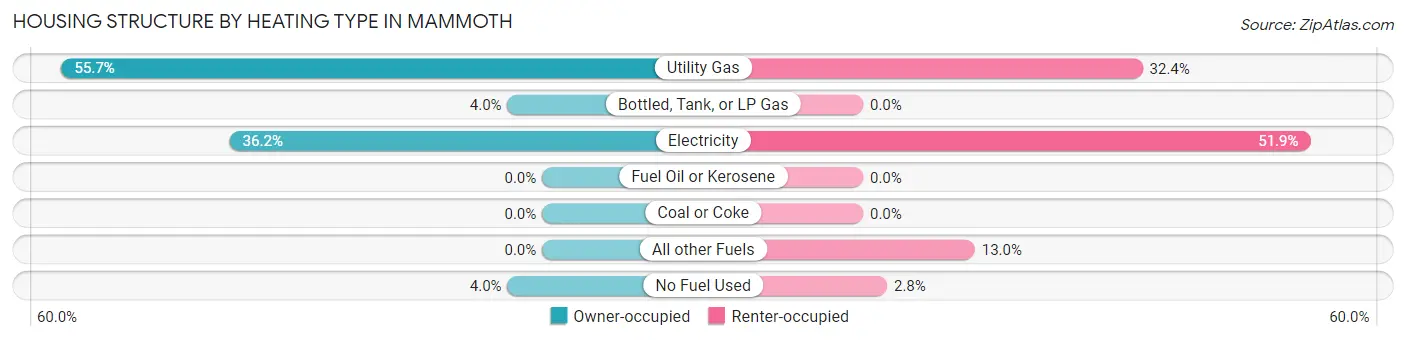
| Heating Type | Owner-occupied | Renter-occupied |
| Utility Gas | 180 (55.7%) | 35 (32.4%) |
| Bottled, Tank, or LP Gas | 13 (4.0%) | 0 (0.0%) |
| Electricity | 117 (36.2%) | 56 (51.8%) |
| Fuel Oil or Kerosene | 0 (0.0%) | 0 (0.0%) |
| Coal or Coke | 0 (0.0%) | 0 (0.0%) |
| All other Fuels | 0 (0.0%) | 14 (13.0%) |
| No Fuel Used | 13 (4.0%) | 3 (2.8%) |
| Total | 323 (100.0%) | 108 (100.0%) |
Household Vehicle Usage in Mammoth
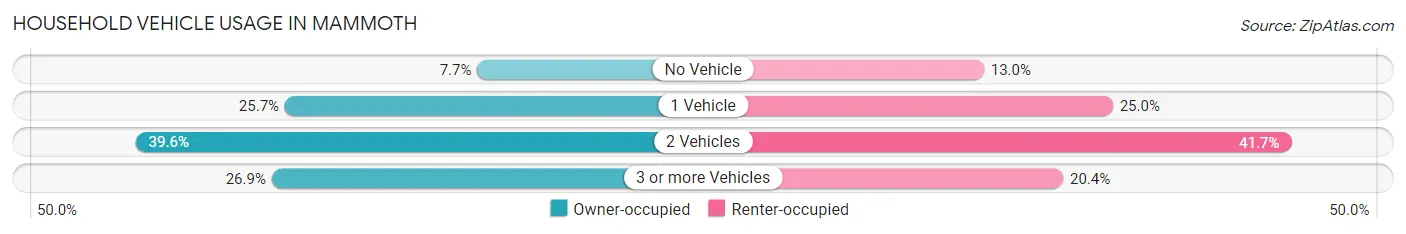
| Vehicles per Household | Owner-occupied | Renter-occupied |
| No Vehicle | 25 (7.7%) | 14 (13.0%) |
| 1 Vehicle | 83 (25.7%) | 27 (25.0%) |
| 2 Vehicles | 128 (39.6%) | 45 (41.7%) |
| 3 or more Vehicles | 87 (26.9%) | 22 (20.4%) |
| Total | 323 (100.0%) | 108 (100.0%) |
Real Estate & Mortgages in Mammoth
Real Estate and Mortgage Overview in Mammoth
| Characteristic | Without Mortgage | With Mortgage |
| Housing Units | 205 | 118 |
| Median Property Value | $60,600 | $103,200 |
| Median Household Income | $40,893 | $5 |
| Monthly Housing Costs | $318 | $0 |
| Real Estate Taxes | $397 | $5 |
Property Value by Mortgage Status in Mammoth
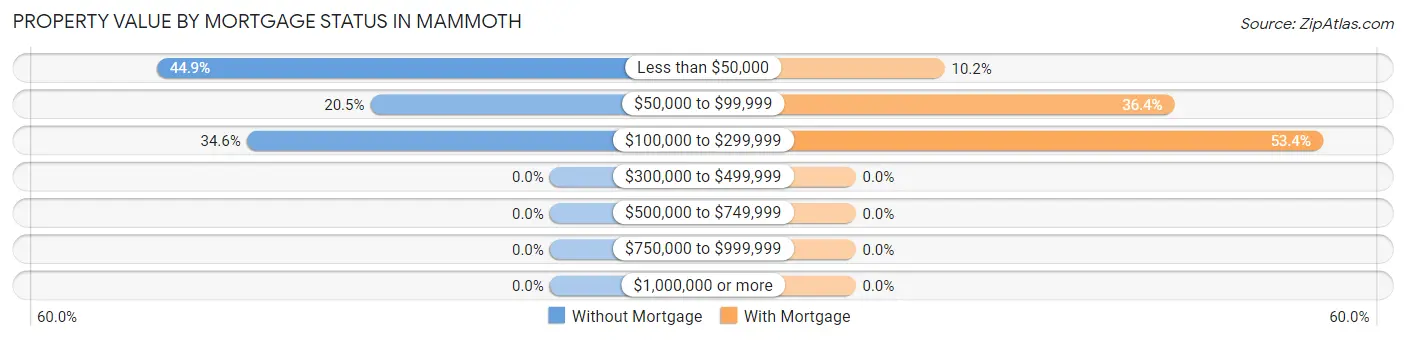
| Property Value | Without Mortgage | With Mortgage |
| Less than $50,000 | 92 (44.9%) | 12 (10.2%) |
| $50,000 to $99,999 | 42 (20.5%) | 43 (36.4%) |
| $100,000 to $299,999 | 71 (34.6%) | 63 (53.4%) |
| $300,000 to $499,999 | 0 (0.0%) | 0 (0.0%) |
| $500,000 to $749,999 | 0 (0.0%) | 0 (0.0%) |
| $750,000 to $999,999 | 0 (0.0%) | 0 (0.0%) |
| $1,000,000 or more | 0 (0.0%) | 0 (0.0%) |
| Total | 205 (100.0%) | 118 (100.0%) |
Household Income by Mortgage Status in Mammoth
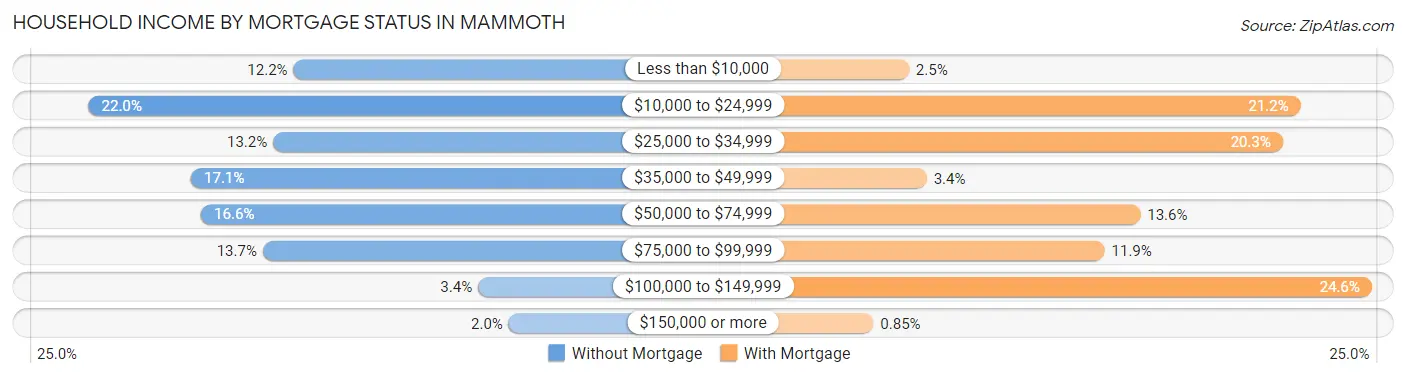
| Household Income | Without Mortgage | With Mortgage |
| Less than $10,000 | 25 (12.2%) | 3 (2.5%) |
| $10,000 to $24,999 | 45 (22.0%) | 25 (21.2%) |
| $25,000 to $34,999 | 27 (13.2%) | 24 (20.3%) |
| $35,000 to $49,999 | 35 (17.1%) | 4 (3.4%) |
| $50,000 to $74,999 | 34 (16.6%) | 16 (13.6%) |
| $75,000 to $99,999 | 28 (13.7%) | 14 (11.9%) |
| $100,000 to $149,999 | 7 (3.4%) | 29 (24.6%) |
| $150,000 or more | 4 (1.9%) | 1 (0.9%) |
| Total | 205 (100.0%) | 118 (100.0%) |
Property Value to Household Income Ratio in Mammoth
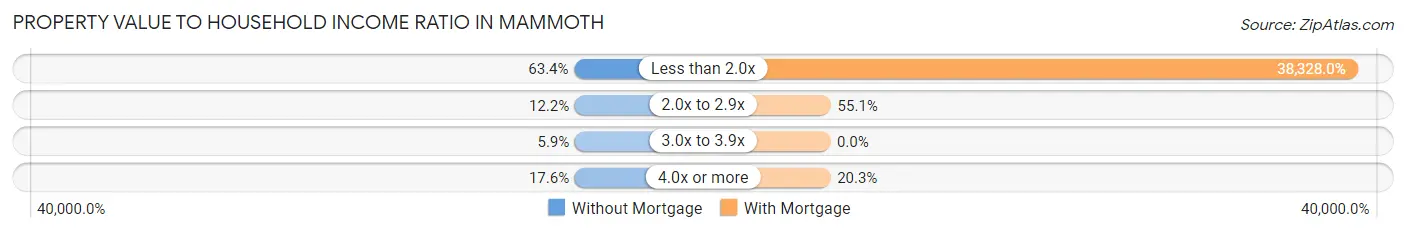
| Value-to-Income Ratio | Without Mortgage | With Mortgage |
| Less than 2.0x | 130 (63.4%) | 45,227 (38,328.0%) |
| 2.0x to 2.9x | 25 (12.2%) | 65 (55.1%) |
| 3.0x to 3.9x | 12 (5.9%) | 0 (0.0%) |
| 4.0x or more | 36 (17.6%) | 24 (20.3%) |
| Total | 205 (100.0%) | 118 (100.0%) |
Real Estate Taxes by Mortgage Status in Mammoth
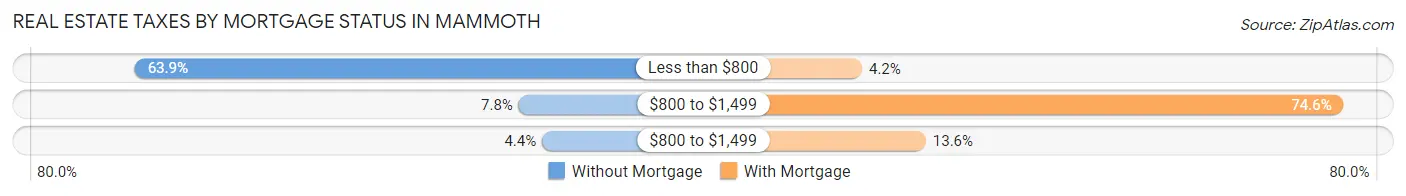
| Property Taxes | Without Mortgage | With Mortgage |
| Less than $800 | 131 (63.9%) | 5 (4.2%) |
| $800 to $1,499 | 16 (7.8%) | 88 (74.6%) |
| $800 to $1,499 | 9 (4.4%) | 16 (13.6%) |
| Total | 205 (100.0%) | 118 (100.0%) |
Health & Disability in Mammoth
Health Insurance Coverage by Age in Mammoth
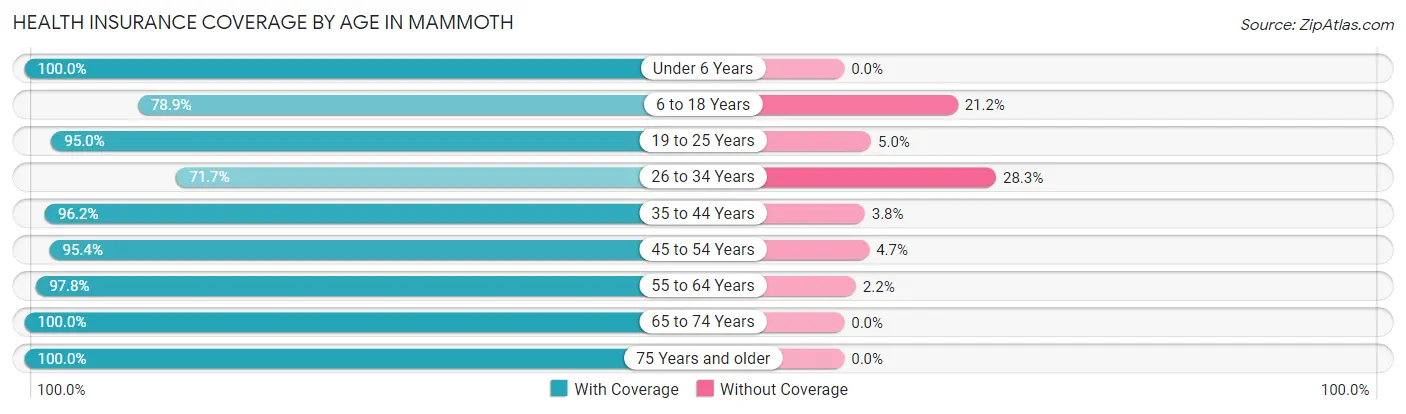
| Age Bracket | With Coverage | Without Coverage |
| Under 6 Years | 53 (100.0%) | 0 (0.0%) |
| 6 to 18 Years | 82 (78.8%) | 22 (21.1%) |
| 19 to 25 Years | 38 (95.0%) | 2 (5.0%) |
| 26 to 34 Years | 38 (71.7%) | 15 (28.3%) |
| 35 to 44 Years | 151 (96.2%) | 6 (3.8%) |
| 45 to 54 Years | 82 (95.4%) | 4 (4.6%) |
| 55 to 64 Years | 180 (97.8%) | 4 (2.2%) |
| 65 to 74 Years | 151 (100.0%) | 0 (0.0%) |
| 75 Years and older | 186 (100.0%) | 0 (0.0%) |
| Total | 961 (94.8%) | 53 (5.2%) |
Health Insurance Coverage by Citizenship Status in Mammoth
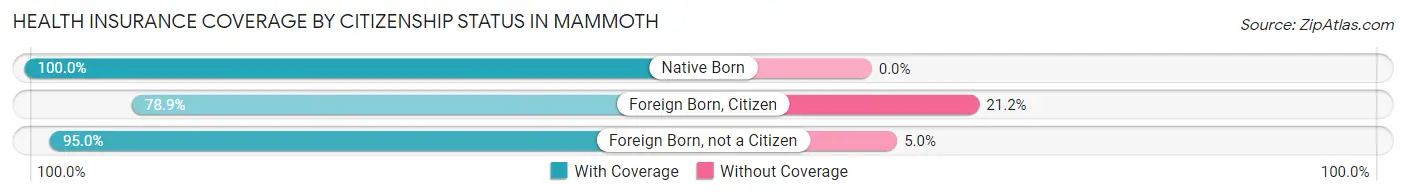
| Citizenship Status | With Coverage | Without Coverage |
| Native Born | 53 (100.0%) | 0 (0.0%) |
| Foreign Born, Citizen | 82 (78.8%) | 22 (21.1%) |
| Foreign Born, not a Citizen | 38 (95.0%) | 2 (5.0%) |
Health Insurance Coverage by Household Income in Mammoth
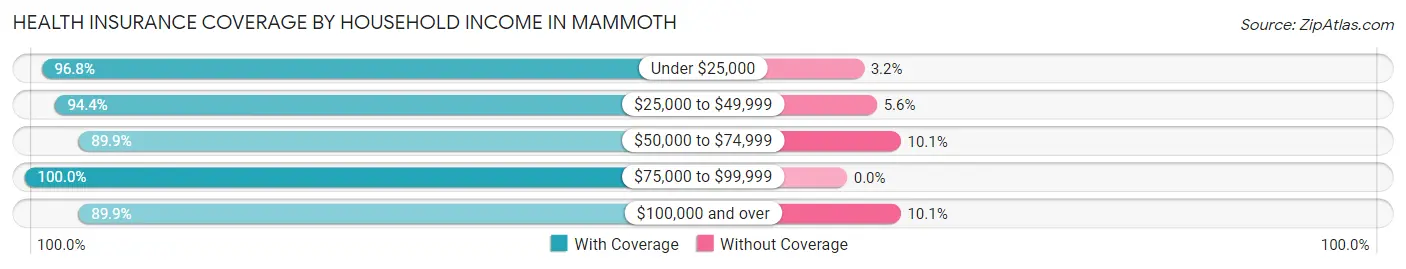
| Household Income | With Coverage | Without Coverage |
| Under $25,000 | 244 (96.8%) | 8 (3.2%) |
| $25,000 to $49,999 | 253 (94.4%) | 15 (5.6%) |
| $50,000 to $74,999 | 125 (89.9%) | 14 (10.1%) |
| $75,000 to $99,999 | 196 (100.0%) | 0 (0.0%) |
| $100,000 and over | 143 (89.9%) | 16 (10.1%) |
Public vs Private Health Insurance Coverage by Age in Mammoth
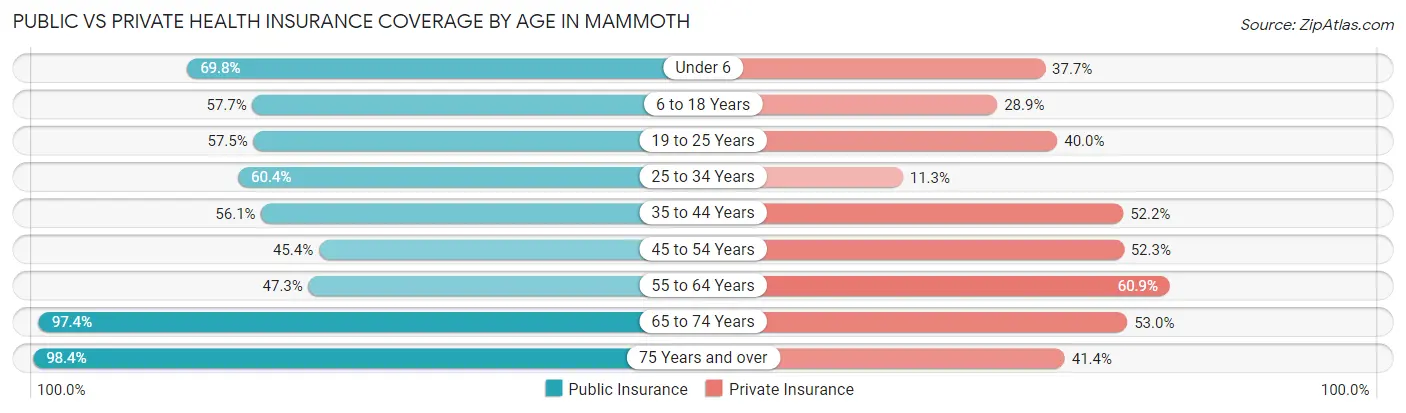
| Age Bracket | Public Insurance | Private Insurance |
| Under 6 | 37 (69.8%) | 20 (37.7%) |
| 6 to 18 Years | 60 (57.7%) | 30 (28.8%) |
| 19 to 25 Years | 23 (57.5%) | 16 (40.0%) |
| 25 to 34 Years | 32 (60.4%) | 6 (11.3%) |
| 35 to 44 Years | 88 (56.0%) | 82 (52.2%) |
| 45 to 54 Years | 39 (45.4%) | 45 (52.3%) |
| 55 to 64 Years | 87 (47.3%) | 112 (60.9%) |
| 65 to 74 Years | 147 (97.4%) | 80 (53.0%) |
| 75 Years and over | 183 (98.4%) | 77 (41.4%) |
| Total | 696 (68.6%) | 468 (46.2%) |
Disability Status by Sex by Age in Mammoth
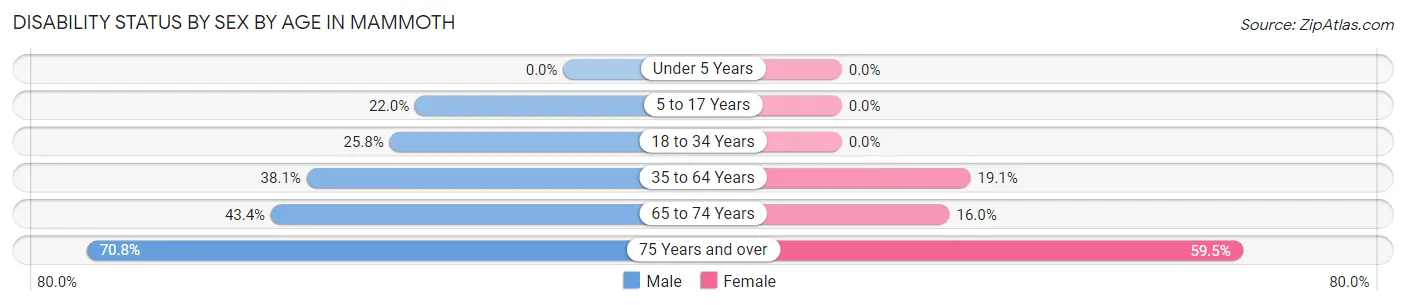
| Age Bracket | Male | Female |
| Under 5 Years | 0 (0.0%) | 0 (0.0%) |
| 5 to 17 Years | 13 (22.0%) | 0 (0.0%) |
| 18 to 34 Years | 8 (25.8%) | 0 (0.0%) |
| 35 to 64 Years | 85 (38.1%) | 39 (19.1%) |
| 65 to 74 Years | 33 (43.4%) | 12 (16.0%) |
| 75 Years and over | 46 (70.8%) | 72 (59.5%) |
Disability Class by Sex by Age in Mammoth
Disability Class: Hearing Difficulty
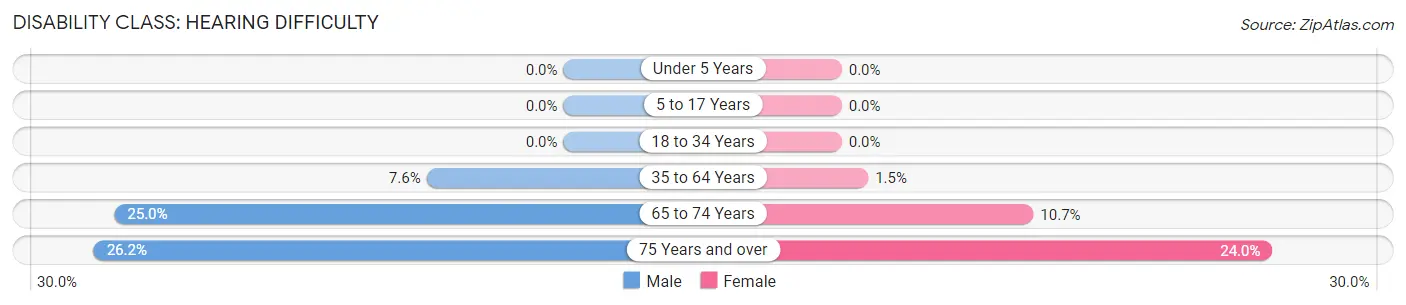
| Age Bracket | Male | Female |
| Under 5 Years | 0 (0.0%) | 0 (0.0%) |
| 5 to 17 Years | 0 (0.0%) | 0 (0.0%) |
| 18 to 34 Years | 0 (0.0%) | 0 (0.0%) |
| 35 to 64 Years | 17 (7.6%) | 3 (1.5%) |
| 65 to 74 Years | 19 (25.0%) | 8 (10.7%) |
| 75 Years and over | 17 (26.2%) | 29 (24.0%) |
Disability Class: Vision Difficulty
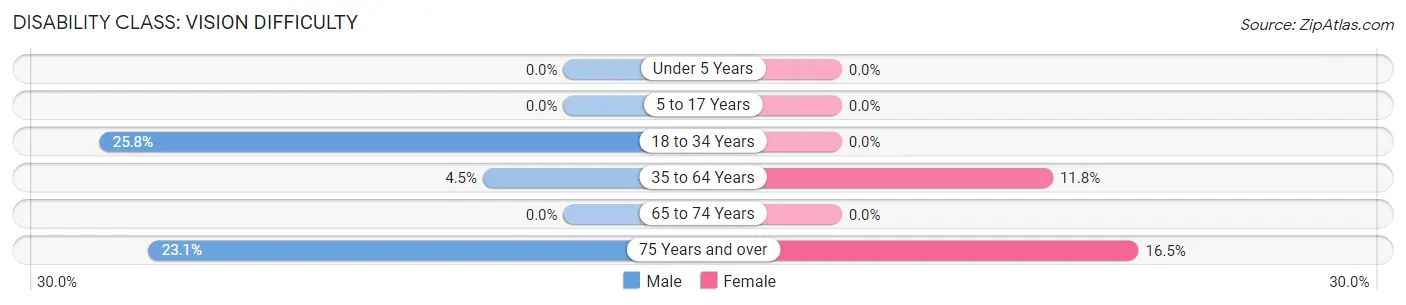
| Age Bracket | Male | Female |
| Under 5 Years | 0 (0.0%) | 0 (0.0%) |
| 5 to 17 Years | 0 (0.0%) | 0 (0.0%) |
| 18 to 34 Years | 8 (25.8%) | 0 (0.0%) |
| 35 to 64 Years | 10 (4.5%) | 24 (11.8%) |
| 65 to 74 Years | 0 (0.0%) | 0 (0.0%) |
| 75 Years and over | 15 (23.1%) | 20 (16.5%) |
Disability Class: Cognitive Difficulty
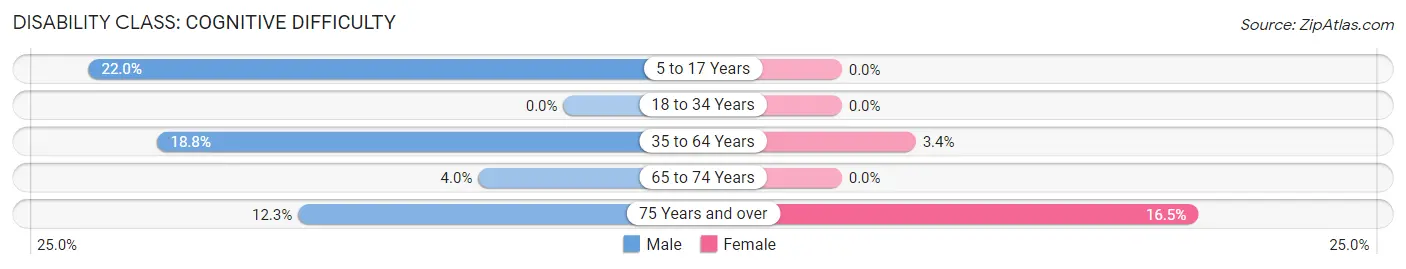
| Age Bracket | Male | Female |
| 5 to 17 Years | 13 (22.0%) | 0 (0.0%) |
| 18 to 34 Years | 0 (0.0%) | 0 (0.0%) |
| 35 to 64 Years | 42 (18.8%) | 7 (3.4%) |
| 65 to 74 Years | 3 (4.0%) | 0 (0.0%) |
| 75 Years and over | 8 (12.3%) | 20 (16.5%) |
Disability Class: Ambulatory Difficulty
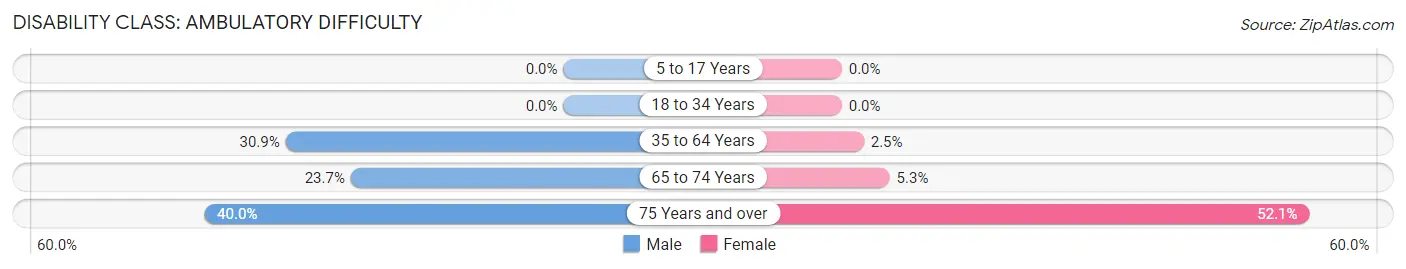
| Age Bracket | Male | Female |
| 5 to 17 Years | 0 (0.0%) | 0 (0.0%) |
| 18 to 34 Years | 0 (0.0%) | 0 (0.0%) |
| 35 to 64 Years | 69 (30.9%) | 5 (2.5%) |
| 65 to 74 Years | 18 (23.7%) | 4 (5.3%) |
| 75 Years and over | 26 (40.0%) | 63 (52.1%) |
Disability Class: Self-Care Difficulty
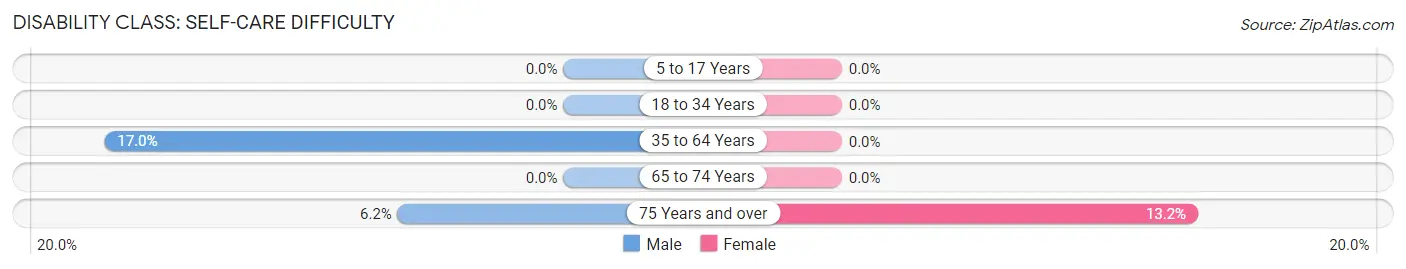
| Age Bracket | Male | Female |
| 5 to 17 Years | 0 (0.0%) | 0 (0.0%) |
| 18 to 34 Years | 0 (0.0%) | 0 (0.0%) |
| 35 to 64 Years | 38 (17.0%) | 0 (0.0%) |
| 65 to 74 Years | 0 (0.0%) | 0 (0.0%) |
| 75 Years and over | 4 (6.1%) | 16 (13.2%) |
Technology Access in Mammoth
Computing Device Access in Mammoth
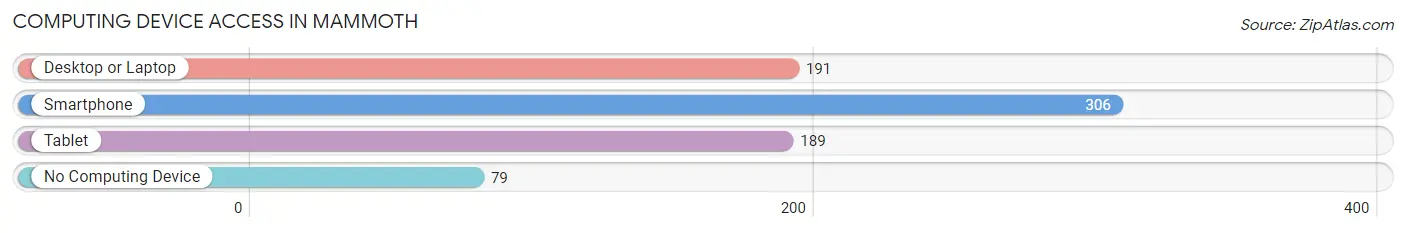
| Device Type | # Households | % Households |
| Desktop or Laptop | 191 | 44.3% |
| Smartphone | 306 | 71.0% |
| Tablet | 189 | 43.9% |
| No Computing Device | 79 | 18.3% |
| Total | 431 | 100.0% |
Internet Access in Mammoth
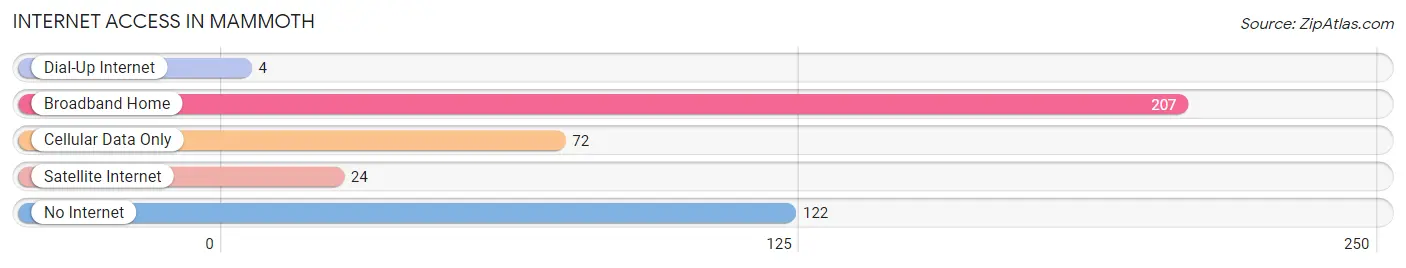
| Internet Type | # Households | % Households |
| Dial-Up Internet | 4 | 0.9% |
| Broadband Home | 207 | 48.0% |
| Cellular Data Only | 72 | 16.7% |
| Satellite Internet | 24 | 5.6% |
| No Internet | 122 | 28.3% |
| Total | 431 | 100.0% |
Mammoth Summary
Mammoth, Arizona is a small town located in the Gila River Valley of Pinal County, Arizona. It is situated about 60 miles southeast of Phoenix and is part of the Phoenix metropolitan area. The town was founded in 1878 and has a population of approximately 2,000 people.
History
Mammoth was founded in 1878 by a group of miners who were searching for gold in the nearby mountains. The town was named after the nearby Mammoth Mine, which was discovered in 1877. The mine was one of the most productive gold mines in the area and was the source of much of the town's early wealth.
The town grew rapidly in the late 19th century and by the early 20th century, it had become a bustling mining town with a population of over 1,000 people. The town was home to several saloons, stores, and other businesses.
In the early 20th century, the town began to decline as the gold mines began to run dry. By the 1950s, the population had dropped to just over 500 people. The town was nearly abandoned by the 1970s, but it has since seen a resurgence in population and is now home to over 2,000 people.
Geography
Mammoth is located in the Gila River Valley of Pinal County, Arizona. It is situated about 60 miles southeast of Phoenix and is part of the Phoenix metropolitan area. The town is located at an elevation of 2,400 feet and is surrounded by the Sonoran Desert.
The town is located in a region of Arizona known as the "Valley of the Sun" due to its hot, dry climate. The area is known for its mild winters and hot summers, with temperatures often reaching over 100 degrees Fahrenheit in the summer months.
Economy
Mammoth's economy is largely based on tourism and agriculture. The town is home to several tourist attractions, including the Mammoth Mine, which is now a museum, and the nearby Gila River, which is popular for fishing and boating.
Agriculture is also an important part of the local economy. The town is home to several farms and ranches, which produce a variety of crops, including cotton, alfalfa, and hay.
Demographics
As of the 2010 census, the population of Mammoth was 2,000 people. The town is predominantly white, with over 90% of the population identifying as Caucasian. The town also has a small Hispanic population, with about 8% of the population identifying as Hispanic or Latino.
The median household income in Mammoth is $41,000, which is slightly lower than the national average. The town has a poverty rate of about 15%, which is slightly higher than the national average.
Conclusion
Mammoth, Arizona is a small town located in the Gila River Valley of Pinal County, Arizona. It was founded in 1878 and has a population of approximately 2,000 people. The town's economy is largely based on tourism and agriculture, and it is home to several tourist attractions and farms. The town is predominantly white, with over 90% of the population identifying as Caucasian. The median household income in Mammoth is $41,000, and the town has a poverty rate of about 15%.
Common Questions
What is Per Capita Income in Mammoth?
Per Capita income in Mammoth is $21,101.
What is the Median Family Income in Mammoth?
Median Family Income in Mammoth is $61,250.
What is the Median Household income in Mammoth?
Median Household Income in Mammoth is $42,650.
What is Inequality or Gini Index in Mammoth?
Inequality or Gini Index in Mammoth is 0.44.
What is the Total Population of Mammoth?
Total Population of Mammoth is 1,014.
What is the Total Male Population of Mammoth?
Total Male Population of Mammoth is 477.
What is the Total Female Population of Mammoth?
Total Female Population of Mammoth is 537.
What is the Ratio of Males per 100 Females in Mammoth?
There are 88.83 Males per 100 Females in Mammoth.
What is the Ratio of Females per 100 Males in Mammoth?
There are 112.58 Females per 100 Males in Mammoth.
What is the Median Population Age in Mammoth?
Median Population Age in Mammoth is 56.9 Years.
What is the Average Family Size in Mammoth
Average Family Size in Mammoth is 2.9 People.
What is the Average Household Size in Mammoth
Average Household Size in Mammoth is 2.4 People.
How Large is the Labor Force in Mammoth?
There are 354 People in the Labor Forcein in Mammoth.
What is the Percentage of People in the Labor Force in Mammoth?
40.4% of People are in the Labor Force in Mammoth.
What is the Unemployment Rate in Mammoth?
Unemployment Rate in Mammoth is 17.2%.