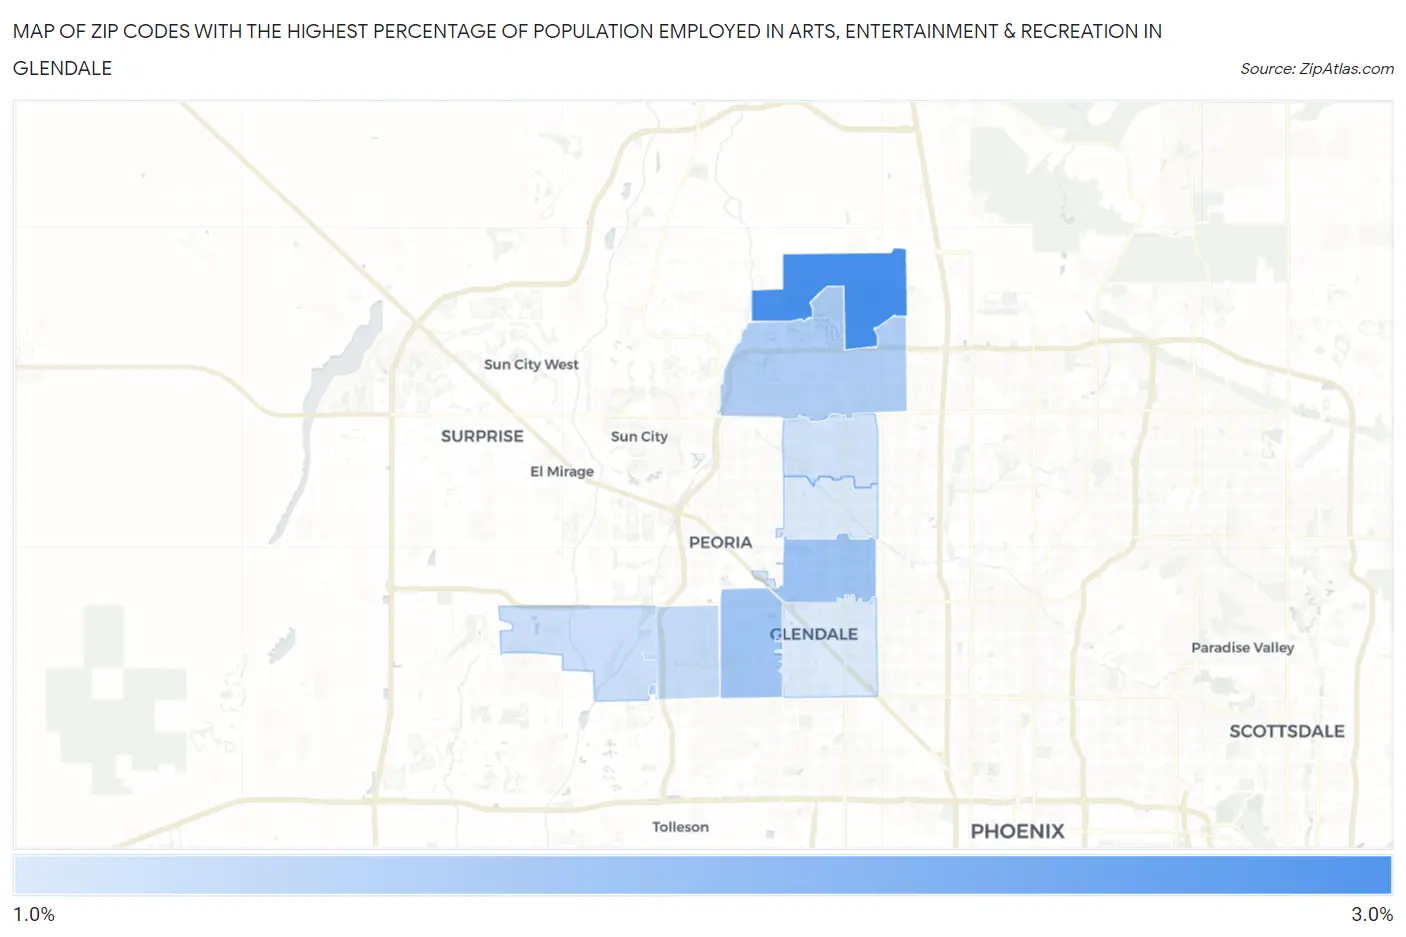
Zip Codes with the Highest Percentage of Population Employed in Arts, Entertainment & Recreation in Glendale, AZ
RELATED REPORTS & OPTIONS
Arts, Entertainment & Recreation
Glendale
Compare Zip Codes
Map of Zip Codes with the Highest Percentage of Population Employed in Arts, Entertainment & Recreation in Glendale
0.0%
3.0%
Zip Codes with the Highest Percentage of Population Employed in Arts, Entertainment & Recreation in Glendale, AZ
| Zip Code | % Employed | vs State | vs National | |
| 1. | 85310 | 2.7% | 2.3%(+0.398)#122 | 2.1%(+0.626)#6,325 |
| 2. | 85302 | 1.8% | 2.3%(-0.534)#208 | 2.1%(-0.306)#11,188 |
| 3. | 85303 | 1.7% | 2.3%(-0.562)#210 | 2.1%(-0.334)#11,387 |
| 4. | 85308 | 1.6% | 2.3%(-0.712)#225 | 2.1%(-0.484)#12,470 |
| 5. | 85305 | 1.4% | 2.3%(-0.933)#253 | 2.1%(-0.706)#14,156 |
| 6. | 85307 | 1.3% | 2.3%(-1.01)#263 | 2.1%(-0.785)#14,732 |
| 7. | 85306 | 1.2% | 2.3%(-1.06)#268 | 2.1%(-0.837)#15,139 |
| 8. | 85301 | 1.1% | 2.3%(-1.19)#275 | 2.1%(-0.961)#16,072 |
| 9. | 85304 | 1.1% | 2.3%(-1.20)#276 | 2.1%(-0.968)#16,124 |
1
Common Questions
What are the Top 5 Zip Codes with the Highest Percentage of Population Employed in Arts, Entertainment & Recreation in Glendale, AZ?
Top 5 Zip Codes with the Highest Percentage of Population Employed in Arts, Entertainment & Recreation in Glendale, AZ are:
What zip code has the Highest Percentage of Population Employed in Arts, Entertainment & Recreation in Glendale, AZ?
85310 has the Highest Percentage of Population Employed in Arts, Entertainment & Recreation in Glendale, AZ with 2.7%.
What is the Percentage of Population Employed in Arts, Entertainment & Recreation in Glendale, AZ?
Percentage of Population Employed in Arts, Entertainment & Recreation in Glendale is 1.4%.
What is the Percentage of Population Employed in Arts, Entertainment & Recreation in Arizona?
Percentage of Population Employed in Arts, Entertainment & Recreation in Arizona is 2.3%.
What is the Percentage of Population Employed in Arts, Entertainment & Recreation in the United States?
Percentage of Population Employed in Arts, Entertainment & Recreation in the United States is 2.1%.